Attached files
| file | filename |
|---|---|
| EX-32 - EX-32 - OMNIVISION TECHNOLOGIES INC | a2204638zex-32.htm |
| EX-21.1 - EX-21.1 - OMNIVISION TECHNOLOGIES INC | a2204638zex-21_1.htm |
| EX-23.1 - EX-23.1 - OMNIVISION TECHNOLOGIES INC | a2204638zex-23_1.htm |
| EX-31.1 - EX-31.1 - OMNIVISION TECHNOLOGIES INC | a2204638zex-31_1.htm |
| EX-31.2 - EX-31.2 - OMNIVISION TECHNOLOGIES INC | a2204638zex-31_2.htm |
Use these links to rapidly review the document
TABLE OF CONTENTS
ITEM 8. FINANCIAL STATEMENTS AND SUPPLEMENTARY DATA
UNITED STATES
SECURITIES AND EXCHANGE COMMISSION
Washington, D.C. 20549
FORM 10-K
| (Mark One) | ||
ý |
ANNUAL REPORT PURSUANT TO SECTION 13 OR 15(d) OF THE SECURITIES EXCHANGE ACT OF 1934 |
|
For the fiscal year ended April 30, 2011 |
||
o |
TRANSITION REPORT PURSUANT TO SECTION 13 OR 15(d) OF THE SECURITIES EXCHANGE ACT OF 1934 |
|
For the transition period from to |
||
Commission file number: 0-29939 |
||
OMNIVISION TECHNOLOGIES, INC.
(Exact name of registrant as specified in its charter)
| Delaware | 77-0401990 | |
| (State or other jurisdiction of incorporation or organization) |
(I.R.S. Employer Identification Number) |
|
4275 Burton Drive, Santa Clara, California 95054 (Address of principal executive offices) (Zip Code) |
||
Registrant's telephone number, including area code: (408) 567-3000 |
||
Securities registered pursuant to Section 12(b) of the Act:
| Title of each class | Name of each exchange on which registered | |
|---|---|---|
| Common Stock, $0.001 par value (Including associated Preferred Stock Purchase Rights) |
The Nasdaq Stock Market LLC (Nasdaq Global Market) |
Securities registered pursuant to Section 12(g) of the Act: None
Indicate by check mark if the registrant is a well-known seasoned issuer, as defined in Rule 405 of the Securities Act. Yes ý No o
Indicate by check mark if the registrant is not required to file reports pursuant to Section 13 or Section 15(d) of the Act. Yes o No ý
Indicate by check mark whether the registrant (1) has filed all reports required to be filed by Section 13 or 15(d) of the Securities Exchange Act of 1934 during the preceding 12 months (or for such shorter period that the Registrant was required to file such reports), and (2) has been subject to such filing requirements for the past 90 days. Yes ý No o
Indicate by check mark whether the registrant has submitted electronically and posted on its corporate Web site, if any, every Interactive Data File required to be submitted and posted pursuant to Rule 405 of Regulation S-T (§232.405 of this chapter) during the preceding 12 months (or for such shorter period that the registrant was required to submit and post such files). Yes o No o
Indicate by check mark if disclosure of delinquent filers pursuant to Item 405 of Regulation S-K (§ 229.405 of this chapter) is not contained herein, and will not be contained, to the best of the Registrant's knowledge, in definitive proxy or information statements incorporated by reference in Part III of this Form 10-K or any amendment to this Form 10-K. o
Indicate by check mark whether the registrant is a large accelerated filer, an accelerated filer, a non-accelerated filer, or a smaller reporting company. See the definitions of "large accelerated filer," "accelerated filer" and "smaller reporting company" in Rule 12b-2 of the Exchange Act.
| Large accelerated filer ý | Accelerated filer o | Non-accelerated filer o (Do not check if a smaller reporting company) |
Smaller reporting company o |
Indicate by check mark whether the registrant is a shell company (as defined in Rule 12b-2 of the Exchange Act). Yes o No ý
As of October 31, 2010, the last business day of Registrant's most recently completed second fiscal quarter, there were 45,974,265 shares of Registrant's common stock outstanding, and the aggregate market value of such shares held by non-affiliates of registrant (based upon the closing sale price of such shares on the NASDAQ Global Market on October 31, 2010) was approximately $1.2 billion. Shares of Registrant's common stock held by the Registrant's executive `officers and directors and by each entity that owns five percent or more of Registrant's outstanding common stock have been excluded in that such persons may be deemed to be affiliates. This determination of affiliate status is not necessarily a conclusive determination for other purposes.
As of June 24, 2011, 58,590,572 shares of common stock of the Registrant were outstanding, exclusive of 12,541,000 shares of treasury stock.
DOCUMENTS INCORPORATED BY REFERENCE
The Registrant has incorporated by reference into Part III of this Annual Report on Form 10-K portions of its Proxy Statement for the 2011 Annual Meeting of Stockholders.
OMNIVISION TECHNOLOGIES, INC.
INDEX TO
ANNUAL REPORT ON FORM 10-K
FOR YEAR ENDED APRIL 30, 2011
2
The following information should be read in conjunction with our audited consolidated financial statements and the notes thereto included in Item 8 of this Annual Report on Form 10-K. This Annual Report on Form 10-K contains forward-looking statements, within the meaning of Section 27A of the Securities Act of 1933 and Section 21E of the Securities Exchange Act of 1934, which involve risks and uncertainties. Forward-looking statements generally include words such as "anticipates," "believes," "expects," "intends," "may," "outlook," "plans," "seeks," "will" and words of similar import as well as the negative of those terms. In addition, any statements that refer to expectations, projections or other characterizations of future events or circumstances, including any underlying assumptions, are forward-looking statements. All forward-looking statements included in this Annual Report on Form 10-K, including, but not limited to, statements regarding our projected results of operations for future reporting periods, the extent of future sales through original equipment manufacturers, or OEMs, and distributors, future growth trends and opportunities in certain markets, the capabilities of new products, the increasing competition in our industry, the effect of supply constraints, the continued importance of the mobile phone market to our business, the continued concentration of manufacturers in the mobile phone market, continued price competition and the consequent reduction in the average selling prices of our products, anticipated benefits of our joint ventures and alliances, the ability of our new products to mitigate declines in our average selling prices, the development of our business and manufacturing capacity, future expenses we expect to incur, our future investments, our future working capital requirements, the effect of a change in market interest rates, the geographic distribution of our sales and end users of our products, the continued improvement of general global and domestic economic conditions and the sufficiency of our available cash, cash equivalents and short-term investments are based on current expectations and are subject to important factors that could cause actual results to differ materially from those projected in the forward-looking statements. Such important factors include, but are not limited to, those set forth in Part I under the caption "Item 1A. Risk Factors," beginning on page 18 of this Annual Report and elsewhere in this Annual Report and in other documents we file with the U.S. Securities and Exchange Commission, or SEC. All subsequent written and oral forward-looking statements by or attributable to us or persons acting on our behalf are expressly qualified in their entirety by such factors.
OmniVision, the OmniVision logo, OmniPixel and TrueFocus are registered trademarks of OmniVision Technologies, Inc., CameraChip, CameraCube, OmniBSI, OmniBSI-2, OmniPixel2, OmniPixel3, OmniPixel3-HS, OmniQSP and SquareGA are trademarks of OmniVision Technologies, Inc. Wavefront Coded is a registered trademark of OmniVision CDM Optics, Inc., a wholly-owned subsidiary of OmniVision Technologies, Inc. Wavefront Coding is a trademark of OmniVision CDM Optics, Inc.
Corporate Information
OmniVision Technologies, Inc., a Delaware corporation, was incorporated in May 1995 in California, and reincorporated in Delaware in March 2000. Our executive offices are located at 4275 Burton Drive, Santa Clara, California 95054 and our telephone number is (408) 567-3000. Copies of our Annual Reports on Form 10-K, Quarterly Reports on Form 10-Q, Proxy Statement for our annual stockholders' meeting and Current Reports on Form 8-K, as well as any amendments to these reports, are available through our website as soon as reasonably practicable after we electronically file such material with, or furnish it to, the SEC. Information about our company is available on the Internet at www.ovt.com. The information in, or that can be accessed through, our website is not part of this report.
3
Overview
We design, develop and market high-performance, highly integrated and cost-efficient semiconductor image-sensor devices. Our main products, image-sensing devices which we refer to as CameraChip™ image sensors, capture an image electronically and are used in a number of consumer and commercial mass-market applications. Our CameraChip image sensors are manufactured using the complementary metal oxide semiconductor, or CMOS, fabrication process and are predominantly single-chip solutions that integrate several distinct functions including image capture, image processing, color processing, signal conversion and output of a fully processed image or video stream. We have also integrated our CameraChip image sensors with wafer-level optics, which we refer to as CameraCube™ imaging devices. Our CameraCube imaging device is a small footprint, total camera solution that we believe will enable the further miniaturization of camera products. We believe that our highly integrated image sensors and imaging devices enable camera device manufacturers to build high quality camera products that are smaller, less complex, more reliable, more cost-effective and more power-efficient than cameras using traditional charge-coupled devices, or CCDs.
Current Economic Environment
We operate in a challenging economic environment that has undergone significant changes in technology and in patterns of global trade. We remain a leader in the development and marketing of image sensing devices based on the CMOS fabrication process and have benefited from the growing market demand for and acceptance of this technology.
Beginning with the second half of our fiscal 2009, general domestic and global economic conditions were negatively impacted by several factors. These economic conditions resulted in our facing one of the most challenging periods in our history.
During the latter part of fiscal 2010 and throughout fiscal 2011, we saw indications that suggest certain major economies are returning to positive growth. Our quarterly sales improved in fiscal 2011, as compared to fiscal 2010 and fiscal 2009. We believe that demand for our products will continue to remain strong for fiscal 2012. However, it is uncertain whether the current resumption of economic growth will be sustained. If the economic recovery slows down or even dissipates, our business, financial condition, results of operations and cash flows could be materially and adversely affected.
Market Environment
We sell our products worldwide directly to original equipment manufacturers, or OEMs, which include branded customers and contract manufacturers, and value added resellers, or VARs, and indirectly through distributors. In order to ensure that we address all available markets for our image sensors, we organize our marketing efforts into end-use market groups, each of which concentrates on a particular product or, in some cases, customer within a product group. Thus we have marketing teams that address the mobile phone market, the notebook and webcam market, the digital still camera, or DSC, market, the security and surveillance market, the entertainment market, and the automotive and medical markets.
In the mobile phone market in particular, future revenues depend to a large extent on design wins where, on the basis of an exhaustive evaluation of available products, a particular mobile phone maker determines which image sensor to design into one or more specific models. The time lag between design win and volume shipments varies from as little as three months to as much as 12 months, which could cause an unexpected delay in generating revenues, especially during periods of product transitions. Design wins are also an important driver in the many other markets that we address, and in some cases, such as automotive or medical applications, the time lag between a particular design win and revenue generation can be longer than one year.
4
The overwhelming majority of our sales depend on decisions by the engineering designers for manufacturers of products that incorporate image sensors to specify one of our products rather than one made by a competitor. In most cases, the decision to specify a particular image sensor requires conforming other specifications of the product to the chosen image sensor and makes subsequent changes both difficult and expensive. Accordingly, the ability to timely produce and deliver reliable products in large quantities is a key competitive differentiator. Since our inception, we have shipped more than 2.5 billion image sensors, including approximately 680 million in fiscal 2011. We believe that these quantities demonstrate the continuing capabilities of our production system, including our sources of offshore fabrication.
We outsource the wafer fabrication and packaging of our image-sensor products to third parties. We outsource the color filter and micro-lens phases of production to VisEra Technologies Company, Ltd., or VisEra, our joint venture with Taiwan Semiconductor Manufacturing Company Limited, or TSMC. This approach allowed us to focus our resources on the design, development, marketing and testing of our products and to significantly reduce our capital requirements.
With our CameraCube products, we collaborate with the industry's leading wafer-level lens suppliers and outsource the assembly process to VisEra. We recently entered into an agreement with VisEra to acquire from VisEra its wafer-level lens production operations to enhance our CameraCube production capabilities.
To increase and enhance our production capabilities, we work closely with TSMC, our principal wafer supplier and one of the largest wafer fabrication companies in the world, to increase, as necessary, the number of its fabrication facilities at which our products can be produced. Our investments in VisEra and three other key back-end packaging suppliers are part of a broad strategy to ensure that we have sufficient back-end capacity for the processing of our image sensors in the various formats required by our customers.
We currently perform the final testing of the majority of our products at our own facility in China. As necessary, we will make further investments to expand our testing and production capacity, as well as our overall capability to design additional custom products for our customers.
Since our end-user customers market and sell their products worldwide, our revenues by geographic location are not necessarily indicative of the geographic distribution of end-user sales, but rather indicate where the products and/or their components are manufactured or sourced. The revenues we report by geography are based on the country or region in which our customers issue their purchase orders to us.
Many of the products using our image sensors, such as mobile phones, notebook and webcams, DSCs and cameras for entertainment applications, are consumer electronics goods. These mass-market camera devices generally have seasonal cycles which historically have caused the sales of our customers to fluctuate quarter-to-quarter. In addition, since a very large number of the manufacturers who use our products are located in China, Hong Kong and Taiwan, the pattern of demand for our image sensors has been increasingly influenced by the timing of the extended lunar or Chinese New Year holiday, a period in which the factories which use our image sensors generally close. Consequently, demand for our image sensors has historically been stronger in the second and third quarters of our fiscal year and weaker in the first and fourth quarters of our fiscal year. However, due to the global economic downturn, we experienced weaker than normal conditions in all of our markets in the third and fourth quarters of fiscal 2009. With the return to profitability in our business since the second fiscal quarter of 2010, we believe the historical seasonal cycle to our business has returned.
We believe that the market opportunity represented by mobile phones remains very large, although the opportunities presented could be deferred because of the uncertainty surrounding the sustainability of the current global economic recovery. We also believe that, like the DSC market, mobile phone,
5
notebook, tablet and webcam demand will not only continue to shift toward higher resolutions, but also will increasingly fragment into multiple market segments with differing product attributes. For example, we see the further expansion of the smartphone segment within the mobile phone market. In addition, there is increased demand for customization, and several different interface standards are coming to maturity. All of these trends will require the development of an increasing variety of products.
As the markets for image sensors have grown, we have experienced competition from manufacturers of CMOS and CCD image sensors. Our principal competitors in the market for CMOS image sensors include Aptina Imaging, Samsung, Sharp, Sony, STMicroelectronics and Toshiba. We expect to see continued price competition in the image-sensor market for mobile phones, notebooks and webcams, security and surveillance systems, digital still and video cameras, entertainment devices, automotive and medical imaging systems as those markets continue to grow. Although we believe that we currently compete effectively in those markets, our competitive position could be impaired by companies that have greater financial, technical, marketing, manufacturing and distribution resources, broader product lines, better access to large customer bases, greater name recognition, longer operating histories and more established strategic and financial relationships than we do. Such companies may be able to adapt more quickly to new or emerging technologies and customer requirements or devote greater resources to the promotion and sale of their products. Many of these competitors own and operate their own fabrication facilities, which in certain circumstances may give them the ability to price their products more aggressively than we can or may allow them to respond more rapidly than we can to changing market opportunities.
In addition, from time to time, other companies enter the CMOS image-sensor market by using obsolete and available manufacturing equipment. While these efforts have rarely had any long-term success, the new entrants do sometimes manage to gain market share in the short-term by pricing their products significantly below current market levels which puts additional downward pressure on the prices we can obtain for our products.
In common with many other semiconductor products and as a response to competitive pressures, the average selling prices, or ASPs, of image-sensor products have declined steadily since their introduction, and we expect ASPs to continue to decline in the future. Some of this ASP decline may be offset by the adoption of some of our newer and higher resolution products. We introduced our CameraCube products in February 2009. Depending on the adoption rate and unit volume, we believe these products may also mitigate the rate of ASP decline. In order to maintain our gross margins, we and our suppliers must work continuously to lower our manufacturing costs and increase our production yields, and in order to maintain or grow our revenues, we need to increase the number of units we sell by a large enough amount to offset the effect of declining ASPs. In addition, if we are unable to timely introduce new products that can take advantage of smaller process geometries or new products that incorporate more advanced technology and include more advanced features that can be sold at higher ASPs, our gross margin may decline.
Recently, the entire semiconductor industry, including us, has experienced supply constraints. Due to the lack of availability of products, supply constraints have forced companies in the industry to be unable to meet the product demands of their customers and to take certain actions such as allocating available products among their customers or, in some cases, increasing the prices of their products. This results in harm to customer relations, the loss of sales to customers and, in some cases, the loss of future business with those customers. We have faced, and continue to face, these same challenges as we seek to meet our customers' increasing demand for more of our products. Despite these challenges, through careful strategic planning relating to our products and the technologies that we deliver to market, we have been able to achieve revenue growth and unit growth. However, if our customers' demand remains at current levels or continues to increase, we will experience even greater challenges related to supply constraints and may be unable to achieve future growth, which could result in our revenues, gross margins and other financial results being materially and adversely affected.
6
Given the rapidly changing nature of our technology, there can be no assurance that we will not encounter delays or other unexpected yield issues with future products. During the early stages of production, production yields and gross margins for new products are typically lower than those of established products. We can encounter unexpected manufacturing issues, such as unexpected back-end yield problems. In addition, in preparation for new product introductions, we gradually decrease production of established products. Due to our 12-14 week production cycle, it is extremely difficult to predict precisely how many units of established products we will need. It is also difficult to accurately predict the speed of the ramp of new products. Given the current economic uncertainty, the visibility of our business outlook is extremely limited and forecasting is even more difficult than under normal market conditions. As a result, it is possible that we could suffer from shortages of certain products and build inventories in excess of demand for other products. We carefully consider the risk that our inventories may be in excess of expected future demand and record appropriate reserves. If, as sometimes happens, we are subsequently able to sell these reserved products, the sales have little or no associated cost and consequently, they have a favorable impact on gross margins.
Technology
In February 2008, we announced the introduction of our OmniPixel3-HS™ architecture. It is our most advanced generation of front side illumination, or FSI, OmniPixel® architecture. With OmniPixel3-HS, light is captured on the front side of the chip, and it forms the basis of our 1.75 µm FSI imaging pixel.
In May 2008, we announced a new approach to CMOS image sensor design we call OmniBSI™ technology. OmniBSI technology is based on an idea called back side illumination, or BSI. Our first OmniBSI product, an 8-megapixel image sensor, is built using an advanced 1.4 µm imaging pixel. We believe we are the first image sensor company to announce a viable process for the mass production of BSI sensors.
All traditionally designed CMOS image sensors capture light on the front side of the chip, so the photo-sensitive portion has to share the surface of the image sensor with the metal wiring of the transistors in the imaging pixel and the metal wiring acts to limit the amount of image light that reaches the photo-sensitive portion of the image sensor. With our OmniBSI architecture, the image sensor receives light through the back side of the chip. As a result, there is no metal wiring to block the image light, and the entire backside of the image sensor can be photo-sensitive. Not only does this enable us to produce a superior image, it also permits the front of the chip surface area to be devoted entirely to processing, and permits an increase in the number of metal layers, both of which result in greater functionality. Capturing light on the back side of the image sensor also allows us to reduce the distance the light has to travel to the imaging pixels, and thus provide a wider angle of light acceptance. Widening the angle of acceptance in turn makes it possible to reduce the height of the camera module, and thus the height of the device which incorporates the camera.
In February 2009, we announced the introduction of our CameraCube technology. This is a three-dimensional, reflowable, total camera solution that combines the full functionality of our CameraChip image sensors and wafer-level optics in one compact, small-footprint package. Our CameraCube devices can be soldered directly to printed circuit boards, with no socket or insertion requirements. We believe our CameraCube solution can streamline the mobile phone manufacturing process, thus resulting in lower cost and faster time-to-market for our customers. Although currently our customers primarily use our Camera Cube devices as secondary cameras in mobile handsets, going forward we anticipate that they will be used as the primary camera in mobile handsets.
In February 2010, we announced the introduction of our new OmniBSI-2™ architecture built on the advanced 300 mm copper process at TSMC. The OmniBSI-2 architecture represents our second-generation BSI technology and enables us to design imaging pixels as small as 1.1 µm in dimension.
7
Product Design
Mixed Analog/Digital Circuit and CMOS Image Sensor Design
We have the in-house expertise to design complex analog and digital semiconductor circuits. This in-house expertise enables us to process video data in both analog and digital domains, which has allowed us to optimize each aspect of analog and digital chip design. We have also developed in-house expertise in the mixing of analog and digital signals in the same semiconductor design without suffering the common problems of interference from noise caused by heat or cross-talk. Our in-house semiconductor design engineers are skilled in the design of high speed, low power, and mixed analog/digital image sensors with advanced pixel cell structures. We use advanced design techniques to develop high-speed, highly integrated semiconductors which can be fabricated using standard CMOS processes. The result has been a combination of improved image quality coupled with a reduction in unwanted electrical noise.
Advanced Image Processing
We have developed a broad range of proprietary technologies for image processing. For example, our Wavefront Coding technology combines optics and electronics to increase the depth of field of an image without changing the aperture of or reducing the amount of light reaching the lens and can eliminate the need for a mechanical auto-focus system. Wavefront Coding technology changes the phase of light as it traverses a specialized element in the lens and deliberately blurs all points in any image to an identical degree. Powerful algorithms then remove the system-dependent image blur to produce a sharp and clear image from the intermediate coded image.
Integrated Camera Solutions
We have also developed significant in-house expertise in applied optical science with the proprietary technology to integrate our image sensors with wafer-level optics. We now offer total camera solutions that are tailored to our customers' specific imaging requirements. We recently entered into an agreement with VisEra to acquire from VisEra its wafer-level lens production operations to enhance our CameraCube production capabilities.
Image Projection Technology
In March 2010, we acquired Aurora Systems, Inc., or Aurora, a privately-held company incorporated in California. Aurora is a supplier of liquid crystal on silicon, or LCoS, devices for use in mobile projection applications and high definition home theater projection systems. With the acquisition of Aurora, we acquired advanced image projection technology to capitalize on trends in the emerging video-centric consumer market.
8
Products
Our main products, CameraChip image-sensing devices, are used to capture images electronically and are used in a number of consumer and commercial mass-market applications. Our image-sensor products have a variety of features, including:
| CMOS CameraChip image sensors | Color or black and white | |
Illumination Technique |
Front side illumination or back side illumination |
|
Resolutions |
CIF (352 × 288 pixels) to 14.6-megapixels (4,416 × 3,312 pixels) |
|
Output signal |
Analog and digital |
|
Operating voltage |
5 volt to 1.2 volt |
|
Optical lens/array size |
1/18 to 1/2 inch formats |
|
Companion chips |
For connecting to computers and other devices |
|
In addition, we design and develop another category of products which we refer to as CameraCube imaging devices. They are image sensors with integrated wafer-level optics. We also supply companion chips used to connect our image sensors to various interfaces, including the universal serial bus, or USB, a connection which allows add-on devices to be connected to notebook and webcams and other industry standard interfaces such as the Mobile Industry Processor Interface, or MIPI, and low-voltage differential signaling, or LVDS. In addition, we provide companion digital signal processors, or DSP, that perform compression in standardized still photo and digital video formats.
We also design and develop standard software drivers for Linux, Mac OSX and Microsoft Windows, as well as for embedded operating systems such as Android, Blackberry OS, Palm OS, Symbian, Windows CE, Windows Embedded and Windows Mobile. These software drivers accept the image data being received from the USB, provide data decompression, if required, and manage interface protocols with the camera. We have designed these drivers for speed and flexibility and to allow easy customization of the user interface. We do not record any revenue from this software, which we provide to our customers as an element of customer support.
New Products
In May 2010, we introduced the OV2720, the world's first 1/6-inch, native 1080p high definition, or HD, CMOS image sensor designed for notebook, netbook, webcam and video conferencing applications. Based on OmniVision's 1.4 µm OmniBSI technology, the new 1080p sensor captures videoconference quality HD video in a form factor that meets the module size and height requirements of advanced thin notebook designs.
In June 2010, we announced the OV5640, a one-quarter inch 5-megapixel system-on-chip, or SOC, sensor built on our 1.4 µm OmniBSI technology. The device offers a cost-optimized, complete camera solution with excellent imaging pixel performance for 5-megapixel photography and 720p or 1080p HD video for camera phones. The sensor's embedded autofocus control with voice coil motor driver offers further cost savings to the end customer.
In June 2010, we also announced the high-speed OV7735 VGA sensor providing one of the thinnest VGA camera solutions available at less than 3-mm in height. The OV7735 is designed for portable applications, including digital video cameras, portable media players, as well as gaming devices and webcams.
9
In August 2010, we introduced the OV7727, an advanced VGA sensor for the high-end ultra-thin notebook market. The 1/13-inch OV7727 is the first VGA sensor built with our OmniBSI technology. It combines high performance and sensitivity with an ultra-compact form factor, enabling camera integration with sub-2 mm liquid crystal displays for next-generation notebooks, netbooks and tablet computers.
In August 2010, we also introduced the OV9740, a 1/6.5-inch SOC CMOS image sensor designed for video applications in portable media players, home entertainment devices and notebooks. Because all image quality tuning and processing is done on-chip, the OV9740 enables customers to simplify product development and accelerate time-to-market. The OV9740 combines our 1.75-µm OmniBSI imaging pixel architecture and our proprietary high-end image signal processor to deliver 720p native HD video.
In September 2010, we introduced two new SOC CMOS image sensors, the OV2643 and OV2659. Both sensors are designed to address the increased demand for 2-megapixel resolution cameras in the mid- to low-end feature phone segment. The two new SOC sensors with advanced image signal processing offer quality and functionality comparable to many high-performance digital still cameras, including 720p native HD video at 30 frames per second, or FPS, excellent sensitivity and high quality image capture.
In November 2010, we introduced the OV8820, a 1/3.2-inch 8-megapixel raw CMOS image sensor based on our 1.4-µm OmniBSI pixel architecture. The sensor delivers high frame rate 1080p/30 and 720p/60 HD video with electronic image stabilization and full horizontal field of view designed specifically to meet the demands of the smart phone markets. The OV8820 also offers advanced video capabilities designed for video-centric camera phones.
Also in November 2010, we announced the initiation of mass production of the ultra-compact, high-performance OV6930. With a packaged footprint of only 1.8 × 1.8 mm, the OV6930 is designed for applications favoring a small profile and is well suited to serve a broad range of medical endoscopy applications.
In January 2011, we introduced the OV10810, a 10-megapixel CMOS image sensor built on our highly optimized 1.4-µm OmniBSI pixel architecture. The 1/2.5-inch OV10810 is designed to offer complete convergence between high-resolution still photography and full HD video by combining 10-megapixel burst photography at 30 FPS with full 1080p HD video in a native 16:9 aspect ratio. The OV10810 is designed for digital still and video camera hybrids and high-end smart phones.
In February 2011, we introduced the OV3660, our first 3-megapixel CMOS image sensor based on our advanced 1.4-µm OmniBSI pixel architecture. The OV3660 extends our portfolio of BSI sensors and offers high-performance imaging, including 720p HD video recording, in an ultra-compact 1/5-inch optical format, designed for entry-level and mainstream smart phones. The OV3660 supports 720p HD video recording at 30 FPS with cropping and scaling, as well as 4:3 image capture for snapshots, allowing users to capture and share both video and still images.
In February 2011, we also introduced the OV8830, our most advanced 8-megapixel image sensor to date, and the first to use OmniVision's second generation OmniBSI-2 pixel architecture. Implementing the latest developments in BSI pixel technology, the OV8830 combines low power consumption, small die size and best-in-class pixel performance with advanced image processing features. This combination allows the OV8830 to support enhanced, fast frame rate image capture and 1080p or 720p HD video recording, making it highly suitable for feature rich smart phones. OmniBSI-2 technology is our first pixel architecture built on 300 mm wafers using a copper process with 65 nm design rules which enable a number of improvements over OmniBSI technology's performance, including improved pixel layout, better isolation, and reduced crosstalk.
10
In April 2011, we launched a 12.6-megapixel RAW CMOS image sensor for advanced mobile applications. The new OV12825 offers high-resolution still photography and 1080p HD video at 60 FPS with electronic image stabilization. These features make it an attractive solution for high-end feature and smart phone manufacturers. The new OV12825 is built on OmniVision's proven 1.4-µm OmniBSI™ pixel architecture.
Strategic Investments and Acquisitions
Joint Venture with TSMC
On October 29, 2003, we entered into an agreement with TSMC, to form VisEra, a joint venture in Taiwan, for the purposes of providing certain manufacturing and automated final testing services related to CMOS image sensors. In August 2005, under an amendment to the original 2003 joint-venture agreement, we and TSMC formed VisEra Holding Company, or VisEra Cayman, a company incorporated in the Cayman Islands, and VisEra became a subsidiary of VisEra Cayman. We and TSMC have equal interests in VisEra Cayman.
Through April 2007, our contribution to VisEra and VisEra Cayman totaled approximately $51.6 million, effectively meeting our commitment under the terms of a January 2007 amendment to the joint-venture agreement, in which we and TSMC have agreed to commit a total of $112.9 million to the joint venture. We have not made any subsequent contributions into VisEra and VisEra Cayman.
We initially accounted for our investment in VisEra under the equity method. Between August 1, 2005 and December 31, 2006, under the applicable authoritative accounting guidance for a variable interest entity, or VIE, VisEra was considered a VIE, and we were the primary beneficiary. Accordingly, we consolidated VisEra's operating results. On January 1, 2007, VisEra ceased to meet the definition of a VIE. Consequently, we deconsolidated VisEra on January 1, 2007, and since then have accounted for our investment in VisEra under the equity method. See Note 5—"Long-Term Investments" and Note 17—"Related Party Transactions" to our consolidated financial statements.
Joint Venture with Powerchip Technology Corporation
In May 2004, we entered into an agreement with Powerchip Technology Corporation, or PTC, formerly Powerchip Semiconductor Corporation, a Taiwan based company that produces memory chips and provides semiconductor foundry services, to establish Silicon Optronics, Inc., or SOI, a joint venture in Taiwan. We contributed approximately $2.1 million to SOI in exchange for an ownership percentage of 49.0%. Between March 2005 and May 2010, we controlled the board of directors of SOI and we consolidated SOI during this period. The purpose of SOI was to manufacture, market and sell certain of our legacy products. Toward the end of fiscal 2010, SOI began to ship niche products into other markets, including touch panels that track touches with optical sensors and linear sensors. In the three months ended January 31, 2011, we sold all of our interest in SOI. Our ownership percentage was 43.7% at the time of sale. Consequently, as of April 30, 2011, we had no continuing investment in SOI. See Note 5—"Long-Term Investments" and Note 17—"Related Party Transactions" to our consolidated financial statements.
Acquisition of Aurora
In March 2010, we acquired Aurora. Aurora designed, marketed and sold LCoS based microdisplay panels. These microdisplay panels are used for projection applications in consumer electronics, industrial, aerospace and mobile viewing platforms. We believe there is an emerging trend for video-centric applications in the consumer market. The advanced image projection technology we acquired through Aurora is intended to enable us to capitalize on this trend. Our closing consideration for the acquisition was approximately $5.6 million in cash. Of the $5.6 million purchase price, $0.5 million was placed in escrow at the time of the close and was released to the selling stockholders of Aurora during
11
the fourth quarter of fiscal 2011. There are no additional contingent considerations associated with this acquisition.
Acquisition of Kodak Patents
In March 2011, we acquired certain image sensor-related patents and patent applications from Eastman Kodak Company, or Kodak, for cash consideration of $65.0 million. In connection with the acquisition, we granted to Kodak world-wide, non-exclusive royalty-free licenses, without the right to sublicense, to use the purchased patents to manufacture and sell current image-sensor products and other Kodak products incorporating image sensors. Of the purchase price, $5.5 million was retained by us at the closing of the acquisition and will be available until December 31, 2011 to satisfy any indemnification claims we may be entitled to receive from Kodak under the terms of the acquisition. In addition, we initially retained $1.0 million of the purchase price in connection with efforts to record the ownership of the purchased patents in our name with the United States Patent and Trademark Office or international equivalents. We released this $1.0 million to Kodak in June 2011.
Industry Background
Image Sensor Technologies
Digital imaging enables the capture of still or moving images without the use of photographic or chemical-based films. The two most common electronic image sensors, both developed in the late 1960s, are CCD and CMOS image sensors. Both image sensors are silicon-based semiconductor devices that convert light to an electric charge for display or storage.
CMOS image sensors are typically less expensive to produce and consume significantly less power than CCDs. When originally introduced, the quality of CMOS image sensors lagged behind that of CCDs, but in recent years, advances in semiconductor manufacturing processes and design techniques have led to significant improvements in CMOS image sensor performance and image quality. Smaller circuits and better current control made it possible to design CMOS image sensors that provide image quality comparable to that of CCDs of comparable resolution. As a result, CMOS image sensors are now widely used in camera-equipped mobile phones, notebook and webcams, DSCs, security and surveillance systems, entertainment applications, and increasingly in automotive and medical applications, all areas where high image quality, low power consumption, small size and low cost are important considerations.
Most current CMOS image sensors operate on FSI technology, in which the image sensor captures light on the front side of the chip, so the photo-sensitive portion has to share the surface of the image sensor with the metal wiring of the transistors in the pixel. In May 2008, we introduced a new architecture based on BSI technology in which, as its name implies, the image sensor captures light on the back side of the chip. The advantages of BSI technology over conventional FSI technology are discussed in more detail under the sub-heading "Technology" on page 6 above.
CMOS Image Sensors versus CCD Image Sensors
One of the critical differences between CCD and CMOS image sensors is the way in which each processes an electrical charge, or a signal. Cameras employing CCDs require an additional integrated circuit called an analog-to-digital converter to convert a signal from analog to digital format. In contrast, image sensors based on the CMOS manufacturing process are able to integrate a number of functions on one device, enabling all of the conversion circuitry to be incorporated in a single image sensor chip. This high level of integration reduces the overall number of components and system complexity, and reduces the space required for them.
12
Market Opportunity
Demand for CMOS image sensors for use in mobile phones continued to account for a substantial portion of our revenue in fiscal 2011. Other applications and markets that we are currently serving or that are developing include embedded applications for notebook and webcams, security and surveillance, entertainment applications, DSCs, and automotive and medical applications. As device manufacturers become increasingly aware of the numerous advantages associated with single chip CMOS image sensor solutions, such as high image quality, accelerated time to market, efficient design and manufacturability, smaller size, lower power consumption and reduced cost, we believe these markets offer significant additional opportunities for mass-market applications for CMOS image sensors.
Customers
We sell directly to OEMs and VARs and indirectly through distributors. OEMs include branded camera device manufacturers and contract manufacturers. During fiscal 2011, we shipped approximately 680 million image sensors, an increase of 43.1% from approximately 475 million image sensors in fiscal 2010.
In fiscal 2011, we derived approximately 75.3% of our revenues from sales to OEMs and VARs and approximately 24.7% of our revenues from sales through distributors. The one OEM customer that accounted for 10% or more of our revenues in fiscal 2011 was LG Innotek Co., Ltd., which accounted for approximately 17.6% of our revenues. The one distributor that accounted for 10% or more of our revenues in fiscal 2011 was World Peace Industrial Group, or World Peace, which accounted for approximately 13.8% of our revenues. No other OEM, VAR or distributor accounted for 10.0% or more of our fiscal 2011 revenues.
Sales and Marketing
We sell our products through a direct sales force and indirectly through distributors. As of April 30, 2011, our sales and marketing organization had a total of 185 full-time employees. We also had eleven independent distributors, nine of which are located outside the United States.
Sales outside of the United States represented approximately 93.3%, 99.4% and 98.3% of our revenues in fiscal 2009, 2010 and 2011, respectively. We expect that sales outside of the United States will continue to account for a very large proportion of our revenues. We use distributors outside the United States principally to facilitate the logistics of the transactions in question and provide credit to end-user customers. These distributors also assume responsibility for collections, product returns and customer support. In addition to our standard product marketing, we also participate in tradeshows and other industry events to promote our image-sensor solutions.
Research and Development
We have designed the internal structure of our CMOS CameraChip and CameraCube image sensors in a modular fashion. The major functions, such as image capture, image sensor control logic, color processing, analog output, digital output and programming control, are stand-alone circuits that we can rapidly modify for use in new product developments. We design circuit improvements so that we can transfer them readily to other CameraChip image sensor products to help reduce total development time and cost for new products. In fiscal 2009, we also introduced the CameraCube imaging devices by integrating our image sensors with wafer-level optics. We developed our wafer-level optical technology with scalability and manufacturability in mind, enabling us to introduce a larger portfolio of CameraCube products in the future. As of April 30, 2011, we had a total of 477 full-time employees engaged in research and development.
13
Intellectual Property
Our success and future revenue growth will depend, in part, on our ability to protect our intellectual property. We rely on a combination of patents, copyrights, trademarks and trade secrets, as well as nondisclosure agreements and other methods, to protect various aspects of our CameraChip and CameraCube image sensors. As of April 30, 2011, we have been issued 401 United States patents which expire between May 2011 and June 2029. We have also received 430 foreign patents which expire between September 2011 and December 2027. As of April 30, 2011, we have 261 additional United States patent applications pending, of which 12 have been allowed, and we have 769 foreign patent applications pending, of which seven have been allowed.
In March 2011, we acquired certain image sensor-related patents and patent applications from Kodak. We are currently in the process of recording the ownership of the purchased patents in our name with the United States Patent and Trademark Office or international equivalents. These patents and patent applications are included in the numbers reported in the paragraph above.
We have in the past been, currently are and may in the future be, subject to legal proceedings and claims with respect to our intellectual property, including such matters as trade secrets, patents, product liabilities and other actions arising out of the normal course of business. These claims may increase as our intellectual property portfolio becomes larger or more valuable. Intellectual property claims against us, and any resulting lawsuit, may cause us to incur significant expenses, subject us to liability for damages and invalidate our proprietary rights. Any potential intellectual property litigation against us would likely be time-consuming and expensive to resolve and would divert management's time and attention.
Manufacturing
Wafer Fabrication
Our semiconductor products are fabricated using standard CMOS processes, which permit us to engage independent wafer foundries to manufacture our semiconductors. We outsource our wafer manufacturing for image sensors to TSMC and PTC. Our image sensor products are currently fabricated using standard line geometries processes at 65 nm, 0.11 µm, 0.13 µm, 0.18 µm and 0.25 µm. In addition, TSMC fabricates our companion DSP and interface chips.
Color Filter Application
The majority of our fiscal 2011 image sensor sales were color image sensors, which, in addition to a micro-lens, require a color filter to be applied to the wafer before packaging. The color filter application uses a series of masks to place red, green and blue dyes on the individual pixels in an industry-standard Bayer pattern. In the final step, a micro lens is applied to each pixel. We outsource these manufacturing steps to VisEra.
Wafer Probe Testing
Wafers that are designated for chip-on-board, or COB, packaging are tested using a process called wafer probe testing. We outsource wafer probe testing to King Yuan Electronics Co., Ltd. and Tong Hsing Electronic Industries, Ltd., or Tong Hsing, an investee company.
CameraCube Assembly
We introduced the CameraCube imaging devices near the end of fiscal 2009. To manufacture the CameraCube imaging devices, it is necessary for us to stack wafer-level optics onto our image sensors. We outsource this manufacturing procedure to VisEra. We recently entered into an agreement with
14
VisEra to acquire from VisEra its wafer-level lens production operations to enhance our CameraCube production capabilities.
Packaging
In the case of chip scale packaged, or CSP, products, after wafer fabrication, color filter application, if required, and micro-lens application, the wafers are packaged and then diced into chips. With the exception of CSP products, the wafers are diced first and then packaged. We design our products to use standard packaging that is widely used for optical image sensor chips. These packages have a glass lid to allow light to pass through to the image sensor array. For a portion of our product lines, we rely on Lingsen Precision Industries Co., Ltd. and Tong Hsing for substantially all of our ceramic chip packaging. We rely on XinTec Inc., or XinTec, an investee company, for our CSP products, which are generally designed for the smallest form factor applications. In the case of COB packaging, we rely on Tong Hsing to prepare good die for use in a delivery format referred to as reconstructed wafers. See Note 5—"Long-Term Investments" to our consolidated financial statements for a further description of our relationships with XinTec and Tong Hsing.
Final Testing
High volume final product testing is a critical element in the production of our image sensors and CameraCube imaging devices. Having this capability is a substantial barrier to entry for potential competitors. Production final testing instruments designed for conventional CMOS devices are not sufficient for testing image sensors, because an optical image must be captured and checked in addition to checking the standard logic and electrical functions.
We have installed and are currently expanding high-throughput automated final test equipment built to our specifications at our testing facility in Shanghai, China. The final test equipment have automated handling capability, a lighting and lens system, a changeable image source and automated output sorting by functionality. The system is programmable so that testing criteria and methodology can be changed easily to accommodate new products or special testing requirements.
Product Quality Assurance
We focus on product quality through all stages of the design and manufacturing process. We submit all our designs to in-depth circuit simulation before we commit them to silicon. Before we commit a new product to production, we fabricate test wafers, package test chips and test the final product. We keep initial production runs to a minimum until sufficient products have completed the entire manufacturing and testing process and are delivered to and approved by customers. We commit to full production runs after final customer approval.
We qualify each of our subcontractors through a series of industry standard environmental product stress tests, as well as through an audit and an analysis of the subcontractor's quality system and manufacturing capability. We also participate in quality and reliability monitoring through each stage of the production cycle by reviewing electrical parametric data from our foundries and other subcontractors.
15
Competition
We operate in an industry characterized by intense competition, rapid technological changes, evolving industry standards, declining ASPs and rapid product obsolescence. Our competition comes both from CMOS and CCD image sensor manufacturers:
- •
- CMOS Image Sensor Manufacturers. Image sensor
manufacturers using CMOS technology include a number of well established companies such as Aptina Imaging, Samsung, Sharp, Sony, STMicroelectronics and Toshiba.
- •
- CCD Image Sensor Manufacturers. Image sensor manufacturers using CCD technology include a number of well-established companies, particularly vertically integrated camcorder and high-resolution DSC manufacturers. Our main competition from CCD manufacturers comes from Panasonic, Sharp and Sony.
Our competitors include many large domestic and international companies that have greater presence in key markets, greater access to advanced wafer foundry capacity, substantially greater financial, technical, marketing, manufacturing, distribution and other resources, better access to large customer bases, greater name recognition, longer operating histories and more established strategic and financial relationships than we do. As a result, they may be able to adapt more quickly to new or emerging technologies and customer requirements or devote greater resources to the promotion and sale of their products.
We believe that the principal factors affecting our competition in our markets include relationships with key OEMs that incorporate image sensors into mass-market applications, relationships with key distributors, relationships with semiconductor foundries and other participants in the semiconductor manufacturing chain, time to market, quality, total system design cost, product performance, customer support and supplier reputation. We believe that we compete effectively with respect to these factors.
Backlog
Sales are generally made pursuant to standard purchase orders. Our backlog includes only accepted customer orders with assigned shipment dates within the upcoming 12 months. As of April 30, 2010 and 2011, our backlog was approximately $156.8 million and $259.5 million, respectively. The increase in our backlog reflects, in part, an increase in product demand. Our current backlog is subject to cancellation or changes in delivery schedules, and may not necessarily be an indication of future revenue.
Employees
As of April 30, 2011, we had a total of 1,465 full-time employees, 388 located in the United States, and 1,077 in China, Finland, Germany, Japan, Singapore, South Korea, Taiwan, Sweden and the United Kingdom. Our future success will depend, in part, on our ability to continue to attract, retain and motivate highly qualified technical and management personnel. None of our employees is represented by a collective bargaining agreement, and we have never experienced any material work stoppage. We believe that our employee relations are good.
Financial Information About Geographic Areas
For information about revenues and long-lived assets by geographic region/country, see Note 15—"Segment and Geographic Information" in Part II, Item 8 of this Form 10-K and "Management's Discussion and Analysis of Financial Condition and Results of Operations" in Part II, Item 7 of this Form 10-K.
16
Executive Officers of the Registrant
The following persons are our executive officers as of the filing date of this report:
Name
|
Age | Position | |||
|---|---|---|---|---|---|
| Shaw Hong | 73 | Chief Executive Officer, President and Director | |||
| Anson Chan | 42 | Vice President of Finance and Chief Financial Officer | |||
| Y. Vicky Chou | 48 | Vice President of Global Management and General Counsel | |||
| Ray Cisneros | 48 | Vice President of Worldwide Sales | |||
| Hasan Gadjali | 48 | Vice President of Marketing and Business Development | |||
| John Li | 43 | Vice President of System Technologies | |||
| Henry Yang | 46 | Vice President of Engineering and Director | |||
Shaw Hong, one of our cofounders, has served as one of our directors and as our Chief Executive Officer and President since May 1995. Mr. Hong holds a B.S. degree in electrical engineering from Jiao Tong University in China and an M.S. degree in electrical engineering from Oregon State University.
Anson Chan has served as our Vice President of Finance and Chief Financial Officer since October 2008 at which time he assumed the additional position of Chief Financial Officer. From February 2007 to present, Mr. Chan has served as our Vice President of Finance. From July 2006 to February 2007, Mr. Chan served as our Vice President of Business Strategy. From September 1997 to July 2006, Mr. Chan served in various positions with PricewaterhouseCoopers, LLP, a public accounting firm, most recently as a Senior Manager. Mr. Chan holds a B.S. degree in economics and a B.S. degree in engineering from the University of Pennsylvania and an M.B.A. degree in business strategy and operations management from the University of Chicago. Mr. Chan is also a Certified Public Accountant licensed in the State of California.
Y. Vicky Chou has served as our Vice President of Global Management and General Counsel since August 2009. From June 2003 to August 2009, Ms. Chou served as our Vice President of Legal and General Counsel. From February 2003 to June 2003, Ms. Chou served as our Corporate Counsel. From August 1999 to January 2003, Ms. Chou was an attorney at Heller Ehrman White & McAuliffe LLP. From June 1997 to July 1999, Ms. Chou was an attorney/corporate specialist at Coudert Brothers LLP. Ms. Chou received a B.S. degree in anthropology from Temple University, an M.B.A. degree from St. Joseph's University and a J.D. degree from Santa Clara University.
Ray Cisneros has served as our Vice President of Worldwide Sales since August 2009. From September 2006 to August 2009, Mr. Cisneros served as our Vice President of Sales. From December 2004 to September 2006, Mr. Cisneros served as our Director of Sales and Marketing for North American Sales. Prior to December 2004, Mr. Cisneros held various sales positions since joining our company in October 2002 including key account management, regional management and sales operations roles. Prior to joining our company, Mr. Cisneros held various senior management positions in the area of sales and marketing for companies in the fiber optics and semiconductor industries, including Sagitta, Inc., a provider of manufacturing equipment solutions for the fiber-optics industry, UMC, a semiconductor foundry, and Novellus Systems, Inc., a provider of manufacturing equipment for the semiconductor industry. Mr. Cisneros holds a B.S. in Metallurgical Engineering from Illinois Institute of Technology and an M.B.A. from Golden Gate University.
Hasan Gadjali has served as our Vice President of Marketing and Business Development since April 2011. From July 2007 to March 2011, Mr. Gadjali served as Vice President of Sales and Business Development at 3DLabs Semiconductor, a subsidiary of Creative Technology Limited, an innovator and supplier of 3D-graphics technology for PCs. Prior to joining 3DLabs Semiconductor, Mr. Gadjali was employed for six years by our company where he held various positions, including Vice President of the Advanced Products Business Unit and Director of Marketing for Advanced Products. Prior to joining our company, Mr. Gadjali held various senior design and technical positions at Winbond Electronics
17
Corporation, Chromatic Research, Inc., Creative Labs, Inc., a subsidiary of Creative Technology Limited, and Sharp Microelectronics, a subsidiary of Sharp Electronics Corporation. Mr. Gadjali holds a B.S.E.E. degree from the University of California, San Diego and an M.S.E.E. degree with an emphasis on image and video coding technology from San Diego State University.
John Li has served as our Vice President of System Technologies since August 2009. From November 2004 to August 2009, Mr. Li served as our Senior Director of Applications Engineering. Prior to November 2004, Mr. Li held various senior engineering positions subsequent to joining our company in February 1997. Prior to joining our company, Mr. Li held various electrical engineering positions with companies in the semiconductor and electronics industries, including HuaKo Electronics Co. Ltd in Hong Kong, a manufacturer of semiconductor devices, and Fudan University in China. Mr. Li specialized in electrical engineering while attending Fudan University.
Dr. Henry Yang has served as our Vice President of Engineering since February 2007. In addition, Dr. Yang has served as one of our directors since his appointment in February 2010. From February 2003 to January 2007, Dr. Yang served as our Director of Engineering. Prior to February 2003, Dr. Yang held various engineering positions since joining our company in April 1996. Dr. Yang holds B.E., M.E. and Ph.D. degrees in Electrical Engineering from the Tsinghua University in China.
This Annual Report on Form 10-K, including Management's Discussion and Analysis of Financial Condition and Results of Operations, contains forward-looking statements. These forward-looking statements are subject to substantial risks and uncertainties that could cause our future business, financial condition or results of operations to differ materially from our historical results or currently anticipated results, including those set forth below.
Risks Related to Our Business
For the majority of our revenues, we depend on a few key customers and, the loss of one or more of our key customers, or their key end user customers, could significantly reduce our revenues.
A relatively small number of OEMs, VARs and distributors account for a significant portion of our revenues. These OEMs, VARs and distributors may rely upon one or more key end user customers for a significant portion of their revenue. Any material delay, cancellation or reduction of purchase orders from one or more of our major customers or distributors, or their key end user customers, could result in our failure to achieve anticipated revenue for a particular period. In addition, if we are unable to retain one or more of our largest OEM, VAR or distributor customers, if we are unable to maintain our current level of revenues from one or more of these significant customers, or if our OEM, VAR or distributor customers are unable to retain one or more of their key end user customers, our business and results of operation would be impaired and our stock price could decrease, potentially significantly. Such a delay, cancellation or reduction of purchase orders or our inability to retain a key customer or several of our smaller customers could be caused by, among other things, failure to meet our customers', including their key end user customers', demand for our products. This has become even more challenging as our customers', including their key end user customers', demand has continued to increase. In fiscal 2010 and 2011, approximately 60.0% and 55.0%, respectively, of our revenues came from sales to our top five customers. In addition, in fiscal 2011, one OEM customer accounted for approximately 17.6% of our revenues, and one distributor customer accounted for approximately 13.8% of our revenues. Our business, financial condition, results of operations and cash flows will continue to depend significantly on our ability to retain our current key customers and to attract new customers, as well as on the financial condition and success of our OEMs, VARs and distributors, including their ability to retain their key end user customers and attract new customers.
18
We face intense competition in our markets from CMOS and CCD image-sensor manufacturers, and if we are unable to compete successfully we may not be able to maintain or grow our business.
The image-sensor market is intensely competitive, and we expect competition in this industry to continue to increase. This competition has resulted in rapid technological change, evolving standards, reductions in product selling prices and rapid product obsolescence. If we are unable to successfully meet these competitive challenges, we may be unable to maintain and grow our business. Any inability on our part to compete successfully would also adversely affect our results of operations and impair our financial condition.
Our image-sensor products face competition from other companies that sell CMOS image sensors and from companies that sell CCD image sensors. Many of our competitors have longer operating histories, greater presence in key markets, greater name recognition, larger customer bases, more established strategic and financial relationships and significantly greater financial, sales and marketing, distribution, technical and other resources than we do. Many of them also have their own manufacturing facilities, which may give them a competitive advantage. As a result, they may be able to adapt more quickly to new or emerging technologies and customer requirements or devote greater resources to the promotion and sale of their products. Our competitors include established CMOS image-sensor manufacturers such as Aptina Imaging, Samsung, Sharp, Sony, STMicroelectronics and Toshiba as well as CCD image-sensor manufacturers such as Panasonic, Sharp and Sony. Many of these competitors own and operate their own fabrication facilities, which in certain circumstances may give them the ability to price their products more aggressively than we can, respond more rapidly than we can to changing market opportunities or more easily meet increased demands for their products. In addition, we compete with a large number of smaller CMOS manufacturers that has required, and in the future may require, us to reduce our prices. For instance, we have seen increased competition in the markets for VGA image-sensor products with resulting pressures on product pricing. Downward pressure on pricing could result both in decreased revenues and lower gross margins, which would adversely affect our profitability. From time to time, other companies enter the CMOS image-sensor market by using obsolete and available manufacturing equipment. These new entrants gain market share in the short term by pricing their products significantly below current market levels, which puts additional downward pressure on the prices we can obtain for our products.
Our competitors may acquire or enter into strategic or commercial agreements or arrangements with foundries or providers of color filter processing, assembly or packaging services. These strategic arrangements between our competitors and third party service providers could involve preferential or exclusive arrangements for our competitors. Such strategic alliances could impair our ability to secure sufficient capacity from foundries and service providers to meet our demand for wafer manufacturing, color filter processing, assembly or packaging services, adversely affecting our ability to meet customer demand for our products. In addition, competitors may enter into exclusive relationships with distributors, which could reduce available distribution channels for our products and impair our ability to sell our products and grow our business. Further, some of our customers could also become developers of image sensors, and this could potentially adversely affect our results of operations, business and prospects.
Reductions in our average selling prices may lower our revenues and, as a result, may reduce our gross margins.
We have experienced and expect to continue to experience pressure to reduce the selling prices of our products, and our ASPs have declined as a result. Competition in our product markets is intense and as this competition continues to intensify, we anticipate that these pricing pressures will increase. We expect that the ASPs for many of our products will continue to decline over time. Unless we can increase unit sales sufficiently to offset these declines in our ASPs, our revenues will decline. Reductions in our ASPs have adversely affected our gross margins, and unless we can reduce
19
manufacturing costs to compensate, additional reductions in our ASPs will continue to adversely affect our gross margins and could materially and adversely affect our operating results and impair our financial condition. Although we may decrease our research, development and related expenses in the short-term from time-to-time, historically we have increased and are likely to continue to increase our research, development and related expenses in the long-term to continue the development of new image-sensor products that can be sold at higher selling prices and/or manufactured at lower cost. If we are unable to timely introduce new products that incorporate more advanced technology and include more advanced features that can be sold at higher ASPs, or if we are unable to successfully develop more cost-effective technologies, our financial results could be adversely affected.
Sales of our image-sensor products for mobile phones, including smart phones, account for a large portion of our revenues, and any decline in sales to the mobile phone market or failure of this market and other emerging markets to continue to grow as expected could adversely affect our results of operations.
Sales to the mobile phone market, including smart phones, account for a large portion of our revenues. Although we can only estimate the percentages of our products that are used in the mobile phone market due to the significant number of our image-sensor products that are sold to module makers or through distributors and VARs, we believe that the mobile phone market accounted for approximately 60% and 65% of our revenues in fiscal 2010 and 2011, respectively. We expect that revenues from sales of our image-sensor products to the mobile phone market will continue to account for a significant portion of our revenues during the remainder of fiscal 2012 and beyond. Any factors adversely affecting the demand for our image sensors in this market could cause our business to suffer and adversely affect our financial condition, operating results and cash flows. The digital image-sensor market for mobile phones is extremely competitive, and we expect to face increased competition in this market in the future. In addition, we continue to believe the market for mobile phones is also relatively concentrated and the top five producers account for approximately 75% of the annual sales of these products. If we do not continue to achieve design wins with key mobile phone manufacturers, our market share or revenues could decrease. The mobile phone image-sensor market is also subject to rapid technological change. In order to compete successfully in this market, we will have to correctly forecast customer demand for technological improvements and be able to deliver such products on a timely basis at competitive prices. If we fail to do this, our results of operations, business and prospects would be materially and adversely affected. In the past, we have experienced problems accurately forecasting customer demand in other markets. In addition, current domestic and global economic conditions could negatively affect the mobile phone market if consumers and/or businesses defer purchases in this market in response to tighter credit, negative financial news, and/or decreased corporate or consumer spending.
We also expect that image sensors will become of greater importance in the notebook and webcam, entertainment, security, medical and automotive industries. As image sensors begin to fill a greater role in these other markets, the challenges and risks that we face in these other markets could increase and could be similar to some of the challenges and risks that we face in the mobile phone market. If our sales to the mobile phone market and other emerging markets do not increase and/or the mobile phone market and other emerging markets do not grow as expected, our results of operations, business and prospects would be materially adversely affected.
Our future success depends on the timely development, introduction, marketing and selling of new products, which we might not be able to achieve.
Our failure to successfully develop new products that achieve market acceptance in a timely fashion could adversely affect our ability to grow our business and improve our operating results. The development, introduction and market acceptance of new products is critical to our ability to sustain and grow our business. Any failure to successfully develop, introduce, market and sell new products
20
could materially adversely affect our business and operating results. The development of new products is highly complex, and we have in the past experienced delays in completing the development and introduction of new products. From time to time, we have also encountered unexpected manufacturing problems as we increase the production of new products. Consumers continue to expect the sophistication of image sensors in consumer products to increase, and the number of consumer products that use image sensors has continued to grow. This results in a requirement for us to continue to build and develop image sensors with advanced technologies that can be used in a variety of consumer products. As our products integrate new and more advanced technologies and functions, they become more complex and increasingly difficult to design, debug and produce. Successful product development and introduction depends on a number of factors, including:
- •
- accurate prediction of market requirements and evolving standards, including imaging pixel resolution, output interface
standards, power requirements, optical lens size, input standards and operating systems for webcams and other platforms;
- •
- development of advanced technologies and capabilities, including our CameraCube, OmniBSI and new OmniBSI-2
technologies;
- •
- definition, timely completion and introduction of new CMOS image sensors that satisfy customer requirements;
- •
- development of products that maintain a technological advantage over the products of our competitors, including our
advantages with respect to the functionality and imaging pixel capability of our image-sensor products and our proprietary testing processes; and
- •
- market acceptance of the new products.
Accomplishing all of these steps is difficult, time consuming and expensive. We may be unable to develop new products or product enhancements in time to capture market opportunities or achieve significant or sustainable acceptance in new and existing markets. In addition, our products could become obsolete sooner than anticipated because of a rapid change in one or more of the technologies related to our products or the reduced life cycles of consumer products.
Design wins are a key determinant of future revenues, and failure to obtain design wins adversely affects our revenues and impairs our ability to grow our business.
Our success has been, and will continue to be, dependent upon manufacturers designing our image-sensor products into their products. To achieve design wins, which are decisions by manufacturers to design our products into their systems, we must define and deliver cost effective and innovative image-sensor solutions on a timely basis that satisfy the manufacturers' requirements. Our ability to achieve design wins is subject to numerous risks including competitive pressures as well as technological risks. If we do not achieve a design win with a prospective customer, it may be difficult to sell our image-sensor products to such prospective customer in the future because once a manufacturer has designed a supplier's products into its systems, the manufacturer may be reluctant to change its source of components due to the significant costs, time, effort and risk associated with qualifying a new supplier and modifying its design platforms. Accordingly, if we fail to achieve design wins with key device manufacturers that embed image sensors in their products, our market share or revenues could decrease. Furthermore, to the extent that our competitors secure design wins, our ability to grow our business in the future will be impaired.
We depend on a limited number of third party wafer foundries, which reduces our ability to control our manufacturing process.
Unlike some of our larger competitors, we do not own or operate a semiconductor fabrication facility. Instead, we rely on TSMC, PTC and other subcontract foundries to produce all of our wafers.
21
Historically, we have relied on TSMC to provide us with a substantial majority of our wafers. As a part of our joint venture agreement with TSMC, TSMC has agreed to commit substantial wafer manufacturing capacity to us in exchange for our commitment to purchase a substantial portion of our wafers from TSMC, subject to pricing and technology requirements.
In addition, we have entered into a foundry manufacturing agreement with PTC pursuant to which we and PTC have agreed to jointly develop certain imaging pixel-related process technology and for PTC to process certain of our CMOS image sensors at PTC's facilities in accordance with the scheduled development approved by both parties.
Under the terms of these supply agreements, we secure manufacturing capacity in any particular period on a purchase order basis. The foundries have no obligation to supply products to us for any specific period, in any specific quantity or at any specific price, except as set forth in a particular purchase order. In general, our reliance on third party foundries involves a number of significant risks, including:
- •
- reduced control over delivery schedules, quality assurance, manufacturing yields and production costs;
- •
- lack of guaranteed production capacity or product supply;
- •
- unavailability of, or delayed access to, next generation or key process technologies; and
- •
- financial difficulties or disruptions in the operations of third party foundries due to causes beyond our control.
If our unit sales continue to increase during the remainder of fiscal 2012 as they did in fiscal 2011, the size of the orders we place with our foundries will increase as well. Because our foundries provide services to a number of companies, in the event they receive increased orders from us or one or more of the other companies that they service, they may be unable to provide us with the requested quantity of products, may subordinate our request to the requests of other larger companies or may increase the prices they charge us. Recently, the entire semiconductor industry, including us, has experienced supply constraints. Due to the lack of availability of products, supply constraints have forced companies in the industry to be unable to meet customers' product demands and to take certain actions such as allocating available products among their customers or, in some cases, increasing the prices of their products. These actions result in harm to customer relations, the loss of sales to customers and, in some cases, the loss of future business with those customers. We have faced, and continue to face, these same challenges as we seek to meet our customers' increasing demand for more of our products. If our customers' demand remains at current levels or continues to increase or if for any reason our foundries are unable to provide a sufficient number of products to us on a timely basis and at acceptable yields and cost, we will experience even greater challenges related to supply constraints and may be unable to achieve future growth, which could result in our revenues, gross margins and other financial results being materially and adversely affected.
The current global economic conditions could materially affect our foundries and cause them to be unable to provide necessary services to us. If TSMC, PTC, or any of our other foundries were unable to continue manufacturing our wafers in the required quantities, at acceptable quality, yields and costs, or in a timely manner, we would have to identify and qualify substitute foundries, which would be time consuming and difficult, and could increase our costs or result in unforeseen manufacturing problems. In addition, if competition for foundry capacity increases we may be required to pay increased amounts for manufacturing services. We are also exposed to additional risks if we transfer our production of semiconductors from one foundry to another, as such transfer could interrupt our manufacturing process. Further, some of our foundries may also develop their own image-sensor products and if one or more of our other foundries were to decide not to fabricate our companion DSP chips for competitive or other reasons, we would have to identify and qualify other sources for these products.
22
We rely on a joint venture company for color filter application and on third party service providers for packaging and other back-end services, which reduces our control over delivery schedules, product quality and cost, and could adversely affect our ability to deliver products to customers.
We rely on VisEra for the color filter application of our completed wafers and the assembly of our CameraCube imaging devices. In addition, we rely on Advanced Semiconductor Engineering, Inc. and on ImPac Technology Co., Ltd., or ImPac, our former equity investee, for substantially all of our ceramic chip packages. In December 2009, Tong Hsing acquired ImPac and assumed control of its operations. We rely on XinTec, an investee company, for chip scale packages, which are generally used in our products designed for the smallest form factor applications. We rely on several specialized service providers, one of which is Tong Hsing, to perform the necessary wafer probe tests and prepare good die for use in chip-on-board packaging, a delivery format referred to as reconstructed wafer. If the current global economic conditions do not continue to improve or remain stable, these service providers' ability to continue to fulfill our packaging, color filter processing and related requirements could be adversely affected. If for any reason one or more of these service providers were to become unable or unwilling to continue to provide services of acceptable quality, at acceptable costs or in a timely manner, our ability to deliver our products to our customers could be severely impaired. We would have to identify and qualify substitute service providers, which could be time consuming and difficult and could result in unforeseen operational problems. Substitute service providers might not be available or, if available, might be unwilling or unable to offer services on acceptable terms.
In addition, if competition for color filter application, packaging, capacity or other back-end services increases, we may be required to pay or invest significant amounts to secure access to these services, which could adversely impact our operating results. The number of companies that provide these services is limited and some of them have limited operating histories and financial resources. In the event our current providers refuse or are unable to continue to provide these services to us, we may be unable to procure services from alternate service providers. Furthermore, if customer demand for our products increases, we may be unable to secure sufficient additional capacity from our current service providers on commercially reasonable terms, if at all. These factors may cause unforeseen product shortages or may increase our costs of manufacturing, assembling or testing of our products, which would adversely affect our operating results and cash flows.
If we do not forecast customer demand correctly, our business could be impaired and our stock price may decline.
Our sales are generally made on the basis of purchase orders rather than long-term purchase commitments; however, we manufacture products and build inventory based on our estimates of customer demand. Accordingly, we must rely on multiple assumptions to forecast customer demand. In addition, external factors that are outside of our control can make it difficult to accurately make such forecasts. For example, the domestic and global economic conditions that existed during fiscal 2009 and fiscal 2010 made it extremely challenging to accurately predict customer demand because demand demonstrated increased volatility. Although customer demand for our products steadily increased during fiscal 2011, there is no guarantee that such demand will continue to increase or remain at current levels. If customer demand continues to be volatile, historical models for predicting customer demand may no longer be reliable. If we overestimate customer demand, we may manufacture products that we may be unable to sell, or we may have to sell at lower prices. This could materially and adversely affect our results of operations and financial condition. In addition, our customers may cancel or defer orders at any time by mutual written consent. We have experienced problems with accurately forecasting customer demand in the past. For example, there was a significant decline in product demand in the third quarter of fiscal 2009, and as a result our inventories at the end of the third quarter of fiscal 2009 were higher than we intended them to be. We need to accurately predict customer demand because we must often place noncancelable orders with our manufacturers to have
23
products manufactured before we receive firm purchase orders from our customers. Conversely, if we underestimate customer demand, we may be unable to manufacture sufficient products quickly enough to meet actual demand, which could damage our reputation, impair our relationships with our customers, cause us to lose one or more customers and impair our ability to grow our business. In preparation for new product introductions, we gradually ramp down production of established products. With our 12-14 week production cycle, it is extremely difficult to predict precisely how many units of established products we will need. It is also difficult to accurately predict the speed of the ramp of our new products and the impact on inventory levels presented by the shorter life cycles of end-user products. The shorter product life cycle is a result of an increase in competition and the growth of various consumer-product applications for image sensors. Under these circumstances, it is possible that we could suffer from shortages of certain products and, if we underestimate market demand, we face the risk of being unable to fulfill customer orders. We also face the risk of excess inventory and product obsolescence if we overestimate market demand for our products and build inventories in excess of demand. Our ability to accurately forecast sales is also a critical factor in our ability to meet analyst expectations for our quarterly and annual operating results. Any failure to meet these expectations would likely lead to a substantial decline in our stock price.
Fluctuations in our quarterly operating results have caused volatility in the market price of our common stock and also make it difficult to predict our future operating results.
Our quarterly operating results have varied significantly from quarter to quarter in the past and are likely to vary significantly in the future based on a number of factors, many of which are beyond our control. These factors and other industry risks, many of which are more fully discussed in our other risk factors, include, but are not limited to:
- •
- adverse changes in domestic or global economic conditions, including the current economic crisis;
- •
- the volume and mix of our product sales;
- •
- competitive pricing pressures;
- •
- our ability to accurately forecast demand for our products;
- •
- our ability to achieve acceptable wafer manufacturing or back-end processing yields;
- •
- our gain or loss of a large customer;
- •
- our ability to manage our product transitions;
- •
- the availability of production capacity at the suppliers that manufacture our products or process our products;
- •
- the growth of the market for products and applications using CMOS image sensors;
- •
- the timing and size of orders from our customers;
- •
- the volume of our product returns;
- •
- the seasonal nature of customer demand for our products;
- •
- the deferral of customer orders in anticipation of new products, product designs or enhancements;
- •
- the announcement and introduction of products and technologies by our competitors;
- •
- the fair value of our interest rate swaps;
- •
- the impairment of our intangible assets or other long-lived assets;
24
- •
- the level of our operating expenses; and
- •
- fluctuations in our effective tax rate from quarter to quarter.
Our introduction of new products and our product mix have affected, and may continue to affect, our quarterly operating results. Changes in our product mix could adversely affect our operating results, because some products provide higher margins than others. We typically experience lower yields when manufacturing new products through the initial production phase, and consequently our gross margins on new products have historically been lower than our gross margins on our more established products. We also anticipate that the rate of orders from our customers may vary significantly from quarter to quarter. Our operating expenses are relatively fixed in the short-term, and our inventory levels are based on our expectations of future revenues. Consequently, if we do not achieve the revenues we expect in any quarter, expenses and inventory levels could be disproportionately high, adversely impacting our operating results and cash flows for that quarter, and potentially in future quarters.
All of these factors are difficult to forecast and could result in fluctuations in our quarterly operating results. Our operating results in a given quarter could be substantially less than anticipated, and, if we fail to meet market analysts' expectations, a substantial decline in our stock price could result. Fluctuations in our quarterly operating results could adversely affect the price of our common stock in a manner unrelated to our long-term operating performance.
Our use of derivative financial instruments to reduce interest rate risk may result in added volatility in our quarterly operating results
We do not hold or issue derivative financial instruments for trading purposes. However, we do utilize derivative financial instruments to reduce interest rate risk. We have a variable rate mortgage and term loans that totaled $29.3 million as of April 30, 2011. To manage the related interest rate risk, we entered into two interest rate swap agreements, effectively converting our mortgage loan into a fixed rate loan. Under generally accepted accounting principles, the fair values of the swap contracts, which will either be amounts receivable from or payable to counterparties, are reflected as either assets or liabilities on our Consolidated Balance Sheets. We record their fair value changes in our Consolidated Statements of Operations, in "Other income (expense), net." The associated impact on our quarterly operating results is directly related to changes in prevailing interest rates. If interest rates increase, we would have a non-cash gain on the swap, and vice versa. Consequently, these swap contracts will introduce volatility to our operating results.
We are also exposed to credit loss in the event of non-performance by the counterparties to the interest rate swap agreements. However, we do not anticipate non-performance by the counterparties.
Our business is subject to seasonal fluctuations which may in turn cause fluctuations in our results of operations and cash flows from period to period.
Many of the products using our image sensors, such as mobile phones, notebooks, tablets, webcams, DSCs and cameras for entertainment applications, are consumer electronics goods. These mass-market camera devices generally have seasonal cycles which historically have caused the sales of our customers to fluctuate quarter-to-quarter. In addition, since a very large number of the manufacturers who use our products are located in China and Taiwan, the pattern of demand for our image sensors has been influenced by the timing of the extended lunar or Chinese New Year holiday, a period in which the factories which use our image sensors generally close. Consequently, demand for our image sensors has historically been stronger in the second and third quarters of our fiscal year and weaker in the first and fourth quarters of our fiscal year. However, due to the global economic downturn, we experienced weaker than normal conditions in all of our markets in the third and fourth quarters of fiscal 2009. With the return to profitability in our business since the second quarter of fiscal 2010, we believe the historical seasonal cycle to our business has returned. If this seasonal cycle
25
continues in future years, it could result in the fluctuation of our results of operations and cash flows from period to period. Alternatively, if we experience future events, such as the recent global economic downturn or other events outside of our control, our historical seasonal cycle could be disrupted and our results of operations and cash flows could differ from our historical seasonal cycles.
Problems with wafer manufacturing and/or back-end processing yields could result in higher product costs and could impair our ability to meet customer demand for our products.
If the foundries manufacturing the wafers used in our products cannot achieve the yields we expect, we could incur higher unit costs and reduced product availability. Foundries that supply our wafers have experienced problems in the past achieving acceptable wafer manufacturing yields. Wafer yields are a function of both our design technology and the particular foundry's manufacturing process technology. These risks increase with our introduction of more advanced and novel products and technology, as well as with increased customer demand that requires these new products to be produced more quickly and in greater quantities than our historical volume. Certain risks are inherent in the introduction of new products and technology. Low yields may result from design errors or manufacturing failures in new or existing products. During the early stages of production, production yields for new products are typically lower than those of established products. Unlike many other semiconductor products, optical products can be effectively tested only when they are complete. Accordingly, we perform final testing of our products only after they are assembled. As a result, yield problems may not be identified until our products are well into the production process. The risks associated with low yields could be increased because we rely on third party offshore foundries for our wafers, which can increase the effort and time required to identify, communicate and resolve manufacturing yield problems. In addition to wafer manufacturing yields, our products are subject to yield loss in subsequent manufacturing steps, often referred to as back-end processing, such as the application of color filters and micro-lenses, dicing (cutting the wafer into individual devices, or die) and packaging. Any of these potential problems with wafer manufacturing and/or back-end processing yields could result in a reduction in our gross margins and/or our ability to timely deliver products to customers, which could adversely affect our customer relations and make it more difficult to sustain and grow our business.
We depend on the increased acceptance of mass-market image-sensor applications to grow our business and increase our revenues.
Our business strategy depends in large part on the continued growth of the various markets into which we sell our image-sensor products, including the markets for mobile phones, notebook, tablets, webcams, digital still and video cameras, commercial and security and surveillance applications, entertainment devices, automotive and medical applications. If these markets do not grow and develop as we anticipate, we may be unable to sustain or grow the sales of our products. Each of these markets has already been, and may continue to be, adversely impacted by current global economic conditions where consumers and businesses have deferred purchases of products in these markets as a result of tighter credit, negative financial news, and decreased corporate or consumer spending. Such conditions have negatively affected, and may continue to negatively affect, our business.
In addition, the market price of our common stock may be adversely affected if certain of these new markets do not emerge or develop as expected. Securities analysts may already factor revenue from such new markets into their future estimates of our financial performance and should such markets not develop as expected by such securities analysts the trading price of our common stock could be adversely affected.
26
Our lengthy manufacturing, packaging and assembly cycle, in addition to our customers' design cycle, may result in uncertainty and delays in generating revenues.
The production of our image sensors requires a lengthy manufacturing, packaging and assembly process, typically lasting approximately 12-14 weeks. Additional time may pass before a customer commences taking volume shipments of products that incorporate our image sensors. Even when a manufacturer decides to design our image sensors into its products, the manufacturer may never ship final products incorporating our image sensors. Given this lengthy cycle, we experience a delay between the time we incur expenditures for research and development and sales and marketing efforts and the time we generate revenue, if any, from these expenditures. This delay makes it more difficult to forecast customer demand, which adds uncertainty to the manufacturing planning process and could adversely affect our operating results. In addition, the product life cycle for certain of our image-sensor products designed for use in certain applications can be relatively short. If we fail to appropriately manage the manufacturing, packaging and assembly process, our products may become obsolete before they can be incorporated into our customers' products and we may never realize a return on investment for the expenditures we incur in developing and producing these products.
Our ability to deliver products that meet customer demand is dependent upon our ability to meet new and changing requirements for color filter application and image-sensor packaging.
We expect that as we develop new products to meet technological advances and new and changing industry and customer demands, our color filter application and ceramic, plastic and chip scale packaging requirements will also evolve. Our ability to continue to profitably deliver products that meet customer demand is dependent upon our ability to obtain third party services that meet these new requirements on a cost-effective basis. There can be no assurances that any of these parties will be able to develop enhancements to the services they provide to us to meet these new and changing industry and customer requirements. Furthermore, even if these service providers are able to develop their services to meet new and evolving requirements, these services may not be available at a cost that enables us to sustain our profitability.
The high level of complexity and integration of our products increases the risk of latent defects, which could damage customer relationships and increase our costs.
Our products are based upon evolving technology, and because we integrate many functions on a single chip, are highly complex. The integration of additional functions into already complex products could result in a greater risk that customers or end users could discover latent defects or subtle faults after we have already shipped significant quantities of a product. Although we test our products, we have in the past and may in the future encounter defects or errors. For example, in the third quarter of fiscal 2005, we recorded a provision of $2.7 million related to the possible replacement of products that did not meet a particular customer's standards. Delivery of products with defects or reliability, quality or compatibility problems may damage our reputation and ability to retain existing customers and attract new customers. In addition, product defects and errors could result in additional development costs, diversion of technical resources, delayed product shipments, increased product returns, product warranty costs for recall and replacement and product liability claims against us which may not be fully covered by insurance.
Recent domestic and worldwide economic conditions adversely affected and could have future adverse effects on our business, results of operations, financial condition and cash flows.
Beginning with the second half of our fiscal 2009, general domestic and global economic conditions were negatively impacted by several factors. These economic conditions resulted in our facing one of the most challenging periods in our history.
27
Although during the latter part of fiscal 2010 and throughout fiscal 2011, we have seen indications that suggest that certain major economies are returning to positive growth, it is uncertain whether such resumption of growth will be sustained. If the economic recovery slows down or even dissipates, our business, financial condition, results of operations and cash flows could be materially and adversely affected.
We may be required to record a significant charge to earnings if our goodwill, intangible assets or long-term investments become impaired.
Under generally accepted accounting principles, we are required to review our intangible assets for impairment when events or changes in circumstances indicate the carrying value may not be recoverable. Factors that may be considered a change in circumstances indicating that the carrying value of our intangible assets may not be recoverable include a decline in stock price and market capitalization, and slower growth rates in our industry.
We may be required to record a significant charge to earnings in our financial statements during the period in which we determine that our intangible assets or long-term investments have been impaired. Any such charge would adversely impact our results of operations. As of April 30, 2011, our goodwill totaled approximately $1.1 million, our intangible assets totaled approximately $69.9 million and our long-term investments totaled approximately $104.6 million.
We maintain a backlog of customer orders that is subject to cancellation or delay in delivery schedules, and any cancellation or delay may result in lower than anticipated revenues.
Our sales are generally made pursuant to standard purchase orders. We include in our backlog only those customer orders for which we have accepted purchase orders and assigned shipment dates within the upcoming 12 months. Orders constituting our current backlog are subject to cancellation or changes in delivery schedules, and backlog may not necessarily be an indication of future revenue. Any cancellation or delay in orders which constitute our current or future backlog may result in lower than expected revenues.
If we are unable to maintain processes and procedures to sustain effective internal control over our financial reporting, our ability to provide reliable and timely financial reports could be harmed and this could have a material adverse effect on our stock price.
We are required to comply with the rules promulgated under Section 404 of the Sarbanes-Oxley Act of 2002, or Sarbanes-Oxley Act. Section 404 requires that we prepare an annual management report assessing the effectiveness of our internal control over financial reporting, and requires a report by our independent registered public accounting firm addressing the effectiveness of our internal control over financial reporting.
We have in the past discovered, and may in the future discover, areas of our internal control that need improvement. For example, we restated our financial statements for the first, second and third quarters of fiscal 2004. If these or similar types of issues were to arise with respect to our internal controls in future periods, they could impair our ability to produce accurate and timely financial reports.
As our business changes, ongoing compliance with the provisions of Section 404 of the Sarbanes-Oxley Act and maintenance of effective internal control over financial reporting may require that we hire additional qualified finance and accounting personnel. Because other businesses face similar challenges, there is significant competition for such personnel, and there can be no assurance that we will be able to attract and/or retain suitably qualified employees.
28
Corporate governance regulations have increased our compliance costs and could further increase our expenses if changes occur within our business.
We are subject to corporate governance laws and regulations affecting public companies, including the provisions of the Sarbanes-Oxley Act and the Dodd-Frank Act of 2010, that impose certain requirements on us and on our officers, directors, attorneys and independent registered public accounting firm. In order to comply with these rules, we added internal resources and have utilized additional outside legal, accounting and advisory services, which increased our operating expenses. We expect to incur ongoing operating expenses as we maintain compliance with Section 404. In addition, if we undergo significant modifications to our structure through personnel or system changes, acquisitions, or otherwise, it may be increasingly difficult to maintain compliance with the existing and evolving corporate governance regulations.
We hold a significant amount of marketable securities which are subject to general market risks over which we have no control.
As of April 30, 2011, we held cash and cash equivalents totaling $379.4 million, and short-term investments totaling $87.5 million. These assets are managed on our behalf by unrelated third parties in accordance with a cash management policy that has been approved by our board of directors and restricts our investments to a maximum maturity of 18 months and to investment-grade instruments. As of April 30, 2011, we did not hold any illiquid investments and we have not realized any losses. However, ongoing uncertainties in global capital markets associated with a repricing of risk have caused disruptions in the orderly function of markets which are ordinarily characterized by virtually unlimited liquidity. If we were to make a future investment in certain illiquid securities that are dependent on the orderly functioning of the capital markets, and if we were required to liquidate these types of securities at short notice, such liquidation could result in losses of principal, which would have a negative impact on our results of operations and cash flows.
There are risks associated with our operations in China.
In December 2000, we established OmniVision Semiconductor (Shanghai) Co. Ltd., or OSC, as part of our efforts to streamline our manufacturing process and reduce the costs and working capital associated with the testing of our image-sensor products, and relocated our automated image testing equipment from the United States to China. We are currently expanding our testing capabilities with additional automated testing equipment, which will also be located in China. Through our wholly-owned subsidiary, OmniVision Technologies (Shanghai) Co. Ltd., or OTC, we have also constructed research facilities in Shanghai. There are certain administrative, legal and governmental risks to operating in China that could result in increased operating expenses or could hamper us in the development of our operations in China. The risks from operating in China that could increase our operating expenses and adversely affect our operating results, financial condition and ability to deliver our products and grow our business include, without limitation:
- •
- difficulties in staffing and managing foreign operations, particularly in attracting and retaining personnel qualified to
design, sell, test and support our products;
- •
- difficulties in managing employee relations;
- •
- implications of the ongoing general labor disputes in China;
- •
- increases in the value of the Chinese Yuan, or CNY;
- •
- difficulties in coordinating our operations in China with those in California;
- •
- difficulties in enforcing contracts in China;
- •
- difficulties in protecting intellectual property;
29
- •
- diversion of management attention;
- •
- imposition of burdensome governmental regulations;
- •
- difficulties in maintaining uniform standards, controls, procedures and policies across our global operations, including
inventory management and financial consolidation;
- •
- political and economic instability, which could have an adverse impact on foreign exchange rates in Asia and could impair
our ability to conduct our business in China; and
- •
- inadequacy of the local infrastructure to support our operations.
We may experience integration or other problems with potential future acquisitions, which could have an adverse effect on our business or results of operations. New acquisitions could dilute the interests of existing stockholders, and the announcement of new acquisitions could result in a decline in the price of our common stock.
We may acquire, or invest in, businesses that offer products, services and technologies that we believe would complement our products, including CMOS image-sensor manufacturers. We may also make acquisitions of, or investments in, businesses that we believe could expand our distribution channels. Even if we were to announce an acquisition, we may not be able to complete it. In addition, any future acquisition or substantial investment could present numerous risks, including:
- •
- difficulty in realizing the potential technological benefits of the transaction;
- •
- difficulty in integrating the technology, operations or work force of the acquired business with our existing business;
- •
- unanticipated expenses related to technology integration;
- •
- disruption of our ongoing business;
- •
- difficulty in realizing the potential financial or strategic benefits of the transaction;
- •
- difficulty in maintaining uniform standards, controls, procedures and policies;
- •
- possible impairment of relationships with employees, customers, suppliers and strategic partners as a result of
integration of new businesses and management personnel;
- •
- reductions in our future operating results from amortization of intangible assets;
- •
- impairment of resulting goodwill; and
- •
- potential unknown or unexpected liabilities associated with acquired businesses.
We expect that any future acquisitions could include consideration to be paid in cash, shares of our common stock or a combination of cash and our common stock. If and when consideration for a transaction is paid in common stock, it will result in dilution to our existing stockholders.
We may not achieve continued benefits from our joint venture with TSMC.
In October 2003, together with TSMC, we formed VisEra, a joint venture in Taiwan, for the purposes of providing manufacturing services. Since its formation, TSMC and we have expanded the scope of VisEra's activities through the provision of additional funding.
In January 2006, VisEra acquired certain color filter application equipment from TSMC and assumed direct responsibility for providing the color filter application services that had previously been provided to us by TSMC. We expect that VisEra will be able to provide us with a committed supply of high quality manufacturing services at competitive prices. However, there are significant legal, governmental and relationship risks to managing the business scope of VisEra, and we cannot ensure
30
that we will continue to receive the expected benefits from the joint venture. For example, VisEra may not be able to provide manufacturing services that have competitive technology or prices, which could adversely affect our product offerings and our ability to meet customer requirements for our products. In addition, the existence of VisEra may also make it more difficult for us to secure dependable services from competing merchant vendors who provide similar manufacturing services.
We may not achieve all of the anticipated benefits of our alliances with, and strategic investments in, third parties.
We expect to develop our business partly through forming alliances or joint ventures with and making strategic investments in other companies, some of which may be companies at a relatively early stage of development. For example, in April 2003, we made an investment in XinTec, a company that provides chip scale packaging services, and in June 2003 we made an investment in ImPac, a packaging service company. In December 2005, VisEra, our joint venture with TSMC, completed the acquisition of additional shares of XinTec. In May 2007, we acquired a portion of the registered capital of China WLCSP Limited, or WLCSP, a company that also provides chip scale packaging services. In December 2009, Tong Hsing acquired ImPac in a stock-for-stock exchange and we now hold shares in Tong Hsing.
Our investments in these and other companies may negatively impact our operating results, because, under certain circumstances, we are required to recognize our portion of any loss recorded by each of these companies or to consolidate them into our operating results. We expect to continue to utilize partnerships, strategic alliances and investments, particularly those that enhance our manufacturing capacity and those that provide manufacturing services and testing capability. These investments and partnering arrangements are crucial to our ability to grow our business and meet the increasing demands of our customers. However, we cannot ensure that we will achieve the benefits we expect from these alliances. For example, we may not be able to obtain acceptable quality and/or wafer manufacturing yields from these companies, which could result in higher operating costs and could impair our ability to meet customer demand for our products. In addition, certain of these investments or partnering relationships may place restrictions on the scope of our business, the geographic areas in which we can sell our products and the types of products that we can manufacture and sell. For example, our agreement with TSMC provides that we may not engage in business that will directly compete with the business of VisEra. This type of non-competition provision may impact our ability to grow our business and to meet the demands of our customers.
Changes in our relationships with our joint venture and/or companies in which we hold less than a majority interest could change the way we account for such interests in the future.
As part of our strategy, we have formed a joint venture with one of our foundry partners, and we hold equity interests in two other companies from which we purchase certain manufacturing services. For the investments that we account for under the equity method, we record as part of income or expense our share of the increase or decrease in the equity of the companies in which we have invested. It is possible that, in the future, our relationships and/or our interests in or with our joint venture or other investees could change. Such changes have resulted in the past, and could result in the future, in deconsolidation or consolidation of such entities, as the case may be, which could result in changes in our reported results.
We may be unable to adequately protect our intellectual property, and therefore we may lose some of our competitive advantage.
We rely on a combination of patent, copyright, trademark and trade secret laws as well as nondisclosure agreements and other methods to protect our proprietary technologies. We have been issued patents and have a number of pending United States and foreign patent applications. However, we cannot provide assurance that any patent will be issued as a result of any applications or, if issued,
31
that any claims allowed will be sufficiently broad to protect our technology. It is possible that existing or future patents may be challenged, invalidated or circumvented. For example, in August 2002, we initiated a patent infringement action in Taiwan, Republic of China against IC Media Corporation of San Jose, California for infringement of a Taiwanese patent that had been issued to us. In response to our patent infringement action, in October 2002, IC Media Corporation initiated a cancellation proceeding in the Taiwan Intellectual Property Office with respect to our patent. In July 2003, the Taiwan Intellectual Property Office made an initial determination to grant the cancellation of the subject patent, which decision was upheld by the Taiwan Ministry of Economic Affairs and the High Administrative Court. We decided not to appeal such decision by the May 31, 2005 deadline. Although we do not believe the cancellation of the Taiwanese patent at issue in the dispute described above has had a material adverse effect on our business or prospects, there may be other situations where our inability to adequately protect our intellectual property rights could materially and adversely affect our competitive position and operating results. If a third party can copy or otherwise obtain and use our products or technology without authorization, develop corresponding technology independently or design around our patents, this could materially adversely affect our business and prospects. Effective patent, copyright, trademark and trade secret protection may be unavailable or limited in foreign countries. Any disputes over our intellectual property rights, whatever the ultimate resolution of such disputes, may result in costly and time-consuming litigation or require the license of additional elements of intellectual property for a fee.
Litigation regarding intellectual property could divert management attention, be costly to defend and prevent us from using or selling the challenged technology.
In recent years, there has been significant litigation in the United States involving intellectual property rights, including in the semiconductor industry. We have in the past been, currently are and may in the future be, subject to legal proceedings and claims with respect to our intellectual property, including such matters as trade secrets, patents, product liabilities and other actions arising out of the normal course of business. These claims may increase as our intellectual property portfolio becomes larger or more valuable. Intellectual property claims against us, and any resulting lawsuit, may cause us to incur significant expenses, subject us to liability for damages and invalidate our proprietary rights. Any potential intellectual property litigation against us would likely be time-consuming and expensive to resolve and would divert management's time and attention and could also force us to take actions such as:
- •
- ceasing the sale or use of products or services that incorporate the infringed intellectual property;
- •
- obtaining from the holder of the infringed intellectual property a license to sell or use the relevant technology, which
license may not be available on acceptable terms, if at all; or
- •
- redesigning those products or services that incorporate the disputed intellectual property, which could result in substantial unanticipated development expenses and delay and prevent us from selling the products until the redesign is completed, if at all.
If we are subject to a successful claim of infringement and we fail to develop non-infringing intellectual property or license the infringed intellectual property on acceptable terms and on a timely basis, we may be unable to sell some or all of our products, and our operating results could be adversely affected. We may in the future initiate claims or litigation against third parties for infringement of our intellectual property rights or to determine the scope and validity of our proprietary rights or the proprietary rights of competitors. These claims could also result in significant expense and the diversion of technical and management attention.
32
The use of our image sensors in end user products in the medical and automotive industries could result in us being named as a defendant in product liability claims, which could adversely affect our business and reputation.
Our image sensors have been incorporated into certain end user products in the medical and automotive industries, and we expect that they will continue to increase as a percentage of our overall business. The use of the medical and automotive industry products into which our image sensors are designed could result in an unsafe condition, injury, or even death as a result of, among other factors, component failures, manufacturing flaws, design defects or inadequate disclosure of product-related risks or product-related information. These factors could result in product liability claims seeking damages for personal injury, and we could be named as a defendant in such claims. Because the outcome of product liability claims is not predictable and is difficult to assess or quantify, we cannot provide assurance that such claims will not materially adversely affect our business or damage the reputation of our products or our company.
If we do not effectively manage our growth, our ability to increase our revenues and improve our earnings could be adversely affected.
Our growth has placed, and will continue to place, a significant strain on our management and other resources. To manage our growth effectively, we must, among other things:
- •
- continuously improve our operational, financial and accounting systems;
- •
- train, manage and maintain good relations with our existing employee base in both our U.S. and international locations;
- •
- attract and retain qualified personnel with relevant experience; and
- •
- effectively manage accounts receivable and inventory.
For example, our failure to effectively manage our inventory levels could result either in excess inventories, which could adversely affect our gross margins and operating results, or lead to an inability to fill customer orders, which would result in lower sales and could harm our relationships with existing and potential customers.
We must also manage multiple relationships with customers, business partners and other third parties, such as our foundries and process and assembly vendors. Moreover, future growth could significantly overburden our management and financial systems and other resources. We may not make adequate allowances for the costs and risks associated with our expansion. In addition, our systems, procedures or controls may not be adequate to support our operations, and we may not be able to expand quickly enough to capitalize on potential market opportunities. Our future operating results will also depend, in part, on our ability to expand sales and marketing, research and development, accounting, finance and administrative support.
Our future tax rates and tax payments could be higher than we anticipate and may harm our results of operations.
As a multinational corporation, we conduct our business in many countries and are subject to taxation in many jurisdictions. The taxation of our business is subject to the application of multiple and sometimes conflicting tax laws and regulations as well as multinational tax conventions. The application of tax law is subject to legal and factual interpretation, judgment and uncertainty, and tax laws themselves are subject to change. Consequently, taxing authorities may impose tax assessments or judgments against us that could result in a significant charge to our earnings.
A number of other factors will also affect our future tax rate, and certain of these factors could increase our effective tax rate in future periods, which could adversely impact our operating results.
33
These factors include changes in non-deductible share-based compensation, changes in tax laws or the interpretation of tax laws, changes in the proportion and geographic mix of our revenue or earnings, changes in the valuation of our deferred tax assets and liabilities, changes in available tax credits and the repatriation of non-U.S. earnings for which we have not previously provided for U.S. taxes.
Our sales through distributors increase the complexity of our business and may reduce our ability to forecast revenues.
During fiscal 2010 and fiscal 2011, approximately 48.5% and 24.7%, respectively, of our revenues came from sales through distributors. We expect that revenues from sales through distributors will vary from year to year, but will continue to represent a significant proportion of our total revenues. Selling through distributors reduces our ability to accurately forecast sales and increases the complexity of our business, requiring us to, among other matters:
- •
- manage a more complex supply chain;
- •
- manage the level of inventory at each distributor;
- •
- provide for credits, return rights and price protection;
- •
- estimate the impact of credits, return rights, price protection and unsold inventory at distributors; and
- •
- monitor the financial condition and creditworthiness of our distributors.
Any failure to manage these challenges could cause us to inaccurately forecast sales and carry excess or insufficient inventory, thereby adversely affecting our operating results and cash flows.
We face foreign business, political and economic risks, because a majority of our products and those of our customers are manufactured and sold outside of the United States.
We face difficulties in managing our third party foundries, color filter application service providers, packaging and other manufacturing service providers and our foreign distributors, most of whom are located in Asia. In addition, our presence in Asia presents the challenge of managing foreign operations and maintaining good relations with our employees located there. Any political and economic instability in Asia might have an adverse impact on foreign exchange rates and could cause service disruptions for our vendors and distributors and adversely affect our customers.
Sales outside of the United States accounted for substantially all of our revenues for fiscal 2010 and 2011. We anticipate that sales outside of the United States will continue to account for a substantial portion of our revenues in future periods. Dependence on sales to foreign customers involves certain risks, including:
- •
- longer payment cycles;
- •
- the adverse effects of tariffs, duties, price controls or other restrictions that impair trade;
- •
- decreased visibility as to future demand;
- •
- difficulties in accounts receivable collections; and
- •
- burdens of complying with a wide variety of foreign laws and labor practices.
Sales of our products have to date been denominated principally in U.S. dollars. Over the last several years, the U.S. dollar has weakened against most other currencies. Future increases in the value of the U.S. dollar, if any, would increase the price of our products in the currency of the countries in which our customers are located. This may result in our customers seeking lower-priced suppliers, which could adversely impact our operating results. If a larger portion of our international revenues
34
were to be denominated in foreign currencies in the future, we would be subject to increased risks associated with fluctuations in foreign currency exchange rates.
Our business could be harmed if we lose the services of one or more members of our senior management team, or if we are unable to attract and retain qualified personnel.
The loss of the services of one or more of our executive officers or key employees, which has occurred from time to time, or the decision of one or more of these individuals to join a competitor, could adversely affect our business and harm our operating results and financial condition. Our success depends to a significant extent on the continued service of our senior management and certain other key technical personnel. None of our senior management is bound by an employment or non-competition agreement. We do not maintain key man life insurance on any of our employees.
Our success also depends on our ability to identify, attract and retain qualified sales, marketing, finance, management and technical personnel. We have experienced, and may continue to experience, difficulty in hiring and retaining candidates with appropriate qualifications. If we do not succeed in hiring and retaining candidates with appropriate qualifications, our revenues, operations and product development efforts could be harmed.
We substantially completed the implementation of a new enterprise resource planning system, a process which presents a number of significant operational risks.
As our business grows and becomes more complex, it is necessary that we expand and upgrade our enterprise resource planning system, or ERP, and other management information systems which are critical to the operational, accounting and financial functions of our company. We evaluated alternative solutions, both short-term and long-term, to meet the operating, administrative and financial reporting requirements of our business. During the three months ended July 31, 2008, we substantially completed the implementation of a new ERP based on a suite of application software developed by Oracle Corporation. We have made and will continue to make further enhancements and upgrades to the ERP, as necessary. Significant management attention and resources have been used and extensive planning has occurred to support effective implementation of the new ERP system, however, such implementation carries certain risks, including the risk of significant design errors that could materially and adversely affect our operating results and impact our ability to manage our business. As a result, there is a risk that deficiencies may exist in the future and that they could constitute significant deficiencies, or, in the aggregate, a material weakness in internal control over financial reporting.
Our operations may be impaired as a result of disasters, business interruptions or similar events.
Disasters and business interruptions such as earthquakes, water, fire, electrical failure, accidents and epidemics affecting our operating activities, major facilities, and employees' and customers' health could materially and adversely affect our operating results and financial condition. In particular, our Asian operations and most of our third party service providers involved in the manufacturing of our products are located within relative close proximity. Therefore, any disaster that strikes within or close to that geographic area, such as the earthquake and flooding that occurred in China, could be extremely disruptive to our business and could materially and adversely affect our operating results and financial condition. We are currently developing and implementing a disaster recovery plan.
Acts of war and terrorist acts may seriously harm our business and revenue, costs and expenses and financial condition.
Acts of war or terrorist acts, wherever they occur around the world, may cause damage or disruption to our business, employees, facilities, suppliers, distributors or customers, which could significantly impact our revenue, costs, expenses and financial condition. In addition, as a company with
35
significant operations and major distributors and customers located in Asia, we may be adversely impacted by heightened tensions and acts of war that occur in locations such as the Korean Peninsula, Taiwan and China. The potential for future terrorist attacks, the national and international responses to terrorist attacks or perceived threats to national security, and other acts of war or hostility have created many economic and political uncertainties that could adversely affect our business and results of operations in ways that cannot presently be predicted. We are uninsured for losses and interruptions caused by terrorist acts and acts of war.
Risks Related to the Securities Markets and Ownership of Our Common Stock
Provisions in our charter documents and Delaware law, as well as our stockholders' rights plan, could prevent or delay a change in control of our company and may reduce the market price of our common stock.
Provisions of our certificate of incorporation and bylaws may discourage, delay or prevent a merger or acquisition that a stockholder may consider favorable. These provisions include:
- •
- adjusting the price, rights, preferences, privileges and restrictions of preferred stock without stockholder approval;
- •
- providing for a classified board of directors with staggered, three-year terms;
- •
- requiring supermajority voting to amend some provisions in our certificate of incorporation and bylaws;
- •
- limiting the persons who may call special meetings of stockholders; and
- •
- prohibiting stockholder actions by written consent.
Provisions of Delaware law also may discourage, delay or prevent another company from acquiring or merging with us. Our board of directors adopted a preferred stock rights agreement in August 2001. Pursuant to the rights agreement, our board of directors declared a dividend of one right to purchase one one-thousandth share of our Series A Participating Preferred Stock for each outstanding share of our common stock. The dividend was paid on September 28, 2001 to stockholders of record as of the close of business on that date. Each right entitles the registered holder to purchase from us one one-thousandth of a share of Series A Preferred at an exercise price of $176.00, subject to adjustment. The exercise of the rights could have the effect of delaying, deferring or preventing a change of control of our company, including, without limitation, discouraging a proxy contest or making more difficult the acquisition of a substantial block of our common stock. The rights agreement could also limit the price that investors might be willing to pay in the future for our common stock.
Our stock has been and will likely continue to be subject to substantial price and volume fluctuations due to a number of factors, many of which are beyond our control that may prevent our stockholders from selling our common stock at a profit.
The market price of our common stock has fluctuated substantially, and there can be no assurance that such volatility will not continue. Since the beginning of fiscal 2002 through June 24, 2011, the closing sales price of our common stock has ranged from a high of $36.42 per share to a low of $1.26 per share. The closing sales price of our common stock on June 24, 2011 was $31.07 per share. The securities markets have experienced significant price and volume fluctuations in the past, and the market prices of the securities of semiconductor companies have been especially volatile. This market volatility, as well as general economic, market or political conditions, including the current global economic situation, could reduce the market price of our common stock in spite of our operating
36
performance. The market price of our common stock may fluctuate significantly in response to a number of factors, including:
- •
- actual or anticipated fluctuations in our operating results;
- •
- changes in expectations as to our future financial performance;
- •
- changes in financial estimates of securities analysts;
- •
- release of lock-up or other transfer restrictions on our outstanding shares of common stock or sales of
additional shares of common stock;
- •
- sales or the perception in the market of possible sales of shares of our common stock by our directors, officers,
employees or principal stockholders;
- •
- changes in market valuations of other technology companies; and
- •
- announcements by us or our competitors of significant technical innovations, design wins, contracts, standards or acquisitions.
Due to these factors, the price of our stock may decline and investors may be unable to resell their shares of our stock for a profit. In addition, the stock market experiences extreme volatility that often is unrelated to the performance of particular companies. These market fluctuations may cause our stock price to decline regardless of our performance.
ITEM 1B. UNRESOLVED STAFF COMMENTS
None.
Our principal offices are located in a complex of four buildings in Santa Clara County, California, or the Santa Clara Property, totaling approximately 207,000 square feet which we purchased for an aggregate price of approximately $37.5 million. Please see "Item 7—Management's Discussion and Analysis of Financial Condition and Results of Operations—Liquidity and Capital Resources—Liquidity" on page 63 below for a description of the Loan and Security Agreement, Deed of Trust, Assignment of Rents and Leases, Security Agreement and Fixture, and Stock Pledge Agreement that we entered into in connection with the purchase of this property.
In January 2007, we entered into a Land-Use-Right Purchase Agreement, or the Purchase Agreement, with the Construction and Transportation Commission of the Pudong New District, Shanghai through our wholly-owned subsidiary, OTC. The Purchase Agreement has an effective date of December 31, 2006. Under the terms of the Purchase Agreement, we agreed to pay an aggregate amount of approximately $0.6 million, or the Purchase Price, in exchange for the right to use approximately 323,000 square feet of land located in Shanghai for a period of 50 years. As of April 30, 2011, the construction of a research facility on the land was complete, in accordance with the Purchase Agreement. The Company obtained a fixed asset loan in the principal amount of approximately $20.5 million based on the exchange rate in effect at the time of the loan origination, or the Construction Loan, to finance the construction. (See Note 8—"Borrowing Arrangements and Related Derivative Instruments".)
In December 2000, our Chinese subsidiary, OSC, entered into an agreement to lease 447,400 square feet of land in Shanghai, China on which we have built a facility that is currently used for product testing and may possibly be used for other activities in the future. This lease agreement expires in December 2051.
37
We believe that our existing or readily available facilities are suitable and adequate for our present purposes.
From time to time, we have been subject to legal proceedings and claims with respect to such matters as patents, product liabilities and other actions arising out of the normal course of business.
On November 29, 2001, a complaint captioned McKee v. OmniVision Technologies, Inc., et. al., Civil Action No. 01 CV 10775, was filed in the United States District Court for the Southern District of New York against us, some of our directors and officers, and various underwriters for our initial public offering. Plaintiffs generally allege that the defendants violated federal securities laws because the prospectus related to our offering failed to disclose, and contained false and misleading statements regarding, certain commissions purported to have been received by the underwriters, and other purported underwriter practices in connection with their allocation of shares in our offering. The complaint seeks unspecified damages on behalf of a purported class of purchasers of our common stock between July 14, 2000 and December 6, 2000. Substantially similar actions have been filed concerning the initial public offerings for more than 300 different issuers, and the cases have been coordinated as In re Initial Public Offering Securities Litigation, 21 MC 92. On February 19, 2003, the Court issued an order dismissing all claims against us except for a claim brought under Section 11 of the Securities Act of 1933.
The parties have reached a global settlement of the coordinated litigation. Under the settlement, the insurers will pay the full amount of settlement share allocated to us, and we will bear no financial liability. Our company and the other defendants will receive complete dismissals from the case. In 2009, the Court entered an order granting final approval of the settlement. Certain objectors filed appeals. A number of those appeals were dismissed. In May 2011, the appellate court issued an order remanding the remaining appeals to the district court for further determinations. If for any reason the settlement does not become effective, and litigation against us proceeds, we believe that we have meritorious defenses to plaintiffs' claims and intend to defend the action vigorously.
On October 12, 2007, a purported stockholder of ours filed a complaint against certain of our underwriters for our initial public offering. The complaint, Vanessa Simmonds v. Bank of America Corporation, et al., Case No. C07-1668, filed in District Court for the Western District of Washington, makes similar allegations to those made in In re Initial Public Offering Securities Litigation and seeks the recovery of short-swing trading profits under Section 16(b) of the Securities Exchange Act of 1934. We are named as a nominal defendant, and no recovery was sought from it. The plaintiff filed an amended complaint in February 2008. On March 12, 2009, the Court granted the motion to dismiss without prejudice, filed by 30 of the issuer defendants and the motion to dismiss with prejudice, filed by all of the underwriter defendants, which included the suit against us. The plaintiff timely appealed the Court's Order to the United States Court of Appeals for the Ninth Circuit. On December 3, 2010, the Ninth Circuit entered its opinion and order in this matter. The Court affirmed the dismissal of the suits against the 30 moving issuer defendants on the grounds that the demand letters sent to those issuers were inadequate under Delaware law, and converted the dismissals from without prejudice to with prejudice. The Court also reversed the dismissal of the suits against the remaining 24 issuer defendants, including us, but is allowing those issuer defendants, including us, to challenge the adequacy of the demand letters that the plaintiff sent to the issuers before filing suit. On January 24, 2011, the underwriter defendants filed a motion to stay the Ninth Circuit's mandate pending its filing of a petition for a writ of certiorari in the United States Supreme Court. On January 25, 2011, the Ninth Circuit granted the motion and entered an Order staying the mandate for ninety days. On January 26, 2011, plaintiff also filed a motion to join the underwriters' motion to stay the Ninth Circuit's mandate on the grounds that plaintiff also will be filing a petition for a writ of certiorari in the United States
38
Supreme Court. The petitions for a writ of certiorari have not yet been filed with the United States Supreme Court. No discovery has taken place.
At the end of May 2009, plaintiff sent a Demand for Inspection of Books and Records to certain of the nominal defendants named in the Section 16(b) litigation seeking the companies to produce any tolling agreements entered into with the companies' respective underwriters. Plaintiff's counsel has agreed to an open-ended extension for certain nominal defendants who received such a demand. As of the date of this filing, we have not received a demand for inspection of books and records from the plaintiff.
On March 6, 2009, Panavision Imaging, LLC, or Panavision, filed a complaint against us alleging patent infringement in the District Court for the Central District of California. The case is entitled Panavision Imaging, LLC v. OmniVision Technologies, Inc., Canon U.S.A., Inc., Micron Technology, Inc. and Aptina Imaging Corporation, Case No. CV09-1577. In its complaint, Panavision asserts that we make, have made, use, sell and/or import products that infringe U.S. Patent Nos. 6,818,877 ("Pre-charging a Wide Analog Bus for CMOS Image Sensors"), 6,663,029 ("Video Bus for High Speed Multi-resolution Imagers and Method Thereof") and 7,057,150 ("Solid State Imager with Reduced Number of Transistors per Pixel"). The complaint seeks unspecified monetary damages, fees and expenses and injunctive relief against us. On April 19, 2010, the court stayed the case pending reexamination of all of the asserted patents, as the U.S. Patent and Trademark Office has granted reexamination requests for all of the asserted claims of the asserted patents. On October 22, 2010, the U.S. Patent and Trademark Office issued an Action Closing Prosecution of the inter partes reexamination of U.S. Patent No. 6,818,877 and confirmed the four claims submitted for inter partes reexamination by co-defendants Micron Technology, Inc. and Aptina Imaging Corporation. On December 13, 2010, the Court lifted the stay as to U.S. Patent No. 6,818,877. On February 7, 2011, the Court issued a Markman order with respect to U.S. Patent No. 6,818,877, and granted summary judgment of invalidity for indefiniteness for all of the asserted claims of U.S. Patent No. 6,818,877. On February 22, 2011, Panavision filed its Final Infringement Contentions, conceding that our products do not infringe U.S. Patent No. 6,818,877 because every claim contains what the Court has held to be an indefinite term. On April 11, 2011, the Court directed the parties to file supplemental briefs regarding whether all of the asserted claims of U.S. Patent No. 6,818,877 are invalid for indefiniteness. On May 31, 2011, the Court conducted a hearing on the invalidity issue to determine whether it should reconsider its order of summary judgment of invalidity.
As to the two remaining asserted patents, on November 29, 2010, the U.S. Patent and Trademark Office issued an Action Closing Prosecution of the inter partes reexamination of U.S. Patent No. 7,057,150 and rejected all of the claims submitted for inter partes reexamination. On January 5, 2011, the U.S. Patent and Trademark Office issued an Action Closing Prosecution of the inter partes reexamination of U.S. Patent No. 6,663,029 and rejected all of the claims submitted for inter partes reexamination. As a result, all of the asserted claims of the asserted patents are held to be invalid by the Court or the U.S. Patent and Trademark Office. At this time, we cannot estimate any possible loss or predict whether this matter will result in any material expense to us.
On December 6, 2010, Ziptronix, Inc., or Ziptronix, filed a complaint alleging patent infringement against us in the District Court for the Northern District of California. The case is entitled Ziptronix, Inc. v. OmniVision Technologies, Inc., Taiwan Semiconductor Manufacturing Company Ltd., and TSMC North America Corp., Case No. CV10-05525. In its complaint, Ziptronix asserts that we have made, used, offered to sell, sold and/or imported into the United States image sensors that infringe U.S. Patent Nos. 7,387,944 ("Method for Low Temperature Bonding and Bonded Structure"), 7,335,572 ("Method for Low Temperature Bonding and Bonded Structure"), 7,553,744 ("Method for Low Temperature Bonding and Bonded Structure"), 7,037,755 ("Three Dimensional Device Integration Method and Integrated Device"), 6,864,585 ("Three Dimensional Device Integration Method and Integrated Device"), and 7,807,549 ("Method for Low Temperature Bonding and Bonded Structure").
39
The complaint seeks unspecified monetary damages, enhanced damages, interest, fees, expenses, costs, and injunctive relief against us. We answered the complaint on May 4, 2011 and denied each of Ziptronix's infringement claims against us. We expect to vigorously defend ourselves against Ziptronix's allegations. At this time, we cannot estimate any possible loss or predict whether this matter will result in any material expense to us.
40
ITEM 5. MARKET FOR REGISTRANT'S COMMON EQUITY, RELATED STOCKHOLDER MATTERS AND ISSUER PURCHASES OF EQUITY SECURITIES
Price Range of Common Stock
Our common stock has been quoted on the NASDAQ Global Market under the symbol "OVTI" since our initial public offering in July 2000. Prior to that time, there was no public market for our common stock. The following table sets forth for the periods indicated the high and low sale prices per share of our common stock as reported on the NASDAQ Global Market.
| |
High | Low | ||||||
|---|---|---|---|---|---|---|---|---|
Fiscal 2011: |
||||||||
First quarter |
$ | 25.50 | $ | 16.19 | ||||
Second quarter |
27.13 | 19.41 | ||||||
Third quarter |
32.63 | 25.83 | ||||||
Fourth quarter |
36.19 | 22.87 | ||||||
Fiscal 2010: |
||||||||
First quarter |
$ | 13.46 | $ | 8.20 | ||||
Second quarter |
17.48 | 11.81 | ||||||
Third quarter |
15.88 | 11.70 | ||||||
Fourth quarter |
19.42 | 12.12 | ||||||
On June 24, 2011, the reported last sale price of our common stock on the NASDAQ Global Market was $31.07 per share. As of June 24, 2011, there were approximately 55 holders of record of our common stock. This number does not include stockholders whose shares are held in trust by other entities. The actual number of stockholders is greater than this number of holders of record. We estimate that the number of beneficial stockholders of the shares of our common stock as of June 24, 2011 was approximately 31,000.
Securities Authorized for Issuance under Equity Compensation Plans
Please see Note 13—"Employee Stock Purchase, Equity Incentive and Stock Option Plans," of the notes to our consolidated financial statements for a discussion of equity awards outstanding and available for grant under our equity compensation plans.
Dividend Policy
We have never declared or paid cash dividends on our capital stock. We currently expect to retain our future earnings, if any, for use in the operation and expansion of our business and do not anticipate paying any cash dividends in the next 12 months.
Purchases of Equity Securities by the Issuer and Affiliated Purchasers
None.
41
Performance Graph
Notwithstanding any statement to the contrary in any of our previous or future filings with the SEC, the following information relating to the price performance of our common stock shall not be deemed "filed" with the SEC or "Soliciting Material" under the Securities Exchange Act of 1934, as amended, or subject to Regulation 14A or 14C, or to liabilities of Section 18 of the Exchange Act except to the extent we specifically request that such information be treated as soliciting material or to the extent we specifically incorporate this information by reference.
The following is a line graph comparing the cumulative total return to stockholders of our common stock at April 30, 2011 since April 30, 2006, to the cumulative total return over such period of (i) The NASDAQ Composite Index and (ii) the S&P Semiconductors Index.
COMPARISON OF 5 YEAR CUMULATIVE TOTAL RETURN*
Among OmniVision Technologies, Inc., the NASDAQ Composite Index
and the S&P Semiconductors Index
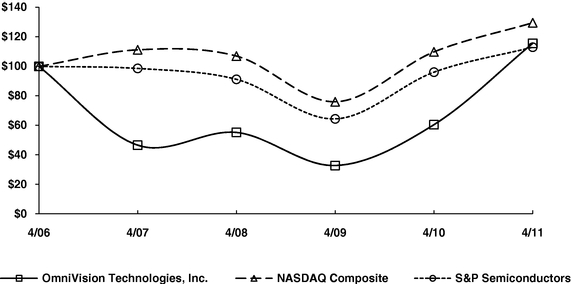
*$100 invested on 4/30/06 in stock or index, including reinvestment of dividends. Fiscal years ended April 30.
| |
4/06 | 4/07 | 4/08 | 4/09 | 4/10 | 4/11 | |||||||||||||
|---|---|---|---|---|---|---|---|---|---|---|---|---|---|---|---|---|---|---|---|
OmniVision Technologies, Inc. |
100.00 | 46.54 | 55.22 | 32.74 | 60.44 | 115.63 | |||||||||||||
NASDAQ Composite |
100.00 | 111.24 | 107.01 | 75.98 | 109.83 | 129.57 | |||||||||||||
S&P Semiconductors |
100.00 | 98.63 | 91.26 | 64.39 | 96.10 | 113.03 | |||||||||||||
- *
- Assumes that $100.00 was invested on April 30, 2006 in our common stock and in the NASDAQ Composite Index and the S&P Semiconductor Index, and that all dividends were reinvested. No dividends have been declared on our common stock. Stockholder returns over the indicated period should not be considered indicative of future stockholder returns.
42
ITEM 6. SELECTED FINANCIAL DATA
| |
Year Ended April 30, | |||||||||||||||||
|---|---|---|---|---|---|---|---|---|---|---|---|---|---|---|---|---|---|---|
| |
2011 | 2010 | 2009(1) | 2008(1)(2) | 2007(1)(3) | |||||||||||||
| |
(in thousands, except per share data) |
|||||||||||||||||
Consolidated Statements of Operations data: |
||||||||||||||||||
Revenues |
$ | 956,476 | $ | 602,991 | $ | 507,316 | $ | 799,628 | $ | 528,143 | ||||||||
Cost of revenues |
678,459 | 457,646 | 389,434 | 593,377 | 372,776 | |||||||||||||
Gross profit |
278,017 | 145,345 | 117,882 | 206,251 | 155,367 | |||||||||||||
Operating expenses: |
||||||||||||||||||
Research, development and related |
88,519 | 77,311 | 84,881 | 79,369 | 67,570 | |||||||||||||
Selling, general and administrative |
62,817 | 61,549 | 62,585 | 62,228 | 58,674 | |||||||||||||
Amortization of acquired patent portfolio |
774 | — | — | — | — | |||||||||||||
Goodwill impairment |
— | — | 7,541 | — | — | |||||||||||||
Litigation settlement, net of recovery of $13,000 |
— | — | — | — | 3,300 | |||||||||||||
Total operating expenses |
152,110 | 138,860 | 155,007 | 141,597 | 129,544 | |||||||||||||
Income (loss) from operations |
125,907 | 6,485 | (37,125 | ) | 64,654 | 25,823 | ||||||||||||
Interest income (expense), net |
(1,150 | ) | (774 | ) | 2,069 | 12,128 | 14,580 | |||||||||||
Other income (expense), net |
3,918 | 4,575 | (3,171 | ) | (691 | ) | (1,285 | ) | ||||||||||
Income (loss) before income taxes |
128,675 | 10,286 | (38,227 | ) | 76,091 | 39,118 | ||||||||||||
Provision for (benefit from) income taxes |
4,225 | 3,883 | (158 | ) | 11,049 | 9,392 | ||||||||||||
Net income (loss) |
124,450 | 6,403 | (38,069 | ) | 65,042 | 29,726 | ||||||||||||
Net income (loss) attributable to noncontrolling interest |
(32 | ) | (321 | ) | (746 | ) | (33 | ) | 5,753 | |||||||||
Net income (loss) attributable to OmniVision Technologies, Inc. |
$ | 124,482 | $ | 6,724 | $ | (37,323 | ) | $ | 65,075 | $ | 23,973 | |||||||
Net income (loss) per share attributable to OmniVision Technologies, Inc. common stockholders: |
||||||||||||||||||
Basic |
$ | 2.25 | $ | 0.13 | $ | (0.74 | ) | $ | 1.20 | $ | 0.44 | |||||||
Diluted |
$ | 2.11 | $ | 0.13 | $ | (0.74 | ) | $ | 1.19 | $ | 0.43 | |||||||
Shares used in computing net income (loss) per share attributable to OmniVision Technologies, Inc. common stockholders: |
||||||||||||||||||
Basic |
55,324 | 51,080 | 50,523 | 54,401 | 54,706 | |||||||||||||
Diluted |
59,106 | 52,689 | 50,523 | 54,767 | 55,234 | |||||||||||||
43
| |
April 30, | |||||||||||||||
|---|---|---|---|---|---|---|---|---|---|---|---|---|---|---|---|---|
| |
2011 | 2010 | 2009 | 2008 | 2007 | |||||||||||
| |
(in thousands) |
|||||||||||||||
Consolidated Balance Sheet data: |
||||||||||||||||
Cash and cash equivalents |
$ | 379,379 | $ | 234,023 | $ | 257,808 | $ | 217,340 | $ | 190,878 | ||||||
Working capital |
582,052 | 433,262 | 380,303 | 413,696 | 357,027 | |||||||||||
Total assets |
1,034,158 | 797,693 | 666,931 | 718,346 | 688,059 | |||||||||||
Total current liabilities |
148,919 | 119,940 | 52,351 | 86,355 | 158,685 | |||||||||||
Long-term income taxes payable |
87,526 | 90,626 | 81,266 | 78,031 | — | |||||||||||
Non-current portion of long-term debt |
41,916 | 45,428 | 32,867 | 32,830 | 27,576 | |||||||||||
Retained earnings |
394,735 | 270,253 | 263,529 | 300,852 | 240,084 | |||||||||||
Total OmniVision Technologies, Inc. stockholders' equity(1) |
$ | 751,325 | $ | 533,582 | $ | 488,841 | $ | 509,731 | $ | 490,456 | ||||||
- (1)
- On
May 1, 2009, we adopted the provisions of authoritative guidance for noncontrolling interests. All prior periods have been retrospectively
adjusted due to the adoption.
- (2)
- On
May 1, 2007, we adopted the provisions of authoritative guidance to account for uncertainty in income taxes.
- (3)
- On May 1, 2006, we adopted the provisions of authoritative guidance for recording stock-based compensation.
44
ITEM 7. MANAGEMENT'S DISCUSSION AND ANALYSIS OF FINANCIAL CONDITION AND
RESULTS OF OPERATIONS
The following information should be read in conjunction with our audited consolidated financial statements and the notes thereto included in Item 8 of this Annual Report on Form 10-K.
Overview
We design, develop and market high performance, highly integrated and cost-efficient semiconductor image-sensor devices. Our main products, image-sensing devices which we refer to as CameraChip image sensors, capture an image electronically and are used in a number of consumer and commercial mass-market applications. Our CameraChip image sensors are manufactured using the CMOS fabrication process and are predominantly single-chip solutions that integrate several distinct functions including image capture, image processing, color processing, signal conversion and output of a fully processed image or video stream. We have also integrated our image sensors with wafer-level optics, which we refer to as CameraCube imaging devices. Our CameraCube imaging device is a small footprint, total camera solution that we believe will enable the further miniaturization of camera products. We believe that our highly integrated image sensors and imaging devices enable camera device manufacturers to build high quality camera products that are smaller, less complex, more reliable, more cost-effective and more power-efficient than cameras using traditional CCDs.
Current Economic Environment
We operate in a challenging economic environment that has undergone significant changes in technology and in patterns of global trade. We remain a leader in the development and marketing of image sensing devices based on the CMOS fabrication process and have benefited from the growing market demand for and acceptance of this technology.
Beginning with the second half of our fiscal 2009, general domestic and global economic conditions were negatively impacted by several factors. These economic conditions resulted in our facing one of the most challenging periods in our history.
During the latter part of fiscal 2010 and throughout fiscal 2011, we saw indications that suggest certain major economies are returning to positive growth. Our quarterly sales improved throughout fiscal 2011 as compared to fiscal 2010 and fiscal 2009. We believe that demand for our products will continue to remain strong for fiscal 2012. However, it is uncertain whether the current resumption of economic growth will be sustained. If the economic recovery slows down or even dissipates, our business, financial condition, results of operations and cash flows could be materially and adversely affected.
Market Environment
We sell our products worldwide directly to OEMs which include branded customers and contract manufacturers, and VARs and indirectly through distributors. In order to ensure that we address all available markets for our image sensors, we organize our marketing efforts into end-use market groups, each of which concentrates on a particular product or, in some cases, customer within a product group. Thus we have marketing teams that address the mobile phone market, the notebook and webcam market, the DSC market, the security and surveillance market, the entertainment market, and the automotive and medical markets.
In the mobile phone market in particular, future revenues depend to a large extent on design wins where, on the basis of an exhaustive evaluation of available products, a particular mobile phone maker determines which image sensor to design into one or more specific models. The time lag between
45
ITEM 7. MANAGEMENT'S DISCUSSION AND ANALYSIS OF FINANCIAL CONDITION AND
RESULTS OF OPERATIONS—(Continued)
design win and volume shipments varies from as little as three months to as much as 12 months, which could cause an unexpected delay in generating revenues, especially during periods of product transitions. Design wins are also an important driver in the many other markets that we address, and in some cases, such as automotive or medical applications, the time lag between a particular design win and revenue generation can be longer than one year.
The overwhelming majority of our sales depend on decisions by the engineering designers for manufacturers of products that incorporate image sensors to specify one of our products rather than one made by a competitor. In most cases, the decision to specify a particular image sensor requires conforming other specifications of the product to the chosen image sensor and makes subsequent changes both difficult and expensive. Accordingly, the ability to timely produce and deliver reliable products in large quantities is a key competitive differentiator. Since our inception, we have shipped more than 2.5 billion image sensors, including approximately 680 million in fiscal 2011. We believe that these quantities demonstrate the continuing capabilities of our production system, including our sources of offshore fabrication.
We outsource the wafer fabrication and packaging of our image-sensor products to third parties. We outsource the color filter and micro-lens phases of production to an investee joint venture company. With our CameraCube products, we also collaborated with the industry's leading wafer-level lens suppliers, and outsourced the assembly process. This approach allows us to focus our resources on the design, development, marketing and testing of our products and significantly reduces our capital requirements.
To increase and enhance our production capabilities, we work closely with TSMC, our principal wafer supplier and one of the largest wafer fabrication companies in the world, to increase, as necessary, the number of its fabrication facilities at which our products can be produced. VisEra, our joint venture with TSMC, and our investments in three key back-end packaging suppliers are part of a broad strategy to ensure that we have sufficient back-end capacity for the processing of our image sensors in the various formats required by our customers.
We currently perform the final testing of the majority of our products at our own facility in China. As necessary, we will make further investments to expand our testing and production capacity, as well as our overall capability to design additional custom products for our customers.
Since our end-user customers market and sell their products worldwide, our revenues by geographic location are not necessarily indicative of the geographic distribution of end-user sales, but rather indicate where the products and/or their components are manufactured or sourced. The revenues we report by geography are based on the country or region in which our customers issue their purchase orders to us.
Many of the products using our image sensors, such as mobile phones, notebook and webcams, DSCs and cameras for entertainment applications, are consumer electronics goods. These mass-market camera devices generally have seasonal cycles which historically have caused the sales of our customers to fluctuate quarter-to-quarter. In addition, since a very large number of the manufacturers who use our products are located in China, Hong Kong and Taiwan, the pattern of demand for our image sensors has been increasingly influenced by the timing of the extended lunar or Chinese New Year holiday, a period in which the factories which use our image sensors generally close. Consequently, demand for our image sensors has historically been stronger in the second and third quarters of our fiscal year and weaker in the first and fourth quarters of our fiscal year. However, due to the global economic downturn, we experienced weaker than normal conditions in all of our markets in the third
46
ITEM 7. MANAGEMENT'S DISCUSSION AND ANALYSIS OF FINANCIAL CONDITION AND
RESULTS OF OPERATIONS—(Continued)
and fourth quarters of fiscal 2009. With the return to profitability in our business since the second fiscal quarter of 2010, we believe the historical seasonal cycle to our business has returned.
We believe that the market opportunity represented by mobile phones remains very large, although the opportunities presented could be deferred because of the uncertainty surrounding the sustainability of the current global economic recovery. We also believe that, like the DSC market, mobile phone, notebook, tablet and webcam demand will not only continue to shift toward higher resolutions, but also will increasingly fragment into multiple market segments with differing product attributes. For example, we see the further expansion of the smartphone segment within the mobile phone market. In addition, there is increased demand for customization, and several different interface standards are coming to maturity. All of these trends will require the development of an increasing variety of products.
As the markets for image sensors have grown, we have experienced competition from manufacturers of CMOS and CCD image sensors. Our principal competitors in the market for CMOS image sensors include Aptina Imaging, Samsung, Sharp, Sony, STMicroelectronics and Toshiba. We expect to see continued price competition in the image-sensor market for mobile phones, notebooks and webcams, security and surveillance systems, digital still and video cameras, entertainment devices, automotive and medical imaging systems as those markets continue to grow. Although we believe that we currently compete effectively in those markets, our competitive position could be impaired by companies that have greater financial, technical, marketing, manufacturing and distribution resources, broader product lines, better access to large customer bases, greater name recognition, longer operating histories and more established strategic and financial relationships than we do. Such companies may be able to adapt more quickly to new or emerging technologies and customer requirements or devote greater resources to the promotion and sale of their products. Many of these competitors own and operate their own fabrication facilities, which in certain circumstances may give them the ability to price their products more aggressively than we can or may allow them to respond more rapidly than we can to changing market opportunities.
In addition, from time to time, other companies enter the CMOS image-sensor market by using obsolete and available manufacturing equipment. While these efforts have rarely had any long-term success, the new entrants do sometimes manage to gain market share in the short-term by pricing their products significantly below current market levels which puts additional downward pressure on the prices we can obtain for our products.
In common with many other semiconductor products and as a response to competitive pressures, the ASPs of image-sensor products have declined steadily since their introduction, and we expect ASPs to continue to decline in the future. Some of this ASP decline may be offset by the adoption of some of our newer and higher resolution products. We introduced our CameraCube products in February 2009. Depending on the adoption rate and unit volume, we believe these products may also mitigate the rate of ASP decline. In order to maintain our gross margins, we and our suppliers must work continuously to lower our manufacturing costs and increase our production yields, and in order to maintain or grow our revenues, we need to increase the number of units we sell by a large enough amount to offset the effect of declining ASPs. In addition, if we are unable to timely introduce new products that can take advantage of smaller process geometries or new products that incorporate more advanced technology and include more advanced features that can be sold at higher ASPs, our gross margin may decline.
Recently, the entire semiconductor industry, including us, has experienced supply constraints. Due to the lack of availability of products, supply constraints have forced companies in the industry to be unable to meet the product demands of their customers and to take certain actions such as allocating
47
ITEM 7. MANAGEMENT'S DISCUSSION AND ANALYSIS OF FINANCIAL CONDITION AND
RESULTS OF OPERATIONS—(Continued)
available products among their customers or, in some cases, increasing the prices of their products. This results in harm to customer relations, the loss of sales to customers and, in some cases, the loss of future business with those customers. We have faced, and continue to face, these same challenges as we seek to meet our customers' increasing demand for more of our products. Despite these challenges, through careful strategic planning relating to our products and the technologies that we deliver to market, we have been able to achieve revenue growth and unit growth. However, if our customers' demand remains at current levels or continues to increase, we will experience even greater challenges related to supply constraints and may be unable to achieve future growth, which could result in our revenues, gross margins and other financial results being materially and adversely affected.
Given the rapidly changing nature of our technology, there can be no assurance that we will not encounter delays or other unexpected yield issues with future products. During the early stages of production, production yields and gross margins for new products are typically lower than those of established products. We can encounter unexpected manufacturing issues, such as unexpected back-end yield problems. In addition, in preparation for new product introductions, we gradually decrease production of established products. Due to our 12-14 week production cycle, it is extremely difficult to predict precisely how many units of established products we will need. It is also difficult to accurately predict the speed of the ramp of new products. Given the current economic uncertainty, the visibility of our business outlook is extremely limited and forecasting is even more difficult than under normal market conditions. As a result, it is possible that we could suffer from shortages of certain products and build inventories in excess of demand for other products. We carefully consider the risk that our inventories may be in excess of expected future demand and record appropriate reserves. If, as sometimes happens, we are subsequently able to sell these reserved products, the sales have little or no associated cost and consequently, they have a favorable impact on gross margins.
Strategy
Our strategic goal is to provide and deliver improved image-centric technologies and solutions to our customers, and to develop and make available a full range of innovative and cross-functional imaging products to all the markets. The most important elements of our strategy are the following:
Maintain Technology Leadership. We intend to maintain our position as a leader in CMOS image-sensor technology by continuing to develop our expertise in mixed-signal implementation, advanced pixel design, feature integration, and manufacturing processes and controls, including automated testing. Our image sensor integrates both the image sensor and the signal processor into a single chip, often eliminating the requirement for a separate DSP. As a result, our CameraChip image sensors offer camera device manufacturers advantages in terms of size, power consumption, cost and ease of design. For example, in May 2008, we announced our OmniBSI architecture, which is the enabling technology behind our current 1.4 µm pixel. In February 2010, we announced our OmniBSI-2 architecture, which forms the basis of our even smaller and more advanced 1.1 µm pixel. We are continuing to develop products using still narrower geometries. We have successfully developed image sensor technology from 100,000 pixels to 14.6 megapixels, underscoring our ability to deliver a wide range of solutions to address changing market demands. We are committed to continue increasing image quality and to reducing the overall size of the image sensor's array.
The OmniBSI and OmniBSI-2 architectures are based on BSI technology. All traditionally designed CMOS image sensors capture light on the front side of the chip, so the photo-sensitive portion has to share the surface of the sensor with the metal wiring of the transistors in the pixel. With our OmniBSI and OmniBSI-2 architectures, the sensor receives light through the back side of the chip.
48
ITEM 7. MANAGEMENT'S DISCUSSION AND ANALYSIS OF FINANCIAL CONDITION AND
RESULTS OF OPERATIONS—(Continued)
Not only does this enable us to produce a superior image, it also permits the front of chip surface area to be devoted entirely to processing, and permits an increase in the number of metal layers, both of which result in greater functionality. Another advantage of capturing light on the back side of the image sensor is that we reduce the distance the light has to travel to the pixels, and thus provide a wider angle of light acceptance. Widening the angle of acceptance in turn makes it possible to reduce the height of the camera module, and thus the height of the device which incorporates the camera.
Our introduction of wafer-level optics to our product offerings is another example of our intention to continue to develop new and innovative technologies. Our CameraCube technology is a three-dimensional, reflowable, total camera solution that combines the full functionality of our image sensors with wafer-level optics in one compact, small-footprint package. We recently entered into an agreement with VisEra to acquire from VisEra its wafer-level lens production operations to enhance our CameraCube production capabilities.
Our commitment to maintaining our technology leadership is also reflected in our acquisition of a CMOS sensor patent portfolio from Kodak in March 2011. We effectively doubled the size of our patent portfolio. As of April 30, 2011, we have been issued 401 United States patents and 430 foreign patents.
Leverage Expertise Across Multiple Mass-Market Applications. We intend to continue to focus on developing our image sensors for multiple mass-market applications. To date we have shipped more than two billion image sensors. As the demand for camera functionality increases in our principal markets and becomes a standard feature in a wider variety of consumer, commercial and industrial applications, we expect that additional markets will emerge. In the past, we have leveraged our expertise in certain end-markets to expand into emerging mass-market applications for our image sensors. For example, we used the expertise we developed in mobile phone markets to develop image sensors for notebook computers. Other markets and applications we are focusing on include security and surveillance, entertainment devices, and the multiple opportunities in automotive and medical applications.
Increase Our Market Presence. We intend to increase our visibility and penetration into new product designs by collaborating with OEMs, VARs and distributors and by entering into partnerships with other companies that offer complementary and supporting technologies. In certain instances we will provide design services to our contract manufacturing partners, enabling them to increase their overall value added through the production of highly tailored end products, which we believe will increase the likelihood that they will recommend the use of our products to branded manufacturers. In addition, we will partner with companies that offer complementary and supporting technologies to integrate our products with theirs for use in the reference designs that they promote to manufacturers. As a result, we believe that we are able to provide our customers with valuable design and marketing references. We also see a developing trend for video-centric applications in the consumer markets. Consequently, we acquired Aurora and its advanced image projection technology, which we believe we can leverage to offer innovative and comprehensive imaging solutions to OEMs as they design their next generation products.
Further Develop Close Customer Relationships. We intend to enhance our customer relationships by continuing to collaborate with our customers on the design and specification of their products. We work with customers during various stages of their product development cycles, including strategic decision-making, new product design and replacement design to help them develop a logical technology migration path and to ensure that our products meet their future design needs. By working closely with
49
ITEM 7. MANAGEMENT'S DISCUSSION AND ANALYSIS OF FINANCIAL CONDITION AND
RESULTS OF OPERATIONS—(Continued)
our customers, we believe we can better anticipate their future design needs and increase the likelihood that they will incorporate our image sensors into their products.
Our Solution
We specifically design our highly integrated image sensors to be cost-effective and to provide high image quality. By integrating a number of distinct functions onto a single CMOS chip, including image capture, image processing, color processing, signal conversion and output of images for either digital or analog equipment, our image sensors offer camera device manufacturers a number of benefits, including:
High Image Quality and Resolution. We have developed a number of proprietary methods for enhancing image quality by increasing our image sensors' sensitivity to light and significantly improving their signal to noise ratio. These methods allow us to reduce the size of each individual pixel and thereby increase the number of pixels in an image sensor of a given size. The result is a current portfolio of several high resolution image sensors ranging up to a 14.6-megapixel product. In addition, we are able to produce image sensors at lower resolutions with smaller pixel arrays, which serve to reduce the overall cost of the image sensor and its supporting components, such as lenses.
Lower Cost. The highly integrated design of our image sensor enables us to deliver image sensors to our customers at a cost which makes the cameras they are part of increasingly less expensive. This cost saving is driven, in large part, by our ability to achieve a high level of functionality in a single chip while continually reducing the overall size of the device. Similarly, we believe our CameraCube imaging devices, as compact total camera solutions that can be reflowed onto circuit boards directly, can streamline the camera device manufacturers process, yielding further cost savings to our customers.
Accelerated Time to Market. The highly integrated nature of our image sensor simplifies the design of cameras and allows our customers to shorten their product design cycles. We believe our CameraCube devices further shorten the design cycle by offering a complete imaging solution from the very beginning. These factors provide our mobile phone and consumer electronics customers with critical competitive advantages, as time to market is typically a major determinant of product success and longevity. We also work closely with our customers to accelerate product development cycles by providing camera reference designs, engineering design review services and customer product evaluation, testing and debugging services. In addition, we have designed our manufacturing and production processes to allow us to quickly ramp production volumes to meet increased customer demand, which is particularly important in the high volume markets in which we participate.
Streamlined Manufacturing and Production. Our image sensors are well suited for production using the relatively simple, low cost and large-scale wafer fabrication processes developed for other semiconductor products that use the CMOS process. We work closely with our foundry partners and with all the other providers of the manufacturing services we require to produce our final products to refine their processes in order to optimize image sensor performance and yields.
Ease of Use. Our single-chip CMOS design outputs video in industry standard formats directly from the chip. These formats include the National Television System Committee, or NTSC, format and/or the Phase Alternating Line, or PAL, format for analog video. For digital video, our sensors output unprocessed data called RGB and/or a standard signal color encoding system known as YUV. As a result, our image sensors can be quickly and easily integrated into products targeted at numerous mass-markets.
50
ITEM 7. MANAGEMENT'S DISCUSSION AND ANALYSIS OF FINANCIAL CONDITION AND
RESULTS OF OPERATIONS—(Continued)
Capital Resources
As of April 30, 2011, we held approximately $379.4 million in cash and cash equivalents and approximately $87.5 million in short-term investments. To mitigate market risk related to short-term investments, we have an investment policy designed to preserve the value of capital and to generate interest income from these investments without material exposure to market fluctuations. Market risk is the potential loss due to the change in value of a financial instrument as a result of changes in interest rates or bond prices, and changes in market liquidity and in the pricing of risk. Our policy is to invest in financial instruments with short maturities, limiting interest rate exposure, and to measure performance against comparable benchmarks. We maintain our portfolio of cash equivalents and short-term investments in a variety of securities, including both government and corporate obligations with ratings of "A" or better and money market funds. We do not believe that the value of our cash and short-term investments will be significantly affected by current instability in the global financial markets.
Sources of Revenues
We generate almost all our revenue by selling our products directly to OEMs and VARs and indirectly through distributors. For accounting purposes, we treat sales to OEMs and VARs as one source of revenue, and sales to distributors as another and our revenue recognition policies for the two groups are different. See "Critical Accounting Policies and Estimates—Revenue Recognition" below for additional information regarding recognition of revenue.
Critical Accounting Policies and Estimates
The preparation of financial statements in conformity with accounting principles generally accepted in the United States requires management to make estimates and assumptions that affect the reported amounts of assets and liabilities and disclosure of contingent assets and liabilities at the date of the financial statements and the reported amounts of revenues and expenses during the reporting period. By their nature, these estimates and judgments are subject to an inherent degree of uncertainty. On an ongoing basis we re-evaluate our judgments and estimates including those related to product returns, bad debts, inventories, long-lived assets, income taxes, litigation and contingencies. We base our estimates and judgments on our historical experience, knowledge of current conditions and our beliefs of what could occur in the future considering available information. Actual results could differ from those estimates, and material effects on our operating results and financial position may result. Our significant accounting policies are more fully described in Note 2—"Summary of Significant Accounting Policies" to the consolidated financial statements included in this Annual Report on Form 10-K. Our estimates reflect the following critical accounting policies:
Revenue Recognition
For shipments to customers without agreements that allow for returns or credits, principally OEMs and VARs, we recognize revenue using the "sell-in" method. Under this method, we recognize revenue when title passes to the customer provided that we have received a signed purchase order, the price is fixed or determinable, title and risk of loss has transferred to the customer, collection of resulting receivables is considered reasonably assured, product returns are reasonably estimable, there are no customer acceptance requirements and there are no remaining material obligations. We provide for future returns of potentially defective products based on historical experience at the time we recognize revenue. For cash consideration given to customers that is primarily in the form of rebates,
51
ITEM 7. MANAGEMENT'S DISCUSSION AND ANALYSIS OF FINANCIAL CONDITION AND
RESULTS OF OPERATIONS—(Continued)
and for which we do not receive a separately identifiable benefit or cannot reasonably estimate fair value, we record the amounts as reductions of revenue.
For shipment of products sold to distributors under agreements allowing for returns or credits, title and the risk of ownership to the products transfer to the distributor upon shipment, and the distributor is obligated to pay for the products whether or not the distributor has sold them at the time payment is due. Under the terms of our agreements with such distributors and subject to our prior approval, distributors are entitled to reclaim from us as price adjustments the difference, if any, between the prices at which we sold the product to the distributors and the prices at which the product is subsequently sold by the distributor. In addition, distributors have limited rights to return inventory that they determine is in excess of their requirements, and accordingly, in determining the appropriate level of provision for excess and obsolete inventory, we take into account the inventories held by our distributors. For these reasons, prices and revenues are not fixed or determinable until the distributor resells the products to our end-user customers and the distributor notifies us in writing of the details of such sales transactions. Accordingly, we recognize revenue using the "sell-through" method. Under the "sell-through" method, we defer the revenue, adjustments to revenue and the related costs of revenue until the final resale of such products to end customers. The amounts billed to these distributors and adjustments to revenue and the cost of inventory shipped to, but not yet sold by, the distributors are shown net on the Consolidated Balance Sheets as "Deferred revenues, less cost of revenues."
In order to determine whether collection is probable, we assess a number of factors, including our past transaction history with the customer and the creditworthiness of the customer. If we determine that collection is not reasonably assured, we defer the recognition of revenue until collection becomes reasonably assured or upon receipt of payment.
Allowance for Doubtful Accounts
We undertake credit evaluations for all major sale transactions before we release product for shipment. Normal payment terms apply upon transfer of risk of loss. On an ongoing basis, we analyze the payment history of customer accounts, including recent customer purchases. We evaluate aged items in accounts receivable and provide allowances for doubtful accounts. Customer creditworthiness and economic conditions may change and increase the risk of collectibility and may require additional allowances, which would negatively impact our operating results. As of April 30, 2011 and 2010, our allowance for doubtful accounts represented approximately 1.2% and 0.9%, respectively, of total accounts receivable.
Allowance for Sales Returns and Warranties
Based on historical sales returns and other known factors, we provide for estimated sales returns in the same period we record the related revenues. To estimate our allowance for sales returns, we analyze potential customer-specific product application issues, potential quality and reliability issues and historical returns. We evaluate quarterly the adequacy of the allowance for sales returns. This allowance is reflected as a reduction to accounts receivable in our consolidated balance sheets. Increases to the allowance are recorded as a reduction to net revenues. Because the allowance for sales returns is based on our judgments and estimates, particularly as to product application, quality and reliability issues, our allowances may not be adequate to cover actual sales returns and other allowances. If our allowances are not adequate, our net revenues could be adversely affected. We warrant to our customers that our products will work in accordance with each product's specifications. Due to the cost and other complexities associated with rectifying any product defects, we do not repair any defective products. If
52
ITEM 7. MANAGEMENT'S DISCUSSION AND ANALYSIS OF FINANCIAL CONDITION AND
RESULTS OF OPERATIONS—(Continued)
a product is defective, the customer notifies us and, with our approval, returns the defective product. We then send replacement products to the customer. Accordingly, we account for any exposure related to defective products as a portion of our allowance for sales returns. The net change in our allowance for sales returns balance in fiscal 2011 was approximately 0.1% of revenues, and the allowance was approximately 1.6% of total accounts receivable at April 30, 2011.
Excess and Obsolete Inventory and Effect on Gross Margin
We regularly monitor inventory quantities on hand and record provisions for excess and obsolete inventories based primarily on historical usage rates and our forecast of future demand for our products. We record provisions for the cost of inventories when the number of units on hand exceeds the number of units that we forecast will be sold over a certain period of time, generally 12 months. When we recognize the provisions, a new, lower-cost basis for that inventory is established, and subsequent changes in facts and circumstances do not result in the restoration of or increase in that newly established cost basis.
We may subsequently sell some of these excess and obsolete inventories. Even though we may sell these products at a price that was less than our original cost, sales of these products improve our current period gross margins because the inventory was previously written down.
We attempt to control our inventory levels so that we do not hold inventories in excess of demand for the succeeding three months. However, because we need to place non-cancelable orders with significant lead time and because it is difficult to estimate product demand, it is possible that we will build inventories in excess of demand for future periods. If we have inventories in excess of estimated product demand, we will record a provision, which could have a material adverse effect on our reported results of operations and financial position. In preparation for new product introductions, we gradually decrease production of established products, while preparing for production of newer products. Given our 12-14 week production cycle, it is extremely difficult to predict precisely how many units of established products we need. It is also difficult to accurately predict the speed of the ramp of new products or the projected life cycles of new products which have continued to shorten in duration. Under these circumstances, it is possible that we could suffer from shortages of certain products and also build inventories in excess of demand for other products.
Stock-Based Compensation Expense
The authoritative guidance for stock-based compensation requires all share-based payments to employees, including grants of employee stock options and employee stock purchases under our employee stock purchase plan, to be recognized in our financial statements based on their respective grant date fair values. We use the Black-Scholes option pricing model to estimate the fair value of our share-based payment awards. The Black-Scholes option pricing model requires the use of highly subjective and complex assumptions, including our stock price, expected volatility, expected term, risk-free interest rate and expected dividend yield. For expected volatility, we use an average between the historical volatility of our common stock, and the implied volatility of traded options on our common stock. The expected term of the awards is based on historical data regarding our employees' option exercise behaviors. The risk-free interest rate assumption is based on observed interest rates appropriate for the terms of our awards. The dividend yield assumption is based on our history and expectation of dividend payouts. In addition to the requirement for fair value estimates, authoritative guidance for stock-based compensation also requires the recording of expense that is net of an anticipated forfeiture rate. Only expenses associated with awards that are ultimately expected to vest are included in our financial statements. Our forfeiture rate is determined based on our historical option cancellation experience.
53
ITEM 7. MANAGEMENT'S DISCUSSION AND ANALYSIS OF FINANCIAL CONDITION AND
RESULTS OF OPERATIONS—(Continued)
We evaluate the Black-Scholes assumptions that we use to value our awards on a quarterly basis. With respect to the forfeiture rate, we will revise the rate, if necessary, in subsequent periods if actual forfeitures differ from our estimates. If factors change and we employ different assumptions, stock-based compensation expense related to future stock-based payments may differ significantly from estimates recorded in prior periods.
We elected to use the long-form method to establish the beginning balance of, and to determine the subsequent impact on, the additional paid-in capital pool. For the tax effects of share-based payment awards, we use the "with and without" approach in determining the order in which tax attributes are utilized. As a result, we will recognize a tax benefit from stock-based awards in additional paid-in capital only if an incremental tax benefit is realized after all other tax attributes currently available to us have been utilized. In addition, we account for the indirect effects of stock-based awards on other tax attributes, such as research and development tax credits, through the Consolidated Statements of Operations.
In September 2007, our stockholders approved the 2007 Equity Incentive Plan, or the 2007 Plan. See Note 13—"Employee Stock Purchase, Equity Incentive and Stock Option Plans" to our consolidated financial statements. The 2007 Plan allows the grant of, among other things, performance share awards to employees. Under the authoritative guidance for stock-based compensation, when we record the stock-based compensation expense for such awards that carry performance contingencies, we have to estimate the probable outcome at the end of the performance period. Furthermore, we have to adjust the cumulative compensation expense recorded when probable outcome for the performance-based shares is subsequently updated for changes in facts and circumstances.
Valuation of Long-Lived Assets
Whenever events or changes in circumstances indicate that the carrying value of identifiable intangibles and long-lived assets, including property, plant and equipment and prepaid wafer credits, may not be recoverable, we assess whether the value of such asset or asset group has been impaired. Impairment evaluations involve management estimates of assets' useful lives and future cash flows. If such events occur, we would estimate the undiscounted future cash flows expected to result from the use of the asset and its eventual disposition. If the undiscounted expected future cash flows were less than the carrying amount of the asset, we would recognize an impairment loss. Actual useful lives and cash flows could be different from those estimated by our management. This could have a material effect on our operating results and financial position. Factors we consider important that could trigger an impairment review include the following:
- •
- operating losses;
- •
- significant negative industry trends;
- •
- significant underutilization of the assets; and
- •
- significant changes in how we use the assets or our plans for their use.
Valuation of Financial Instruments
The authoritative guidance for fair value measurements specifies a hierarchy of valuation techniques based upon whether the inputs to those valuation techniques reflect assumptions other market participants would use based upon market data obtained from independent sources (observable inputs) or reflect our own assumption of market participant valuation (unobservable inputs).
54
ITEM 7. MANAGEMENT'S DISCUSSION AND ANALYSIS OF FINANCIAL CONDITION AND
RESULTS OF OPERATIONS—(Continued)
We use inputs such as quoted prices in active markets, broker/dealer quotes and other similar data from independent sources to determine the fair value of our financial assets and liabilities. For quoted prices from active markets, we do not make any material adjustments. For quoted prices in markets that are not active, or other observable and market-corroborated inputs, we review the inputs for reasonableness, and may further adjust the fair value based on market indices or other information that management deems material to the fair value estimates.
As of April 30, 2011, the fair value of our financial instruments measured at fair value on a recurring basis included $181.1 million of assets, and $3.9 million of liabilities. Of the $181.1 million of assets, $80.6 million were classified as Level 1, most of which were investments in money market funds. The remaining $100.5 million of investments were classified as Level 2, representing investments in debt securities issued by the U.S. government and its agencies, and other corporate securities. The $3.9 million of liabilities were classified as Level 2, and consisted of interest rate swaps that we entered into in conjunction with a mortgage loan in fiscal 2007 and a term loan in fiscal 2009. The fair value of the interest rate swaps included the effect of our credit risk. We did not classify any financial instruments as Level 3 under the fair value hierarchy.
Accounting for Income Taxes
In accordance with the authoritative guidance for income taxes, we make certain estimates and judgments in determining the income tax expense for financial statement purposes. These estimates and judgments occur in the calculation of tax credits, benefits, and deductions, and in the calculation of certain tax assets and liabilities, which arise from differences in the timing of recognition of revenue and expense for tax and financial statement purposes, as well as the interest and penalties relating to these uncertain tax positions. Significant changes to these estimates may increase or decrease our tax provision in a subsequent period. Similarly, for tax liabilities denominated in a currency other than the U.S. dollar, changes in the value of the denominated currency will increase or decrease our tax provision in a subsequent period.
In addition, the calculation of our tax liabilities involves the assessment of uncertainties in the application of complex tax regulations. We recognize liabilities for uncertain tax positions based on a two-step process. In the first step, recognition, we determine whether it is more-likely-than-not that a tax position will be sustained upon examination, including resolution of any related appeals or litigation processes, based on the technical merits of the position. The second step addresses measurement of a tax position that meets the more-likely-than-not criterion. The tax position is measured at the largest amount of benefit that has a greater than 50 percent likelihood of being realized upon ultimate settlement. Because we are required to determine the probability of various possible outcomes, such estimates are inherently difficult and subjective. We reevaluate these uncertain tax positions on a quarterly basis. This re-evaluation is based on factors including, but not limited to, changes in facts or circumstances, and changes in tax law. A change in recognition or measurement would result either in the recognition of a tax benefit or in an additional charge to the tax provision for the period.
We also have to assess the likelihood that we will be able to realize our deferred tax assets. If realization is not likely, we are required to increase our provision for taxes by recording a valuation allowance against the deferred tax assets that we estimate we will not ultimately realize. We believe that we will ultimately realize a substantial majority of the deferred tax assets recorded on our Consolidated Balance Sheets. However, should there be a change in our ability to realize our deferred tax assets, our tax provision would increase in the period in which we determined that it is more likely than not that the benefit of our deferred tax assets will not be realized.
55
ITEM 7. MANAGEMENT'S DISCUSSION AND ANALYSIS OF FINANCIAL CONDITION AND
RESULTS OF OPERATIONS—(Continued)
As of April 30, 2011, we have recorded a valuation allowance of $8.1 million to offset California research and development tax credit carryovers. We believe that it is more likely than not that we will not realize these carryovers. In the future, if the credit is utilized and the valuation allowance is released, the release of valuation allowance will be accounted for as a reduction of the income tax expense in the period such event occurs. For fiscal 2011, 2010 and 2009, our income tax provision reflected effective tax rates of 3.3%, 37.8% and 0.4%, respectively. These rates are less than the combined U.S. federal and state statutory rate of approximately 40% principally because we earn a portion of our profits in jurisdictions where tax rates are lower than the combined U.S. federal and state statutory rate.
Litigation and Contingencies
From time to time, we have been subject to legal proceedings and claims with respect to such matters as patents and other actions arising out of the normal course of business, as well as other matters identified in "Legal Proceedings" in Part I, Item 3 of this Annual Report.
It is possible that other companies might pursue litigation with respect to any claims such companies purport to have against us. The results of any litigation are inherently uncertain. In the event of an adverse result in any litigation with respect to intellectual property rights relevant to our products that could arise in the future, we could be required to obtain licenses to the infringed technology, pay substantial damages under applicable law, including treble damages if we are held to have willfully infringed, cease the manufacture, use and sale of infringing products or to expend significant resources to develop non-infringing technology. Litigation frequently involves substantial expenditures and can require significant management attention, even if we ultimately prevail.
Given the uncertainties associated with litigation, if our assessments prove to be wrong, or if additional information becomes available such that we estimate that there is a probable loss or probable range of loss associated with these contingencies, then we would record the minimum estimated liability, which could materially impact our results of operations, financial position or cash flows.
56
ITEM 7. MANAGEMENT'S DISCUSSION AND ANALYSIS OF FINANCIAL CONDITION AND
RESULTS OF OPERATIONS—(Continued)
Results of Operations
The following table sets forth the results of our operations as a percentage of revenues for the periods indicated. Our historical operating results are not necessarily indicative of the results we can expect for any future period.
| |
Year Ended April 30, | |||||||||||
|---|---|---|---|---|---|---|---|---|---|---|---|---|
| |
2011 | 2010 | 2009 | |||||||||
Revenues |
100.0 | % | 100.0 | % | 100.0 | % | ||||||
Cost of revenues |
70.9 | 75.9 | 76.8 | |||||||||
Gross margin |
29.1 | 24.1 | 23.2 | |||||||||
Operating expenses: |
||||||||||||
Research, development and related |
9.2 | 12.8 | 16.7 | |||||||||
Selling, general and administrative |
6.6 | 10.2 | 12.3 | |||||||||
Goodwill impairment |
— | — | 1.5 | |||||||||
Amortization of acquired patent portfolio |
0.1 | — | — | |||||||||
Total operating expenses |
15.9 | 23.0 | 30.5 | |||||||||
Income (loss) from operations |
13.2 | 1.1 | (7.3 | ) | ||||||||
Interest income (expense), net |
(0.1 | ) | (0.1 | ) | 0.4 | |||||||
Other income (expense), net |
0.4 | 0.7 | (0.6 | ) | ||||||||
Income (loss) before income taxes |
13.5 | 1.7 | (7.5 | ) | ||||||||
Provision for (benefit from) income taxes |
0.5 | 0.6 | — | |||||||||
Net income (loss) |
13.0 | 1.1 | (7.5 | ) | ||||||||
Net loss attributable to noncontrolling interest |
— | — | (0.1 | ) | ||||||||
Net income (loss) attributable to OmniVision Technologies, Inc. |
13.0 | % | 1.1 | % | (7.4 | )% | ||||||
Revenues
We derive substantially all of our revenues from the sale of our image-sensor products that are used in a wide variety of consumer and commercial mass-market applications including mobile phones, notebooks and personal computers, security and surveillance cameras, DSCs, entertainment devices, automotive and medical products. Revenues increased by 58.6% to $956.5 million in fiscal 2011 from $603.0 million in fiscal 2010. Revenues increased by 18.9% to $603.0 million in fiscal 2010 from $507.3 million in fiscal 2009. The increase in revenues in fiscal 2011 was primarily due to a 43.1% increase in unit sales of our image-sensor products, reflecting a continuing recovery in product demand from the prior year period and improvements in our product mix, which resulted in a 10.9% increase in ASPs.
Revenues from Sales to OEMs and VARs as Compared to Distributors
We sell our image-sensor products either directly to OEMs and VARs or indirectly through distributors. The percentage of revenues from sales to OEMs and VARs was higher in fiscal 2011 than in fiscal 2010 and fiscal 2009. We expect that the percentage of revenues from sales through OEMs and VARs will vary from year to year in response to changes in the composition of our customer list, and that it may continue to represent a majority of our revenues. The gross margin that we earn on sales to OEMs and VARs or through distributors is not significantly different.
57
ITEM 7. MANAGEMENT'S DISCUSSION AND ANALYSIS OF FINANCIAL CONDITION AND
RESULTS OF OPERATIONS—(Continued)
The following table shows the percentage of revenues from sales to OEMs and VARs and distributors for the periods indicated :
| |
Year Ended April 30, | ||||||||||
|---|---|---|---|---|---|---|---|---|---|---|---|
| |
2011 | 2010 | 2009 | ||||||||
OEMs and VARs |
75.3 | % | 51.5 | % | 58.0 | % | |||||
Distributors |
24.7 | 48.5 | 42.0 | ||||||||
Total |
100.0 | % | 100.0 | % | 100.0 | % | |||||
OEMs and VARs. The one OEM customer that accounted for 10% or more of our revenues in fiscal 2011 was LG Innotek Co., Ltd., which accounted for approximately 17.6% of our revenues. The one OEM customer that accounted for 10% or more of our revenues in fiscal 2010 and 2009 was Foxconn, which accounted for approximately 11.2% and 10.4% of our revenues, respectively. For fiscal 2011, 2010 and 2009, no other OEM or VAR customer accounted for 10% or more of our revenues.
Distributors. The one distributor that accounted for 10% or more of our revenues in fiscal 2011, 2010 and 2009 was World Peace, which accounted for approximately 13.8%, 27.0% and 22.4% of our revenues, respectively. For fiscal 2011, 2010 and 2009, no other distributor accounted for 10% or more of our revenues.
Revenues from Domestic Sales as Compared to Foreign Sales
The following table shows the percentage of our revenues derived from sales of our image-sensor products to domestic customers, as compared to foreign customers for the periods indicated:
| |
Year Ended April 30, | ||||||||||
|---|---|---|---|---|---|---|---|---|---|---|---|
| |
2011 | 2010 | 2009 | ||||||||
Domestic sales |
1.7 | % | 0.6 | % | 6.7 | % | |||||
Foreign sales |
98.3 | 99.4 | 93.3 | ||||||||
Total |
100.0 | % | 100.0 | % | 100.0 | % | |||||
We derive the majority of our foreign sales from customers in Asia and, to a lesser extent, in Europe. Over time, our sales to Asia-Pacific customers have increased primarily as a result of the continuing trend of outsourcing the production of consumer electronics products to Asia-Pacific manufacturers and facilities and to the increasing markets in Asia for consumer products. Because of the preponderance of Asia-Pacific manufacturers and the fact that virtually all products incorporating our image-sensor products are sold globally, we believe that the geographic distribution of our sales does not accurately reflect the geographic distribution of sales into end-user markets of products which incorporate our image sensors.
Gross Profit
Comparison of Fiscal 2011 and Fiscal 2010
Our gross margin in fiscal 2011 was 29.1%, an increase from 24.1% for fiscal 2010. The principal contributors to the year-over-year increase in gross margin included: a reduction in production costs resulting from increased efficiencies due to substantial increases in production volume; a 10.9% increase in our ASPs resulting from improvements in product mix and a decline in the write-down of
58
ITEM 7. MANAGEMENT'S DISCUSSION AND ANALYSIS OF FINANCIAL CONDITION AND
RESULTS OF OPERATIONS—(Continued)
inventories which totaled approximately $18.3 million, as compared to $19.2 million during the prior fiscal year. We recorded approximately $2.0 million in stock-based compensation expense to cost of revenues in fiscal 2011, as compared to $2.7 million in the prior fiscal year.
Comparison of Fiscal 2010 and Fiscal 2009
Our gross margin in fiscal 2010 was 24.1%, an increase from 23.2% for fiscal 2009. The principal contributor to the year-over-year increase in gross margin reflected: a decline in the write-down of inventories which totaled approximately $19.2 million, as compared to $22.1 million during the prior fiscal year; an increase in the sales of previously written-down products in fiscal 2010, which totaled $14.6 million, as compared to $9.8 million during the same period in the prior fiscal year; and a reduction in production costs. The year-over-year increase was partially offset by the 15.8% decrease in our ASPs as a result of competitive pricing pressures and, in part, an increase in the proportion of sales represented by bare die, often referred to as chip-on-board, or COB, products, rather than packaged products. We recorded approximately $2.7 million in stock-based compensation expense to cost of revenues in fiscal 2010, as compared to $3.1 million in the prior fiscal year.
Research, Development and Related
Research, development and related expenses consist primarily of compensation and personnel-related expenses, non-recurring engineering costs related principally to the costs of the masks we buy when we release new product designs to the manufacturing foundry, costs for purchased materials, designs, tooling, depreciation of computers and workstations, and amortization of acquired intangible intellectual property and computer aided design software. Research, development and related expenses may fluctuate significantly as the number of new designs we release to the foundry can fluctuate from period to period. Research, development and related expenses for fiscal 2011, 2010 and 2009 were approximately $88.5 million, $77.3 million and $84.9 million, respectively. As a percentage of revenues, research, development and related expenses for fiscal 2011, 2010 and 2009 represented 9.2%, 12.8% and 16.7%, respectively.
Comparison of Fiscal 2011 and Fiscal 2010
The increase in research, development and related expenses of approximately $11.2 million, or 14.5%, in fiscal 2011, as compared to fiscal 2010 resulted primarily from: a $8.6 million increase in salary and payroll-related expenses; a $4.9 million increase in non-recurring engineering expenses related to new product development; a $1.6 million increase in legal expenses primarily related to patent registration activities and a $296,000 increase in office and facility expenses. These increases were partially offset by: a $3.8 million decrease in depreciation and amortization expenses and a $0.7 million decrease in stock-based compensation expense. We anticipate that research, development and related expenses will increase for our first quarter of fiscal 2012, reflecting expenses we anticipate incurring as we develop and introduce new products, including those employing our CameraCube, OmniBSI and OmniBSI-2 technologies and as we develop other new imaging technologies.
Comparison of Fiscal 2010 and Fiscal 2009
The decrease in research, development and related expenses of approximately $7.6 million, or 8.9%, in fiscal 2010, as compared to fiscal 2009 resulted primarily from a $2.0 million decrease in non-recurring engineering expenses related to new product development, a $1.9 million decrease in
59
ITEM 7. MANAGEMENT'S DISCUSSION AND ANALYSIS OF FINANCIAL CONDITION AND
RESULTS OF OPERATIONS—(Continued)
office and facility expenses, a $1.8 million decrease in stock-based compensation expense and a $1.7 million decrease in legal expenses primarily related to patent registration activities.
Selling, General and Administrative
Selling, general and administrative expenses consist primarily of compensation and personnel related expenses, commissions paid to distributors and manufacturers' representatives and insurance and legal expenses. Selling, general and administrative expenses for fiscal 2011, 2010 and 2009 were approximately $62.8 million, $61.5 million and $62.6 million, respectively. As a percentage of revenues, selling, general and administrative expenses for fiscal 2011, 2010 and 2009 represented 6.6%, 10.2% and 12.3%, respectively.
Comparison of Fiscal 2011 and Fiscal 2010
The increase in selling, general and administrative expenses of approximately $1.3 million, or 2.1%, for fiscal 2011 from fiscal 2010 resulted primarily from: a $3.1 million increase in fees for outside services primarily due to one-time transaction costs incurred in association with the Kodak patent purchase; a $2.2 million increase in salary and payroll-related expenses; a $0.7 million increase in office and facility expenses; a $414,000 increase in travel-related expenses; a $409,000 increase in bad debt expense and a $161,000 increase in marketing expenses. These increases were partially offset by: a $2.2 million decrease in stock-based compensation expense; a $1.6 million decrease in legal expenses related to patent defense; a $1.4 million decrease in commission expenses paid primarily to distributors and sales representatives and a $449,000 decrease in other tax expenses. We anticipate that our selling, general and administrative expenses will decrease for the first quarter of fiscal 2012, as compared to the fourth quarter of fiscal 2011, in the absence of the one-time transaction costs noted above.
Comparison of Fiscal 2010 and Fiscal 2009
The decrease in selling, general and administrative expenses of approximately $1.0 million, or 1.7%, for fiscal 2010 from fiscal 2009 resulted primarily from: a $1.8 million decrease in fees for outside services, a $0.8 million decrease in travel-related expenses, a $0.7 million decrease in marketing expenses, a $0.7 million decrease in stock-based compensation expense, a $477,000 decrease in office and facility expenses, a $280,000 decrease in software expenses and a $269,000 decrease in bad debt expense. These decreases were partially offset by a $2.8 million increase in legal expenses related to patent defense, a $0.6 million increase in depreciation expenses, a $0.5 million increase in commission expenses paid primarily to distributors and sales representatives and a $0.5 million increase in salary and payroll-related expenses.
Goodwill Impairment
During the second quarter of fiscal 2009, based on a combination of factors, including the significant decline in our market capitalization and the global economic downturn, we concluded that there were sufficient factual circumstances for interim impairment analyses. By comparing the fair value to net assets other than goodwill, we recorded a non-cash goodwill impairment charge of $7.5 million, or 1.5% of revenues, which we included in Goodwill impairment for fiscal 2009. There was no similar goodwill impairment charge in fiscal 2011 and 2010.
60
ITEM 7. MANAGEMENT'S DISCUSSION AND ANALYSIS OF FINANCIAL CONDITION AND
RESULTS OF OPERATIONS—(Continued)
Amortization of Acquired Patent Portfolio
In March 2011, we purchased certain sensor-related patents and patent applications from Kodak in a cash transaction. As a result, we recorded $65.0 million in additions to intangible assets, which we began amortizing during the three months ended April 30, 2011. Consequently, amortization of acquired patent portfolio totaled approximately $0.8 million for fiscal 2011. We did not incur any comparable charges in fiscal 2010 or 2009.
Interest Income (Expense), Net
We invest our cash, cash equivalents and short-term investments in interest-bearing accounts consisting primarily of money market funds, commercial paper, certificates of deposit, high-grade corporate securities and government bonds. Additionally, we have obtained funds under certain long-term borrowing facilities comprised of a variable rate mortgage, a construction loan and term loans. Interest income (expense), net, for fiscal 2011, 2010 and 2009 was approximately $(1.2 million), $(0.8 million) and $2.1 million, respectively. Between fiscal 2010 and 2011, the $376,000 decline in interest income (expense), net, resulted from a $420,000 increase in interest expense primarily associated with long-term borrowings in fiscal 2011, partially offset by a $44,000 increase in interest income, as compared to the prior year. The increase in interest income was the result of higher balances in interest-bearing accounts than in the prior year. Between fiscal 2009 and 2010, the $2.8 million decline in interest income (expense), net, resulted from a $2.5 million reduction in interest income and a $300,000 increase in interest expense primarily associated with long-term borrowings in fiscal 2010 as compared to the prior year. The decline in interest income was the result of lower interest rates on interest-bearing accounts than in the prior year.
Other Income (Expense), Net
Our portion of the income recorded under the equity method of accounting is included in Other income (expense), net. (See Note 5—"Long-term Investments" of the Notes to our consolidated financial statements.) Other income (expense), net, for fiscal 2011 totaled $3.9 million, as compared to $4.6 million and $(3.2 million) in fiscal 2010 and 2009, respectively. Other income (expense), net, for fiscal 2011 included a $3.1 million gain that represented our portion of the net income recorded by WLCSP; a $1.6 million gain that represented the difference between the fair value of our ownership interest in SOI and the carrying value of SOI's net assets and noncontrolling interest before the deconsolidation, partially offset by a $0.7 million loss on foreign exchange, a $242,000 loss on the interest rate swap agreements related to the mortgage on the Santa Clara Property; a $241,000 loss that represented our portion of the net loss recorded by SOI and a $72,000 loss on the sale of SOI. In the three months ended January 31, 2011, we sold our remaining 43.7% interest in SOI. Consequently, as of April 30, 2011, we had no continuing interest in SOI.
Other income (expense), net, for fiscal 2010 included a $2.2 million gain that represented the difference between 996,250 shares of common stock of Tong Hsing, that we received in connection with Tong Hsing's acquisition of ImPac and the carrying value of our investment in ImPac, a $2.0 million gain that represented our portion of the net income recorded by WLCSP and a $0.8 million gain on the interest rate swap agreements related to the mortgage on the Santa Clara Property, and a $0.8 million loss that represented our portion of the net loss recorded by ImPac, prior to its acquisition by Tong Hsing.
Other income (expense), net, for fiscal 2009 totaled $3.2 million. Other income (expense), net, for fiscal 2009 included a $2.2 million loss on interest rate swap agreements related to the mortgage on the
61
ITEM 7. MANAGEMENT'S DISCUSSION AND ANALYSIS OF FINANCIAL CONDITION AND
RESULTS OF OPERATIONS—(Continued)
Santa Clara Property, a $1.1 million loss that represented our portion of the net loss recorded by ImPac, and a $0.9 million exchange loss, partially offset by a gain of $0.7 million, representing our portion of the net income recorded by WLCSP.
Provision for Income Taxes
We generated approximately $128.7 million and $10.3 million in income before income taxes for fiscal 2011 and 2010, respectively, and approximately $38.2 million in loss before income taxes for fiscal 2009. We recorded a provision for income taxes of approximately $4.2 million and $3.9 million for fiscal 2011 and 2010, respectively, and a benefit from income taxes of approximately $0.2 million for fiscal 2009. For fiscal 2011, 2010 and 2009, our effective tax rates were 3.3%, 37.8% and 0.4%, respectively. These rates were less than the combined U.S. federal and state statutory rate of approximately 40.0% because we earn a portion of our income in jurisdictions where tax rates are lower than the combined U.S. federal and state statutory rates. We expect that our consolidated effective tax rate in fiscal 2012 will continue to be less than the combined U.S. federal and state statutory rates. The extent of the difference is principally contingent upon the amount of non-deductible stock based compensation expenses and the proportion and geographic mix of our total pre-tax income. See Note 9—"Income Taxes" of the Notes to our consolidated financial statements for the reconciliation of how our provision for (benefit from) income taxes differs from the amount computed by applying the U.S. federal income tax rate of 35.0% to income (loss) before income taxes.
Net Loss Attributable to Noncontrolling Interest
Net loss attributable to noncontrolling interest for fiscal 2011 was $32,000, which represented the 56.3% ownership interest in SOI that we did not own in the net loss of SOI, as recorded by SOI from the beginning of our fiscal year through May 2010. We deconsolidated the entity in June 2010. (See Note 5—"Long-term Investments" to our consolidated financial statements.) Net loss attributable to noncontrolling interest for fiscal 2010 and 2009 was $321,000 and $0.7 million, respectively. The net loss attributable to noncontrolling interest for fiscal 2010 and 2009 represents the respective 56.2% and 56.1% interest that we did not own in the net loss of SOI.
Liquidity and Capital Resources
Our principal sources of liquidity at April 30, 2011 consisted of cash, cash equivalents and short-term investments of $466.9 million.
Liquidity
Our working capital increased by $148.8 million to $582.1 million as of April 30, 2011, as compared to $433.3 million as of April 30, 2010. Our working capital increased as a result of: a $145.4 million increase in cash and cash equivalents primarily due to operating cash flows; a $68.3 million increase in accounts receivable, net, resulting from a revenue increase of $353.5 million for fiscal 2011 from fiscal 2010; and a $2.9 million increase in prepaid and deferred income taxes. These increases in working capital were partially offset by: a $27.1 million decrease in inventories due to fiscal 2011 revenue growth; a $17.0 million increase in accounts payable resulting from an increase in production activities; a $12.1 million decrease in short-term investments; a $6.0 million increase in accrued expenses and other current liabilities, and a $5.9 million increase in deferred revenues, less cost of revenues.
Cash balances are held throughout the world, including substantial amounts held outside of the U.S. Most of the amounts held outside of the U.S. could be repatriated to the U.S., but under the current law, would be subject to U.S. federal income taxes, less applicable foreign tax credits.
62
ITEM 7. MANAGEMENT'S DISCUSSION AND ANALYSIS OF FINANCIAL CONDITION AND
RESULTS OF OPERATIONS—(Continued)
In March 2007, we purchased the Santa Clara Property. In connection with the purchase, we obtained from a domestic bank a mortgage loan with a principal amount of $27.9 million, or the Mortgage Loan, and a term loan with a principal amount of $12.0 million, or the Term Loan. As of April 30, 2011, the principal amounts outstanding under the Mortgage Loan and Term Loan were $25.3 million and $4.0 million, respectively. At April 30, 2011, the variable interest rates under the Mortgage Loan and the Term Loan were 1.1% and 1.5%, respectively. See Note 8—"Borrowing Arrangements and Related Derivative Instruments" of the Notes to our consolidated financial statements.
In order to secure the obligations, we also entered into a Deed of Trust, Assignment of Rents and Leases, Security Agreement and Fixture for the benefit of the domestic bank and a Stock Pledge Agreement between us and the domestic bank.
The Loan and Security Agreement requires us to comply with certain affirmative covenants including, but not limited to, meeting certain minimum financial standards, as well as certain negative covenants limiting our ability to take certain actions without the prior written consent of the domestic bank including, but not limited to, selling or leasing the Santa Clara Property or merging or consolidating with another entity. In addition, the Loan and Security Agreement provides that upon the occurrence of certain events of default our obligations under the Loan and Security Agreement may become immediately due and payable, or the domestic bank may cease making additional advances under the Term Loan or otherwise extending credit to us under the Loan and Security Agreement. As of April 30, 2011, we were in compliance with the financial covenants of the Loan and Security agreement.
Concurrent with the Mortgage Loan, we also entered into an interest rate swap with the bank to help manage interest rate risk. The swap is for a period of ten years, and the notional amount of the swap approximates the principal outstanding under the Mortgage Loan. We are the fixed rate payer under the swap with a fixed rate of approximately 5.3% per annum, and the effective rate on the Mortgage Loan is fixed at approximately 6.2%. In July 2008, in connection with the Term Loan, we entered into a second interest rate swap with the bank to effectively convert the variable interest rate described above to a fixed rate. This second swap is for a period of four years. We are the fixed rate payer and the rate is fixed at 4.3% per annum and the effective rate on the Term Loan is fixed at approximately 5.5%. We measure the swap at fair value and record it as either an asset or a liability, depending on whether the fair value is a gain or loss to us.
In August 2009, in order to finance costs associated with the construction of a research center for our wholly-owned subsidiary in Shanghai, OmniVision Technologies (Shanghai) Co. Ltd., or OTC, we entered into a fixed asset loan agreement with a bank in China. The agreement provides for a fixed asset loan in the principal amount of approximately $20.5 million based on the exchange rate in effect at the time of the loan origination, or the Construction Loan. We completed the construction of the research center during the three months ended October 31, 2010 and do not expect to draw down any further amount from the Construction Loan. As of April 30, 2011, the principal amount outstanding under the Construction Loan was $16.9 million at an interest rate of 5.3%.
Cash Flows from Operating Activities
For fiscal 2011, net cash provided by operating activities totaled approximately $137.3 million, as compared to $48.3 million for fiscal 2010. The principal components of the current year amount were: net income of approximately $124.5 million for fiscal 2011; adjustments for non-cash charges of $20.6 million in depreciation and amortization, $19.8 million in stock-based compensation and $18.3 million in write-down of inventories; a $18.7 million increase in accounts payable; a $5.9 million
63
ITEM 7. MANAGEMENT'S DISCUSSION AND ANALYSIS OF FINANCIAL CONDITION AND
RESULTS OF OPERATIONS—(Continued)
increase in deferred revenues, less cost of revenues; a $5.6 million decrease in inventories; a $5.6 million decrease in prepaid and deferred income taxes; and a $3.2 million decrease in prepaid expenses and other assets. These increases were partially offset by: a $68.4 million increase in accounts receivable, net; $13.2 million in gains on equity investments; a $2.7 million decrease in income taxes payable and a $1.0 million decrease in deferred tax liabilities. The $68.4 million increase in accounts receivable, net, reflects the increased level of revenues during the fourth quarter of fiscal 2011, as reflected in days of sales outstanding which increased to 49 days as of April 30, 2011 from 42 days as of April 30, 2010. The $5.6 million decrease in inventories resulted from an increase in sales activity during fiscal 2011. The decrease in inventories relative to fourth quarter revenues resulted in an increase in annualized inventory turns to 6.7 as of April 30, 2011 from 3.5 as of April 30, 2010. The $18.7 million increase in accounts payable reflected the increase in cost of sales associated with the substantial increase in sales activity.
For fiscal 2010, net cash provided by operating activities totaled approximately $48.3 million, as compared to $45.2 million for fiscal 2009. The principal components of the current year amount were: net income of approximately $6.4 million for fiscal 2010; adjustments for non-cash charges of $23.5 million in stock-based compensation, $22.7 million in depreciation and amortization, $19.2 million in write-down of inventories, $7.0 million in gains on equity investments and $0.8 million in gains on interest rate swaps; a $51.9 million increase in accounts payable; a $7.4 million increase in income taxes payable; a $3.5 million increase in deferred revenues, less cost of revenues; and a $2.4 million increase in accrued expenses and other current liabilities. These increases were partially offset by: a $30.3 million increase in accounts receivable, net; a $45.2 million increase in inventories; a $2.7 million increase in prepaid and deferred income taxes and a $2.6 million decrease in deferred tax liabilities. The $30.3 million increase in accounts receivable, net, reflects the increased level of revenues during fiscal 2010, partially offset by faster collection, as reflected in days of sales outstanding which declined to 42 days as of April 30, 2010 from 44 days as of April 30, 2009. The $45.2 million increase in inventories resulted from the need to support an anticipated increase in sales activity during fiscal 2011. The increase in inventories relative to fourth quarter revenues resulted in an increase in annualized inventory turns to 3.5 as of April 30, 2010 from 2.8 as of April 30, 2009. The $51.9 million increase in accounts payable resulted from the increase in inventory purchases required to support the anticipated rise in future sales activity. The $3.5 million increase in deferred revenues, less cost of revenues, was due to an increase in sales to distributors during fiscal 2010.
Cash Flows from Investing Activities
For fiscal 2011, our cash used in investing activities totaled $64.7 million, as compared to cash used in investing activities of approximately $101.5 million for fiscal 2010, due primarily to: $63.5 million in purchases of intangible and other assets principally associated with the purchase of intellectual property from Kodak and $10.3 million in purchases of property, plant and equipment, partially offset by $8.4 million in net sales or maturities of short-term investments.
For fiscal 2010, our cash used in investing activities totaled $101.5 million, as compared to cash provided by investing activities of approximately $1.1 million for fiscal 2009, due primarily to: $82.9 million in net purchases of short-term investments, $13.5 million in purchases of property, plant and equipment and $5.1 million in a long-term investment in Aurora.
64
ITEM 7. MANAGEMENT'S DISCUSSION AND ANALYSIS OF FINANCIAL CONDITION AND
RESULTS OF OPERATIONS—(Continued)
Cash Flows from Financing Activities
For fiscal 2011, net cash provided by financing activities totaled approximately $72.0 million, as compared to $29.3 million during fiscal 2010. This increase was due primarily to: $76.2 million in proceeds from the exercise of stock options and employee purchases through our employee stock purchase plan, partially offset by $4.3 million in payments of long-term borrowings.
For fiscal 2010, net cash provided by financing activities totaled approximately $29.3 million, as compared to net cash used in financing activities of approximately $5.7 million during fiscal 2009. This change was due primarily to: $15.9 million in proceeds from the exercise of stock options and employee purchases through our employee stock purchase plan, and $13.3 million in net proceeds from long-term borrowings.
Capital Commitments and Resources
During the three months ended October 31, 2008, we formed Shanghai OmniVision Semiconductor Technology Co. Ltd, or OST, a wholly-owned subsidiary in Shanghai, China, for the purpose of expanding its testing capabilities. As of April 30, 2011, we had contributed $1.5 million, as required under the terms of our $10.0 million capital commitment. We are required to contribute the remaining $8.5 million by October 2011, which represents a one-year extension from the original due date of October 2010.
During the three months ended April 30, 2011, we formed OmniVision Optoelectronics Technologies (Shanghai) Co. Ltd., or OOC, a wholly-owned subsidiary in Shanghai, China, for the purpose of expanding our manufacturing capabilities for CameraCube production. We contributed $3.8 million of the committed $25.0 million registered capital in June 2011. In addition, we are required to contribute the remaining $21.2 million by April 2013. See Note 16—"Commitments and Contingencies" to our consolidated financial statements.
We currently expect our available cash, cash equivalents and short-term investments, together with cash that we anticipate generating from operating activities, will be sufficient to satisfy our capital requirements over approximately the next 12 months. Other than normal working capital requirements, we expect our capital requirements totaling approximately $70.0 million over approximately the next 12 months will consist primarily of funding capital investments in our wholly-owned subsidiaries.
Our ability to generate cash from operations is subject to substantial risks described above under the caption Part I Item 1A. "Risk Factors." We encourage you to review these risks carefully.
65
ITEM 7. MANAGEMENT'S DISCUSSION AND ANALYSIS OF FINANCIAL CONDITION AND
RESULTS OF OPERATIONS—(Continued)
Contractual Obligations and Commercial Commitments
The following summarizes our contractual obligations and commercial commitments as of April 30, 2011 and the effect such obligations and commitments are expected to have on our liquidity and cash flows in future periods (in thousands):
| |
Payments Due by Period | |||||||||||||||||
|---|---|---|---|---|---|---|---|---|---|---|---|---|---|---|---|---|---|---|
| |
Total | Less than 1 Year |
1 - 3 Years | 3 - 5 Years | More than 5 Years |
|||||||||||||
Contractual Obligations: |
||||||||||||||||||
Operating leases |
$ | 8,069 | $ | 4,343 | $ | 3,661 | $ | 65 | $ | — | ||||||||
Debt obligations(1) |
46,239 | 4,323 | 6,724 | 10,340 | 24,852 | |||||||||||||
Purchase obligations(2) |
246,666 | 246,666 | — | — | — | |||||||||||||
Total contractual obligations |
300,974 | 255,332 | 10,385 | 10,405 | 24,852 | |||||||||||||
Other Commercial Commitments: |
||||||||||||||||||
OST(3) |
8,500 | 8,500 | — | — | — | |||||||||||||
OOC(4) |
25,000 | 3,750 | 21,250 | — | — | |||||||||||||
Total commercial commitments |
33,500 | 12,250 | 21,250 | — | — | |||||||||||||
Total contractual obligations and commercial commitments |
$ | 334,474 | $ | 267,582 | $ | 31,635 | $ | 10,405 | $ | 24,852 | ||||||||
- (1)
- In
March 2007, we entered into the Mortgage Loan with a domestic bank in the amount of $27.9 million. In March 2008, we borrowed $6.0 million
under the Term Loan for building improvement of the Santa Clara Property. We drew down the remaining $6.0 million under the Term Loan in July 2008. In August 2009, we entered into the
Construction Loan with a bank in China to finance costs associated with the construction of a research center for OTC. As of April 30, 2011, we borrowed approximately $17.7 million under
the Construction Loan. See Note 8—"Borrowing Arrangements and Related Derivative Instruments" to our consolidated financial
statements.
- (2)
- Purchase
obligations represent outstanding purchase orders that we have placed with our suppliers at period-ends. The lead time for delivery is
long, typically 12 to 14 weeks, and suppliers must prepare unique materials for us at the beginning of the fabrication process. Accordingly, we are precluded from cancelling our orders once
placed and the production process has begun.
- (3)
- During
the three months ended October 31, 2008, we formed OST, a wholly-owned subsidiary in Shanghai, China, for the purpose of expanding our testing
capabilities. We contributed $1.5 million in January 2009, as required under the terms of our capital commitment. We are required to contribute the remaining $8.5 million of a
$10.0 million commitment by October 16, 2011, which represents a one-year extension from the original due date of October 16, 2010. See
Note 16—"Commitments and Contingencies" to our consolidated financial statements.
- (4)
- During the three months ended April 30, 2011, we formed OOC, a wholly-owned subsidiary in Shanghai, China, for the purpose of expanding our manufacturing capabilities. We contributed $3.8 million of the committed $25.0 million registered capital in June 2011. In addition, we are required to contribute the remaining $21.2 million by April 2013. See Note 16—"Commitments and Contingencies" to our consolidated financial statements.
66
ITEM 7. MANAGEMENT'S DISCUSSION AND ANALYSIS OF FINANCIAL CONDITION AND
RESULTS OF OPERATIONS—(Continued)
As of April 30, 2011, the long-term income taxes payable, including estimated interest and penalties, was $87.5 million. We are unable to make a reasonably reliable estimate of the timing of payments in individual years beyond 12 months due to uncertainties in the timing of tax audit, if any, or their outcomes. Accordingly, we have excluded this obligation from the schedule summarizing our significant obligations to make future payments under contractual obligations as of April 30, 2011 presented above.
Off-Balance Sheet Arrangements
We did not have any material off-balance sheet arrangements during the periods covered by this Annual Report on Form 10-K.
Recent Accounting Pronouncements
In October 2009, the FASB revised the authoritative guidance for revenue recognition for arrangements with multiple deliverables. The new guidance modifies the requirements for determining whether a deliverable can be treated as a separate unit of accounting by removing the criteria that verifiable and objective evidence of fair value exists for the undelivered elements. In allocating transaction consideration among the deliverables, the guidance also introduced the concept of using management's best estimate of a standalone selling price as an alternate basis for allocation. The guidance is effective in fiscal years beginning on or after June 15, 2010, and we are required to adopt this guidance in our first quarter of fiscal 2012. We do not expect the adoption of this guidance to have any material impact on our financial position, results of operations or cash flows.
In October 2009, the FASB issued authoritative guidance addressing certain revenue arrangements that include software elements. This guidance states that tangible products with hardware and software components that work together to deliver the product functionality are considered non-software products, and the accounting guidance under the revenue arrangements with multiple deliverables is to be followed. The guidance is effective in fiscal years beginning on or after June 15, 2010, and we are required to adopt this guidance in our first quarter of fiscal 2012. We do not expect the adoption of this guidance to have any material impact on our financial position, results of operations or cash flows.
In December 2010, the FASB issued additional guidance for entities with reporting units that have carrying amounts equal to zero or are negative. These entities are required to assess whether it is more likely than not that the reporting units' goodwill is impaired. If it is determined that it is more likely than not that the goodwill of one or more of its reporting units is impaired, then Step 2 of the goodwill impairment test for those reporting unit(s) should be performed. The effective date for this guidance is for fiscal years, and interim periods within those years, beginning after December 15, 2010. Early adoption is not permitted. We do not expect the adoption of this guidance to have any material impact on our financial position, results of operations or cash flows.
In May 2011, the FASB issued new guidance for fair value measurements to provide a consistent definition of fair value and ensure that the fair value measurement and disclosure requirements are similar between accounting principles generally accepted in the United States of America ("GAAP") and International Financial Reporting Standards. The guidance changes certain fair value measurement principles and enhances the disclosure requirements particularly for level 3 fair value measurements. The guidance is effective for us prospectively beginning in the first quarter of fiscal 2012. We are currently evaluating the impact this guidance may have on our financial position, results of operations and cash flows.
67
ITEM 7A. QUANTITATIVE AND QUALITATIVE DISCLOSURES ABOUT MARKET RISK
Foreign Currency Exchange Risk
We sell our products globally, in particular to OEMs, VARs and distributors in China, Japan, Korea and Taiwan.
The great majority of our transactions with our customers and vendors are denominated in U.S. dollars. The expenses we incur in currencies other than U.S. dollars affect gross profit, research, development and related expenses, selling, general and administrative expenses and income taxes, and are primarily incurred in China, where the Chinese Yuan, or CNY, is the local currency and in Taiwan, where the New Taiwan dollar is the local currency.
As of April 30, 2011, the functional currency of all of our wholly-owned subsidiaries is the U.S. dollar. Transaction gains and losses resulting from transactions denominated in currencies other than the respective functional currencies are included in "Other income (expense), net" for the periods presented. The amounts of transaction gains and losses for fiscal 2011, 2010 and 2009 were not material.
Given that the operating expenses which we incur in currencies other than U.S. dollars have not been a significant percentage of our revenues, we do not believe that our foreign currency exchange rate fluctuation risk is significant. Consequently, we do not believe that a 10% change in foreign currency exchange rates would have a significant effect on our future net income or cash flows.
In August 2009, in order to finance costs associated with the construction of a research center for OTC, we entered into the Construction Loan with a bank in China. The Construction Loan is denominated in CNY and provides for a fixed asset loan in the principal amount of approximately $20.5 million based on the exchange rate in effect at the time of the loan origination. As of April 30, 2011, the principal amount outstanding under the Construction Loan was $16.9 million. As of April 30, 2011, a hypothetical 10% weakening of the U.S. dollar against CNY would result in approximately $1.7 million of additional remeasurement losses. As of April 30, 2011, a hypothetical 10% strengthening of the U.S. dollar against CNY would result in approximately $1.7 million of additional remeasurement gains.
We have not hedged exposures denominated in foreign currencies or used any other derivative financial instruments. Although we transact the overwhelming majority of our business in U.S. dollars, future fluctuations in the value of the U.S. dollar may affect the competitiveness of our products and thus may impact our results of operations.
Market Interest Rate Risk
Our cash equivalents and short-term investments are exposed to financial market risk due to fluctuation in interest rates, which may affect our interest income and, from time to time, the fair market value of our investments. We manage our exposure to financial market risk by performing ongoing evaluations of our investment portfolio. We presently invest in money market funds, certificates of deposit issued by banks, commercial paper, high-grade corporate securities and government bonds maturing approximately 18 months or less from the date of purchase.
Due to the short maturities of our investments, the carrying value should approximate the fair market value. In addition, we do not use our investments for trading or other speculative purposes. Due to the short duration of our investment portfolio, we do not expect that an immediate 10% change in interest rates would have a material effect on the fair market value of our portfolio. Therefore, we would not expect our operating results or cash flows to be affected to any significant degree by the
68
ITEM 7A. QUANTITATIVE AND QUALITATIVE DISCLOSURES ABOUT MARKET RISK—(Continued)
effect of a sudden change in market interest rates. We do not believe that the recent instability in global financial markets has significantly affected the value of our cash and short-term investments.
During fiscal 2007, we financed the purchase of the Santa Clara Property with a $27.9 million mortgage loan. The mortgage loan is a variable rate loan which bears interest at LIBOR plus 90 basis points and changes in the interest rate affect our interest payments. However, concurrent with the mortgage loan, we also entered into an interest rate swap with a notional amount that approximates the principal outstanding under the mortgage loan. We are the fixed rate payer under the swap with a fixed rate of 5.3%. By July 2008, we drew down the total available amount of $12.0 million under a related term loan. Concurrent with the term loan, we also entered into an interest rate swap with a notional amount that approximates the principal outstanding under the term loan. We are the fixed rate payer under the swap with a fixed rate of 4.3%. Consequently, although we are required to mark the value of the swaps to market at each balance sheet date and record the associated non-cash cost or benefit as part of "Other income (expense), net," a hypothetical 10% change in LIBOR would not have a material effect on our interest expense for fiscal 2011.
As to the Construction Loan, the interest rate is based on an indicative rate as published by the Chinese government, and will be adjusted every September to the then current published rate. Interest rate under the Construction Loan was 5.3% at April 30, 2011. We do not hedge against the risk of interest rate changes for the Construction Loan. However, since the current interest rate is published by the Chinese government and will not be adjusted until September 2011, any hypothetical 10% shifts in yield will not cause a significant adverse impact to our results of operations, cash flows or to our financial position for fiscal 2011.
69
ITEM 8. FINANCIAL STATEMENTS AND SUPPLEMENTARY DATA
INDEX TO CONSOLIDATED FINANCIAL STATEMENTS
70
REPORT OF INDEPENDENT REGISTERED PUBLIC ACCOUNTING FIRM
To the Board of Directors and Stockholders of OmniVision Technologies, Inc.:
In our opinion, the consolidated financial statements listed in the accompanying index present fairly, in all material respects, the financial position of OmniVision Technologies, Inc. and its subsidiaries at April 30, 2011 and April 30, 2010, and the results of their operations and their cash flows for each of the three years in the period ended April 30, 2011 in conformity with accounting principles generally accepted in the United States of America. In addition, in our opinion, the financial statement schedule listed in the accompanying index appearing under Item 15(a)(2) presents fairly, in all material respects, the information set forth therein when read in conjunction with the related consolidated financial statements. Also in our opinion, the Company maintained, in all material respects, effective internal control over financial reporting as of April 30, 2011, based on criteria established in Internal Control—Integrated Framework issued by the Committee of Sponsoring Organizations of the Treadway Commission (COSO). The Company's management is responsible for these financial statements and financial statement schedule, for maintaining effective internal control over financial reporting and for its assessment of the effectiveness of internal control over financial reporting, included in Management's Report on Internal Control over Financial Reporting appearing under Item 9A. Our responsibility is to express opinions on these financial statements, on the financial statement schedule, and on the Company's internal control over financial reporting based on our integrated audits. We conducted our audits in accordance with the standards of the Public Company Accounting Oversight Board (United States). Those standards require that we plan and perform the audits to obtain reasonable assurance about whether the financial statements are free of material misstatement and whether effective internal control over financial reporting was maintained in all material respects. Our audits of the financial statements included examining, on a test basis, evidence supporting the amounts and disclosures in the financial statements, assessing the accounting principles used and significant estimates made by management, and evaluating the overall financial statement presentation. Our audit of internal control over financial reporting included obtaining an understanding of internal control over financial reporting, assessing the risk that a material weakness exists, and testing and evaluating the design and operating effectiveness of internal control based on the assessed risk. Our audits also included performing such other procedures as we considered necessary in the circumstances. We believe that our audits provide a reasonable basis for our opinions.
A company's internal control over financial reporting is a process designed to provide reasonable assurance regarding the reliability of financial reporting and the preparation of financial statements for external purposes in accordance with generally accepted accounting principles. A company's internal control over financial reporting includes those policies and procedures that (i) pertain to the maintenance of records that, in reasonable detail, accurately and fairly reflect the transactions and dispositions of the assets of the company; (ii) provide reasonable assurance that transactions are recorded as necessary to permit preparation of financial statements in accordance with generally accepted accounting principles, and that receipts and expenditures of the company are being made only in accordance with authorizations of management and directors of the company; and (iii) provide reasonable assurance regarding prevention or timely detection of unauthorized acquisition, use, or disposition of the company's assets that could have a material effect on the financial statements.
Because of its inherent limitations, internal control over financial reporting may not prevent or detect misstatements. Also, projections of any evaluation of effectiveness to future periods are subject to the risk that controls may become inadequate because of changes in conditions, or that the degree of compliance with the policies or procedures may deteriorate.
/s/ PRICEWATERHOUSECOOPERS LLP
San Jose,
California
June 29, 2011
71
OMNIVISION TECHNOLOGIES, INC.
CONSOLIDATED BALANCE SHEETS
(In thousands, except share and per share data)
| |
April 30, | |||||||||
|---|---|---|---|---|---|---|---|---|---|---|
| |
2011 | 2010 | ||||||||
ASSETS |
||||||||||
Current assets: |
||||||||||
Cash and cash equivalents |
$ | 379,379 | $ | 234,023 | ||||||
Short-term investments |
87,505 | 99,555 | ||||||||
Accounts receivable, net of allowances for doubtful accounts and sales returns |
142,606 | 74,261 | ||||||||
Inventories |
106,873 | 133,993 | ||||||||
Prepaid and deferred income taxes |
4,937 | 1,990 | ||||||||
Prepaid expenses and other current assets |
9,671 | 9,380 | ||||||||
Total current assets |
730,971 | 553,202 | ||||||||
Property, plant and equipment, net |
115,446 | 121,547 | ||||||||
Long-term investments |
104,616 | 92,121 | ||||||||
Goodwill |
1,122 | 439 | ||||||||
Intangibles, net |
69,892 | 4,891 | ||||||||
Other long-term assets |
12,111 | 25,493 | ||||||||
Total assets |
$ | 1,034,158 | $ | 797,693 | ||||||
LIABILITIES AND EQUITY |
||||||||||
Current liabilities: |
||||||||||
Accounts payable |
$ | 102,519 | $ | 85,487 | ||||||
Accrued expenses and other current liabilities |
25,483 | 19,506 | ||||||||
Deferred revenues, less cost of revenues |
16,594 | 10,661 | ||||||||
Current portion of long-term debt |
4,323 | 4,286 | ||||||||
Total current liabilities |
148,919 | 119,940 | ||||||||
Long-term liabilities: |
||||||||||
Long-term income taxes payable |
87,526 | 90,626 | ||||||||
Non-current portion of long-term debt |
41,916 | 45,428 | ||||||||
Other long-term liabilities |
4,472 | 4,727 | ||||||||
Total long-term liabilities |
133,914 | 140,781 | ||||||||
Total liabilities |
282,833 | 260,721 | ||||||||
Commitments and contingencies (Note 16) |
||||||||||
Equity: |
||||||||||
OmniVision Technologies, Inc. stockholders' equity: |
||||||||||
Common stock, $0.001 par value; 100,000,000 shares authorized; 70,515,450 shares issued and 57,974,450 outstanding at April 30, 2011 and 64,615,897 shares issued and 52,074,897 outstanding at April 30, 2010, respectively |
71 | 65 | ||||||||
Additional paid-in capital |
533,776 | 441,077 | ||||||||
Accumulated other comprehensive income |
1,426 | 870 | ||||||||
Treasury stock, 12,541,000 at April 30, 2011 and 2010, respectively |
(178,683 | ) | (178,683 | ) | ||||||
Retained earnings |
394,735 | 270,253 | ||||||||
Total OmniVision Technologies, Inc. stockholders' equity |
751,325 | 533,582 | ||||||||
Noncontrolling interest |
— | 3,390 | ||||||||
Total equity |
751,325 | 536,972 | ||||||||
Total liabilities and equity |
$ | 1,034,158 | $ | 797,693 | ||||||
The accompanying notes are an integral part of these consolidated financial statements.
72
OMNIVISION TECHNOLOGIES, INC.
CONSOLIDATED STATEMENTS OF OPERATIONS
(in thousands, except per share amounts)
| |
Year Ended April 30, | |||||||||||
|---|---|---|---|---|---|---|---|---|---|---|---|---|
| |
2011 | 2010 | 2009 | |||||||||
Revenues |
$ | 956,476 | $ | 602,991 | $ | 507,316 | ||||||
Cost of revenues |
678,459 | 457,646 | 389,434 | |||||||||
Gross profit |
278,017 | 145,345 | 117,882 | |||||||||
Operating expenses: |
||||||||||||
Research, development and related |
88,519 | 77,311 | 84,881 | |||||||||
Selling, general and administrative |
62,817 | 61,549 | 62,585 | |||||||||
Amortization of acquired patent portfolio |
774 | — | — | |||||||||
Goodwill impairment |
— | — | 7,541 | |||||||||
Total operating expenses |
152,110 | 138,860 | 155,007 | |||||||||
Income (loss) from operations |
125,907 | 6,485 | (37,125 | ) | ||||||||
Interest income (expense), net |
(1,150 | ) | (774 | ) | 2,069 | |||||||
Other income (expense), net |
3,918 | 4,575 | (3,171 | ) | ||||||||
Income (loss) before income taxes |
128,675 | 10,286 | (38,227 | ) | ||||||||
Provision for (benefit from) income taxes |
4,225 | 3,883 | (158 | ) | ||||||||
Net income (loss) |
124,450 | 6,403 | (38,069 | ) | ||||||||
Net loss attributable to noncontrolling interest |
(32 | ) | (321 | ) | (746 | ) | ||||||
Net income (loss) attributable to OmniVision Technologies, Inc. |
$ | 124,482 | $ | 6,724 | $ | (37,323 | ) | |||||
Net income (loss) per share attributable to OmniVision Technologies, Inc. common stockholders: |
||||||||||||
Basic |
$ | 2.25 | $ | 0.13 | $ | (0.74 | ) | |||||
Diluted |
$ | 2.11 | $ | 0.13 | $ | (0.74 | ) | |||||
Shares used in computing net income (loss) per share attributable to OmniVision Technologies, Inc. common stockholders: |
||||||||||||
Basic |
55,324 | 51,080 | 50,523 | |||||||||
Diluted |
59,106 | 52,689 | 50,523 | |||||||||
The accompanying notes are an integral part of these consolidated financial statements.
73
OMNIVISION TECHNOLOGIES, INC.
CONSOLIDATED STATEMENTS OF STOCKHOLDERS' EQUITY
AND COMPREHENSIVE INCOME (LOSS)
(in thousands, except share data)
| |
Common Stock |
|
|
|
|
Total OmniVision Technologies, Inc. Stockholders' Equity |
|
|
|
|||||||||||||||||||||||
|---|---|---|---|---|---|---|---|---|---|---|---|---|---|---|---|---|---|---|---|---|---|---|---|---|---|---|---|---|---|---|---|---|
| |
|
Accumulated Other Comprehensive Income |
|
|
|
|
|
|||||||||||||||||||||||||
| |
Additional Paid-in Capital |
Treasury Stock |
Retained Earnings |
Noncontrolling Interest |
|
Comprehensive Income (Loss) |
||||||||||||||||||||||||||
| |
Shares | Amount | Total | |||||||||||||||||||||||||||||
Balance at May 1, 2008 |
51,046,369 | $ | 62 | $ | 373,024 | $ | 1,561 | $ | (165,768 | ) | $ | 300,852 | $ | 509,731 | $ | 4,444 | $ | 514,175 | $ | 61,462 | ||||||||||||
Exercise of common stock options |
72,348 | — | 340 | — | — | — | 340 | — | 340 | |||||||||||||||||||||||
Employee stock purchase plan |
508,067 | 1 | 4,125 | — | — | — | 4,126 | — | 4,126 | |||||||||||||||||||||||
Purchases of stock for treasury |
(1,577,500 | ) | — | — | — | (12,915 | ) | — | (12,915 | ) | — | (12,915 | ) | |||||||||||||||||||
Employee stock-based compensation. |
— | — | 26,287 | — | — | — | 26,287 | — | 26,287 | |||||||||||||||||||||||
Write-off of employee stock-based compensation related deferred tax assets |
— | — | (617 | ) | — | — | — | (617 | ) | — | (617 | ) | ||||||||||||||||||||
Affiliate cash dividend paid to noncontrolling interest |
— | — | — | — | — | — | — | (201 | ) | (201 | ) | |||||||||||||||||||||
Translation losses |
— | — | — | (730 | ) | — | — | (730 | ) | — | (730 | ) | $ | (730 | ) | |||||||||||||||||
Unrealized losses on available-for-sale securities, net |
— | — | — | (58 | ) | — | — | (58 | ) | — | (58 | ) | (58 | ) | ||||||||||||||||||
Net loss |
— | — | — | — | — | (37,323 | ) | (37,323 | ) | (746 | ) | (38,069 | ) | (37,323 | ) | |||||||||||||||||
Balance at April 30, 2009 |
50,049,284 | 63 | 403,159 | 773 | (178,683 | ) | 263,529 | 488,841 | 3,497 | 492,338 | $ | (38,111 | ) | |||||||||||||||||||
Exercise of common stock options |
1,128,065 | 2 | 11,247 | — | — | — | 11,249 | — | 11,249 | |||||||||||||||||||||||
Employee stock purchase plan |
897,548 | — | 4,630 | — | — | — | 4,630 | — | 4,630 | |||||||||||||||||||||||
Employee stock-based compensation. |
— | — | 23,467 | — | — | — | 23,467 | — | 23,467 | |||||||||||||||||||||||
Write-off of employee stock-based compensation related deferred tax assets |
— | — | (1,426 | ) | — | — | — | (1,426 | ) | — | (1,426 | ) | ||||||||||||||||||||
Cash contribution by noncontrolling interest |
— | — | — | — | — | — | — | 34 | 34 | |||||||||||||||||||||||
Translation gains |
— | — | — | 176 | — | — | 176 | 180 | 356 | $ | 176 | |||||||||||||||||||||
Unrealized losses on available-for-sale securities, net |
— | — | — | (79 | ) | — | — | (79 | ) | — | (79 | ) | (79 | ) | ||||||||||||||||||
Net income (loss) |
— | — | — | — | — | 6,724 | 6,724 | (321 | ) | 6,403 | 6,724 | |||||||||||||||||||||
Balance at April 30, 2010 |
52,074,897 | 65 | 441,077 | 870 | (178,683 | ) | 270,253 | 533,582 | 3,390 | 536,972 | $ | 6,821 | ||||||||||||||||||||
Exercise of common stock options |
5,396,391 | 5 | 70,811 | — | — | — | 70,816 | — | 70,816 | |||||||||||||||||||||||
Employee stock purchase plan |
503,162 | 1 | 5,372 | — | — | — | 5,373 | — | 5,373 | |||||||||||||||||||||||
Withholding tax deduction on restricted stock units |
— | — | (2,268 | ) | — | — | — | (2,268 | ) | — | (2,268 | ) | ||||||||||||||||||||
Employee stock-based compensation. |
— | — | 19,846 | — | — | — | 19,846 | — | 19,846 | |||||||||||||||||||||||
Tax benefits from stock deduction |
— | — | 609 | — | — | — | 609 | — | 609 | |||||||||||||||||||||||
Write-off of employee stock-based compensation related deferred tax assets |
— | — | (1,671 | ) | — | — | — | (1,671 | ) | — | (1,671 | ) | ||||||||||||||||||||
Translation losses |
— | — | — | (62 | ) | — | — | (62 | ) | (70 | ) | (132 | ) | $ | (62 | ) | ||||||||||||||||
Unrealized gains on available-for-sale securities, net |
— | — | — | 618 | — | — | 618 | — | 618 | 618 | ||||||||||||||||||||||
Net income (loss) |
— | — | — | — | — | 124,482 | 124,482 | (32 | ) | 124,450 | 124,482 | |||||||||||||||||||||
Deconsolidation of SOI |
— | — | — | — | — | — | — | (3,288 | ) | (3,288 | ) | — | ||||||||||||||||||||
Balance at April 30, 2011 |
57,974,450 | $ | 71 | $ | 533,776 | $ | 1,426 | $ | (178,683 | ) | $ | 394,735 | $ | 751,325 | $ | — | $ | 751,325 | $ | 125,038 | ||||||||||||
The accompanying notes are an integral part of these consolidated financial statements.
74
OMNIVISION TECHNOLOGIES, INC.
CONSOLIDATED STATEMENTS OF CASH FLOWS
(In thousands)
| |
Year Ended April 30, | |||||||||||||
|---|---|---|---|---|---|---|---|---|---|---|---|---|---|---|
| |
2011 | 2010 | 2009 | |||||||||||
Cash flows from operating activities: |
||||||||||||||
Net income (loss) |
$ | 124,450 | $ | 6,403 | $ | (38,069 | ) | |||||||
Adjustments to reconcile net income (loss) to net cash provided by operating activities: |
||||||||||||||
Depreciation and amortization |
20,564 | 22,711 | 19,053 | |||||||||||
Change in fair value of interest rate swap |
242 | (776 | ) | 2,234 | ||||||||||
Stock-based compensation |
19,846 | 23,467 | 26,287 | |||||||||||
Tax effect from stock-based compensation |
609 | — | — | |||||||||||
(Gain) loss on equity investments, net |
(13,186 | ) | (7,016 | ) | 382 | |||||||||
Write-down of inventories |
18,250 | 19,249 | 22,085 | |||||||||||
Excess tax benefits from stock-based compensation |
(100 | ) | — | — | ||||||||||
Loss on disposal of property, plant and equipment |
26 | 111 | 550 | |||||||||||
Goodwill impairment |
— | — | 7,541 | |||||||||||
Changes in assets and liabilities: |
||||||||||||||
Accounts receivable, net |
(68,435 | ) | (30,258 | ) | 61,350 | |||||||||
Inventories |
5,578 | (45,194 | ) | (10,573 | ) | |||||||||
Prepaid and deferred income taxes |
5,611 | (2,658 | ) | (3,396 | ) | |||||||||
Prepaid expenses and other assets |
3,203 | (274 | ) | 341 | ||||||||||
Accounts payable |
18,682 | 51,903 | (36,662 | ) | ||||||||||
Accrued expenses and other current liabilities |
(151 | ) | 2,397 | (5,086 | ) | |||||||||
Income taxes payable |
(2,718 | ) | 7,357 | 1,304 | ||||||||||
Deferred revenues, less cost of revenues |
5,863 | 3,476 | (1,054 | ) | ||||||||||
Deferred tax liabilities |
(1,040 | ) | (2,599 | ) | (1,049 | ) | ||||||||
Net cash provided by operating activities |
137,294 | 48,299 | 45,238 | |||||||||||
Cash flows from investing activities: |
||||||||||||||
Purchases of short-term investments |
(161,886 | ) | (135,004 | ) | (59,210 | ) | ||||||||
Proceeds from sales or maturities of short-term investments |
170,247 | 52,149 | 93,876 | |||||||||||
Purchases of property, plant and equipment, net of sales |
(10,313 | ) | (13,516 | ) | (32,227 | ) | ||||||||
Purchases of long-term investments |
(282 | ) | — | (1,376 | ) | |||||||||
Purchase of intangible and other assets |
(63,500 | ) | — | — | ||||||||||
Proceeds from sale of SOI |
3,844 | — | — | |||||||||||
Deconsolidation of SOI |
(2,816 | ) | — | — | ||||||||||
Payment for the acquisition of Aurora, net of cash acquired |
— | (5,109 | ) | — | ||||||||||
Net cash provided by (used in) investing activities |
(64,706 | ) | (101,480 | ) | 1,063 | |||||||||
Cash flows from financing activities: |
||||||||||||||
Proceeds from long-term borrowings |
— | 16,847 | 6,000 | |||||||||||
Repayment of long-term borrowings |
(4,303 | ) | (3,555 | ) | (2,926 | ) | ||||||||
Payment of capital lease obligations |
— | — | (133 | ) | ||||||||||
Cash contribution by noncontrolling interest |
— | 34 | — | |||||||||||
Affiliate cash dividend paid to noncontrolling interest |
— | — | (201 | ) | ||||||||||
Proceeds from exercise of stock options and employee stock purchase plan |
76,189 | 15,936 | 4,466 | |||||||||||
Excess tax benefits from stock-based compensation |
100 | — | — | |||||||||||
Payments for repurchases of common stock |
— | — | (12,915 | ) | ||||||||||
Net cash provided by (used in) financing activities |
71,986 | 29,262 | (5,709 | ) | ||||||||||
Effect of exchange rate changes on cash and cash equivalents |
782 | 134 | (124 | ) | ||||||||||
Net increase (decrease) in cash and cash equivalents |
145,356 | (23,785 | ) | 40,468 | ||||||||||
Cash and cash equivalents at beginning of period |
234,023 | 257,808 | 217,340 | |||||||||||
Cash and cash equivalents at end of period |
$ | 379,379 | $ | 234,023 | $ | 257,808 | ||||||||
Supplemental cash flow information: |
||||||||||||||
Taxes paid, net |
$ | 1,411 | $ | 3,307 | $ | 3,096 | ||||||||
Interest paid, net of amount capitalized |
$ | 2,834 | $ | 2,119 | $ | 1,832 | ||||||||
Supplemental schedule of non-cash investing and financing activities: |
||||||||||||||
Additions to property, plant and equipment included in accounts payable and accrued expenses and other current liabilities |
$ | 2,550 | $ | 4,739 | $ | 7,728 | ||||||||
Capitalized interest and other costs |
$ | — | $ | 103 | $ | 183 | ||||||||
Write-off of employee stock-based compensation-related deferred tax assets |
$ | 1,671 | $ | 1,426 | $ | 617 | ||||||||
Purchase of intangible assets included in accrued expenses and other current liabilities |
$ | 6,500 | $ | — | $ | — | ||||||||
The accompanying notes are an integral part of these consolidated financial statements.
75
OMNIVISION TECHNOLOGIES, INC.
NOTES TO CONSOLIDATED FINANCIAL STATEMENTS
For the Years Ended April 30, 2011, 2010 and 2009
Note 1—Basis of Presentation
The Company
OmniVision Technologies, Inc. and its subsidiaries ("OmniVision" or the "Company") design, develop, manufacture and market image-sensor devices. The Company's main product, a semiconductor image-sensing device called the CameraChip™, is used to capture images electronically and is used in a number of consumer and commercial mass-market applications. The Company's CameraChip image sensor is manufactured using the complementary metal oxide semiconductor ("CMOS") fabrication process. The Company has also integrated its CameraChip image sensor with wafer-level optics, and marketed the integrated device as a CameraCube™ imaging device. The Company was incorporated in California in May 1995 and reincorporated in Delaware in March 2000.
The results of operations for the fiscal year ended April 30, 2011 are not necessarily indicative of the results that may be expected for the fiscal year ending April 30, 2012 or any other future period.
Use of Estimates
The preparation of financial statements in conformity with accounting principles generally accepted in the United States of America ("GAAP") requires management to make estimates and assumptions that affect the reported amounts of assets and liabilities, the disclosure of contingent assets and liabilities at the date of the financial statements and the reported amounts of revenues and expenses during the reporting period. The Company bases its estimates and judgments on its historical experience, knowledge of current conditions and beliefs of what could occur in the future considering available information. Actual results could differ from these estimates.
Note 2—Summary of Significant Accounting Policies
Principles of Consolidation
The consolidated financial statements include the accounts of the Company, its wholly-owned subsidiaries and its consolidated affiliate. All significant inter-company accounts and transactions have been eliminated.
Foreign Currency Translation
Certain of the Company's subsidiaries have functional currencies other than the U.S. dollar and the assets and liabilities of the subsidiaries are translated into U.S. dollars at the rates of exchange prevailing on the balance sheet date. Revenue and expense items are translated into U.S. dollars at the average rate of exchange for the period. Unrealized gains and losses from foreign currency translation are included in "Accumulated other comprehensive income," a component of stockholders' equity. For subsidiaries with the U.S. dollar as the functional currency, and with assets or liabilities denominated in currencies other than the U.S. dollar, non-monetary assets are remeasured into U.S. dollars using historical rates of exchange. Monetary assets and liabilities are remeasured into U.S. dollars using exchange rates prevailing on the balance sheet date. The remeasurement gains or losses are included in "Other income (expense), net." For fiscal 2011 and 2010, the Company recorded remeasurement gains of $1.4 million and $289,000, respectively, in "Other income (expense), net." For fiscal 2009, the Company recorded remeasurement losses of $0.9 million in "Other income (expense), net."
76
OMNIVISION TECHNOLOGIES, INC.
NOTES TO CONSOLIDATED FINANCIAL STATEMENTS—(Continued)
For the Years Ended April 30, 2011, 2010 and 2009
Note 2—Summary of Significant Accounting Policies—(Continued)
Cash and Cash Equivalents
The Company considers all highly liquid investments purchased with a maturity at the date of purchase of three months or less to be cash equivalents. Cash equivalents consist principally of certificates of deposit and money market funds. (See Note 4.)
The Company maintains the majority of its cash and cash equivalent balances with major financial institutions in the United States, Cayman Islands and Hong Kong. These balances are subject to a concentration of credit risk and only a small proportion of these balances are covered by Federal Deposit Insurance Corporation ("FDIC") insurance. The Company places its cash investments in instruments that meet high credit quality standards, as specified in the Company's investment policy guidelines.
Short-Term Investments
The Company's short-term investments, which are classified as available-for-sale securities, are invested in high-grade corporate securities, municipal bonds and notes and U.S. government debt and agencies securities with a final maturity of eighteen months or less from the date of purchase.
Short-term investments are reported at fair value at April 30, 2011 and 2010. Unrealized gains or losses are recorded in stockholders' equity and included in "Accumulated other comprehensive income." Short-term investments with declines in value which are judged to be other than temporary, of which there were none in the periods presented, would be written down to their fair values, at the time such judgment is made.
Accounts Receivable
Accounts receivable are recorded at invoiced amounts and do not bear interest. The Company performs ongoing credit evaluations of its customers' financial condition and, generally, requires no collateral from its customers. Allowances for doubtful accounts and sales returns are established based on various factors including credit profiles of the Company's customers, contractual terms and conditions, historical payments, returns and discounts experience, and current economic trends. The Company reviews its allowance for doubtful accounts quarterly by assessing individual accounts receivable over a specific aging and amount, and all other balances on a pooled basis based on historical collection experience and economic risk assessment. Accounts receivable are written off on a case-by-case basis, net of any amounts that may be collected. The Company determines its allowance for sales returns through evaluation of historical sales returns and other known factors and provides for estimated sales returns in the same period it records the related revenues. To estimate the allowance for sales returns, the Company analyzes potential customer specific product application issues, potential quality and reliability issues and historical returns. The Company evaluates the adequacy of the allowance for sales returns on a quarterly basis. This allowance is reflected as a reduction to accounts receivable in the Company's consolidated balance sheets. Increases to the allowance are recorded as a reduction to revenues.
77
OMNIVISION TECHNOLOGIES, INC.
NOTES TO CONSOLIDATED FINANCIAL STATEMENTS—(Continued)
For the Years Ended April 30, 2011, 2010 and 2009
Note 2—Summary of Significant Accounting Policies—(Continued)
Fair Value of Financial Instruments
Due to their short maturities, the reported amounts of the Company's financial instruments, including cash and cash equivalents, short-term investments, accounts receivable, accounts payable and other current liabilities approximate fair value.
The fair values of the Company's mortgage loan, term loan and construction loan approximate book value as the underlying interest rates are based on risk-adjusted market rates. (See Note 8.)
Related to the mortgage debt, the Company has also entered into two interest rate swap arrangements. For such derivative instruments, the Company recognizes them at the reporting date as either an asset or liability in its Consolidated Balance Sheets measured at fair value. The accounting for changes in fair value of a derivative depends on the intended use of the derivative and the associated hedging designation. The Company has designated the swaps as economic hedges and records the changes in fair value in "Other income (expense), net." (See Note 8.)
Property, Plant and Equipment
Property, plant and equipment, including land-use rights, is stated at cost less accumulated depreciation and amortization. Depreciation is computed using the straight-line method over the estimated useful lives of the assets as follows:
Buildings |
40 years | |
Building/leasehold improvements |
Shorter of 20 years or life of lease | |
Machinery and equipment |
3 - 10 years | |
Furniture and fixtures |
3 - 7 years | |
Land-use rights |
Life of right, currently 50 years |
Construction in progress includes project costs paid to third parties that are clearly associated with the acquisition, development, and construction of an asset and are capitalized as a cost of that project prior to the use of the asset. Such costs include the costs of materials, interest, legal, and escrow services. These capitalized project costs are not subject to depreciation until the assets to which they are related are placed into production.
One of the Company's wholly-owned subsidiary, OmniVision Semiconductor (Shanghai) Co. Ltd. ("OSC"), formerly Hua Wei Semiconductor (Shanghai) Co. Ltd., holds a "land use right" that was acquired from the local Chinese government in December 2000 for approximately $0.8 million, and entitles the Company to use the land for 50 years. The cost of the land use right was recorded as a component of property, plant and equipment and is being depreciated over 50 years, the useful life of the right.
In addition, in January 2007, the Company, through its wholly-owned subsidiary, OmniVision Technologies (Shanghai) Co. Ltd. ("OTC"), formerly Shanghai OmniVision IC Design Co. Ltd., entered into a Land-Use-Right Purchase Agreement (the "Purchase Agreement") with the Construction and Transportation Commission of the Pudong New District, Shanghai. The Purchase Agreement has an effective date of December 31, 2006. Under the terms of the Purchase Agreement, the Company paid an aggregate amount of approximately $0.6 million in exchange for the right to use approximately 323,000 square feet of land located in Shanghai, China, for a period of 50 years. The
78
OMNIVISION TECHNOLOGIES, INC.
NOTES TO CONSOLIDATED FINANCIAL STATEMENTS—(Continued)
For the Years Ended April 30, 2011, 2010 and 2009
Note 2—Summary of Significant Accounting Policies—(Continued)
cost of the land use right was recorded as a component of property, plant and equipment and is being depreciated over 50 years, the useful life of the right.
Long-Lived Assets
The Company reviews its long-lived assets, including intangible assets, for impairment whenever events or changes in circumstances indicate that the carrying amount of an asset might not be recoverable. When such an event occurs, the Company estimates the future cash flows expected to result from the use of the asset and its eventual disposition. If the undiscounted expected future cash flows are less than the carrying amount of the asset, an impairment loss is recognized in order to write-down the carrying value of the asset to its estimated fair market value. To date, the Company has not recognized any impairment losses.
Inventories
Inventories are stated at the lower of cost, determined on a first-in, first-out ("FIFO") basis, or market.
The Company records a provision to reduce the carrying value of inventories to their net realizable value when the Company believes that the net realizable value is less than cost. The Company also records a provision for the cost of inventories when the number of units on hand exceeds the number of units that the Company forecasts will be sold over a certain period of time, generally 12 months. Where necessary, these provisions take into account the inventories owned and not yet sold by certain of the Company's distributors. The recording of these provisions establishes a new and lower cost basis for each specifically identified inventory item, and the Company does not restore the cost basis to its original level regardless of any subsequent changes in facts or circumstances. Recoveries are only recognized upon the sale of previously written-down inventories.
Goodwill
The Company records goodwill when the consideration paid for an acquisition exceeds the fair value of net tangible and intangible assets acquired, including related tax effects. Goodwill is not amortized; instead goodwill is tested for impairment on an annual basis, or more frequently if the Company believes indicators of impairment exist. The performance of the test involves a two-step process. The first step requires comparing the fair value of the reporting unit to its net book value, including goodwill. A potential impairment exists if the fair value of the reporting unit is lower than its net book value. The second step of the process, which is performed only if a potential impairment exists, involves determining the difference between the fair value of the reporting unit's net assets other than goodwill and the fair value of the reporting unit. If this difference is less than the net book value of goodwill, an impairment exists and is recorded. During the second quarter of fiscal 2009, based on a combination of factors, including the significant decline in the Company's market capitalization and the global economic downturn then, the Company concluded that there were sufficient factual circumstances for interim impairment analyses. Based on the analyses, the Company wrote off the carrying value of goodwill and recorded an impairment charge of $7.5 million, which was included in "Goodwill impairment" for fiscal 2009. (See Note 7.)
79
OMNIVISION TECHNOLOGIES, INC.
NOTES TO CONSOLIDATED FINANCIAL STATEMENTS—(Continued)
For the Years Ended April 30, 2011, 2010 and 2009
Note 2—Summary of Significant Accounting Policies—(Continued)
Warranty for Defective Products
The Company warrants to its customers that its products will work in accordance with each product's specifications. Due to the cost and other complexities associated with rectifying any product defects, the Company does not repair any defective products. If a product is defective, the customer notifies the Company and, with the Company's approval, returns the defective product. The Company then sends replacement products to the customer. Accordingly, the Company accounts for any exposure related to defective products as a portion of its allowance for sales returns.
Treasury Stock
The Company accounts for treasury stock under the cost method and includes treasury stock as a component of stockholders' equity.
Revenue Recognition
For shipments to customers without agreements that allow for returns or credits, principally original equipment manufacturers ("OEMs") and value added resellers ("VARs"), the Company recognizes revenue using the "sell-in" method. Under this method, the Company recognizes revenue upon the shipment of products to the customer provided that the Company has received a signed purchase order, the price is fixed or determinable, title and risk of loss has transferred to the customer, collection of resulting receivables is considered reasonably assured, product returns are reasonably estimable, there are no customer acceptance requirements and there are no remaining material obligations. At the time revenue is recognized, the Company provides for future returns of potentially defective product based on historical experience. For cash consideration given to customers, that is primarily in the form of rebates and for which the Company does not receive a separately identifiable benefit or cannot reasonably estimate fair value, the Company records the amounts as reductions of revenue.
For shipment of products sold to distributors under agreements allowing for returns or credits, title and the risk of ownership to the products transfer to the distributor upon shipment, and the distributor is obligated to pay for the products whether or not the distributor has sold them at the time payment is due. Under the terms of the Company's agreements with such distributors and subject to the Company's prior approval, distributors are entitled to reclaim from the Company as price adjustments the difference, if any, between the prices at which the Company sold the product to the distributors and the prices at which the product is subsequently sold by the distributor. In addition, distributors have limited rights to return inventory that they determine is in excess of their requirements, and accordingly, in determining the appropriate level of provision for excess and obsolete inventory, the Company takes into account the inventories held by its distributors. For these reasons, prices and revenues are not fixed or determinable until the distributor resells the products to the Company's end-user customers and the distributor notifies the Company in writing of the details of such sales transactions. Accordingly, the Company recognizes revenue using the "sell-through" method. Under the "sell-through" method, the Company defers the revenue, adjustments to revenue and the related costs of revenue until the final resale of such products to end customers. The amounts billed to these distributors and adjustments to revenue and the cost of inventory shipped to, but not yet sold by, the
80
OMNIVISION TECHNOLOGIES, INC.
NOTES TO CONSOLIDATED FINANCIAL STATEMENTS—(Continued)
For the Years Ended April 30, 2011, 2010 and 2009
Note 2—Summary of Significant Accounting Policies—(Continued)
distributors are shown net on the Consolidated Balance Sheets as "Deferred revenues, less cost of revenues."
Research, Development and Related
The Company recognizes the costs associated with the internal development of intellectual property rights as expense when incurred. Also included in "Research, Development and Related" are expenses associated with patent, copyright, trademark and trade secrets. The Company recorded the following research and development expenses for the periods presented (in thousands):
| |
Year Ended April 30, | |||||||||
|---|---|---|---|---|---|---|---|---|---|---|
| |
2011 | 2010 | 2009 | |||||||
Research and development expenses |
$ | 85,739 | $ | 76,103 | $ | 81,965 | ||||
Amortization of Acquired Patent Portfolio
The Company recognizes amortization charge associated with the patent portfolio acquired from Eastman Kodak Company ("Kodak") as "Amortization of acquired patent portfolio." (See Note 7.)
Advertising
All of the Company's advertising costs are expensed as incurred.
Income Taxes
The Company accounts for deferred income taxes using the liability method, under which it recognizes as deferred tax assets and liabilities the expected future tax consequences of timing differences between the book and tax basis of assets and liabilities. The Company establishes valuation allowances to reduce deferred tax assets as necessary when management estimates, based on available objective evidence, that it is more likely than not that the Company will not realize the benefit of its deferred tax assets.
The Company recognizes in its consolidated financial statements the impact of a tax position that, based on the technical merits of the position, is more likely than not to be sustained upon examination. The evaluation of a tax position in accordance with this interpretation is a two-step process. In the first step, recognition, the Company determines whether it is more-likely-than-not that a tax position will be sustained upon examination, including resolution of any related appeals or litigation processes, based on the technical merits of the position. The second step addresses measurement of a tax position that meets the more-likely-than-not criterion. The tax position is measured at the largest amount of benefit that has a greater than 50 percent likelihood of being realized upon ultimate settlement. Tax positions that previously failed to meet the more-likely-than-not recognition threshold will be recognized in the first subsequent financial reporting period in which that threshold is met. Previously recognized tax positions that no longer meet the more-likely-than-not recognition threshold will be de-recognized in the first subsequent financial reporting period in which that threshold is no longer met.
81
OMNIVISION TECHNOLOGIES, INC.
NOTES TO CONSOLIDATED FINANCIAL STATEMENTS—(Continued)
For the Years Ended April 30, 2011, 2010 and 2009
Note 2—Summary of Significant Accounting Policies—(Continued)
Stock-Based Compensation
The Company recognizes in its consolidated financial statements all share-based payments to employees, including grants of employee stock options and of other stock-based compensation under the 2000 Stock Plan and the 2007 Equity Incentive Plan, and employee stock purchases under the 2000 Employee Stock Purchase Plan and the 2009 Employee Stock Purchase Plan, based on their respective grant date fair values. The 2007 Equity Incentive Plan replaced the 2000 Stock Plan, and the 2009 Employee Stock Purchase Plan replaced the 2000 Employee Stock Purchase Plan.
Stock-based compensation is measured at the grant date, based on the fair value of the award using the Black-Scholes option pricing model ("Black-Scholes"), and is recognized as expense over the requisite service period of the award. The Company has chosen to recognize stock-based compensation expense using the straight-line attribution method. Black-Scholes requires the use of highly subjective, complex assumptions, including the expected term and the price volatility of the Company's stock. The Company is required to estimate forfeiture rates at the time of grant and revise such estimates, if necessary, in subsequent periods if actual forfeitures differ from initial estimates. Stock-based compensation expense was recorded net of estimated forfeitures such that expense was recorded only for those stock-based awards that are expected to vest.
The Company elected to use the long-form method to establish the beginning balance of, and to determine the subsequent impact on, the additional paid-in capital pool. The Company has also elected to use the "with and without" approach in determining the order in which tax attributes are utilized. As a result, the Company will recognize a tax benefit from stock-based awards in additional paid-in capital only if an incremental tax benefit is realized after all other tax attributes currently available to the Company have been utilized. In addition, the Company has elected to account for the indirect effects of stock-based awards on other tax attributes, such as research and development tax credits, through the Consolidated Statements of Operations.
Comprehensive Income (Loss)
Comprehensive income (loss) is defined as the change in the equity of a company during a period from transactions and other events and circumstances excluding transactions resulting from investments by owners and distributions to owners. Comprehensive income for fiscal 2011 was $125.0 million and included net income, net unrealized gains from available-for-sale securities and translation losses from foreign subsidiaries. Comprehensive income for fiscal 2010 was $6.8 million and included net income, net unrealized losses from available-for-sale securities and translation gains from foreign subsidiaries. Comprehensive loss for fiscal 2009 was $38.1 million and included net loss, the impact of the initial adoption of uncertain tax position accounting standard on retained earnings, net unrealized loss on available-for-sale securities and foreign currency translation losses from foreign subsidiaries.
Basic and Diluted Net Income (Loss) Per Share
The Company computes net income (loss) per share in accordance with authoritative guidance for earnings per share, under the provisions of which basic income (loss) per share is computed by dividing the income (loss) available to holders of common stock for the period by the weighted average number of shares of common stock outstanding during the period. The calculation of diluted income (loss) per share excludes potential common stock if the effect of such stock is antidilutive. Potential common
82
OMNIVISION TECHNOLOGIES, INC.
NOTES TO CONSOLIDATED FINANCIAL STATEMENTS—(Continued)
For the Years Ended April 30, 2011, 2010 and 2009
Note 2—Summary of Significant Accounting Policies—(Continued)
stock consists of incremental common shares issuable upon the exercise of stock options, purchases via employee stock purchase plans, and vesting of restricted stock units.
Noncontrolling Interest
Noncontrolling interest in the Company's consolidated financial statements results from the accounting for the ownership interests in Silicon Optronics, Inc. ("SOI") held by parties other than the Company. In fiscal 2011, 2010 and 2009, the Company recorded approximately $32,000, $321,000 and $0.7 million, respectively, as net loss attributable to noncontrolling interest, representing a respective 56.3%, 56.2% and 56.1% interest that the Company did not own in the net loss of SOI. In the three months ended January 31, 2011, the Company sold its remaining 43.7% interest in SOI for net proceeds of $3.8 million. Consequently, as of April 30, 2011, the Company had no continuing investment in SOI. (See Note 5.)
Recent Accounting Pronouncements
In October 2009, the FASB revised the authoritative guidance for revenue recognition for arrangements with multiple deliverables. The new guidance modifies the requirements for determining whether a deliverable can be treated as a separate unit of accounting by removing the criteria that verifiable and objective evidence of fair value exists for the undelivered elements. In allocating transaction consideration among the deliverables, the guidance also introduced the concept of using management's best estimate of a standalone selling price as an alternate basis for allocation. The guidance is effective in fiscal years beginning on or after June 15, 2010, and the Company is required to adopt this guidance in its first quarter of fiscal 2012. The Company does not expect the adoption of this guidance to have any material impact on its financial position, results of operations or cash flows.
In October 2009, the FASB issued authoritative guidance addressing certain revenue arrangements that include software elements. This guidance states that tangible products with hardware and software components that work together to deliver the product functionality are considered non-software products, and the accounting guidance under the revenue arrangements with multiple deliverables is to be followed. The guidance is effective in fiscal years beginning on or after June 15, 2010, and the Company is required to adopt this guidance in its first quarter of fiscal 2012. The Company does not expect the adoption of this guidance to have any material impact on its financial position, results of operations or cash flows.
In December 2010, the FASB issued additional guidance for entities with reporting units that have carrying amounts equal to zero or are negative. These entities are required to assess whether it is more likely than not that the reporting units' goodwill is impaired. If it is determined that it is more likely than not that the goodwill of one or more of its reporting units is impaired, then Step 2 of the goodwill impairment test for those reporting unit(s) should be performed. The effective date for this guidance is for fiscal years, and interim periods within those years, beginning after December 15, 2010. Early adoption is not permitted. The Company does not expect the adoption of this guidance to have any material impact on its financial position, results of operations or cash flows.
In May 2011, the FASB issued new guidance for fair value measurements to provide a consistent definition of fair value and ensure that the fair value measurement and disclosure requirements are similar between GAAP and International Financial Reporting Standards. The guidance changes certain
83
OMNIVISION TECHNOLOGIES, INC.
NOTES TO CONSOLIDATED FINANCIAL STATEMENTS—(Continued)
For the Years Ended April 30, 2011, 2010 and 2009
Note 2—Summary of Significant Accounting Policies—(Continued)
fair value measurement principles and enhances the disclosure requirements particularly for level 3 fair value measurements. The guidance is effective for the Company prospectively beginning in the first quarter of fiscal 2012. The Company is currently evaluating the impact this guidance may have on its financial position, results of operations and cash flows.
Note 3—Short-Term Investments
Available-for-sale securities as of the dates presented were as follows (in thousands):
| |
As of April 30, 2011 | ||||||||||||
|---|---|---|---|---|---|---|---|---|---|---|---|---|---|
| |
Amortized Cost |
Gross Unrealized Gains |
Gross Unrealized Losses |
Fair Value |
|||||||||
Certificates of deposit |
$ | 1,500 | $ | 3 | $ | — | $ | 1,503 | |||||
U.S. government debt securities with maturities less than one year |
61,862 | 11 | (7 | ) | 61,866 | ||||||||
U.S. government debt securities with maturities over one year |
718 | 1 | — | 719 | |||||||||
Commercial paper and bond funds |
23,412 | 10 | (5 | ) | 23,417 | ||||||||
|
$ | 87,492 | $ | 25 | $ | (12 | ) | $ | 87,505 | ||||
Contractual maturity dates, less than one year |
$ | 82,721 | |||||||||||
Contractual maturity dates, one year to two years |
4,784 | ||||||||||||
|
$ | 87,505 | |||||||||||
| |
As of April 30, 2010 | ||||||||||||
|---|---|---|---|---|---|---|---|---|---|---|---|---|---|
| |
Amortized Cost |
Gross Unrealized Gains |
Gross Unrealized Losses |
Fair Value |
|||||||||
Certificates of deposit |
$ | 2,285 | $ | — | $ | — | $ | 2,285 | |||||
U.S. government debt securities with maturities less than one year |
77,128 | 12 | — | 77,140 | |||||||||
U.S. government debt securities with maturities over one year |
8,145 | 5 | — | 8,150 | |||||||||
Commercial paper and bond funds |
11,999 | (19 | ) | 11,980 | |||||||||
|
$ | 99,557 | $ | 17 | $ | (19 | ) | $ | 99,555 | ||||
Contractual maturity dates, less than one year |
$ | 91,405 | |||||||||||
Contractual maturity dates, one year to two years |
8,150 | ||||||||||||
|
$ | 99,555 | |||||||||||
The Company sold available-for-sale investments, primarily marketable debt instruments, for proceeds of approximately $45.5 million, zero and zero in fiscal 2011, 2010 and 2009, respectively. The Company employs the specific-identification method in the determination of any applicable gain or loss on the sale of the investment.
84
OMNIVISION TECHNOLOGIES, INC.
NOTES TO CONSOLIDATED FINANCIAL STATEMENTS—(Continued)
For the Years Ended April 30, 2011, 2010 and 2009
Note 4—Supplemental Balance Sheet Account Information (in thousands)
| |
April 30, | ||||||||
|---|---|---|---|---|---|---|---|---|---|
| |
2011 | 2010 | |||||||
Cash and cash equivalents: |
|||||||||
Cash |
$ | 272,481 | $ | 183,393 | |||||
Money market funds, certificates of deposit and U.S. government bonds |
106,898 | 50,630 | |||||||
|
$ | 379,379 | $ | 234,023 | |||||
Accounts receivable, net: |
|||||||||
Accounts receivable |
$ | 146,745 | $ | 75,908 | |||||
Less: Allowance for doubtful accounts |
(1,834 | ) | (711 | ) | |||||
Allowance for sales returns |
(2,305 | ) | (936 | ) | |||||
|
$ | 142,606 | $ | 74,261 | |||||
Inventories: |
|||||||||
Work in progress |
$ | 62,393 | $ | 76,845 | |||||
Finished goods |
44,480 | 57,148 | |||||||
|
$ | 106,873 | $ | 133,993 | |||||
Prepaid expenses and other current assets: |
|||||||||
Prepaid expenses |
$ | 4,102 | $ | 6,398 | |||||
Deposits and other |
4,699 | 2,686 | |||||||
Interest receivable |
870 | 296 | |||||||
|
$ | 9,671 | $ | 9,380 | |||||
Property, plant and equipment, net: |
|||||||||
Land |
$ | 13,000 | $ | 13,000 | |||||
Buildings and land use right |
58,781 | 37,877 | |||||||
Buildings/leasehold improvements |
21,902 | 19,148 | |||||||
Machinery and equipment |
68,710 | 64,894 | |||||||
Furniture and fixtures |
4,817 | 4,810 | |||||||
Software |
6,387 | 5,873 | |||||||
Construction in progress |
4,932 | 23,419 | |||||||
|
178,529 | 169,021 | |||||||
Less: Accumulated depreciation and amortization |
(63,083 | ) | (47,474 | ) | |||||
|
$ | 115,446 | $ | 121,547 | |||||
Other long-term assets: |
|||||||||
Deferred income tax assets—non-current |
$ | 9,879 | $ | 20,440 | |||||
Prepaid wafer credits |
— | 2,826 | |||||||
Long-term employee loan receivable |
— | 1,000 | |||||||
Other long-term assets |
2,232 | 1,227 | |||||||
|
$ | 12,111 | $ | 25,493 | |||||
Accrued expenses and other current liabilities: |
|||||||||
Employee compensation |
$ | 9,605 | $ | 7,490 | |||||
Third party commissions |
694 | 1,004 | |||||||
Professional services |
1,912 | 2,383 | |||||||
Noncancelable purchase commitments |
2,100 | 4,689 | |||||||
Rebates |
2,951 | 1,871 | |||||||
Other |
8,221 | 2,069 | |||||||
|
$ | 25,483 | $ | 19,506 | |||||
Other long-term liabilities: |
|||||||||
Deferred income tax liabilities—non-current |
$ | 293 | $ | 1,040 | |||||
Interest rate swaps |
3,929 | 3,687 | |||||||
Other |
250 | — | |||||||
|
$ | 4,472 | $ | 4,727 | |||||
85
OMNIVISION TECHNOLOGIES, INC.
NOTES TO CONSOLIDATED FINANCIAL STATEMENTS—(Continued)
For the Years Ended April 30, 2011, 2010 and 2009
Note 5—Long-Term Investments
Long-term investments as of the dates indicated consisted of the following (in thousands):
| |
April 30, | |||||||
|---|---|---|---|---|---|---|---|---|
| |
2011 | 2010 | ||||||
VisEra |
$ | 81,258 | $ | 72,170 | ||||
WLCSP |
14,042 | 11,819 | ||||||
XinTec |
4,661 | 4,661 | ||||||
Tong Hsing |
4,655 | 3,471 | ||||||
Total |
$ | 104,616 | $ | 92,121 | ||||
VisEra Technologies Company, Ltd.
On October 29, 2003, the Company and Taiwan Semiconductor Manufacturing Company Limited ("TSMC") entered into an agreement to form VisEra Technologies Company, Ltd. ("VisEra"), a joint venture in Taiwan, for the purposes of providing certain manufacturing and automated final testing services related to complementary metal oxide semiconductor ("CMOS") image sensors. In August 2005, under an amendment to the original 2003 joint-venture agreement, the Company and TSMC formed VisEra Holding Company ("VisEra Cayman"), a company incorporated in the Cayman Islands, and VisEra became a subsidiary of VisEra Cayman. The Company and TSMC have equal interests in VisEra Cayman. As of April 30, 2011, the Company owned 49.1% of VisEra Cayman.
Through April 2007, the Company's contributions to VisEra and VisEra Cayman totaled $51.6 million, effectively meeting its commitment under the terms of a January 2007 amendment to the joint-venture agreement, in which the Company and TSMC have agreed to commit a total of $112.9 million to the joint venture. The Company has not made any subsequent contributions into VisEra or VisEra Cayman.
The Company initially accounted for its investment in VisEra under the equity method. Between August 1, 2005 and December 31, 2006, VisEra was considered a variable interest entity ("VIE"), and the Company was the primary beneficiary, as defined under the accounting guidance for VIEs. Accordingly, the Company consolidated VisEra's operating results. On January 1, 2007, VisEra ceased to meet the definition of a VIE. Consequently, the Company deconsolidated VisEra on January 1, 2007, and has since accounted for its investment in VisEra under the equity method. (See Note 17.)
The following table presents equity income (loss) recorded by the Company for the periods indicated in "Cost of revenues," consisting of its portion of the net income (loss) recorded by VisEra during the periods presented (in thousands) (See Note 17):
| |
Year Ended April 30, | |||||||||
|---|---|---|---|---|---|---|---|---|---|---|
| |
2011 | 2010 | 2009 | |||||||
Equity income (loss) |
$ | 8,887 | $ | 4,251 | $ | (1,275 | ) | |||
86
OMNIVISION TECHNOLOGIES, INC.
NOTES TO CONSOLIDATED FINANCIAL STATEMENTS—(Continued)
For the Years Ended April 30, 2011, 2010 and 2009
Note 5—Long-Term Investments—(Continued)
China WLCSP Limited
China WLCSP Limited ("WLCSP") is in the business of designing, manufacturing, packaging and selling certain wafer level chip scale packaging related services. In May 2007, the Company acquired 4,500,000 units of WLCSP's equity interests, or 20.0% of WLCSP's registered capital on a fully-diluted basis, for an aggregate purchase amount of $9.0 million. The Company has appointed a member to WLCSP's board of directors and a supervisor.
At the date of the transaction, the Company's $9.0 million investment in WLCSP exceeded its share of the book value of WLCSP's assets by $5.7 million. Of this $5.7 million difference, $4.1 million represents equity method goodwill that is not subject to amortization. This amount is recorded as a portion of the Company's investment in WLCSP. The Company is amortizing the remaining basis difference of $1.6 million, which is attributable to intangible assets of WLCSP, over various periods up to a maximum of five years. As of April 30, 2011, the Company owned 18.7% of WLCSP.
The Company received the following dividend payments from WLCSP during the periods presented (in thousands):
| |
Year Ended April 30, | |||||||||
|---|---|---|---|---|---|---|---|---|---|---|
| |
2011 | 2010 | 2009 | |||||||
Dividend payments received from WLCSP |
$ | 585 | $ | 585 | $ | — | ||||
The Company accounts for its investment in WLCSP under the equity method. The following table presents equity income recorded by the Company for the periods indicated in "Other income (loss), net," consisting of its portion of the net income recorded by WLCSP during the periods presented, and equity method investment adjustments (in thousands) (See Note 17.):
| |
Year Ended April 30, | |||||||||
|---|---|---|---|---|---|---|---|---|---|---|
| |
2011 | 2010 | 2009 | |||||||
Equity income |
$ | 3,076 | $ | 1,993 | $ | 703 | ||||
XinTec, Inc.
XinTec, Inc. ("XinTec") is a Taiwan-based supplier of chip scale packaging services. The Company first made investments in XinTec in April 2003, for $2.8 million. As of April 30, 2011, the Company's direct ownership percentage in XinTec was 4.2%. Separately, VisEra Cayman owns a 16.0% interest in XinTec. Consequently, the Company's beneficial ownership percentage in XinTec was approximately 12.0%. The Company accounts for XinTec as a cost method investment.
Tong Hsing Electronic Industries, Limited
Tong Hsing Electronic Industries, Limited ("Tong Hsing") is a Taiwan-based public company principally engaged in the development and production of microelectronic packaging. In December 2009, the Company obtained 0.8% of the outstanding shares of common stock of Tong Hsing, or 996,250 shares, when Tong Hsing acquired ImPac Technology Co., Ltd. ("ImPac") in a stock-for-stock exchange. Prior to the exchange, the Company owned 25.7% of ImPac. As a result of the exchange, the
87
OMNIVISION TECHNOLOGIES, INC.
NOTES TO CONSOLIDATED FINANCIAL STATEMENTS—(Continued)
For the Years Ended April 30, 2011, 2010 and 2009
Note 5—Long-Term Investments—(Continued)
Company recorded a gain of approximately $2.2 million in "Other income (expense), net," which was the difference between the fair value of the Tong Hsing's shares the Company received on December 31, 2009, and the carrying value of the Company's investment in ImPac on the same day. In June 2010, the Company participated in Tong Hsing's secondary offering and purchased an additional 95,570 shares for approximately $282,000. As of April 30, 2011, the Company's ownership in Tong Hsing was approximately 0.8%.
As the shares of Tong Hsing are traded on the Taiwan Stock Exchange and the share price is readily determinable, the Company reported the shares on a mark-to-market basis, net of deferred taxes. For the periods indicated, the Company recorded the following unrealized holding gains in "Accumulated other comprehensive income" (in thousands):
| |
Year Ended April 30, | |||||||||
|---|---|---|---|---|---|---|---|---|---|---|
| |
2011 | 2010 | 2009 | |||||||
Unrealized holding gains |
$ | 608 | $ | — | $ | — | ||||
Silicon Optronics, Inc.
In May 2004, the Company entered into an agreement with Powerchip Technology Corporation ("PTC"), formerly Powerchip Semiconductor Corporation, a Taiwan based company that produces memory chips and provides semiconductor foundry services, to establish Silicon Optronics, Inc. ("SOI"), a joint venture in Taiwan. The Company contributed approximately $2.1 million to SOI in exchange for an ownership percentage of 49.0%. In March 2005, the Company assumed control of the board of directors of SOI and the Company consolidated SOI from April 30, 2005 through May 2010. The purpose of SOI was to manufacture, market and sell certain of the Company's legacy products. Toward the end of fiscal 2010, SOI began to ship niche products into other markets, including touch panels that track touches with optical sensors, and linear sensors.
In June 2010, SOI held its annual meeting of stockholders and new board directors were elected. As a result, the Company no longer held the majority representation on the board of directors of SOI, and was required to deconsolidate SOI. The authoritative guidance for deconsolidation required the Company to record its retained interest in SOI at fair value. Pursuant to the guidance, the Company recorded a gain of approximately $1.6 million in "Other income (expense), net," which was the difference between the fair value of the Company's retained interest in SOI of $4.1 million, and the carrying value of SOI's net assets and noncontrolling interest before the deconsolidation of $2.5 million. After the deconsolidation, the Company owned 43.8% of SOI, which the Company accounted for under the equity method.
In the three months ended January 31, 2011, the Company sold its remaining 43.7% interest in SOI for net proceeds of $3.8 million, at which time the Company recorded a loss on sale of $72,000 to "Other income (expense), net." For the period from November 1, 2010 through the date of the sale, the Company recorded $26,000 for its share of the equity income of SOI. Consequently, as of April 30, 2011, the Company's ownership in SOI was zero percent and the Company had no continuing investment in SOI.
88
OMNIVISION TECHNOLOGIES, INC.
NOTES TO CONSOLIDATED FINANCIAL STATEMENTS—(Continued)
For the Years Ended April 30, 2011, 2010 and 2009
Note 5—Long-Term Investments—(Continued)
Noncontrolling interest represented ownership interests in SOI held by parties other than the Company. The following table reconciles equity attributable to noncontrolling interest for the periods indicated (in thousands):
| |
Year Ended April 30, | ||||||||||
|---|---|---|---|---|---|---|---|---|---|---|---|
| |
2011 | 2010 | 2009 | ||||||||
Noncontrolling interest, May 1 |
$ | 3,390 | $ | 3,497 | $ | 4,444 | |||||
Cash contribution by noncontrolling interest |
— | 34 | — | ||||||||
Affiliate cash dividend paid to noncontrolling interest |
— | — | (201 | ) | |||||||
Net loss attributable to noncontrolling interest |
(32 | ) | (321 | ) | (746 | ) | |||||
Translation gain (loss) |
(70 | ) | 180 | — | |||||||
Deconsolidation |
(3,288 | ) | — | — | |||||||
Noncontrolling interest, April 30 |
$ | — | $ | 3,390 | $ | 3,497 | |||||
The following table presents the summary combined financial information of the Company's investee companies, as derived from their respective financial statements for the periods indicated and as of April 30, 2011 and 2010. Fiscal 2011 represents the combined operating results of SOI, VisEra and WLCSP. Fiscal 2010 represents the combined operating results of ImPac, VisEra and WLCSP. Fiscal 2009 represents the combined operating results of ImPac, VisEra and WLCSP. Each investee financial statement was prepared under GAAP (in thousands):
| |
Year Ended April 30, | ||||||||||
|---|---|---|---|---|---|---|---|---|---|---|---|
| |
2011 | 2010 | 2009 | ||||||||
Operating data: |
|||||||||||
Revenues |
$ | 165,904 | $ | 119,282 | $ | 87,615 | |||||
Gross profit |
51,422 | 25,971 | 10,287 | ||||||||
Income (loss) from operations |
31,277 | 11,363 | (2,083 | ) | |||||||
Net income (loss) |
$ | 31,644 | $ | 13,273 | $ | (259 | ) | ||||
| |
April 30, | |||||||
|---|---|---|---|---|---|---|---|---|
| |
2011 | 2010 | ||||||
Balance sheet data: |
||||||||
Current assets |
$ | 127,921 | $ | 85,621 | ||||
Long-term assets |
195,221 | 184,525 | ||||||
Current liabilities |
48,465 | 30,620 | ||||||
Long-term liabilities |
$ | 349 | $ | 2,162 | ||||
The Company's share of undistributed earnings of investees accounted for by the equity method as of the dates indicated were as follows (in thousands):
| |
April 30, | ||||||
|---|---|---|---|---|---|---|---|
| |
2011 | 2010 | |||||
Undistributed earnings of investees |
$ | 27,509 | $ | 20,806 | |||
89
OMNIVISION TECHNOLOGIES, INC.
NOTES TO CONSOLIDATED FINANCIAL STATEMENTS—(Continued)
For the Years Ended April 30, 2011, 2010 and 2009
Note 6—Acquisition of Aurora Systems, Inc.
In March 2010, the Company acquired all of the outstanding common and preferred stock of Aurora Systems, Inc. ("Aurora"), pursuant to the Agreement and Plan of Merger dated February 11, 2010 (the "Agreement"). Aurora is a privately-held company incorporated in California that designs and markets liquid crystal on silicon based microdisplay panels. These microdisplay panels are used for projection applications in consumer electronics, industrial, aerospace, and mobile viewing platforms. Under the terms of the Agreement, the closing consideration was $5.6 million in cash, with no additional contingent consideration.
The Company allocated the purchase consideration to tangible assets, intangible assets and liabilities based on their estimated fair values. The excess purchase price over the value of the net tangible and identifiable intangible assets was recorded as goodwill. The $439,000 in goodwill resulted primarily from the Company's expected synergies from the integration of Aurora's technology into the Company's future product offerings. The fair values assigned to acquired intangible assets were based on discounting to present values all relevant expected future cash flows that reflect management determined estimates and assumptions These estimates include, but are not limited to, estimated costs to complete, utilization of patents and core technology, and the markets served. The cash flows were discounted at rates ranging from 19% to 25%.
The amount of revenues and net loss of Aurora included in the Company's consolidated statement of operations from the acquisition date to April 30, 2010, the end of fiscal 2010, and pro forma financial information on the acquisition as if the transaction had occurred as of the beginning of fiscal 2010 were not significant.
Note 7—Goodwill and Intangible Assets
Goodwill
The change to the carrying value of the Company's goodwill during fiscal 2011 and 2010 is reflected below (in thousands):
| |
Year Ended April 30, | |||||||
|---|---|---|---|---|---|---|---|---|
| |
2011 | 2010 | ||||||
Beginning balance, May 1 |
$ | 439 | $ | — | ||||
Business acquisitions |
683 | 439 | ||||||
Ending balance, April 30 |
$ | 1,122 | $ | 439 | ||||
Intangible Assets
In March 2011, the Company purchased certain sensor-related patents and patent applications from Kodak in a cash transaction. As a result, the Company recorded $65.0 million in additions to intangible assets, which the Company began amortizing over an estimated life of seven years during the three months ended April 30, 2011.
90
OMNIVISION TECHNOLOGIES, INC.
NOTES TO CONSOLIDATED FINANCIAL STATEMENTS—(Continued)
For the Years Ended April 30, 2011, 2010 and 2009
Note 7—Goodwill and Intangible Assets—(Continued)
Intangible assets as of the dates indicated consisted of the following (in thousands):
| |
April 30, 2011 | ||||||||||
|---|---|---|---|---|---|---|---|---|---|---|---|
| |
Cost | Accumulated Amortization |
Net Book Value |
||||||||
Acquired patent portfolio |
$ | 65,000 | $ | 774 | $ | 64,226 | |||||
Core technology |
24,410 | 19,474 | 4,936 | ||||||||
Patents and licenses |
13,460 | 13,423 | 37 | ||||||||
Trademarks and tradenames |
1,400 | 1,400 | — | ||||||||
Customer relationships |
340 | 137 | 203 | ||||||||
In-process research and development |
490 | — | 490 | ||||||||
Intangible assets, net |
$ | 105,100 | $ | 35,208 | $ | 69,892 | |||||
| |
April 30, 2010 | ||||||||||
|---|---|---|---|---|---|---|---|---|---|---|---|
| |
Cost | Accumulated Amortization |
Net Book Value |
||||||||
Core technology |
$ | 21,010 | $ | 17,856 | $ | 3,154 | |||||
Patents and licenses |
13,487 | 12,477 | 1,010 | ||||||||
Trademarks and tradenames |
1,400 | 1,400 | — | ||||||||
Customer relationships |
340 | 103 | 237 | ||||||||
In-process research and development |
490 | — | 490 | ||||||||
Intangible assets, net |
$ | 36,727 | $ | 31,836 | $ | 4,891 | |||||
The following table presents the amortization of intangibles recorded by the Company for the periods indicated (in thousands):
| |
Year Ended April 30, | |||||||||
|---|---|---|---|---|---|---|---|---|---|---|
| |
2011 | 2010 | 2009 | |||||||
Amortization of intangible assets |
$ | 2,626 | $ | 6,445 | $ | 6,532 | ||||
Amortization of acquired patent portfolio |
$ | 774 | $ | — | $ | — | ||||
The total expected future annual amortization of these intangible assets is as follows (in thousands):
Years Ending April 30,
|
|
||||
|---|---|---|---|---|---|
2012 |
$ | 11,264 | |||
2013 |
11,188 | ||||
2014 |
10,051 | ||||
2015 |
9,662 | ||||
2016 |
9,621 | ||||
Thereafter |
18,106 | ||||
Total |
$ | 69,892 | |||
91
OMNIVISION TECHNOLOGIES, INC.
NOTES TO CONSOLIDATED FINANCIAL STATEMENTS—(Continued)
For the Years Ended April 30, 2011, 2010 and 2009
Note 8—Borrowing Arrangements and Related Derivative Instruments
The following table sets forth the Company's debt as of the dates indicated (in thousands):
| |
April 30, | |||||||
|---|---|---|---|---|---|---|---|---|
| |
2011 | 2010 | ||||||
Mortgage loan |
$ | 25,314 | $ | 25,867 | ||||
Term loan |
4,000 | 7,000 | ||||||
Construction loan |
16,925 | 16,847 | ||||||
|
46,239 | 49,714 | ||||||
Less: amount due within one year |
(4,323 | ) | (4,286 | ) | ||||
Non-current portion of long-term debt |
$ | 41,916 | $ | 45,428 | ||||
At April 30, 2011, aggregate debt maturities were as follows (in thousands):
Years Ending April 30,
|
Mortgage and Term Loans |
Construction Loan |
Total | ||||||||
|---|---|---|---|---|---|---|---|---|---|---|---|
2012 |
$ | 3,554 | $ | 769 | $ | 4,323 | |||||
2013 |
1,554 | 1,539 | 3,093 | ||||||||
2014 |
554 | 3,077 | 3,631 | ||||||||
2015 |
554 | 3,077 | 3,631 | ||||||||
2016 |
554 | 6,155 | 6,709 | ||||||||
Thereafter |
22,544 | 2,308 | 24,852 | ||||||||
Total |
$ | 29,314 | $ | 16,925 | $ | 46,239 | |||||
Mortgage Loan and Term Loan
On March 16, 2007, the Company entered into a Loan and Security Agreement with a domestic bank for the purchase of a complex of four buildings located in Santa Clara, California (the "Santa Clara Property"). The Loan and Security Agreement provides for a mortgage loan in the principal amount of $27.9 million (the "Mortgage Loan") and a secured line of credit with an aggregate maximum principal amount of up to $12.0 million (the "Term Loan"). In March 2008, the Company borrowed $6.0 million under the Term Loan to finance improvements to the Santa Clara Property. The Company drew down the remaining $6.0 million under the Term Loan in July 2008.
Borrowings under the Mortgage Loan accrue interest at the London Interbank Borrowing Rate ("LIBOR") plus 90 basis points. Borrowings under the Term Loan accrue interest at the LIBOR rate plus 125 basis points. The Mortgage and Term Loans mature on March 31, 2017 and July 31, 2012, respectively. The Company was in compliance with the financial covenants of the Loan and Security Agreement as of April 30, 2011.
92
OMNIVISION TECHNOLOGIES, INC.
NOTES TO CONSOLIDATED FINANCIAL STATEMENTS—(Continued)
For the Years Ended April 30, 2011, 2010 and 2009
Note 8—Borrowing Arrangements and Related Derivative Instruments—(Continued)
Interest rates under the Mortgage Loan and the Term Loan for the dates indicated are set forth below:
| |
April 30, | ||||||
|---|---|---|---|---|---|---|---|
| |
2011 | 2010 | |||||
Mortgage Loan |
1.1 | % | 1.2 | % | |||
Term Loan |
1.5 | 1.5 | |||||
In conjunction with the Mortgage Loan, the Company entered into an interest rate swap with the same bank to effectively convert the variable interest rate described above to a fixed rate. The swap is for a period of ten years, and the notional amount of the swap approximates the principal outstanding under the Mortgage Loan. The Company is the fixed rate payer under the swap and the rate is fixed at 5.3% per annum and the effective rate on the Mortgage Loan is fixed at approximately 6.2%. In July 2008, in connection with the Term Loan, the Company entered into a second interest rate swap with the bank to effectively convert the variable interest rate described above to a fixed rate. This second swap is for a period of four years. The Company is the fixed rate payer and the rate is fixed at 4.3% per annum and the effective rate on the Term Loan is fixed at approximately 5.5%.
Construction Loan
On August 3, 2009, OmniVision Technologies (Shanghai) Co., Ltd., a wholly-owned subsidiary of the Company, entered into a Fixed Assets Loan Agreement with a bank in China (the "Construction Loan"). The purpose of the Construction Loan is to construct a research center for the Company in Pudong Development Zone, the Zhang Jiang Science Park in Shanghai, China. The loan amount is Chinese Yuan 140.0 million or approximately $20.5 million based on exchange rate in effect at the time of the loan origination. As of April 30, 2011, the Company has borrowed Chinese Yuan 115.0 million, or approximately $17.7 million, under the Construction Loan. The Construction Loan matures on June 30, 2016.
The interest rate under the Construction Loan is based on an indicative rate as published by the Chinese government, and will be adjusted every September to the then current published rate. The interest rate under the Construction Loan was 5.3% at April 30, 2011. The Company was in compliance with the financial covenants of the Fixed Assets Loan Agreement as of April 30, 2011.
Derivative Instruments and Hedging Activities
As indicated above, the Company holds two separate interest rate swaps in connection with the Mortgage Loan and the Term Loan. The Company utilizes the swaps to reduce the effect of interest rate variability on the two loans' interest payments. The Company has not designated the two interest rate swaps as hedging instruments. Consequently, the Company remeasures the two interest rate swaps at fair value at each balance sheet date, and immediately recognizes any changes to the fair values in earnings. On the consolidated balance sheet, the Company records the swaps as either assets or liabilities, depending on whether the fair value represents net gains or net losses. (See Note 11.)
93
OMNIVISION TECHNOLOGIES, INC.
NOTES TO CONSOLIDATED FINANCIAL STATEMENTS—(Continued)
For the Years Ended April 30, 2011, 2010 and 2009
Note 8—Borrowing Arrangements and Related Derivative Instruments—(Continued)
The table below presents the location of the swaps on the Consolidated Statements of Operations and Consolidated Balance Sheets, and the related effects on the Company's results of operations and financial positions for the periods indicated (in thousands):
| |
Year Ended April 30, | ||||||||||
|---|---|---|---|---|---|---|---|---|---|---|---|
| |
2011 | 2010 | 2009 | ||||||||
Location of amounts recognized in Consolidated Statements of Operations and amount of gains (losses): |
|||||||||||
Other income (expense), net |
$ | (242 | ) | $ | 776 | $ | (2,234 | ) | |||
| |
April 30, | |||||||
|---|---|---|---|---|---|---|---|---|
| |
2011 | 2010 | ||||||
Location of amounts on Consolidated Balance Sheets and fair values: |
||||||||
Other long-term liabilities |
$ | 3,929 | $ | 3,687 | ||||
Note 9—Income Taxes
The provision for (benefit from) income taxes consists of the following (in thousands):
| |
Year Ended April 30, | |||||||||||
|---|---|---|---|---|---|---|---|---|---|---|---|---|
| |
2011 | 2010 | 2009 | |||||||||
Current: |
||||||||||||
Federal |
$ | (6,231 | ) | $ | (2,396 | ) | $ | (279 | ) | |||
State |
9 | (42 | ) | 2 | ||||||||
Foreign |
5,829 | 11,641 | 4,463 | |||||||||
Total current |
(393 | ) | 9,203 | 4,186 | ||||||||
Deferred: |
||||||||||||
Federal |
4,191 | (5,022 | ) | (6,017 | ) | |||||||
State |
427 | (234 | ) | (343 | ) | |||||||
Foreign |
— | (64 | ) | 2,016 | ||||||||
Total deferred |
4,618 | (5,320 | ) | (4,344 | ) | |||||||
Total provision (benefit) |
$ | 4,225 | $ | 3,883 | $ | (158 | ) | |||||
Income (losses) before provision for income taxes consisted of (in thousands):
| |
Year Ended April 30, | ||||||||||
|---|---|---|---|---|---|---|---|---|---|---|---|
| |
2011 | 2010 | 2009 | ||||||||
United States |
$ | 19,558 | $ | (26,121 | ) | $ | (39,550 | ) | |||
International |
109,117 | 36,407 | 1,323 | ||||||||
Total |
$ | 128,675 | $ | 10,286 | $ | (38,227 | ) | ||||
94
OMNIVISION TECHNOLOGIES, INC.
NOTES TO CONSOLIDATED FINANCIAL STATEMENTS—(Continued)
For the Years Ended April 30, 2011, 2010 and 2009
Note 9—Income Taxes—(Continued)
The provision for (benefit from) income taxes differs from the amount computed by applying the U.S. federal income tax rate of 35.0% to "Income (loss) before income taxes" as a result of the following (in thousands):
| |
Year Ended April 30, | ||||||||||
|---|---|---|---|---|---|---|---|---|---|---|---|
| |
2011 | 2010 | 2009 | ||||||||
Provision based on statutory federal income tax |
$ | 45,036 | $ | 3,600 | $ | (13,379 | ) | ||||
State income tax expense (benefit), net of federal tax benefit |
381 | (169 | ) | (395 | ) | ||||||
Foreign rate differential |
(37,809 | ) | (2,976 | ) | 6,312 | ||||||
Non-deductible stock-based compensation |
1,807 | 4,053 | 6,450 | ||||||||
Tax credits |
(5,078 | ) | (706 | ) | (1,469 | ) | |||||
Non-deductible goodwill impairment loss |
— | — | 2,640 | ||||||||
Other |
(112 | ) | 81 | (317 | ) | ||||||
Tax provision (benefit) |
$ | 4,225 | $ | 3,883 | $ | (158 | ) | ||||
The effective tax rates for fiscal 2011, 2010 and 2009 are less than the combined U.S. federal and state statutory rate of approximately 40%, principally because the Company earns a portion of its profits in jurisdictions where tax rates are lower than the combined U.S. federal and state statutory rate. In fiscal 2011, the Company included in the amount of foreign rate differential the tax benefit from a $10.6 million reduction of unrecognized tax benefits due to lapses of applicable statute of limitations and a $5.0 million income tax expense accrued for certain non-U.S. earnings that were previously considered to be indefinitely reinvested.
The Tax Relief, Unemployment Insurance Reauthorization, and Job Creation Act of 2010, which was signed into law on December 17, 2010, retroactively extended the U.S. Federal Research and Development tax credit ("Federal R&D Credit") from January 1, 2010 to December 31, 2011. This enacted tax law change resulted in the incremental tax benefit in fiscal 2011 from the retroactively extended Federal R&D Credit.
95
OMNIVISION TECHNOLOGIES, INC.
NOTES TO CONSOLIDATED FINANCIAL STATEMENTS—(Continued)
For the Years Ended April 30, 2011, 2010 and 2009
Note 9—Income Taxes—(Continued)
The components of net deferred tax assets included in the consolidated balance sheets for the fiscal years indicated were (in thousands):
| |
April 30, | ||||||||
|---|---|---|---|---|---|---|---|---|---|
| |
2011 | 2010 | |||||||
Deferred tax assets: |
|||||||||
Tax credits |
$ | 17,911 | $ | 10,750 | |||||
Net operating loss |
1,805 | 1,196 | |||||||
Reserves |
945 | 2,998 | |||||||
Stock-based compensation expenses |
7,109 | 10,738 | |||||||
Unrealized loss on interest rate swap |
1,466 | 1,407 | |||||||
Accruals and other |
3,903 | 2,006 | |||||||
Gross deferred tax assets |
33,139 | 29,095 | |||||||
Valuation allowance |
(8,058 | ) | (5,264 | ) | |||||
Deferred tax assets |
25,081 | 23,831 | |||||||
Deferred tax liabilities: |
|||||||||
Fixed assets |
(707 | ) | (1,301 | ) | |||||
Undistributed earnings of non-US equity investees not permanently reinvested |
(9,938 | ) | (1,040 | ) | |||||
Other |
— | (100 | ) | ||||||
Deferred tax liabilities |
(10,645 | ) | (2,441 | ) | |||||
Net deferred tax assets |
$ | 14,436 | $ | 21,390 | |||||
The Company has elected to derecognize both the gross deferred income tax assets and the offsetting valuation allowance pertaining to net operating loss and tax credit carryforwards that represent excess tax benefits from stock-based awards. Recognition of a deferred tax asset for excess tax benefits due to stock-based compensation deductions that have not yet been realized through a reduction in income taxes payable is prohibited. Such unrecognized deferred tax benefits totaled $20.2 million and $10.1 million as of April 30, 2011 and 2010, respectively, and, if and when realized through a reduction in income taxes payable, will be accounted for as a credit to additional paid-in capital.
Management regularly assesses the realizability of deferred tax assets recorded based upon the weight of available evidence, including such factors as recent earnings history and expected future taxable income on a jurisdiction by jurisdiction basis. Deferred tax assets in the amount of $8.1 million and $5.3 million at April 30, 2011 and 2010, respectively, primarily pertain to California research and development tax credit carryovers that the Company believes it is more likely than not that the Company will not realize; therefore, a valuation allowance has been established against such deferred tax assets. In the future, if the credit is utilized and the valuation allowance is released, the release of valuation allowance will be accounted for as a reduction of the income tax expense in the year such event occurs.
96
OMNIVISION TECHNOLOGIES, INC.
NOTES TO CONSOLIDATED FINANCIAL STATEMENTS—(Continued)
For the Years Ended April 30, 2011, 2010 and 2009
Note 9—Income Taxes—(Continued)
As of April 30, 2011, the Company has U.S. federal and state net operating loss ("NOL") carryforwards of $32.4 million and $18.3 million, respectively. If not utilized, the U.S. federal NOL will begin to expire in fiscal 2028 and the state NOL will begin to expire in fiscal 2032. The Company has U.S. federal and state tax credits of $20.2 million and $22.4 million, respectively. If not utilized, the U.S. federal tax credits will begin to expire in fiscal 2025 and the U.S. state tax credits will be carried over indefinitely.
The Company has not provided U.S. federal and state income taxes, as well as foreign withholding taxes, on approximately $333.9 million of undistributed earnings for certain non-U.S. subsidiaries and equity investee companies, because such earnings are intended to be indefinitely reinvested. Determination of the amount of unrecognized deferred tax liability for temporary differences related to investment in these non-U.S. subsidiaries and equity investee companies that are essentially permanent in duration is not practicable.
The Company is subject to income taxes in the U.S. and numerous foreign jurisdictions. Significant judgment is required in evaluating the tax positions and determining the provision for income taxes. During the ordinary course of business, there are many transactions and calculations for which the ultimate tax determination is uncertain. The Company establishes reserves for tax-related uncertainties based on estimates of whether, and the extent to which, additional taxes will be due. These reserves are established when the Company believes that certain positions might be challenged despite the Company's belief that the tax return positions are fully supportable. The Company adjusts these reserves in light of changing facts and circumstances, such as lapses of the relevant statute of limitations. The provision for income taxes includes the impact of reserve provisions and changes to reserves that are considered appropriate.
A reconciliation of the beginning balance and the ending balance of gross unrecognized tax benefits, excluding interest and penalties, is as follows (in thousands):
| |
April 30, | |||||||||
|---|---|---|---|---|---|---|---|---|---|---|
| |
2011 | 2010 | 2009 | |||||||
Balance at beginning of fiscal year |
$ | 83,613 | $ | 77,133 | $ | 71,229 | ||||
Increases in balances related to tax positions taken during current year |
6,273 | 4,000 | 6,215 | |||||||
Decreases as a result of a lapse of the applicable statute of limitations |
(6,821 | ) | — | — | ||||||
Increases in balances related to tax positions taken during prior years |
3,251 | 3,094 | 2,051 | |||||||
Decreases in balances related to tax positions taken during prior years |
(582 | ) | (614 | ) | (2,362 | ) | ||||
Balance at end of fiscal year |
$ | 85,734 | $ | 83,613 | $ | 77,133 | ||||
97
OMNIVISION TECHNOLOGIES, INC.
NOTES TO CONSOLIDATED FINANCIAL STATEMENTS—(Continued)
For the Years Ended April 30, 2011, 2010 and 2009
Note 9—Income Taxes—(Continued)
A reconciliation of the gross unrecognized tax benefits, including interest and penalties, as presented on the Consolidated Balance Sheets is as follows (in thousands):
| |
April 30, | ||||||
|---|---|---|---|---|---|---|---|
| |
2011 | 2010 | |||||
Recorded as a decrease in deferred income taxes—non-current |
$ | 11,784 | $ | 8,586 | |||
Recorded as a decrease in other receivables |
300 | 300 | |||||
Income taxes payable—non-current |
87,526 | 90,626 | |||||
Balance at end of fiscal year |
$ | 99,610 | $ | 99,512 | |||
The Company includes interest, penalties and foreign exchange gain or loss related to unrecognized tax benefits within the provision for income taxes on the Consolidated Statements of Operations. The Company recognized the following net amounts of interest and penalties and the related foreign exchange gain or loss for the periods presented (in thousands):
| |
Year Ended April 30, | |||||||||
|---|---|---|---|---|---|---|---|---|---|---|
| |
2011 | 2010 | 2009 | |||||||
Recognized interest and penalties, net |
$ | (2,022 | ) | $ | 2,199 | $ | 1,818 | |||
Included in the fiscal 2011 net amount of interest and penalties is a benefit of $3.8 million, primarily due to the reversal of accrued interest and penalties related to the reductions to unrecognized tax benefits as a result of lapses of the statute of limitations.
The Company had cumulatively accrued the following amounts for potential interest and penalties as of the dates indicated (in thousands):
| |
April 30, | ||||||
|---|---|---|---|---|---|---|---|
| |
2011 | 2010 | |||||
Balance at end of fiscal year |
$ | 13,876 | $ | 15,898 | |||
The total amount of unrecognized tax benefits, net of federal benefit for the deduction of such items as interest that, if recognized, would affect the effective tax rate is $95.4 million as of April 30, 2011. One or more of these unrecognized tax benefits could be subject to a valuation allowance if and when recognized in a future period, which could impact the timing of any related effective tax rate benefit.
The Company files U.S. federal and state, as well as foreign, tax returns. For such returns, the Company is generally no longer subject to tax examinations for years prior to fiscal 2003. The Company is currently under tax examination in a foreign jurisdiction for the fiscal years ended April 30, 2004 through April 30, 2009. It is possible that this tax examination may be concluded in the next 12 months. During fiscal 2012, the Company will continue to review its tax positions and provide for, or reverse, unrecognized tax benefits as issues arise. At this time, the Company anticipates that the balance of gross unrecognized tax benefits will decrease by $3.3 million due to lapses of statute of limitation in certain jurisdictions over the next 12 months.
98
OMNIVISION TECHNOLOGIES, INC.
NOTES TO CONSOLIDATED FINANCIAL STATEMENTS—(Continued)
For the Years Ended April 30, 2011, 2010 and 2009
Note 10—Net Income (Loss) Per Share Attributable to OmniVision Technologies, Inc. Common Stockholders
Basic net income (loss) per share attributable to OmniVision common stockholders is computed by dividing net income (loss) attributable to OmniVision by the weighted average number of common shares outstanding during the period.
Diluted net income per share attributable to OmniVision common stockholders is computed according to the treasury stock method using the weighted average number of common and potentially dilutive common shares outstanding during the period. Potentially dilutive common shares represent the effect of stock options, purchases via employee stock purchase plans and restricted stock units. The following table sets forth the number of stock options that were excluded from the calculation of diluted net income per share because they were antidilutive for the periods indicated :
| |
Year Ended April 30, | |||||||||
|---|---|---|---|---|---|---|---|---|---|---|
| |
2011 | 2010 | 2009 | |||||||
Antidilutive common stock subject to outstanding options |
— | 6,722,000 | * | |||||||
- (*)
- For the fiscal year ended April 30, 2009, the Company excluded all options, purchases via employee stock purchase plans and restricted stock units outstanding as the Company recorded a net loss of $37.3 million.
99
OMNIVISION TECHNOLOGIES, INC.
NOTES TO CONSOLIDATED FINANCIAL STATEMENTS—(Continued)
For the Years Ended April 30, 2011, 2010 and 2009
Note 10—Net Income (Loss) Per Share Attributable to OmniVision Technologies, Inc. Common Stockholders—(Continued)
The following table sets forth the computation of basic and diluted earnings (loss) per share for the periods indicated (in thousands, except per share data):
| |
Year Ended April 30, | ||||||||||
|---|---|---|---|---|---|---|---|---|---|---|---|
| |
2011 | 2010 | 2009 | ||||||||
Basic: |
|||||||||||
Numerator: |
|||||||||||
Net income (loss) attributable to OmniVision Technologies, Inc. |
$ | 124,482 | $ | 6,724 | $ | (37,323 | ) | ||||
Denominator: |
|||||||||||
Weighted average common shares for net income (loss) per share attributable to OmniVision Technologies, Inc. common stockholders |
55,324 | 51,080 | 50,523 | ||||||||
Basic net income (loss) per share attributable to OmniVision Technologies, Inc. common stockholders |
$ | 2.25 | $ | 0.13 | $ | (0.74 | ) | ||||
Diluted: |
|||||||||||
Numerator: |
|||||||||||
Net income (loss) attributable to OmniVision Technologies. Inc. |
$ | 124,482 | $ | 6,724 | $ | (37,323 | ) | ||||
Denominator: |
|||||||||||
Denominator for basic net income (loss) per share attributable to OmniVision Technologies, Inc. common stockholders |
55,324 | 51,080 | 50,523 | ||||||||
Weighted average effect of dilutive securities: |
|||||||||||
Stock options, restricted stock units and employee stock purchase plan shares |
3,782 | 1,609 | — | ||||||||
Weighted average common shares for diluted net income (loss) per share |
59,106 | 52,689 | 50,523 | ||||||||
Diluted net income (loss) per share attributable to OmniVision Technologies, Inc. common stockholders |
$ | 2.11 | $ | 0.13 | $ | (0.74 | ) | ||||
Note 11—Fair Value Measurements
The authoritative guidance for fair value measurements specifies a hierarchy of valuation techniques based upon whether the inputs to those valuation techniques reflect assumptions other market participants would use based upon market data obtained from independent sources (observable inputs) or reflect the Company's own assumption of market participant valuation (unobservable inputs). The fair value hierarchy consists of the following three levels:
- •
- Level 1—Inputs are quoted prices in active markets for
identical assets or liabilities.
- •
- Level 2—Inputs are quoted prices for similar assets or liabilities in an active market, quoted prices for identical or similar assets or liabilities in markets that are not active, inputs other than
100
OMNIVISION TECHNOLOGIES, INC.
NOTES TO CONSOLIDATED FINANCIAL STATEMENTS—(Continued)
For the Years Ended April 30, 2011, 2010 and 2009
Note 11—Fair Value Measurements—(Continued)
- •
- Level 3—Inputs are derived from valuation techniques in which one or more significant inputs or value drivers are unobservable.
quoted prices that are observable and market-corroborated inputs which are derived principally from or corroborated by observable market data.
Assets and Liabilities Measured and Recorded at Fair Value on a Recurring Basis
The following table presents the Company's financial assets and liabilities that are measured at fair value on a recurring basis which were comprised of the following types of instruments as of the date indicated (in thousands):
| |
April 30, 2011 | |||||||||||||
|---|---|---|---|---|---|---|---|---|---|---|---|---|---|---|
| |
Total | Level 1 | Level 2 | Level 3 | ||||||||||
Money market funds |
$ | 75,966 | $ | 75,966 | $ | — | $ | — | ||||||
Debt securities issued by U.S. government and U.S. government agencies |
67,593 | — | 67,593 | — | ||||||||||
Corporate debt securities/commercial paper |
32,896 | — | 32,896 | — | ||||||||||
Equity investment in Tong Hsing |
4,655 | 4,655 | — | — | ||||||||||
Total assets |
$ | 181,110 | $ | 80,621 | $ | 100,489 | $ | — | ||||||
Interest rate swaps |
$ | (3,929 | ) | $ | — | $ | (3,929 | ) | $ | — | ||||
Total liabilities |
$ | (3,929 | ) | $ | — | $ | (3,929 | ) | $ | — | ||||
The following table presents the Company's financial assets and liabilities that are measured at fair value on a recurring basis which were presented on the Company's Consolidated Balance Sheets as of the date indicated (in thousands):
| |
April 30, 2011 | |||||||||||||
|---|---|---|---|---|---|---|---|---|---|---|---|---|---|---|
| |
Total | Level 1 | Level 2 | Level 3 | ||||||||||
Cash equivalents |
$ | 90,453 | $ | 75,966 | $ | 14,487 | $ | — | ||||||
Short-term investments |
86,002 | — | 86,002 | — | ||||||||||
Long-term investments |
4,655 | 4,655 | — | — | ||||||||||
Total assets |
$ | 181,110 | $ | 80,621 | $ | 100,489 | $ | — | ||||||
Interest rate swaps |
$ | (3,929 | ) | $ | — | $ | (3,929 | ) | $ | — | ||||
Total liabilities |
$ | (3,929 | ) | $ | — | $ | (3,929 | ) | $ | — | ||||
101
OMNIVISION TECHNOLOGIES, INC.
NOTES TO CONSOLIDATED FINANCIAL STATEMENTS—(Continued)
For the Years Ended April 30, 2011, 2010 and 2009
Note 11—Fair Value Measurements—(Continued)