Attached files
| file | filename |
|---|---|
| 8-K - FORM 8-K - JACKSONVILLE BANCORP INC /FL/ | d8k.htm |
 Jacksonville Bancorp, Inc.
Nasdaq: JAXB
Investor Presentation
June 27, 2011
Exhibit 99.1 |
 Forward Looking
Statements The statements contained in this presentation, other than historical
information, are forward-looking statements. Forward looking statements
involve risks, assumptions, and uncertainties. This may cause actual
results to differ materially from forward looking statements as a result of a
variety of factors including (but not limited to): limited operating history,
economic and political conditions, competition, bank regulation,
legislation,
accounting principles and monetary policies, changes in the interest rate
environment, success in minimizing credit risk and nonperforming
assets,
and technological changes.
2 |
 JAXB at a
Glance •
Founded
in
1999
and
is
a
publicly
traded,
Florida
state-chartered
commercial
bank
•
HQ in Jacksonville, FL (Duval County)
•
Primary markets in Northeast Florida
•
Asset size $624.6MM
•
Employee size 99
•
Eight full service branch offices and one virtual branch
•
Market cap $37.4 million
•
5.9 million shares outstanding; 41.4% public float
•
Insider ownership~ 52.3%; Institutional~24.5%
3 |
 Market and Strategies
4 |
 2010
Jacksonville Market Demographics Population
Total Population
859,030
0-14 Age Group
21%
15-34 Age Group
29%
35-54 Age Group
28%
55-69 Age Group
14%
70+ Age Group
7%
Median Age
35
FL Median Age
41
USA Median Age
37
Population 25+
w/Education
556,648
< 9th Grade
4%
Some High School
9%
High School Graduate
32%
Some College
22%
Associate Degree
9%
Bachelors Degree
17%
Graduate Degree
8%
Household
Total Households
337,036
Income
$0-25K
21%
$25-50K
28%
$50-100K
37%
$100K+
15%
Average Household Income
$63,480
Median Household Income
$51,156
FL Average Household Income
$64,516
USA Average Household Income
$70,713
Net Worth
$0-35K
42%
$35-100K
17%
$100-250K
18%
$250-500K
10%
$500K+
12%
Average Household Net Worth
$322,358
FL Average Household Net Worth
$398,087
USA Average Household Net Worth
$418,865
5 |
 2010
Jacksonville Market Demographics cont’d Housing Market ~ Residential
Total Owner Occupied Housing Units
209,995
Housing Unit Value
$0-100K
37%
$100-200K
44%
$200-300K
12%
$300-500K
5%
$500K+
3%
Unemployment Rate
6
Jacksonville
9.7%
FL
11.2%
USA
10.1% |
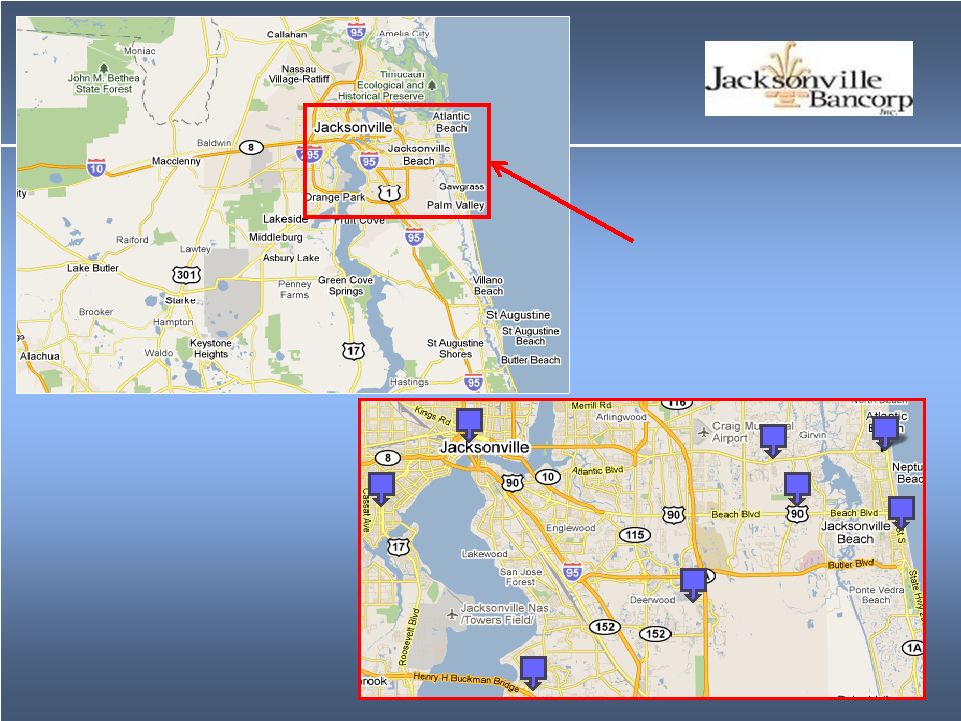 Area of Northeast Florida currently
served by JAXB
5
3
2
4
1
6
7
8
1.
Ortega Office
2.
Downtown Office
3.
Intracoastal West Office
4.
Gate Parkway Office
5.
Mandarin Office
6.
Beach Boulevard Office
7.
Neptune Beach Office
8.
Jacksonville Beach Office
7 |
 The Jacksonville Bank and
Oceanside Bank –
A Perfect Match
8 |
 The
Jacksonville Bank and Oceanside Bank – Recent Timeline
•
Merger of Oceanside Bank with The Jacksonville
Bank
November 16, 2010
•
$35M
of
new
capital
raised
by
Bancorp
through
four
accredited
November
16,
2010
investors led by CapGen Capital Group IV LP ($33.6M was
down-streamed to the Bank)
•
Systems and branch
integration
December 6, 2010
•
Disposition of $40.3M of low quality assets
completed
February 11, 2011
•
Safety and Soundness
Examination
April 2011
9 |
 Pro forma to
Current Comparison (in 000s) Actual as of
March 31, 2011
Pro forma as of
June 30, 2010
Variance
Inc/(Dec)
Cash and due from banks
$12,601
$89,741
($77,140)
Gross Loans
503,919
552,491
(48,572)
Allowance for loan losses
11,331
8,248
3,083
Loans, net of allowance for loan losses
492,588
(1)
544,243
(51,655)
Core deposit intangible
2,223
4,702
(2,479)
Goodwill
13,621
5,837
7,784
Total assets
624,643
752,927
(128,284)
Deposits:
DDA
78,959
74,744
4,215
MM/NOW/Savings
205,954
198,260
7,694
Time
244,870
365,776
(120,906)
Total deposits
529,783
638,780
(108,997)
Total liabilities
571,859
690,934
(119,075)
Capital
52,784
61,993
(9,209)
(1) Included in net loans is the discount on loans acquired in the acquisition of Oceanside
Bank in the amount of $18,448 10 |
 Capital
11 |
 Asset
Quality 12
*During the first quarter of 2011 the Company charged-off
$3.7 million on loans that were previously identified as impaired
with specific reserves recorded at December 31, 2010.
|
 Management
Team Gilbert J. Pomar, III
Director of Bancorp and the Bank
since 1999. President and Chief
Executive Officer for the Bank and
President of Bancorp since March
1999. Mr. Pomar has more than 30
years of banking experience, is active
in various community efforts and is a
graduate of the University of Florida
where he earned his Bachelor of
Science degree in Finance.
Scott M. Hall
Executive Vice President of Bancorp
and the Bank since February 2008 and
was named Chief Credit Office of both
in April 2010. Mr. Hall has over 20
years of experience in the financial
service industry, is active in various
community activities and is a graduate
of the University of North Florida
where he earned his Bachelor of
Business Administration degree in
Finance.
Valerie A. Kendall
Executive Vice President and Chief
Financial officer of Bancorp and the
Bank. Ms. Kendall has more than 20
years of banking experience, is a
Certified Public Accountant and is a
graduate of Florida Southern College
where she earned her Bachelor of
Science degree in Accounting.
Price W. Schwenck
Director of Bancorp and the bank since
1999. Chairman of the Board of Directors
for the Bank since 1999 and elected as
Executive Chairman on May 5, 2010.
Formerly served as Chief Executive Officer
of Bancorp from 1999 until April 26, 2000
and re-elected in May 2010. Mr. Schwenck
received his Bachelors degree and M.B.A
from the University of South Florida and his
M.S. from the University of Miami after four
years of extended study and application in
the field of quality management and
leadership.
13 |
 Strategic
Objectives •
Well defined NE FL focus
•
Management of low quality assets
•
Serving our community as the largest community bank in
Jacksonville
•
Organized to focus on relationship gathering and retention
•
Strong commitment to risk management and organizational
efficiencies
14 |
 Performance Drivers
15 |
 Net Interest
Margin 16
* includes adjustments for loan accretion, non-
accrual and other interest adjustments |
 Summary
Balance Sheet (in 000s) March 31,
2011
December 31,
2010
March 31,
2010
Gross loans
$ 503,919
$ 512,765
$ 390,601
Allowance for loan losses
11,331
13,069
7,618
Net loans
492,588
(1)
499,696
382,983
Core deposit intangible
2,223
2,376
--
Goodwill
13,621
12,498
--
Total assets
624,643
651,833
452,375
Total deposits
529,783
562,187
385,944
Total liabilities
571,859
599,974
426,164
Capital
52,784
51,859
26,211
(1) Included in net loans is the discount on loans acquired in the acquisition of Oceanside
Bank in the amount of $18,448 17 |
 Loan
Composition (in 000s) March 31, 2011
December 31, 2010*
18 |
 March 31, 2011
Deposit Mix (in 000s)
December 31, 2010
19 |
 Financial Highlights
20 |
 Loan and
Deposit History (in 000s) 21
|
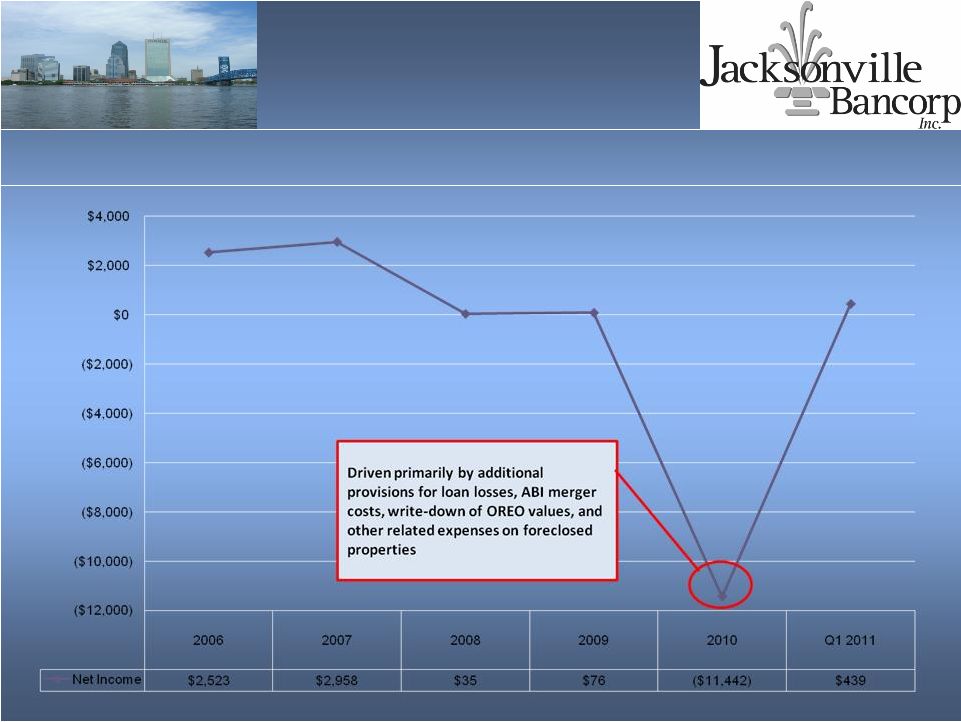 Net Income (in 000s) 22 |
 Summary
Operating Results (in 000s) Q1 2011
Q4 2010
Q3 2010
Q2 2010
Q1 2010
Interest Income
$7,740
$6,752
$5,666
$5,749
$5,795
Interest expense
1,864
1,914
1,926
2,222
2,220
Net interest income
5,876
4,838
3,740
3,527
3,575
Provision for loan losses
1,929
11,894
799
1,920
2,375
Net interest income after
provision for loan losses
3,947
(7,056)
2,941
1,607
1,200
Noninterest income
396
341
299
286
248
Noninterest expense:
Salaries and employee benefits
1,708
1,479
1,399
1,281
1,237
Occupancy and equipment
660
698
416
412
406
Data processing
398
320
266
250
245
Regulatory assessment
322
266
232
251
260
OREO
252
2,270
308
379
464
M&A expense
25
917
760
353
--
Other
885
780
484
517
474
Total noninterest expense
4,250
6,730
3,865
3,443
3,086
Income (loss) before income taxes
93
(13,445)
(625)
(1,550)
(1,638)
Income tax expense (benefit)
(346)
(4,331)
(276)
(558)
(650)
Net income (loss)
$439
($9,114)
($349)
($992)
($988)
Capital ratios:
Tier 1 Leverage Ratio
7.29%
9.09%
7.27%
7.31%
7.72%
Tier 1 Risk-Based Capital Ratio
8.70%
9.13%
8.30%
8.63%
8.87%
Total Risk-Based Capital Ratio
10.54%
10.40%
11.22%
11.51%
11.63%
23 |
 Summary
Operating Results cont’d: GAAP to Non-GAAP Comparison (in 000s)
Q1 2011
Q4 2010
Q3 2010
Q2 2010
Q1 2010
Net income (loss)
$439
($9,114)
($349)
($992)
($988)
Plus: Total provision for
loan losses
1,929
11,894
799
1,920
2,375
Expense:
Other real estate
owned *
243
2,236
278
171
464
Merger and
acquisition
25
917
760
353
--
Income tax benefit
(346)
(4,331)
(276)
(558)
(650)
Pre-provision, pre-OREO,
pre-merger and pre-tax
earnings
$2,290
$1,602
$1,212
$894
$1,201
*balance is net of income
24 |
 Key
Ratios Q1 2011
Q4 2010
Q3 2010
Q2 2010
Q1 2010
EPS
$0.07
($2.42)
($0.20)
($0.57)
($0.56)
Book Value per share
8.96
8.81
14.07
14.30
14.98
Tangible Book Value per
share
6.27
6.28
14.07
14.30
14.98
ROAA
0.28%
(6.54%)
(0.32%)
(0.88%)
(0.89%)
ROAE
3.40%
(83.81%)
(5.49%)
(15.20%)
(14.64%)
Efficiency Ratio
67.76%
129.95%
95.69%
90.30%
80.72%
25 |
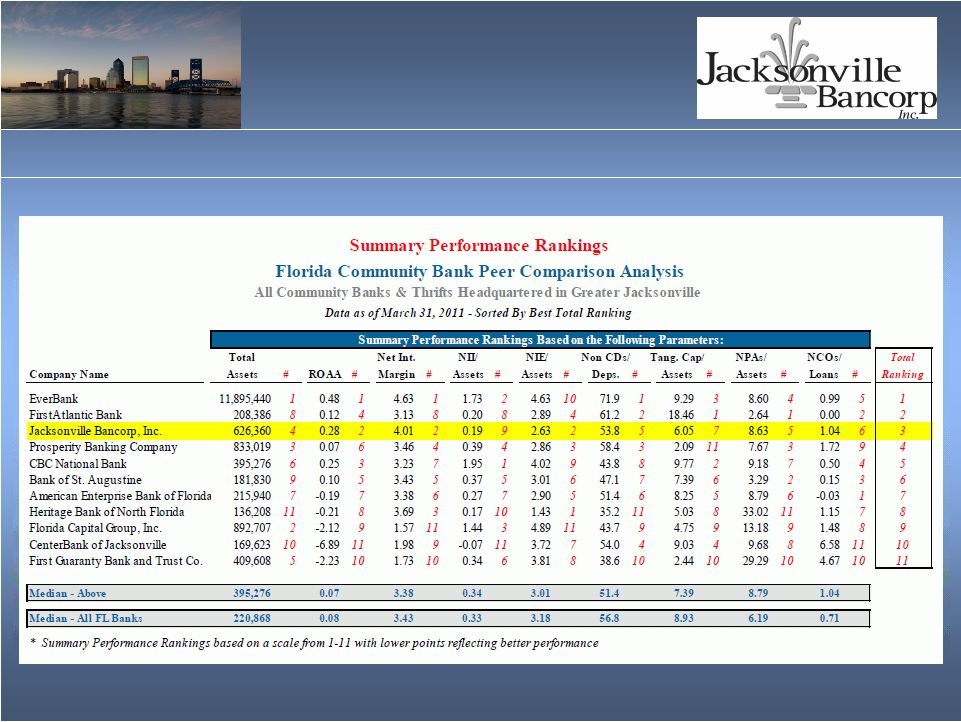 Peer
Analysis 26 |