Attached files
| file | filename |
|---|---|
| EX-24 - EX-24 - BALLANTYNE STRONG, INC. | a2204585zex-24.htm |
| EX-23 - EX-23 - BALLANTYNE STRONG, INC. | a2204585zex-23.htm |
| EX-32.1 - EX-32.1 - BALLANTYNE STRONG, INC. | a2204585zex-32_1.htm |
| EX-23.1 - X-23.1 - BALLANTYNE STRONG, INC. | a2204585zex-23_1.htm |
| EX-31.2 - EX-31.2 - BALLANTYNE STRONG, INC. | a2204585zex-31_2.htm |
| EX-31.1 - EX-31.1 - BALLANTYNE STRONG, INC. | a2204585zex-31_1.htm |
| EX-32.2 - EX-32.2 - BALLANTYNE STRONG, INC. | a2204585zex-32_2.htm |
Use these links to rapidly review the document
TABLE OF CONTENTS
Item 8. Financial Statements and Supplementary Data
DIGITAL LINK II, LLC TABLE OF CONTENTS
UNITED STATES
SECURITIES AND EXCHANGE COMMISSION
Washington, D.C. 20549
FORM 10-K/A
(Amendment No. 1)
| (Mark One) | ||
ý |
ANNUAL REPORT PURSUANT TO SECTION 13 OR 15(d) OF THE SECURITIES EXCHANGE ACT OF 1934 |
|
For the fiscal year ended December 31, 2010 |
||
OR |
||
o |
TRANSITION REPORT PURSUANT TO SECTION 13 OR 15(d) OF THE SECURITIES EXCHANGE ACT OF 1934 |
|
For the transition period from to |
||
Commission File No. 1-13906 |
||
Ballantyne Strong, Inc.
(Exact Name of Registrant as Specified in Its Charter)
| Delaware (State or other jurisdiction of incorporation or organization) |
47-0587703 (I.R.S. Employer Identification No.) |
|
4350 McKinley Street, Omaha, Nebraska (Address of principal executive offices) |
68112 (Zip Code) |
Registrant's telephone number, including area code: (402) 453-4444
Securities registered pursuant to Section 12(b) of the Act:
| Title of each class | Name of exchange on which registered | |
|---|---|---|
| Common Stock, $0.01 par value | NYSE Amex |
Securities registered pursuant to Section 12(g) of the Act: None
Indicate by check mark if the registrant is a well-known seasoned issuer, as defined in Rule 405 of the Securities Act. Yes o No ý
Indicate by check mark if the registrant is not required to file reports filed pursuant to Section 13 or Section 15(d) of the Act. Yes o No ý
Indicate by check mark whether registrant: (1) has filed all reports required to be filed by Section 13 or 15(d) of the Securities Exchange Act of 1934 during the preceding 12 months (or for such shorter period that the registrant was required to file such reports), and (2) has been subject to such filing requirements for the past 90 days. Yes ý No o
Indicate by checkmark whether the registrant has submitted electronically and posted on its corporate Website, if any, every Interactive Data File required to be submitted and posted pursuant to Rule 405 of Regulation S-T (§232.405 of this chapter) during the preceding 12 months (or for such shorter period that the registrant was required to submit and post such files). Yes o No o
Indicate by check mark if disclosure of delinquent filers pursuant to Item 405 of Regulation S-K (§229.405) is not contained herein, and will not be contained, to the best of Registrant's knowledge, in definitive proxy or information statements incorporated by reference in Part III of this Form 10-K or any amendment to this Form 10-K. ý
Indicate by check mark whether the registrant is a large accelerated filer, an accelerated filer, a non-accelerated filer or a smaller reporting company. See the definition of "accelerated filer", "large accelerated filer" and "smaller reporting company" in Rule 12b-2 of the Exchange Act.
| Large accelerated filer o | Accelerated filer ý | Non-accelerated filer o (Do not check if a smaller reporting company) |
Smaller Reporting Company o |
Indicate by check mark whether the registrant is a shell company (as defined in Rule 12b-2 of the Exchange Act) Yes o No ý
The aggregate market value of the Company's voting common stock held by non-affiliates, based upon the closing price of the stock on the NYSE AMEX (formerly the American Stock Exchange) on June 30, 2010 was approximately $103.3 million. The Company does not have any non-voting common equity. As of March 8, 2011, 14,334,117 shares of common stock of Ballantyne Strong, Inc., were outstanding.
DOCUMENTS INCORPORATED BY REFERENCE
Portions of the Company's Proxy Statement for its Annual Meeting of Stockholders to be held on May 4, 2011 are incorporated by reference in Part III, Items 10, 11, 12, 13 and 14.
Ballantyne Strong Inc. (the "Company") is filing this Amendment No. 1 to its Annual Report on Form 10-K for the fiscal year ended December 31, 2010 to reflect the inclusion under Part IV, Item 15 of this report, of separate financial statements of Digital Link II, LLC, a fifty percent or less owned entity of the Company, as required under SEC Rule 3-09 of Regulation S-X. Pursuant to Rule 3-09, Digital Link II, LLC was not a "significant subsidiary" at December 31, 2010. Therefore, the financial statements for Digital Link II, LLC's fiscal year ended March 25, 2011 are unaudited. However, audited financial statements for Digital Link II, LLC's prior two fiscal years are included as required.
This Amendment No. 1 did not impact the Company's revenue, net earnings, total assets, stockholders' equity or earnings per share.
Except as stated above, no other information included in the original Form 10-K is being amended. The remaining items contained within this Amendment No. 1 consist of all other items contained in the original Form 10-K, and are included for the convenience of the reader. This Amendment No. 1 continues to speak as of the date of the original Form 10-K and the Company has not updated the disclosures in this Amendment No. 1 to speak as of any later date. Accordingly, this Amendment No. 1 should be read in conjunction with Company filings made with the Securities and Exchange Commission subsequent to the filing of the original Form 10-K.
This Annual Report on Form 10-K contains not only historical information, but also forward-looking statements within the meaning of Section 27A of the Securities Act of 1933 and Section 21E of the Securities Exchange Act of 1934. Statements that are not historical are forward-looking and reflect expectations for future Company performance. In addition, forward-looking statements may be made in press releases, orally, at conferences, on the Company's worldwide web site, or otherwise, by or on behalf of the Company. For these statements, the Company claims the protection of the safe harbor for forward-looking statements contained in the Private Securities Litigation Reform Act of 1995.
Forward-looking statements involve a number of risks and uncertainties, including but not limited to those discussed in the "Risk Factors" section contained in Item 1A. Given the risks and uncertainties, readers should not place undue reliance on any forward-looking statements and should recognize that the statements are predictions of future results which may not occur as anticipated. Actual results could differ materially from those anticipated in the forward-looking statements and from historical results, due to the risks and uncertainties described herein, as well as others not now anticipated. New risk factors emerge from time to time and it is not possible for management to predict all such risk factors, nor can it assess the impact of all such factors on our business or the extent to which any factor, or combination of factors, may cause actual results to differ materially from those contained in the forward-looking statements. Except as required by law, the Company assumes no obligation to update forward-looking statements to reflect actual results or changes in factors or assumptions affecting such forward-looking statements.
(a) General Description of Business
General
We are a Delaware Corporation and maintain our corporate office and primary manufacturing facilities in Omaha, Nebraska. We were founded in 1932 and went public in 1995. Our shares are traded on the NYSE Amex under the symbol BTN. We primarily operate within two business segments, theatre and lighting. Approximately 97% of fiscal year 2010 sales were from theatre products and approximately 3% were from lighting products.
We are a manufacturer, distributor, integrator and service provider to the theatre exhibition industry on a worldwide basis. Through our Strong® trademark, we can fully outfit and automate a theatre projection booth for both film and digital projection. Our portfolio of cinema trademarks include: Apogee®, Century®, Optimax® and Strong Digital Systems®. Our lighting brands include: Gladiator®, Radiance®, Sky-Tracker®, Solutions™, Strong Britelight® and Technobeam®. We have sales and service offices in Hong Kong, Beijing and Shanghai, China. We also manufacture cinema screens in Joliette, Canada through our Strong/MDI Screens, Inc. subsidiary. We have a centralized Network Operating Center to track a full range of digital equipment from all makes of digital projection and audio systems, flat panels and the associated network systems. We also have an extended network of service technicians located throughout the country to install and service film, digital and other cinema and non-cinema products.
We also design, develop, manufacture and distribute lighting systems to the worldwide entertainment lighting industry through our Strong Entertainment lighting division.
3
Divestitures
During the second quarter of 2008, we sold our coater and marinade product line in exchange for $0.3 million in cash. The product line was sold to a former Chief Financial Officer of the Company.
(b) Operating Segments
We conduct our operations through two primary business segments: Theatre and Lighting. The presentation of segment information reflects the manner in which management assesses performance.
Theatre: This segment consists of the manufacture, distribution, installation and service of film and digital projection equipment and accessories for the movie exhibition industry.
Lighting: This segment consists of the design, manufacture and distribution of lighting systems to the worldwide entertainment lighting industry.
Refer to the Business Segment Information set forth in Note 23 of our consolidated financial statements for further information concerning the amounts of revenues, profits and total assets attributable to each segment for the last three fiscal years.
(c) Narrative Description of Business
The following information describes the principal products produced, services rendered, principal markets for, and methods of distribution of each business segment of the Company.
Theatre Segment
Overview
According to the National Association of Theatre Owners, there are approximately 107,000 screens worldwide that play major movie releases, with approximately 39,000 screens located in the United States. The industry is in the midst of a significant transformation from film to digital equipment. Theatre exhibition companies are retrofitting their existing complexes by removing the film equipment and replacing it with digital equipment providing an opportunity for us to deliver digital products and services as this conversion continues.
Products
Digital Equipment—Through distribution agreements with NEC and its subsidiaries, we distribute DLP Cinema projectors. NEC offers the NC3200S for large screen multiplexes, the NC2000C for medium- sized screens and the NC1200C for small theatres. All the projectors use the DLP cinema technology from Texas Instruments. The Starus NC3200S is designed for multiplexes with large screens up to 105 feet wide. The projector delivers 2K (2048 × 1080) resolution, 3D capabilities and high contrast images (>2200:1). The NC2000 projector is designed for medium sized screens up to 65 feet wide. The projector delivers 2K (2048 × 1080) resolution, 3D capabilities and high contrast images (>2200:1). The NC1200C projector is designed for screens up to 46 feet wide to employ DC 2K DMD technology at 2048 × 1080 pixel native resolution.
Prior to the release of the updated series of projectors in 2010, we sold NEC's first series of projectors including the Starus NC 2500S-A, NC 1600C-A and the NC 800C.
Through a formal distribution agreement with GDC Technology (USA), LLC the Company distributes GDC's line of digital cinema servers in North and South America; however, we also distribute servers of certain of GDC's competitors as well.
We also distribute accessories for digital cinema projectors including, but not limited to, replacement parts, lenses, lamps and automations, among other items.
4
The digital equipment we manufacture and distribute can fully outfit and automate a movie projection booth.
Motion Picture Projection Equipment—We are a manufacturer and distributor of commercial motion picture projection equipment worldwide. Our commercial motion picture projection equipment can fully outfit and automate a motion picture projection booth and consists of 35mm and 70mm motion picture projectors, xenon lamphouses and power supplies, a console system combining a lamphouse and power supply into a single cabinet, soundhead reproducers and related products such as sound systems. The commercial motion picture projection equipment is marketed under the industry-wide recognized trademarks of Strong® and Simplex®. We manufacture the majority of the motion picture projection systems in-house, except for the audio rack components, lamps and lenses. This equipment may be sold individually or as an integrated system with other components manufactured by us.
We also distribute film handling equipment consisting of a three-deck or five-deck platter and a make-up table, which allows the reels of a full-length motion picture to be spliced together, thereby eliminating the need for an operator to change reels during the showing of the motion picture. Our film transport systems are sold under the Strong® name.
Cinema Screens—We manufacture multiple standard and large format 2D and 3D screens for cinema and special venue applications through our manufacturing facility in Canada. In most instances, a screen can be used interchangeably with either a digital or film projector. There are certain digital 3D applications, such as the technology by RealD, that require special "silver" screens that we manufacture and were specially designed for digital or 35mm projection. We manufacture screens for the IMAX Corporation that are primarily used in large-format applications.
Xenon Lamps—We distribute xenon lamps for resale to the theatre (both digital and film) and lighting industries through a distributorship agreement with Phillips.
Replacement Parts—We have a significant installed base of 35,000 to 40,000 motion picture projection systems. Although these products have an average useful life in excess of 20 years, periodic replacement of components is required as a matter of routine maintenance, in most cases with parts manufactured by us. We also distribute parts to the growing digital cinema base of projectors.
Lenses—We sell digital and film projection lenses throughout the world.
Service & Maintenance—Through our wholly owned subsidiary, Strong Technical Services, Inc. (STS) we are a national provider of cinema services including film and digital projector maintenance, repair, installations, site surveys and other services. In response to increased demand for service we opened a state-of-the-art Network Operating Center in October 2010. This facility is capable of tracking a full range of digital equipment from all makes of digital projection and audio systems, flat panels and the associated network systems through our staff of hardware, network and engineering professionals. Our technicians are certified to install and service all digital, film and audio equipment, and related peripherals including the equipment of our competitors. We also offer service contracts to the theatre exhibition industry whereby for an agreed upon fee, a series of maintenance or repair services will be performed.
Markets
Our theatre business was founded in 1932. Our broad range of both standard and custom-made equipment along with other ancillary equipment can completely outfit and automate a digital or film movie projection booth.
We market and sell our products to end users and through a network of domestic and international dealers to major theatre exhibitors. During the past few years we have increasingly sold
5
directly to the end-users thereby bypassing this distribution network. We believe this trend will continue in the future and is changing how we market our products to the industry due in large part to the shift to digital cinema. Sales and marketing professionals principally develop business by maintaining regular personal customer contact including conducting site visits, while customer service and technical support functions are dispatched when needed. In addition, we market our products in trade publications such as Film Journal and Box Office and by participating in annual industry trade shows such as CinemaCon, ShowEast, CineAsia in Asia and Cinema Expo in Europe, among others. Our sales and marketing professionals have extensive experience with the Company's product lines and have long-term relationships with many current and potential customers.
Our current non-exclusive master reseller distribution agreements with NEC allow us to market digital projectors in North and South America, including the Caribbean. In addition, we have distribution rights in China, Hong Kong and certain other areas of Asia. We do not have any territorial restrictions for any of our other products and services.
Competition
Digital Equipment—The markets for our products in the theatre segment are highly competitive. Competition in the digital cinema equipment market includes two other licensed OEM's of the Texas Instruments' 2K DLP Cinema technology besides our partner, NEC; Christie Digital Systems and Barco. We also compete with SONY, which uses its own 4K digital cinema technology. During 2009, SONY made significant inroads into gaining market share when they announced agreements with Regal Cinemas, Inc. and AMC Entertainment, Inc. to deploy their 4K digital cinema projectors into these two large circuits. In response to this threat, Texas Instruments developed their own 4K resolution solution which will be ready during 2011. We believe that once the DLP 4K solution is ready for sale; the perceived difference in resolution will diminish. We compete in the digital marketplace primarily on the basis of fulfillment and delivery, price and after-sale technical support.
Screens—While there are numerous screen manufacturing companies in the world, the primary competitor in the cinema screen market is Harkness Screens.
Service—The competition in the cinema service industry is primarily driven by the two largest cinema service companies including ourselves and Christie Digital Cinema. There are several other smaller scale providers in the market.
Film Equipment—Major competitors for our products in the film cinema marketplace include Christie Digital Systems, Cinemeccanica SpA and Kinoton GmbH. The market for film products in the U.S. primarily comes from the sale of replacement parts and lenses due to the transition to digital cinema, which has significantly affected the sale of film projectors. We continue to sell film projectors to other parts of the world that are not as advanced regarding digital cinema. We compete overseas based on price, product name and customization capabilities.
We cannot assure that our equipment, whether it is film or digital equipment will not eventually become obsolete as technology advances. For a further discussion of potential new competition, see the "Business Strategy" section of this report under the caption "Expand Digital Opportunities".
The majority of our competitors for film and digital equipment have significantly greater resources than Ballantyne.
Lighting Segment
Overview
Under the trademark Strong®, we are a supplier of long-range followspots and other entertainment and architectural lighting products which are used for both permanent and touring applications.
6
Products
Followspots—We have been a developer, manufacturer and distributor of long-range followspots since 1950. Our followspots are primarily marketed under the Strong® trademark and recognized trademarked models such as Super Trouper® and Gladiator®. The Super Trouper® followspot has been the industry standard since 1958. Our long-range followspots are high-intensity general use illumination products designed for both permanent installations, such as indoor arenas, theatres, auditoriums, theme parks, amphitheatres and stadiums, and touring applications. Our manufactured followspot line consists of six basic models ranging in output from 850 watts to 4,500 watts. Lower wattage models, which have a range of 20 to 110 feet, are compact, portable and appropriate for small venues and truss mounting. The 4,500-watt model, which has a range of 300 to 600 feet, is a high-intensity xenon light followspot appropriate for large theatres, arenas and stadiums. Most of our followspots employ a variable focal length lens system which increases the intensity of the light beam as it is narrowed from flood to spot.
In response to a section of the marketplace demanding less expensive, smaller and more user-friendly products, we have introduced certain new spotlights over the last few years. We distribute an Italian manufactured followspot line called Canto. The Canto spotlight product line consists of seven basic models ranging in output from 250 watts to 2,000 watts.
Promotional and Other Lighting Products—We are a supplier of high intensity promotional searchlights and lighting systems for the motion picture production, television, live entertainment, theme park and architectural markets. Strong Britelight® specialty illumination products have been used in numerous feature films and have also been used at live performances such as Super Bowl half-time shows, the opening and closing ceremonies of the Winter Olympics and are currently illuminating such venues as the Luxor Hotel and Casino and the Stratosphere Hotel and Casino in Las Vegas, Nevada. Our Sky-Tracker® high intensity promotional searchlights come in single or multiple head configurations, primarily for use at outside venues requiring extremely bright lighting that can compete with other forms of outdoor illumination. These high intensity promotional searchlights have been used at Walt Disney World, Universal Studios, various Olympic Games and grand openings. We purchased a product line during 2007 called Technobeam® which projects logos, images and textures. This product is used in a variety of entertainment establishments.
In 2008 we expanded our effort to add new distribution lines to our lighting offerings. These new lines include a broad set of LED products marketed under the Litetude™ that are made for us in China and expanded offerings from our Italian supplier of Canto. In 2010 we signed an agreement to be the exclusive distributor of the DTS line of lighting products. DTS is another Italian manufacturer that supplies us with a wide-range of entertainment and architectural lighting products.
LED Products—During 2010, we introduced two new lines of LED lighting fixtures. The first product line will be marketed under the trademark name Solutions™. The line primarily is made up of two 650 watt fixtures. One, the Solutions 650, is a white LED fixture and the second, the 650C, is a color mixing RGB fixture. These lights are designed to fill a demand for efficient long-throw LED based lighting solutions for the entertainment lighting marketplace. We also intend to market these products to the architectural lighting markets. The second new product line is marketed under the trademark name Neeva™. Neeva is a unique product that fulfills the promise of a highly controllable LED light source that is positioned at a modest cost.
Markets
We sell our lighting products through a combination of a small direct sales force, dealer network and commissioned representatives to arenas, stadiums, theme parks, theatres, auditoriums and equipment rental companies. Our followspot products are marketed using the Strong® trademark and are used in over 100 major arenas throughout the world. Our high intensity promotional searchlights
7
are marketed under the Sky-Tracker® trademark. We expect to market our new LED products primarily through our existing sales channels.
Strategy
Our goal is to increase revenues using the remaining product lines within the segment and by increased emphasis on expanding our product offerings by developing and introducing new products such our new LED product offerings.
Competition
The markets for our lighting products are also highly competitive. We compete in the lighting industry primarily on the basis of quality, price, branding and product line variety. Many of our competitors have significantly greater resources than Ballantyne.
Business Strategy
Our strategy combines the following key elements:
Expand Digital Opportunities. We currently are a party to distribution agreements with NEC and their subsidiaries whereby we distribute their line of DLP Cinema projectors to certain areas of the world. We intend to gain market share in the digital cinema marketplace by leveraging our current industry leadership and relationships and gaining additional territories to distribute product under our distribution agreements with NEC.
We believe we can be a successful participant in the marketplace due to our agreements with NEC, our long term industry relationships, and the industry's familiarity with our Company and its large installed base worldwide. However, no assurance can be given that we will continue to be a part of the digital cinema marketplace. If we are unable to take advantage of future digital cinema opportunities or respond to the new competitive pressures, the result could have a material adverse effect on our business, financial condition, and operating results. In addition, the current relationships with NEC are through non-exclusive distributorship agreements, some of which can be terminated by either party upon 90 days notice. In addition, the gross margin we generate based on these distribution agreements is lower than the margin we experience on our film projectors. We have experienced an increase in price points and sales volume that has partially offset the lower margin; however, we cannot provide assurance that this trend will continue as the digital rollout continues to progress.
Expand Service Company. Our service subsidiary, Strong Technical Services, Inc. (STS) installed approximately 2,000 digital units in 2010, cementing our presence as the leader in digital installations. We have also entered into agreements to perform cabling and electrical installations for theatres throughout the country, establishing STS as a major force in digital rollouts for the entire industry. Capitalizing on our growth, capabilities and strategic partnerships, we have expanded our offerings to include cabling, wiring, digital menu boards, and digital signage. As a result of the above mentioned development and growth, we are in a position to increase our services contracts by 300 new digital locations including Barco, Sony, and Christie equipment. Building off the great reputation of the entire Ballantyne Strong, Inc. company we are able to work with industry leaders and we are currently working on major contracts to expand our services. It is our belief that with our capabilities in the field and corporate offices, we will expand our reach into the technology field of many organizations beyond the cinema world.
Network Operations Center. We completed the build-out of a Network Operations Center (NOC) in October 2010. Our business strategy associated with this development was to leverage our technical capabilities while meeting industry demands for remote digital systems monitoring. The NOC operates 24/7/365 utilizing Level I and Level II engineers to monitor our customers' equipment across secure
8
virtual private network ("VPN") links. High priority notifications automatically generate trouble tickets with the appropriate escalation procedures. Normal incident tracking procedures ensure the timely resolution of trouble tickets. When one of our NOC personnel observes an issue, the customer is proactively notified to explain the issue and begin the resolution process. Many issues are addressed by our NOC engineering team without having to dispatch a technician to the customer's location. By utilizing NOC personnel to solve customer issues whenever possible, we eliminate travel time and expenses normally incurred by sending a technician on site for repairs. Nearly any issue that doesn't involve parts replacements or physical contact with the hardware can be handled remotely using the available remote assistance technologies. We are anticipating growth in NOC revenues from monitoring digital cinema equipment, back room operations, and from industries outside cinema.
Transition from a Manufacturer to a Distributor. We believe that the digital transition taking place within the theatre industry will continue to substantially reduce the demand for the products we manufacture and that we will transition to more of a distribution and service business model. However, we believe that the Company will continue to manufacture film equipment parts for a period of time. We will also continue to manufacture cinema screens through our screen subsidiary and will also manufacture lighting products for our lighting segment. We continue to reduce costs at our Omaha manufacturing facility through a cost and inventory reduction program designed to bring costs and inventory in line with declining revenues and production.
Expand Screen Business. Our screen production facilities have been expanded to provide increased capacity to support the market demand for silver (3D) screens and jumbo screens, as well as serving the needs of the growing international markets. The plant has been refitted with state of the art radio frequency PVC welders and coating automation and application equipment, which has been specifically engineered to meet the high tolerance demands of our product lines while improving production efficiencies. The expanded production capabilities also provide an opportunity for our company to expedite screen deliveries through our "Fast-Track" service and capitalize on immediate demand orders. Strong/MDI is also developing new silver and gain coating formulations to enhance screen performance and expand our product offerings.
Growth Strategy. The management team is aggressively pursuing all growth opportunities as outlined in these respective areas. In addition, we are identifying and when appropriate will dynamically pursue acquisition targets that will complement our strategies.
Expand International Presence. We believe that international sales will continue to account for a significant portion of our digital sales. We also believe that film-related sales will continue for a longer period of time than for the U.S. as the full scale rollout of digital cinema is expected to lag behind. We continue to expand our distribution capabilities by allocating more resources in international countries. We are also working with NEC to expand our distribution territories for selling their digital projector line beyond North and South America, Hong Kong, China and certain other areas of Asia.
Expand Lighting Segment. Our goal is to increase revenues by aggressively marketing existing product lines, while adding complementary products through exclusive distribution agreements. In addition, our engineering group has partnered with product design firms to develop new technology lighting products such as the Solutions™ LED product line.
Subsidiaries
We have four wholly owned operational subsidiaries: Strong Westrex, Inc., Strong Technical Services, Inc., Strong/MDI Screen Systems, Inc. and the American West Beijing Trading Company, Ltd.
Strong Westrex, Inc. is the holding company for our sales and service office in Hong Kong and owns 100% of the American West Beijing Trading Company, Ltd.
9
Strong Technical Services, Inc. was formed in 2006 upon the purchase of National Cinema Service Corp. ("NCSC") to service the film and digital marketplace.
Strong/MDI Screen Systems, Inc. manufactures cinema screens and related accessories.
American West Beijing Trading Company, Ltd. is located in Beijing, China and is our sales and service office for China.
Backlog
At December 31, 2010 and 2009, we had backlogs of $24.0 million and $4.4 million, respectively. Such backlogs mainly consisted of orders received with a definite shipping date within twelve months; however, these orders are subject to cancellation. Our products are generally shipped within a few weeks following receipt of orders. The dollar amount of our order backlog is therefore not considered by management to be a leading indicator of our expected sales in any particular fiscal period.
Manufacturing
Our manufacturing operations are conducted in Omaha, Nebraska and Joliette, Canada. The Omaha facilities encompass design, fabrication, assembly and shipping of our various product lines excluding the majority of digital product lines. This central location reduces our transportation costs and delivery times of products throughout the United States. Our manufacturing strategy is to minimize costs through manufacturing efficiencies and reduce fixed costs pertaining to manufacturing film projection equipment. We believe that the digital transition taking place within the theatre industry has and will substantially reduce the demand for the products we manufacture and that we will transition to more of a distribution and service business model. However, we believe that the Company will continue to manufacture film equipment parts for a period of time. We will also continue to manufacture cinema screens through our screen subsidiary in Joliette, Canada and also manufacture lighting products for our lighting segment. We are implementing programs at our Omaha facility to reduce costs through a cost and inventory reduction program designed to bring costs and inventory in line with revenues.
The manufacturing operations in Joliette, Canada consist of a 75,000 square-foot facility for the manufacture of cinema screen systems. These facilities include expanded PVC welding operations with programmable automations, as well as two 90-foot high screen coating towers with state of the art precision coating application software and painting systems. This world class ISO certified operation has the capability of manufacturing multiple standard screens simultaneously to large format 2D and 3D screens for cinema and special venue applications.
Quality Control
We believe that our design standards, quality control procedures and the quality standards for the material and components used in our products have contributed significantly to the reputation of the products for high performance and reliability. Inspection of incoming material and components as well as the testing of all of the Company's products during various stages of assembly are key elements of this program.
Warranty Policy
We generally provide a warranty to end users for substantially all of our products, which normally covers a period of 12 months, but is extended under certain circumstances and for certain products. In most instances, our digital products are covered by the manufacturing firm's OEM warranty; however, there are certain customers where we grant warranties in excess of this warranty. Under our warranty policy, we will repair or replace defective products or components at our election. Costs of warranty
10
service and product replacements were approximately $0.8, $0.3 and $0.6 million for the years ended December 31, 2010, 2009 and 2008, respectively.
Patents and Trademarks
We own or otherwise have rights to numerous trademarks and trade names used in conjunction with the sale of our products. We currently own one patent. We believe our success will not be dependent upon patent or trademark protection, but rather upon our scientific and engineering capabilities and research and production techniques.
Employees
As of March 1, 2011, we had a total of 289 employees. Of these employees, 140 were considered manufacturing, 4 were executive, 71 were considered service related and 74 were considered sales and administrative. We are not a party to any collective bargaining agreement and believe that the relationship with our employees is strong.
Environmental Matters
We are subject to various federal, state and local laws and regulations pertaining to environmental protection and the discharge of material into the environment. During 2001, we were informed by a neighboring company of likely contaminated soil on certain parcels of land adjacent to Ballantyne's main manufacturing facility in Omaha, Nebraska. The Environmental Protection Agency ("EPA") and the Nebraska Department of Health and Human Services subsequently determined that certain parcels of Ballantyne property had various levels of contaminated soil relating to a former pesticide company which previously owned the property and that burned down in the 1960's. During October 2004, Ballantyne agreed to enter into an Administrative Order on Consent ("AOC") to resolve the matter. The AOC holds Ballantyne and two other parties jointly and severally responsible for the cleanup. In this regard, the three parties have also entered into a Site Allocation Agreement by which they will divide past, current and future costs of the EPA, the costs of remediation and cost of long term maintenance. In connection with the AOC, we have paid our share of the costs. At December 31, 2010, we have provided for management's estimate of any future payments relating to this matter which are not material to the consolidated financial statements.
Stockholder Rights Plan
The Company's Stockholders Rights Plan expired on June 9, 2010 in accordance with the terms of the Plan.
Executive Officers of the Company
Gary Cavey, age 61, has been our President, CEO and a member of the Board of Directors since November 2010. Mr. Cavey succeeded John Wilmers, age 66, who has retired as President, CEO and member of the Board of Directors. Mr. Wilmers will remain with Ballantyne over the next twelve months to assist in the transition and to help the business pursue opportunities in Asia.
Christopher Stark, age 50, assumed the responsibilities of VP-Operations in May of 2007 and is currently Senior Vice President and Chief Operating Officer.
Ray F. Boegner, age 61, has been Senior Vice President since 1997. Mr. Boegner joined us in 1985 and has acted in various sales roles.
Kevin S. Herrmann, age 45, assumed the responsibilities of CFO, Corporate Secretary and Treasurer in November 2006. Prior to the appointment, Mr. Herrmann had been our Corporate Controller since 1997.
11
Information available on Ballantyne Website
We make available free of charge on our website (www.ballantyne-strong.com) through a link to the Securities and Exchange Commission ("SEC") website, our annual report on Form 10-K, quarterly reports on Form 10-Q, current reports on Form 8-K, and amendments to those reports filed or furnished pursuant to Section 13(a) or 15(d) of the Securities and Exchange Act of 1934, as amended, as soon as reasonably practical after we electronically file such material with, or furnish it to, the SEC. However, information posted on our website is not part of the Form 10-K. The Board of Directors has adopted the following governance documents which are also posted on our website:
- •
- Code of Ethics
- •
- Corporate Governance Principles, including procedures for bringing concerns or complaints to the attention of the Board,
any Committee or any individual Director.
- •
- Audit Committee Charter
- •
- Nominating and Corporate Governance Committee Charter
- •
- Compensation Committee Charter
These corporate governance documents are also available in print to any stockholder upon request by writing to:
| The Secretary Ballantyne Strong, Inc. 4350 McKinley Street Omaha, NE 68112 |
Financial Information About Geographic Areas
The information called for by this item is included in Note 23 of our consolidated financial statements in this report.
NYSE Amex Stock Exchange Certification
On June 30, 2010, our Chief Financial Officer certified to the NYSE Amex that he was not aware of any violation by the Company of the NYSE Amex Corporate governance listing standards as of that date. This certification is an annual certification required by the NYSE Amex.
12
You should carefully consider the following risk factors and other information contained in this Annual Report on Form 10-K before investing in shares of our common stock. Investing in our common stock involves a high degree of risk. If any of the following risk factors actually occurs, our business, financial condition and results of operations could be materially and adversely affected. In that event, the trading price of our common stock could decline and you may lose part or all of your investment. We undertake no obligation to revise or update any forward-looking statements contained herein to reflect subsequent events or circumstances or the occurrence of unanticipated events. Also refer to the note regarding Forward-Looking Statements in Item 7 of Part II of this Form 10-K.
NEC is the sole supplier of the digital projectors we distribute to the theatre industry.
Through distribution agreements with NEC, we distribute their DLP Cinema projectors to North and South America, the Caribbean, Hong Kong, China and certain other areas of Asia. These agreements are non-exclusive distributorship agreements, some of which could be terminated with 90 days advance notice. If we are unable to maintain our relationship with NEC, the results would have a material adverse impact on our business, financial condition and operating results until we could find an alternative source of digital equipment to distribute. Further, there can be no assurance that an alternative source of digital equipment could be found on favorable terms. We are also dependent on NEC to supply us digital products in a timely manner and if there were delays in receiving product, we could lose market share which would negatively affect our operations. In addition, the current relationship with NEC is a non-exclusive distributorship agreement and as such the gross margin is and will be lower than the margin we currently experience on our film projectors. We have experienced lower margins that have been partially offset by increased price points and sales volume; however, we cannot provide assurance that this trend will continue in the future.
Interruptions of, or higher prices of components from NEC and other vendors may affect our results of operations and financial performance.
We are dependent on our vendors and suppliers for certain products in addition to the digital products we purchase from NEC. We believe we have good vendor relationships and that we are generally able to obtain adequate pricing and other terms from vendors and suppliers. However, if we fail to maintain satisfactory relationships with our vendors and suppliers or if our vendors and suppliers experience significant financial problems, we could experience difficulty in obtaining needed goods and services. Some vendors could also decide to reduce inventories or increase prices to increase cash flow given current economic conditions. We utilize a single contract manufacturer for each of our intermittent movement components, lenses and xenon lamps on the film side and as already discussed, NEC is currently the sole supplier for the digital projectors we distribute to the theatre industries. The loss of any one or more of the contract manufacturers could have an adverse effect on our business unless alternative manufacturing arrangements are secured. We are not dependent upon any one contract manufacturer or supplier for the balance of our raw materials and components. The industry transition to digital cinema is currently underway and during this time, there could be pricing pressures placed upon us as we market the NEC line of digital equipment. While our partnership with NEC to-date has been to strategically price the NEC projectors to the market-place, there is no assurance that if future pricing pressures arise NEC will drop their prices to allow us to remain competitive. In addition, volatility in the price for certain raw materials and components such as steel and fuel could adversely affect our financial results.
13
Our gross margins are subject to fluctuation
We expect our gross margin as a percentage of revenues to decrease in the future primarily due to increased sales of digital projection equipment which carry lower margins compared to the film products we previously manufactured. However, the sales price on the digital projectors is higher than what we receive on film projectors which offsets gross margin dollars to a degree. Gross margins could also be impacted in the future by higher film manufacturing costs pertaining to lower demand for manufactured film products. We expect to purchase film inventory components in lower quantities resulting in some raw material price increases and to experience less manufacturing throughput in the Omaha plant to cover fixed overhead costs. As sales of film projectors continue to decline, our revenues become more reliant on these lower margin digital sales completed as a distributor. To-date, we have been able to offset this with cost reductions and growing our higher margin screen manufacturing business. However, if we are unable to further lower costs as our film manufacturing decreases or there is a significant drop in demand for our higher margin screen sales, our gross margins and profits will be adversely impacted.
If the current digital technology changes to a format not supported by the DLP cinema technology from Texas Instruments, we could lose our ability to participate fully in the digital cinema market place.
We cannot provide assurance that there will be a continued demand for the digital cinema products we distribute. There can be no assurance that other technologies developed, or being developed, by competing companies will not gain traction in the exhibition industry which could affect our ability to fully participate in the digital cinema market place.
If we were forced to participate in digital cinema in ways other than being a distributor and service provider, we may have to leverage the Company. There is no assurance that we would be able to access sufficient capital given the tightening of the global credit markets.
Our 44.4% ownership in our joint venture with RealD is subject to credit and concentration risk.
Digital Link II, LLC, ("Digital Link II") was formed between Ballantyne and RealD for the purposes of commercializing certain 3D technology and to fund the deployment of digital projection systems to third party exhibitors. As of December 31, 2010, Digital Link II has deployed $9.4 million of such projection equipment, net of accumulated depreciation of $1.7 million. Such equipment is subject to system use agreements with certain exhibitors whereby the exhibitors must purchase the equipment upon the occurrence of certain triggering events. However, if any of these exhibitors would file for bankruptcy protection or be unable to fulfill their commitments in other ways, Digital Link II would be forced to remove the equipment and attempt to resell such equipment. At this time, it is unclear what the financial impact would be to the joint venture, however, it would likely have a material adverse effect on Digital Link II and also our financial condition and results of operations.
In addition, Digital Link II has entered into notes payable arrangements to finance a portion of the deployments. Ballantyne and RealD have provided guarantees for such notes in the event that Digital Link II would be unable to fulfill the principal and interest obligations under such notes based on their respective ownership shares. As of December 31, 2010, we have outstanding guarantees of $1.2 million (excluding interest) for our 44.4% share.
The markets for our products are highly competitive.
The domestic and international markets for our product lines are highly competitive, evolving and subject to rapid technological and other changes. We expect the intensity of competition in each of these areas to increase in the future. Competitors for our digital equipment have significantly greater resources than we do. In addition, many of our competitors are manufacturing their own digital equipment, whereas, we employ a distribution business model through our distribution agreements with
14
NEC. As a result, we may suffer from pricing pressures that could adversely affect our ability to generate revenues. If we lose market share due to these issues, we may be unable to lower our cost structure quickly enough to offset the lost revenue. If we are unable to compete successfully, our business and results of operations will be seriously harmed. NEC, along with two other licensed OEM's of the Texas Instruments' DLP Cinema technology historically have held the majority of the market share for digital projection equipment. However, there are also other companies such as SONY using different digital technologies in the marketplace. During 2009, SONY made significant inroads into gaining market share when they announced agreements with Regal Cinemas, Inc. and AMC Entertainment, Inc. to display their 4K digital cinema projectors into these two large circuits. While we believe Texas Instruments is taking steps to respond to the SONY threat, there can be no assurances that they will be successful.
Our business is subject to the economic and political risks of selling products in foreign countries.
Sales outside the United States (mainly theatre sales) continue to be significant, accounting for 44% of consolidated sales in fiscal 2010. We are seeking to expand our share of foreign sales, which we expect will continue to account for a significant portion of our revenues. Foreign sales are subject to political and economic risks, including political instability, currency controls, fluctuating exchange rates with respect to sales not denominated in U.S. dollars, changes in import/export regulations, tariffs and freight rates. An increasing amount of our foreign sales are being denominated in foreign currencies. During 2010, such sales rose to $22.7 million compared to $18.5 million in 2009. To the extent that orders are denominated in foreign currencies, our reported sales and earnings are more subject to foreign exchange fluctuations. In addition, there can be no assurance that our remaining international customers will continue to accept orders denominated in U.S. dollars. In addition, for those sales which are denominated in U.S. sales, a weakening in the value of foreign currencies relative to the U.S. dollar could have a material adverse impact on us by increasing the effective price of our products in international markets. Certain areas of the world are also more cost conscious than the U.S. market and there are instances where our products are priced higher than local manufacturers. We are also exposed to foreign currency fluctuations between the Canadian and U.S. dollar due to our screen manufacturing facility in Canada where a majority of their sales are denominated in the U.S. dollar while their expenses are denominated in Canadian currency. We cannot assure that these factors will not adversely affect our foreign activities in the future.
The risk of non-compliance with U.S. and foreign laws and regulations applicable to our international operations could have a significant impact on our results of operations, financial condition or strategic objectives.
Our global operations subject us to regulation by U.S. federal and state laws and multiple foreign laws, regulations and policies, which could result in conflicting legal requirements. These laws and regulations are complex, change frequently, have tended to become more stringent over time and increase our cost of doing business. These laws and regulations include import and export control, environmental, health and safety regulations, data privacy requirements, international labor laws and work councils and anti-corruption and bribery laws such as the U.S. Foreign Corrupt Practices Act, the U.N. Convention Against Bribery and local laws prohibiting corrupt payments to government officials. We are subject to the risk that we, our employees, our affiliated entities, contractors, agents or their respective officers, directors, employees and agents may take action determined to be in violation of any of these laws, particularly as we expand our operations through organic growth and acquisitions. An actual or alleged violation could result in substantial fines, sanctions, civil or criminal penalties, and debarment from government contracts, curtailment of operations in certain jurisdictions, competitive or reputational harm, litigation or regulatory action and other consequences that might adversely affect our results of operations, financial condition or strategic objectives.
15
Current negative economic conditions could adversely affect our results.
The current issues in the global credit markets and weaker economies may continue to negatively impact the Theatre and Lighting markets we serve. This environment could serve to reduce demand for our products and adversely affect our operating results. These economic conditions may also impact the financial condition of one or more of our key suppliers, including NEC, which could affect our ability to secure product to meet our customers' demand.
Our financial results and growth depend largely on the health of the theatre exhibition industry.
In 2010, approximately 97% of our revenues resulted from sales to the theatre exhibition industry. From fiscal years 2000 to 2002, this industry experienced an unprecedented three-year decline. Several exhibition companies filed for federal bankruptcy protection. This resulted in our revenues declining from $83.4 million in fiscal 1999 to $33.8 million in fiscal 2002. While the health of the theatre exhibition industry has improved significantly, there are still risks in the industry which result in continued exposure to Ballantyne. In addition, growth in the number of new movie screens may be adversely affected by the economy or other factors such as the global credit situation as the industry is very capital intensive. A lack of movie screen growth would have a material adverse effect on our business, financial condition and results of operations.
The industry is in the midst of a significant transformation from film to digital equipment. Theatre exhibition companies are retrofitting their existing complexes by removing the film equipment and replacing it with digital equipment. This transformation requires significant investment and there can be no assurance that our customers will be able to obtain a sufficient amount of this capital to continue the transformation. Without access to this capital, our theatre customers would be unable to purchase our products which would have a material adverse effect on our business, financial condition and results of operations. In addition, while we expect the conversion to digital cinema to continue for a period of time, there is no assurance that once the first conversion cycle is over, there will be additional replacements of existing digital systems. If we are unable to expand our revenues streams with other products and services, our future growth could be significantly curtailed.
We are substantially dependent upon significant customers who could cease purchasing our products at any time.
Our top ten customers accounted for approximately 42% of 2010 consolidated net revenues. While we believe our relationships with such customers are stable, most arrangements are made by purchase order and are terminable at will by either party. A significant decrease or interruption in business from these significant customers could have a material adverse effect on our business, financial condition and results of operations.
The Company has recorded deferred tax assets that are subject to annual valuation testing.
At December 31, 2010, we have recorded net deferred tax assets of $1.9 million. In assessing the ability to realize the deferred tax assets, management considers whether it is more likely than not that some portion or all of the deferred tax assets will not be realized. If management would determine that some or all of these assets would not be realized, valuation reserves would be required which would have a material adverse affect on our results of operations.
Difficulty in recruiting and retaining qualified technicians could hamper our business model pertaining to our service business.
We have experienced an increased demand for service due to the start of the digital conversion as theatre operators in many instances have not had the necessary technical expertise to maintain the more technical nature of digital projectors and accessories. The competition for qualified technicians is
16
increasing and we cannot predict whether we will experience future technician shortages. If such a shortage were to occur, we could be unable to properly provide the necessary services to our customers and subsequently lose market share. In addition, if technician salary increases were necessary to attract and retain them, our results of operations would be negatively impacted to the extent we could not pass those additional costs to our customers. We also cannot provide assurance that we will be able to successfully operate the service business in a profitable manner as we have limited experience with the volume of work that will be necessary. Our efforts to take care of our customers' needs could lead to increased and unplanned operating and capital costs.
Growth through acquisition is a part of our business plan and we may not be able to successfully identify, finance or integrate acquisitions.
As discussed in further detail in the "Business Strategy" portion of Item 1, our strategy is to pursue acquisitions that would fit in our business plans. We expect to make acquisitions in the future. However, we cannot assure that we will be able to locate appropriate acquisition candidates, that any identified candidates will be acquired or that acquired operations will be effectively integrated or prove profitable. Additionally, our credit facility with Wells Fargo currently prohibits Ballantyne from making acquisitions over $7.5 million without the bank's consent.
If we fail to retain key members of management, our business may be materially harmed.
Our success depends, in substantial part, on the efforts and abilities of our current management team. Many of these individuals have acquired specialized knowledge and skills with respect to Ballantyne and its operations. If certain of these individuals were to leave unexpectedly, we could face difficulty in hiring qualified successors and could experience a loss in productivity while any successor obtains the necessary training and experience.
Our Board of Directors recently elected a new Chief Executive Officer, President and Director
On November 1, 2010, our Board elected Gary L. Cavey to the positions of Chief Executive Officer, President and Director. Mr. Cavey replaced John C. Wilmers who had served in those positions for 13 years and retired. Mr. Wilmers will remain with the Company to assist in transitioning Mr. Cavey into his new position as Mr. Cavey is new to the Company and our business. Mr. Wilmers will also focus on the Company's growing business opportunities in Asia. While the Board believes that Mr. Cavey is well qualified and will function well in the new positions, there is no guarantee that this will be the case. Mr. Cavey's failure to perform as expected may have a material adverse effect on our business, financial condition, results of operations and stock price.
Our stock price is vulnerable to significant fluctuations.
The trading price of our common stock has been highly volatile in the past and could be subject to significant fluctuations in response to variations in quarterly operating results, general conditions in the industries in which we operate and other factors. In addition, the stock market is subject to price and volume fluctuations affecting the market price for the stock of many companies generally, which fluctuations often are unrelated to operating performance.
Shares eligible for future sale could have a possible adverse effect on the market price.
Future sales of common stock in the public market, or the perception that such sales could occur, could adversely affect the market price of the common stock or our ability to raise additional capital through sales of our equity securities.
As of December 31, 2010, we had: i) 14,313,158 shares owned by stockholders and ii) 956,349 shares of common stock reserved for issuance under stock plans, of which 222,250 shares are issuable
17
pursuant to currently outstanding options, and 74,691 shares of common stock issued but unvested pursuant to our restricted stock plans. Of the shares outstanding, subject to outstanding options and reserved for issuance under the employee stock purchase plan, 14,238,467 shares are immediately eligible for resale in the public market without restriction.
We are unable to predict the effect that the sales of these shares may have on the prevailing market price of the common stock.
Item 1B. Unresolved Staff Comments
None.
Our headquarters, main manufacturing facility and Network Operating Center ("NOC") are located at 4350 McKinley Street, Omaha, Nebraska, where we own a building consisting of approximately 166,000 square feet on approximately 12.0 acres. The premises are used for offices, the manufacture, assembly and distribution of our products, and operating the NOC.
Our Strong/MDI Screen Systems, Inc. subsidiary purchased the existing 50,000 square-foot manufacturing plant in Joliette, Canada and constructed a 25,000 square-foot addition, nearly doubling the production capacity. The expanded facilities are used for offices, manufacturing, assembly and distribution of the cinema screens.
Our American West Beijing Trading Company Ltd. subsidiary leases sales and service offices in Beijing and Shanghai, China.
Strong Technical Services, Inc. leases a small administrative office in Fall River, Massachusetts.
We also lease a sales and service office in Hong Kong.
The Company is currently a defendant in an asbestos case entitled Manuel H. Chinea and Janet M. Chinea v. American Optical Company, Ballantyne Strong, Inc. a/k/a Ballantyne of Omaha, Inc. et al, filed August 17, 2010 in the Superior Court of the State of New York. The Company is one of twenty-five defendants. The Plaintiffs have agreed to dismiss the Company. The dismissal will be final assuming no defendant objects.
During December 2009, the Company settled an asbestos case entitled Larry C. Stehman and Leila Stehman v. Asbestos Corporation, Limited and Ballantyne Strong, Inc. individually and as successor in interest to Strong International, Strong Electric Corporation and Century Projector Corporation, et al, originally filed in the Superior Court of the State of California, County of San Francisco. The settlement, including legal fees, resulted in charges of approximately $0.4 million during 2009.
18
Item 5. Market for Registrant's Common Equity, Related Stockholder Matters and Issuer Purchases of Equity Securities
Our common stock is listed and traded on the NYSE Amex under the symbol "BTN". The following table sets forth the high and low per share sale price for the common stock as reported by the NYSE Amex.
| |
|
High | Low | ||||||
|---|---|---|---|---|---|---|---|---|---|
| 2010 | First Quarter | $ | 5.89 | $ | 3.10 | ||||
| Second Quarter | 9.00 | 5.45 | |||||||
| Third Quarter | 9.66 | 6.91 | |||||||
| Fourth Quarter | 9.74 | 6.48 | |||||||
2009 |
First Quarter |
$ |
2.42 |
$ |
0.88 |
||||
| Second Quarter | 3.27 | 1.80 | |||||||
| Third Quarter | 3.88 | 2.02 | |||||||
| Fourth Quarter | 3.98 | 3.08 | |||||||
2008 |
First Quarter |
$ |
5.97 |
$ |
4.02 |
||||
| Second Quarter | 5.20 | 3.85 | |||||||
| Third Quarter | 4.70 | 1.55 | |||||||
| Fourth Quarter | 2.23 | 0.99 | |||||||
Our common stock was held by approximately 167 stockholders of record as of March 8, 2011. Because many of our shares of common stock are held by brokers and other institutions on behalf of stockholders, we are unable to estimate the total number of stockholders. The last reported per share sale price for the common stock on March 8, 2011 was $7.12. We had 14,334,117 shares of common stock outstanding on March 8, 2011.
On November 12, 2008, our Board of Directors approved the repurchase of up to $1.0 million of our common stock. No shares were repurchased in 2009 or 2010. Approximately $0.9 million remains available for repurchase as of March 7, 2011. The Company may purchase shares from time to time depending on market, economic and other factors.
19
Equity Compensation Plan Information
The following table sets forth information regarding our Stock Option, Restricted Stock and Stock Purchase Plan Agreements as of December 31, 2010.
Plan Category
|
Number of securities to be issued upon exercise of outstanding options, warrants and rights |
Weighted average exercise price of outstanding options, warrants and rights |
Number of securities remaining available for future issuance under equity compensation plans excluding securities reflected in column (a) |
||||||||
|---|---|---|---|---|---|---|---|---|---|---|---|
| |
(a) |
(b) |
(c) |
||||||||
Equity compensation plans approved by security holders |
172,250 | $ | 1.62 | 956,349 | (1) | ||||||
Equity compensation plans not approved by security holders |
— | — | — | ||||||||
Total |
172,250 | $ | 1.62 | 956,349 | (1) | ||||||
- (1)
- Includes 76,194 securities for the 2005 Stock Purchase Plan, 280,155 securities for our employee and director Restricted Stock Plans and 600,000 securities for our 2010 Long-Term Incentive Plan.
Dividend Policy
We intend to retain our earnings to assist in financing our business and do not anticipate paying cash dividends on our common stock in the foreseeable future. The declaration and payment of dividends by the Company are also subject to the discretion of the Board, and our credit facility contains certain prohibitions on the payment of cash dividends. Any determination by the Board as to the payment of dividends in the future will depend upon, among other things, business conditions, our financial condition and capital requirements, as well as any other factors deemed relevant by the Board. We have not paid cash dividends since we went public in 1995.
20
PERFORMANCE GRAPH
The following graph compares Ballantyne Strong's cumulative total stockholder return over the last five fiscal years with the Standard and Poor's 500 Index® ("S&P 500"), the Research Data Group, Inc. ("RDG") SmallCap Technology Index and a peer group consisting of the following issuers: American Tonerserve Corporation, Avid Technology, Inc., Chyron Corporation, Eastman Kodak Company, Ikonics Corporation, MDI, Inc., Swordfish Financial, Inc. and X-Rite, Inc. The Company has in good faith selected these peer issuers on the basis of their sharing the same SIC code (3861, Photographic Equipment & Supplies). The peer group total return was calculated using a weighted average market value. The graph assumes $100 was invested on December 31, 2005, and assumes reinvestment of all dividends.
Ballantyne Strong, Inc.
Comparison of Five-Year Cumulative Total Return
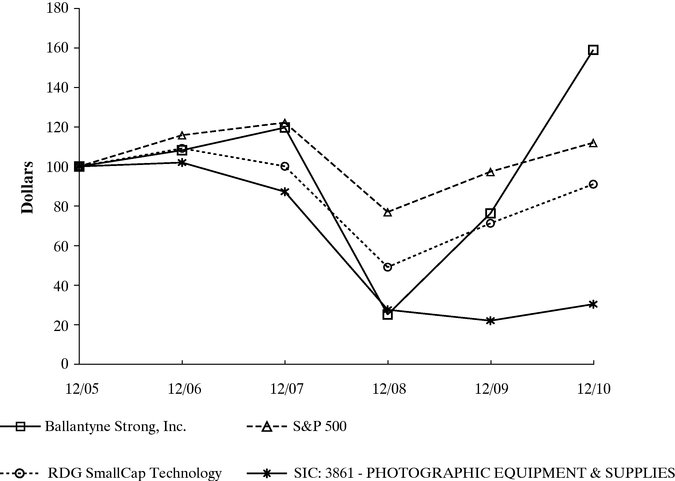
Copyright© 2011 Standard & Poor's, a division of The McGraw-Hill Companies Inc. All rights reserved. (www.researchdatagroup.com/S&P.htm)
| |
12/05 | 12/06 | 12/07 | 12/08 | 12/09 | 12/10 | |||||||||||||
|---|---|---|---|---|---|---|---|---|---|---|---|---|---|---|---|---|---|---|---|
Ballantyne Strong, Inc. |
100.00 | 108.18 | 119.63 | 25.15 | 76.28 | 158.90 | |||||||||||||
S&P 500 |
100.00 | 115.80 | 122.16 | 76.96 | 97.33 | 111.99 | |||||||||||||
RDG SmallCap Technology |
100.00 | 109.12 | 100.08 | 49.10 | 71.26 | 91.02 | |||||||||||||
SIC: 3861—PHOTOGRAPHIC EQUIPMENT & SUPPLIES |
100.00 | 101.96 | 87.21 | 27.58 | 22.04 | 30.39 | |||||||||||||
21
Item 6. Selected Financial Data (1)
| |
Years Ended December 31, | ||||||||||||||||
|---|---|---|---|---|---|---|---|---|---|---|---|---|---|---|---|---|---|
| |
2010 | 2009 | 2008 | 2007 | 2006 | ||||||||||||
Statement of operations data |
|||||||||||||||||
Net revenue |
$ | 136,335 | $ | 72,146 | $ | 54,815 | $ | 51,486 | 49,732 | ||||||||
Gross profit |
$ | 24,739 | $ | 14,732 | $ | 8,794 | $ | 9,456 | 10,826 | ||||||||
Net earnings (loss) |
$ | 8,433 | $ | 2,071 | $ | (3,034 | ) | $ | 228 | 1,568 | |||||||
Net earnings (loss) per share |
|||||||||||||||||
Basic |
$ | 0.60 | $ | 0.15 | $ | (0.22 | ) | $ | 0.02 | 0.12 | |||||||
Diluted |
$ | 0.59 | $ | 0.15 | $ | (0.22 | ) | $ | 0.02 | 0.11 | |||||||
Balance sheet data |
|||||||||||||||||
Working capital |
$ | 40,401 | $ | 35,805 | $ | 21,810 | $ | 32,390 | 34,974 | ||||||||
Total assets |
$ | 92,031 | $ | 60,210 | $ | 51,113 | $ | 54,140 | 49,908 | ||||||||
Total debt |
$ | — | $ | — | $ | — | $ | — | 15 | ||||||||
Stockholders' equity |
$ | 52,377 | $ | 42,518 | $ | 38,835 | $ | 43,042 | 42,389 | ||||||||
- (1)
- All amounts in thousands (000's) except per share data
Item 7. Management's Discussion and Analysis of Financial Condition and Results of Operations
The following discussion and analysis should be read in conjunction with the consolidated financial statements and notes thereto appearing elsewhere in this report. Management's discussion and analysis contains not only historical information, but also forward-looking statements within the meaning of Section 27A of the Securities Act of 1933 and Section 21E of the Securities Exchange Act of 1934. Statements that are not historical are forward- looking and reflect expectations for future Company performance. For these statements, the Company claims the protection of the safe harbor for forward-looking statements contained in the Private Securities Litigation Reform Act of 1995.
Forward-looking statements involve a number of risks and uncertainties, including but not limited to those discussed in the "Risk Factors" section contained in Item 1A. Given the risks and uncertainties, readers should not place undue reliance on any forward-looking statement and should recognize that the statements are predictions of future results which may not occur as anticipated. Actual results could differ materially from those anticipated in the forward-looking statements and from historical results, due to the risks and uncertainties described herein, as well as others not now anticipated. New risk factors emerge from time to time and it is not possible for management to predict all such risk factors, nor can it assess the impact of all such factors on our business or the extent to which any factor, or combination of factors, may cause actual results to differ materially from those contained in any forward-looking statements. Except as required by law, the Company assumes no obligation to update forward-looking statements to reflect actual results or changes in factors or assumptions affecting such forward-looking statements.
Overview
We are a manufacturer, distributor and service provider for the theatre exhibition industry on a worldwide basis. We also design, develop, manufacture and distribute lighting systems to the worldwide entertainment lighting industry through our Strong Entertainment lighting segment.
We have two primary reportable core operating segments: theatre and lighting. Approximately 97% of fiscal year 2010 sales were from theatre products and approximately 3% were lighting products. Additional information related to our reporting segments can be found in the notes to the consolidated financial statements.
22
Results of Operations:
The following table sets forth, for the periods indicated, the percentage of net revenues represented by certain items reflected in our consolidated statements of operations.
| |
Years Ended December 31, | |||||||||||||||
|---|---|---|---|---|---|---|---|---|---|---|---|---|---|---|---|---|
| |
2010 | 2009 | 2008 | 2007 | 2006 | |||||||||||
Net revenue |
100.0 | % | 100.0 | % | 100.0 | % | 100.0 | % | 100.0 | % | ||||||
Cost of revenues |
81.9 | 79.6 | 84.0 | 81.6 | 78.2 | |||||||||||
Gross profit |
18.1 | 20.4 | 16.0 | 18.4 | 21.8 | |||||||||||
Selling and administrative expenses(1) |
9.5 | 15.3 | 19.7 | 18.1 | 16.3 | |||||||||||
Income (loss) from operations |
8.8 | 5.1 | (7.4 | ) | (0.8 | ) | 3.0 | |||||||||
Net earnings (loss) |
6.2 | 2.9 | (5.5 | ) | 0.4 | 3.2 | ||||||||||
- (1)
- Amounts exclude goodwill impairment charges of $2.3, $0.6 and $1.3 million for the years ended December 31, 2008, 2007 and 2006, respectively.
Twelve Months Ended December 31, 2010 Compared to the Twelve Months Ended December 31, 2009 and December 31, 2008
Revenues
Net revenues during the twelve months ended December 31, 2010 rose to $136.3 million from $72.1 million in 2009.
| |
Twelve Months Ended December 31, | |||||||||||
|---|---|---|---|---|---|---|---|---|---|---|---|---|
| |
2010 | 2009 | 2008 | |||||||||
Theatre |
||||||||||||
Products |
$ | 125,043,983 | $ | 65,186,543 | $ | 47,158,724 | ||||||
Services |
7,881,593 | 3,810,626 | 3,186,650 | |||||||||
Total theatre revenues |
132,925,576 | 68,997,169 | 50,345,374 | |||||||||
Lighting |
3,409,041 | 3,121,840 | 4,260,868 | |||||||||
Other |
— | 26,748 | 208,319 | |||||||||
Total net revenues |
$ | 136,334,617 | $ | 72,145,757 | $ | 54,814,561 | ||||||
Theatre Segment
Sales of theatre products and services increased to $132.9 million in 2010 from $69.0 million in 2009 and $50.4 million in 2008.
Digital Product Sales
Sales of digital products rose to $87.0 million in 2010 from $27.9 million in 2009 as the industry change from analog to digital projection increased during 2010, primarily in the U.S. and China. The growth in business in the U.S. is primarily being driven by customers taking advantage of the opportunities that digital technology offers such as the ability to show 3D movies among other items. The growth in China is resulting not only from converting analog equipment to digital but also due to the construction of new theatre complexes in China. The majority of the increase in digital sales resulted from sales of digital projectors and certain accessories; however, sales of digital lamps also rose from $3.0 million in 2009 to $5.8 million in 2010 while sales of digital servers rose to $7.4 million from $1.2 million a year-ago. We also began to integrate projection equipment in our Omaha plant
23
where we consolidate and test digital equipment. Revenues generated from the product sold as part of this business was $5.0 million during 2010.
Sales of digital products rose to $27.9 million in 2009 from $12.6 million in 2008 as the industry change to digital projection equipment began to accelerate during 2009. The increased demand resulted from movie exhibitors wanting to show movies in 3D digital format as they believed that 3D movies result in higher box office receipts. The demand for digital equipment increased not only for the 3D benefits but also for such potential benefits as additional advertising and being able to project more alternative entertainment at the movie theatres. The majority of the increase in digital sales resulted from sales of digital projectors; however, sales of digital lamps also rose from $0.9 million in 2008 to $3.0 million in 2009.
Film Product Sales
Sales of film projection equipment declined to $10.9 million in 2010 from $12.0 million a year-ago due to the theatre exhibition industry's transition to digital based systems.
Sales of film projection equipment declined to $12.0 million in 2009 from $14.0 million in 2008 due to the theatre exhibition industry's transition to digital-based systems discussed above, coupled with a slowdown in new theatre construction in the United States and worldwide largely due to the economic and credit market conditions. Included in film equipment revenues were sales of used film equipment which amounted to $0.3 million in 2009 compared to $1.4 million in 2008. These used units were obtained from theatre chains which had converted their film auditoriums to digital and had no further use for the film projectors. The decrease in used equipment sales during 2009 resulted from the lack of quality used equipment in the market. While we anticipated a short-term opportunity to buy, refurbish and resell the suitably conditioned units as they became available, we have not seen a significant change in used equipment sales as a result of movie theatre complexes converting from film to digital equipment and only recorded immaterial sales related to these activities in 2010.
Sales of replacement parts declined to $4.7 million during 2010 from $6.8 million during 2009 and $7.4 million in 2008. We expect sales of film replacement parts to decrease over time as film equipment is replaced by digital units. Sales will depend on the pace of our film customers retrofitting their film projection theatres to digital cinema projection theatres and we continue to be unsure as to what extent our replacement part sales will be impacted by this activity and also by the increased availability of used parts.
Sales of film lenses were insignificant in 2010 compared to $0.4 million in each of 2009 and 2008. Sales of xenon lamps were $3.4 million in 2010 compared to $6.0 million in each of 2009 and 2008. The decrease is mainly attributable to the loss of sales to a significant lamp customer coupled with the digital conversion taking place creating less demand for film products.
Screen Product Sales
Revenues from the sale of screens rose to $18.9 million in 2010 compared to $12.2 million a year-ago due to the substantial demand for digital 3D screens as theatres expanded the number of screens that can project 3D images. Sales were at record levels for this product line due to the higher demand for special "silver" screens needed for certain digital 3D applications. This demand is the result of both our customers wanting to show more movies in digital 3D coupled with more 3D movies being available from the Hollywood studios. In addition, sales of large format screens to IMAX were also higher than a year-ago.
We generated screen sales of $12.2 million in 2009 compared to $6.8 million in 2008. The increase year over year was primarily driven by higher demand for special "silver" screens coupled with more 3D movies being produced. Sales of large format screens to IMAX were also higher in 2009 than 2008.
24
We sell screens for both digital cinema and film applications. In some instances, a screen can be used interchangeably with either a digital projector or a film projector. However, there are certain digital 3D applications such as the technology by RealD that require special "silver" screens that we manufacture and which are driving the growth of the product line.
Service Revenues
Service revenues increased to $7.9 million during 2010 from $3.8 million a year-ago. Revenues generated from servicing film equipment were $2.3 million during 2010 compared to $2.6 million during 2009 while revenues generated from servicing digital equipment increased to $5.6 million in 2010 compared to $1.2 million in 2009. The results reflect increased demand for installation and maintenance services pertaining to the conversion from analog to digital projectors by our customers primarily in the U.S. As discussed in relation to digital product sales, we recognized service revenues of $0.3 million associated with the integration of digital projection equipment in the Omaha plant during 2010.
Service revenues increased in 2009 to $3.8 million from $3.2 million in 2008 due to the increase in digital projectors being sold in the industry and which require installation and maintenance services.
Lighting Segment
Sales of lighting products rose to $3.4 million during 2010 from $3.1 million in 2009. Sales of follow spotlights rose to $2.0 million from $1.8 million a year-ago. Sale of skytrackers rose to $0.2 million from $0.1 million in 2009, while replacement part sales rose from $0.6 million in 2009 to $0.7 million in 2010. Sales of all other lighting products, including but not limited to xenon lamps, britelights and LED products amounted to $0.5 million in 2010 compared to $0.7 million in 2009.
Sales of lighting products fell to $3.1 million during 2009 from $4.3 million in 2008. Sales of follow spotlights fell to $1.8 million from $2.5 million in 2008. Sale of skytrackers fell to $0.1 million in 2009 from $0.4 million in 2008, while replacement part sales fell from $0.7 million in 2008 to $0.6 million in 2009. Sales of all other lighting products, including but not limited to xenon lamps, britelights and nocturns amounted to $0.7 million in 2009 compared to $0.6 million in 2008. Lighting products were impacted by the effects of the troubled credit markets as a significant portion of the business is dependent on the construction or improvements of stadiums and auditoriums around the world.
Export Revenues
Sales outside the United States increased to $60.1 million in 2010 from $33.2 million in 2009 resulting primarily from increased demand in China and South America where sales increased by $23.4 million and $5.6 million, respectively. The increased demand in China results from theatres chains retrofitting their current operations with digital equipment as well as the growth of new theatre complexes. Sales in South America were driven primarily by existing theatre complexes retrofitting their equipment to digital in order to take advantage of the 3D technology. These sales were partially offset by a decrease in sales in Mexico of $2.6 million year over year. Sales in all other regions including Canada, Europe, Asia (excluding China) and all other regions were relatively flat year over year all together driving a net increase of $0.5 million in sales. Export sales are sensitive to worldwide economic and political conditions that can lead to volatility. Certain areas of the world are more cost conscious than the U.S. market and there are instances where our products are priced higher than local manufacturers making it more difficult to generate sufficient profit to justify selling into these regions. Additionally, foreign exchange rates and excise taxes sometimes make it difficult to market our products overseas at reasonable selling prices.
Sales outside the United States (mainly theatre sales) increased to $33.2 million in 2009 from $18.2 million in 2008 resulting primarily from increased sales in China where sales increased from
25
$5.7 million in 2008 to $11.5 million in 2009. Sales into Mexico and South America were also higher than in 2008 increasing by $4.4 million and $2.5 million, respectively. Sales in Canada increased to $4.3 million in 2009 compared to $1.7 million in 2008 due to an increase in 3D silver screens. Sales into Europe reflected increased business for film products increasing to $2.7 million from $1.6 million in 2008. Sales into Asia declined to $1.4 million from $2.0 million in 2008.
Gross Profit
Consolidated gross profit increased to $24.7 million in 2010 from $14.7 million a year-ago but as a percent of total revenue decreased to 18.1% from 20.4% in 2009. Gross profit in the theatre segment increased to $23.8 million in 2010 from $13.8 million in 2009 but as a percentage of theatre sales decreased to 17.9% from 20.0% a year-ago. The decrease in gross margin resulted from increased sales of digital projection equipment which carry lower margins but substantially higher revenue price points than our other products. The lower digital projection margins were offset to a degree by improved margins from our screen and service business due primarily to the increased volume of sales from these businesses due the conversion to digital cinema.
We expect our gross margin as a percentage of revenues to decrease in the future primarily due to increased sales of digital projection equipment which carry lower margins compared to film equipment we manufacture. However, the sales price on the digital projectors is higher than what we receive on film projectors which offsets gross margin dollars to a degree. Gross margins will also be impacted in the future by higher film manufacturing costs pertaining to lower demand for manufactured film products. We expect to purchase film inventory components in lower quantities resulting in some raw material price increases and to experience less manufacturing throughput in the Omaha plant to cover fixed overhead costs.
The gross profit in the lighting segment amounted to $0.9 million or 27.4% of lighting revenues in 2010 compared to $0.9 million or 28.5% of lighting revenues in 2009. The results reflect relatively flat sales year over year.
Consolidated gross profit increased to $14.7 million in 2009 from $8.8 million in 2008 and as a percent of total revenue increased to 20.4% from 16.0% in 2008. Gross profit in the theatre segment increased to $13.8 million in 2009 from $7.5 million in 2008 and as a percentage of theatre sales increased to 20.0% from 14.9% in 2008. The increase in gross profit and gross profit as a percentage of revenues resulted from improved margins from our screen business. We also cut costs from our primary manufacturing operations in Omaha during 2009. Margins were higher from our service business due to revenues increasing 20% from 2008 resulting in margins increasing $1.0 million. The service business relating to servicing film projection equipment is in a mature industry but we grew the infrastructure in anticipation of the digital cinema rollout which took on momentum in 2010. These factors resulted in the service division experiencing negative margins putting pressure on our overall margin.
The gross profit in the lighting segment amounted to $0.9 million or 28.5% as a percentage of revenues in 2009 compared to $1.2 million or 28.0% as a percentage of revenues in 2008. The results reflect lower sales levels in the segment.
Selling Expenses
Selling expenses increased to $3.8 million from $2.9 million in 2009 but as a percent of total revenue declined to 2.8% from 4.0% a year-ago. The results reflect an increase in personnel and associated costs coupled with increases in commission expenses due to the increase in product and services demand.
Selling expenses decreased to $2.9 million in 2009 compared to $3.3 million in 2008 and as a percent of total revenue declined to 4.0% from 6.1% in 2008. The results reflect cutbacks in payroll
26
which also resulted in lower travel and tradeshow expenditures. In addition, the 2008 results reflected higher health insurance costs.
Administrative Expenses
Administrative costs rose to $9.1 million in 2010 from $8.1 million in 2009 but as a percent of total revenue decreased to 6.7% in 2010 from 11.3% in 2009. The increase in expenses is primarily due to the growth in personnel and related costs necessary to manage the significant growth in revenue experienced during the year.
Administrative costs rose to $8.1 million in 2009 from $7.5 million in 2008 but as a percent of total revenue decreased to 11.3% in 2009 from 13.7% in 2008. The increase in expenses was related to severance charges, settlement of an asbestos lawsuit, outside consulting expenses, bonuses and stock compensation expenses, coupled with additional costs pertaining to the growth of our office in Beijing, China.
During the first quarter of 2009 we incurred $0.2 million of severance charges due to the layoff of personnel as we began the transition to more of a distribution model due to lower production needed for digital projects. We also settled an asbestos lawsuit resulting in additional legal costs of $0.4 million. We experienced higher consulting fees during the year pertaining to the Board of Directors performing a search for the successor to the then Chief Executive Officer before his retirement. Management achieved more targets under the Company's bonus plan resulting in higher bonus expenses compared to 2008. Stock compensation expenses rose due to the Company having more unvested restricted stock in 2009 compared to 2008. We first began granting restricted stock in 2008 and thus 2009 was the first full year of stock expense. We cut back in certain other administrative areas such as bank fees, audit and compliance costs, and payroll costs which were also lower due to the layoffs in the first quarter of 2009.
Goodwill Impairment
During the fourth quarter of 2008, we recorded a goodwill impairment charge of $2.3 million within our Theatre and Lighting segments based on an impairment analyses which took into consideration the ongoing transition taking place in our strategy and operations, moving from the manufacture of traditional film equipment to a business model focused on the distribution and service of digital projectors. As a result of the impairment analysis performed, we determined the book value of goodwill was impaired. No such charges took place in 2009 or 2010 as we no longer have any goodwill.
Other Financial Items
Our results for 2010 reflect a gain of $0.6 million pertaining to our 44.4% share of equity in the income from Digital Link II, LLC. This gain compares to the loss of $0.9 million a year-ago and was due to the sale of equipment by the LLC to customers for projectors previously held in the LLC.
Our results for 2009 reflect the loss of $0.9 million pertaining to our 44.4% share of equity in the loss from Digital Link II, LLC compared to the 2008 loss of $0.7 million. The increase was due to more depreciation and interest costs resulting from additional deployments.
Other expense amounted to $0.2 million in 2010 compared to $0.1 million in 2009 and other income of $0.3 million in 2008. The results primarily reflect the impact of transaction losses arising from foreign exchange fluctuations during the year due to the U.S. dollar weakening against the Canadian dollar.
We recorded income tax expense of approximately $4.0 million in 2010 compared to $0.7 million in 2009 and an income tax benefit of $0.9 million in 2008. The effective tax rate (calculated as a ratio of income tax benefit (expense) to pretax earnings (loss), inclusive of equity method investment earnings
27
(losses)) was approximately 31.9% for 2010, 24.7% in 2009 and 23.1% in 2008. The effective tax rate change from year to year results primarily from differing foreign and U.S. tax rates applied to respective pre-tax earnings (loss) amounts by tax jurisdiction.
We recorded net interest expense of $0.03 million in 2010 compared to net interest income of $0.05 million during 2009 and $0.5 million in 2008. This decrease is the result of the sales of our auction-rate securities in 2009 which carried much higher interest rates compared to the interest-bearing cash in which we are currently investing.
During 2008, we sold our coater and marinade product line for approximately $0.3 million resulting in a net gain of approximately $0.3 million. The product line was sold to a former Chief Financial Officer of the Company.
For the reasons outlined herein, we generated net earnings of approximately $8.4 million and basic and diluted earnings per share of $0.60 and $0.59 in 2010, respectively, compared to net earnings of $2.1 million during 2009 and basic and diluted earnings per share of $0.15 a year-ago and a net loss of $3.0 million during 2008 and basic and diluted loss per share of $0.22.
Liquidity and Capital Resources
During the past several years, we have met our working capital and capital resource needs from either our operating or investing cash flows or a combination of both. We ended fiscal year 2010 with total cash and cash equivalents of $22.3 million compared to $23.6 million at December 31, 2009.
Effective June 30, 2010, we entered into a $20 million Revolving Credit Agreement and Note (collectively, the "Revolving Credit Agreement"), each effective as of June 30, 2010, with Wells Fargo Bank, N.A. ("Wells Fargo"). We may request an increase in the Revolving Credit Agreement of up to an additional $5 million; however, any advances on the additional $5 million are subject to approval of Wells Fargo. The borrowings from the Revolving Credit Agreement will primarily be used for working capital purposes and for other general corporate purposes. Our accounts receivable, general intangibles and inventory secure the Revolving Credit Agreement.
Borrowings under the Revolving Credit Agreement bear interest at a rate equal to LIBOR plus 125 basis points. Interest is paid on a monthly basis. We will pay a fee of 0.15% per annum on any unused portion. The Revolving Credit Agreement expires on June 30, 2011 at which time all unpaid principal and interest is due.
The Revolving Credit Agreement contains certain covenants, including those relating to our financial condition and limitations on our ability to pay dividends. The primary financial condition covenant pertains to our maintaining a minimum net profit before taxes plus or minus non-cash equity in income of the Digital Link II, LLC joint venture, plus any non-cash charges related to the legacy film projector business, of $1, measured quarterly, on a rolling 4-quarter basis. Other covenants pertain to items such as limits on incurring additional debt or lease obligations, limits on issuing guarantees and certain limits on loans, advances and investments with third parties. Upon the occurrence of any event of default specified in the Revolving Credit Agreement, including a change in control of the Company (as defined in the Revolving Credit Agreement), all amounts due there under may be declared to be immediately due and payable. No amounts are currently outstanding on the Revolving Credit Agreement.
We were previously a party to a revolving credit facility with First National Bank of Omaha. This revolving credit facility expired on July 1, 2010.
Net cash provided by operating activities amounted to $3.6 million in 2010 compared to $2.4 million in 2009. The increase in operating cash primarily resulted from the increase in earnings of $8.4 million in 2010 compared to $2.1 million in 2009. This was largely offset by cash used in net
28
working capital of $7.4 million compared to $4.3 million in 2009. The increase in our working capital needs was mainly driven by increases in accounts receivable, unbilled revenue, inventory and other assets of $7.3 million, $5.2 million, $15.3 million and $2.1 million, respectively, offset by a $20.8 million increase in account payable and a $2.2 million increase in income taxes. These working capital needs are resulting from the significant increase in business we are experiencing coupled with the significantly higher price point of the digital equipment we are currently purchasing and distributing. We expect our working capital needs to continue to fluctuate from period to period during the industry transition to digital cinema.
Net cash provided by operating activities amounted to $2.4 million in 2009 compared to $4.4 million in 2008. Despite generating earnings of approximately $2.1 million during 2009, the decrease in operating cash flow from fiscal 2008 resulted primarily from receivables, inventory and other current assets increasing $3.8, $3.9 and $0.3 million respectively. These working capital needs were offset to a degree by increases in accounts payable and customer balances of $3.3 and $1.1 million, respectively resulting in a net working capital increase of $3.6 million for these five working capital items. The increase in accounts receivable, inventory and accounts payable pertained to increased purchases and sales of digital products which carry a higher price point reflecting the transition that was beginning in the industry. The increase in other current assets and customer deposits primarily pertained to prepayments of digital product from vendors and where we required prepayments from customers in certain instances primarily in certain parts of China and Asia.
Net cash used in investing amounted to $5.7 million in 2010 compared to cash provided by investing of $9.4 million in 2009. The decrease of $15.1 million is attributable to the liquidation of $10.0 million in investments in 2009 that did not recur in 2010 as well as the increase in capital expenditures of $6.8 million in 2010 compared to $0.9 million in 2009. Capital expenditures in 2010 primarily included the purchase of the land and building at our screen business in Canada, the expansion of that facility and the construction of the Network Operating Center at our headquarters.
Net cash provided by investing activities amounted to $9.4 million in 2009 compared to $2.8 million in 2008. The increase resulted from the liquidation, at par, of approximately $10.0 million of our auction-rate securities. During 2008, we liquidated at par, approximately $3.0 million of these securities. During 2009, we made capital expenditures of $0.9 million which compared to $0.8 million in 2008. Other items affecting investing activities included decreases of restricted investments of $0.3 million in 2009 and $0.5 million in 2008. These resulted from payments of deferred balances owed for acquisitions. The 2008 results also reflected $0.3 million of proceeds from the sale of our coater and marinade product line during that year.
Net cash provided by financing activities totaled $0.6 million in 2010 compared to $0.03 million a year-ago. The increase is primarily attributable to proceeds received for the exercise of stock options during 2010. Cash from financing activities in 2010 also benefited from excess tax benefits recorded and proceeds from our employee stock purchase plan.
Net cash provided by financing activities fell to $0.03 million in 2009 from $0.3 million in 2008. The transactions in 2009 consisted solely of proceeds from our employee stock purchase plan. The transactions in 2008 consisted of proceeds from our various stock plans, the purchase of shares under our Board approved share repurchase program, and an increase in checks outstanding in excess of bank balances of approximately $0.1 million.
Transactions with Related and Certain Other Parties
During 2008, we sold our coater and marinade product line in exchange for $0.3 million in cash. In connection with the sale, we recorded a pre-tax net gain of approximately $0.3 million (estimated $0.2 million after-tax) which is net of related costs to sell. The product line was sold to a former Chief Financial Officer of the Company.
29
We sell digital theatre projection equipment to our joint venture, Digital Link II, LLC ("LLC") in the normal course of business. The LLC in turn provides the digital theatre projection equipment to third party customers under system use agreements. Revenue recognized by the Company on the sale transaction to the LLC is limited by its 44.4% ownership in the joint venture which will be recognized upon sale of the equipment to the third parties. Revenue recognized during the years ended December 31, 2010, 2009 and 2008 amounted to approximately $4.1 million, $1.2 million and $2.1 million, respectively.
Financial Instruments and Credit Risk Concentrations
Our top ten customers accounted for approximately 42% of 2010 consolidated net revenues and were primarily from the theatre segment. Trade accounts receivable from these customers represented approximately 40% of net consolidated receivables at December 31, 2010. Sales to China Film Jingdian Cinema Investment Company, Ltd. represented approximately 8% of total sales, while sales to Regal Cinemas, Inc. was the next highest at 7%. Additionally, receivables from China Film Jingdian Cinema Investment Company, Ltd. and Kasima, LLC represented approximately 14% and 8% of net consolidated receivables at December 31, 2010, respectively. While the Company believes its relationships with such customers are stable, most arrangements are made by purchase order and are terminable at will by either party. A significant decrease or interruption in business from the Company's significant customers could have a material adverse effect on the Company's business, financial condition and results of operations. The Company could also be adversely affected by such factors as changes in foreign currency rates and weak economic and political conditions in each of the countries in which the Company sells its products.
Financial instruments that potentially expose us to a concentration of credit risk principally consist of accounts receivable. We sell product to a large number of customers in many different geographic regions. To minimize credit concentration risk, we perform ongoing credit evaluations of our customers' financial condition or use letters of credit.
Hedging and Trading Activities
The Company's primary exposure to foreign currency fluctuations pertains to its subsidiary in Canada. In certain instances, the Company may enter into foreign exchange contracts to manage a portion of this risk. For the period ended December 31, 2010, the Company had recorded approximately $0.03 million of unrealized gain associated with these open contracts in its consolidated statement of operations.
We do not have any trading activities that include non-exchange traded contracts at fair value.
Off Balance Sheet Arrangements and Contractual Obligations
Our off balance sheet arrangements consist principally of leasing various assets under operating leases. The future estimated payments under these arrangements are summarized below along with our other contractual obligations:
| |
Payments Due by Period | ||||||||||||||||||||||
|---|---|---|---|---|---|---|---|---|---|---|---|---|---|---|---|---|---|---|---|---|---|---|---|
Contractual Obligations
|
Total | 2011 | 2012 | 2013 | 2014 | 2015 | Thereafter | ||||||||||||||||
Non-competition agreement |
$ | 50,000 | 50,000 | — | — | — | — | — | |||||||||||||||
Postretirement benefits |
185,160 | 17,011 | 17,914 | 18,821 | 19,727 | 20,626 | 91,061 | ||||||||||||||||
Operating leases |
272,711 | 183,572 | 44,420 | 36,829 | 7,890 | — | — | ||||||||||||||||
Contractual cash obligations |
$ | 507,871 | 250,583 | 62,334 | 55,650 | 27,617 | 20,626 | 91,061 | |||||||||||||||
30
We have a contractual obligation to pay up to $50,000 to High End Systems, Inc. Payment is contingent on satisfaction of certain future sales of the product line purchased as part of the business. In addition, we have accrued approximately $0.1 million for the estimated underpayment of income taxes we are obligated to pay. The accrual is primarily related to state tax matters. There were no other contractual obligations other than inventory and property, plant and equipment purchases in the ordinary course of business.
The Company has entered into agreements with third-party film exhibitors which provide for the use of digital theatre projection equipment with a purchase option in the future. Certain operating lease agreements entered into by the Company required the third-party exhibitors to make a deposit on the digital projection equipment provided for use. The customer deposits collected are recorded as a non-current liability within the balance sheet.
During 2010 and 2009, the Company and RealD provided guarantees to notes entered into by Digital Link II, LLC to finance digital projection equipment deployed in the normal course of business. The notes bear interest at rates ranging from 7.0% to 7.46%. The following table summarizes the Company's guarantees:
Guarantee Date
|
Interest Rate | Original Notes Payable Balance | Ballantyne Ownership |
Original Guarantee | Remaining Guarantee as of 12/31/10 |
|||||||||||
|---|---|---|---|---|---|---|---|---|---|---|---|---|---|---|---|---|
July-08 |
7.0 | % | $ | 626,663 | 44.40 | % | $ | 278,238 | $ | 58,837 | ||||||
November-08 |
7.2 | % | 756,440 | 44.40 | % | 335,860 | — | |||||||||
November-08 |
7.0 | % | 1,142,239 | 44.40 | % | 507,154 | 120,799 | |||||||||
January-09 |
7.2 | % | 265,538 | 44.40 | % | 117,899 | 10,493 | |||||||||
April-09 |
7.2 | % | 1,039,646 | 44.40 | % | 461,603 | 22,326 | |||||||||
September-09 |
7.0 | % | 184,098 | 44.40 | % | 81,739 | 45,403 | |||||||||
October-09 |
7.25 | % | 152,850 | 44.40 | % | 67,865 | 32,143 | |||||||||
March-10 |
7.46 | % | 1,824,774 | 44.40 | % | 810,200 | 520,719 | |||||||||
March-10 |
7.46 | % | 749,308 | 44.40 | % | 332,693 | 223,288 | |||||||||
March-10 |
7.46 | % | 423,224 | 44.40 | % | 187,912 | 135,626 | |||||||||
March-10 |
7.46 | % | 216,141 | 44.40 | % | 95,966 | 74,161 | |||||||||
|
$ | 7,380,921 | $ | 3,277,129 | $ | 1,243,795 | ||||||||||
Under terms of the guarantees, the Company and RealD would be required to fulfill the guarantee should the joint venture be in default of its loans or contract terms. The Company has recorded an insignificant liability at December 31, 2010 for the fair value of the obligations undertaken by issuing the guarantees. The Guarantees will expire by the end of June 2012.
There were no other contractual obligations other than inventory and property, plant and equipment purchases in the ordinary course of business.
Seasonality
Generally, our business exhibits a moderate level of seasonality as sales of theatre products typically increase during the third and fourth quarters. We believe that such increased sales reflect seasonal increases in the construction of new motion picture screens in anticipation of the holiday movie season.
Legal
See Note 22 to the consolidated financial statements, and Item 3 of this report, for a description of legal matters.
31
Inflation
We believe that the relatively moderate rates of inflation in recent years have not had a significant impact on our net revenues or profitability. We did experience higher than normal prices on certain raw materials during the year coupled with higher freight costs as freight companies passed on a portion of higher gas and oil costs. Historically, we have been able to offset any inflationary effects by either increasing prices or improving cost efficiencies.
Critical Accounting Policies and Estimates
General
The following accounting policies involve judgments and estimates used in preparation of the consolidated financial statements. An accounting policy is deemed to be critical if it requires an accounting estimate to be made based on assumptions about matters that are uncertain at the time the estimate is made, and if different estimates that reasonably could have been used, or changes in the accounting estimates that are reasonably likely to occur periodically, could materially impact the consolidated financial statements.
Our accounting policies are discussed in Note 2 to the consolidated financial statements in this report. Management believes the following critical accounting policies reflect its more significant estimates and assumptions used in the preparation of the consolidated financial statements.
Revenue Recognition
Ballantyne manufactures or distributes and sells projectors which are highly complex and have many components that make up a complete system, which is referred to as an "integrated system." Each customer selects options for certain components in determining the integrated system they chose to purchase. To recognize revenue, we follow the requirements of ASC Subtopic 605-10, Revenue Recognition—General, which consists of determining that:
- •
- Persuasive evidence of an arrangement exists
- •
- Delivery has occurred or services have been rendered
- •
- The seller's price to the buyer is fixed or determinable
- •
- Collectability is reasonably assured
Once the customer has determined the features for their integrated system, we either manufacture or integrate the system to their preference and then ship the system when it is complete. Revenue is generally recognized upon shipment of the product to the third party. In those limited situations where the shipping terms are FOB destination point, we recognize revenue when the product is delivered. For services, primarily installation and maintenance related, revenue is recognized when the services have been rendered.
Allowance for Doubtful Accounts
We make judgments about the credit worthiness of both current and prospective customers based on ongoing credit evaluations performed by our credit department. These evaluations include, but are not limited to, reviewing customers' prior payment history, analyzing credit applications, monitoring the aging of receivables from current customers and reviewing financial statements, if applicable. The allowance for doubtful accounts is developed based on several factors including overall customer credit quality, historical write-off experience and a specific account analysis that project the ultimate collectability of the accounts. These factors may change over time causing the reserve level to adjust accordingly. When it is determined that a customer is unlikely to pay, a charge is recorded to bad debt
32
expense in the consolidated statements of operations and the allowance for doubtful accounts is increased. When it becomes certain the customer cannot pay, the receivable is written off by removing the accounts receivable amount and reducing the allowance for doubtful accounts accordingly.
At December 31, 2010, there were approximately $23.7 million in gross outstanding receivables and $0.3 million recorded in the allowance for doubtful accounts to cover potential future customer non-payments. At December 31, 2009, there were approximately $11.0 million in gross outstanding accounts receivable and $0.2 million recorded in the allowance for doubtful accounts. If economic conditions deteriorate significantly or if one of our large customers were to declare bankruptcy, a larger allowance for doubtful accounts might be necessary.
Inventory Valuation
Inventories are stated at the lower of cost (first-in, first-out) or market and include appropriate elements of material, labor and overhead. Our policy is to evaluate all inventory quantities for amounts on-hand that are potentially in excess of estimated usage requirements, and to write down any excess quantities to estimated net realizable value. Inherent in the estimates of net realizable values are management's estimates related to our future manufacturing schedules, customer demand and the development of digital technology, which could make our theatre products obsolete, among other items. Management has managed these risks in the past and believes that it can manage them in the future; however, operating margins may suffer if they are unable to effectively manage these risks. At December 31, 2010 we had recorded gross inventory of approximately $30.9 million and $2.9 million of inventory reserves. This compared to $15.7 million and $2.7 million, respectively, at December 31, 2009.
Warranty
Our products must meet certain product quality and performance criteria. In addition to known claims or warranty issues, we estimate future claims on recent sales and the length of the warranty period. We rely on historical product claims data to estimate the cost of product warranties at the time revenue is recognized. In determining the accrual for the estimated cost of warranty claims, we consider experience with: 1) costs for replacement parts; 2) costs of scrapping defective products; 3) the number of product units subject to warranty claims 4) length of the warranty period and 5) other direct costs associated with warranty claims. If the cost to repair a product or the number of products subject to warranty claims is greater than originally estimated, our accrued cost for warranty claims would increase.
At December 31, 2010, the warranty accrual amounted to $0.8 million and amounts charged to expense were $0.8 million. At December 31, 2009, the warranty accrual amounted to $0.4 million and amounts charged to expense were $0.3 million. The increase in expense during 2010 pertains primarily to the increasing business in our China subsidiaries.
Recent Accounting Pronouncements
In June 2009, the Financial Accounting Standards Board ("FASB") issued authoritative guidance related to the accounting for variable interest entities ("VIE's"). The guidance requires reporting entities to evaluate former Qualifying Special Purpose Entities ("QSPE's") for consolidation and changes the approach to determining a VIE's primary beneficiary from a quantitative assessment to a qualitative assessment designed to identify a controlling financial interest. The guidance was effective as of the beginning of a Company's first fiscal year that begins after November 15, 2009. The adoption did not impact the condensed consolidated financial statements.
In June 2009, the FASB issued authoritative guidance related to accounting for multiple-deliverable revenue arrangements. This guidance amends ASC 605-25 to eliminate the requirement that all undelivered elements have vendor specific objective evidence ("VSOE") or third-party evidence
33
("TPE") before an entity can recognize the portion of the overall arrangement fee that is attributable to items that already have been delivered. The guidance is effective prospectively for revenue arrangements entered into or materially modified in fiscal years beginning on or after June 15, 2010. Early adoption is permitted. The adoption did not materially impact the condensed consolidated financial statements.
In January 2010, the FASB issued authoritative guidance on the accounting for fair value measurements and disclosures (Topic 820). The guidance enhances disclosure requirements related to fair value measurements. Certain provisions of the guidance are effective for annual and interim periods beginning after December 15, 2009 and others for fiscal years beginning after December 15, 2010. Beginning with the quarter ended March 31, 2010 we provided new disclosures, as applicable, to the fair value instruments discussion. The disclosures required for fiscal periods beginning after December 15, 2010 are currently not applicable to our financial statements.
Item 7A. Quantitative and Qualitative Disclosures About Market Risk
The principal market risks affecting us are exposure to interest rates and foreign currency exchange rates. We market our products throughout the United States and the world. As a result, we could be adversely affected by such factors as changes in foreign currency rates and weak economic conditions. As a majority of our sales are currently denominated in U.S. dollars, a strengthening of the dollar can and sometimes has made our products less competitive in foreign markets.
Interest Rates—We have a variable interest rate credit facility, however, we have no outstanding balances as of December 31, 2010. If we would borrow up to the maximum amount available under these facilities, a one percent increase in the interest rate would increase interest expense by $0.2 million per annum. Interest rate risks from our other interest related accounts such as our postretirement obligations are not deemed significant.
Foreign Exchange—Exposures to transactions denominated in a currency other than the entity's functional currency are primarily related to our China and Canadian subsidiaries. From time to time, as market conditions indicate, we will enter into foreign currency contracts to manage the risks associated with forecasted transactions. A portion of our cash in the China and Canadian subsidiaries is denominated in foreign currencies, where fluctuations in exchange rates will impact our cash balances in U.S. dollar terms. A hypothetical 10% change in the value of the U.S. dollar would impact our reported cash balance by approximately $0.2 million.
34
Item 8. Financial Statements and Supplementary Data
INDEX TO CONSOLIDATED FINANCIAL STATEMENTS
| |
Page No. | ||||
|---|---|---|---|---|---|
Management's Responsibility for Consolidated Financial Statements |
36 | ||||
Report of Independent Registered Public Accounting Firm |
37 |
||||
Consolidated Financial Statements |
|||||
Consolidated Balance Sheets—December 31, 2010 and 2009 |
38 |
||||
Consolidated Statements of Operations—Years Ended December 31, 2010, 2009 and 2008 |
39 |
||||
Consolidated Statements of Stockholders' Equity and Comprehensive Income (Loss)—Years Ended December 31, 2010, 2009 and 2008 |
40 |
||||
Consolidated Statements of Cash Flows—Years Ended December 31, 2010, 2009 and 2008 |
41 |
||||
Notes to Consolidated Financial Statements—Years Ended December 31, 2010, 2009 and 2008 |
42 |
||||
Financial Statement Schedule Supporting Consolidated Financial Statements |
|||||
Schedule II—Valuation and Qualifying Accounts |
71 |
||||
35
MANAGEMENT'S RESPONSIBILITY FOR CONSOLIDATED FINANCIAL STATEMENTS
The consolidated financial statements of Ballantyne Strong, Inc. and Subsidiaries and the other information contained in this Annual Report on Form 10-K were prepared by and are the responsibility of management. The financial statements have been prepared in accordance with accounting principles generally accepted in the United States of America and necessarily include amounts based on management's best estimates and judgments.
In fulfilling its responsibilities, management relies on a system of internal controls, which provide reasonable assurance that the financial records are reliable for preparing financial statements and maintaining accountability of assets. Internal controls are designed to reduce the risk that material errors or irregularities in the financial statements may occur and not be timely detected. These systems are augmented by written policies, careful selection and training of qualified personnel, an organizational structure providing for the division of responsibilities and a program of financial, operational and systems reviews.
The Audit Committee of the Board of Directors, composed of four non-employee directors, is responsible for recommending to the Board of Directors the independent accounting firm to be retained each year. The Audit Committee meets regularly and when appropriate separately, with the independent auditors and management to review the Company's performance. The independent auditors and the Audit Committee have unrestricted access to each other in the discharge of their responsibilities.
| /s/ GARY L. CAVEY Gary L. Cavey President, Chief Executive Officer and Director |
||||
/s/ KEVIN S. HERRMANN Kevin S. Herrmann Secretary/Treasurer and Chief Financial Officer |
36
Report of Independent Registered Public Accounting Firm
The
Board of Directors and Stockholders
Ballantyne Strong, Inc.:
We have audited the accompanying consolidated balance sheets of Ballantyne Strong, Inc. and subsidiaries (the Company) as of December 31, 2010 and 2009, and the related consolidated statements of operations, stockholders' equity and comprehensive income (loss), and cash flows for each of the years in the three-year period ended December 31, 2010. In connection with our audits of the consolidated financial statements, we also have audited financial statement schedule II. These consolidated financial statements are the responsibility of the Company's management. Our responsibility is to express an opinion on these consolidated financial statements based on our audits.
We conducted our audits in accordance with the standards of the Public Company Accounting Oversight Board (United States). Those standards require that we plan and perform the audit to obtain reasonable assurance about whether the financial statements are free of material misstatement. An audit includes examining, on a test basis, evidence supporting the amounts and disclosures in the financial statements. An audit also includes assessing the accounting principles used and significant estimates made by management, as well as evaluating the overall financial statement presentation. We believe that our audits provide a reasonable basis for our opinion.
In our opinion, the consolidated financial statements referred to above present fairly, in all material respects, the financial position of Ballantyne Strong, Inc. and subsidiaries as of December 31, 2010 and 2009, and the results of its operations and its cash flows for each of the years in the three-year period ended December 31, 2010, in conformity with U.S. generally accepted accounting principles. Also in our opinion, the related financial statement schedule, when considered in relation to the basic consolidated financial statements taken as a whole, presents fairly, in all material respects, the information set forth therein.
We also have audited, in accordance with the standards of the Public Company Accounting Oversight Board (United States), the Company's internal control over financial reporting as of December 31, 2010, based on criteria established in Internal Control—Integrated Framework issued by the Committee of Sponsoring Organizations of the Treadway Commission (COSO), and our report dated March 16, 2011 expressed an unqualified opinion on the effectiveness of the Company's internal control over financial reporting.
| /s/ KPMG LLP |
Omaha,
Nebraska
March 16, 2011
37
Ballantyne Strong, Inc. and Subsidiaries
Consolidated Balance Sheets
December 31, 2010 and 2009
| |
2010 | 2009 | |||||||
|---|---|---|---|---|---|---|---|---|---|
Assets |
|||||||||
Current assets: |
|||||||||
Cash and cash equivalents |
$ | 22,250,154 | $ | 23,589,025 | |||||
Restricted cash |
208,855 | 442,766 | |||||||
Accounts receivable (less allowance for doubtful accounts of $306,133 in 2010 and $205,314 in 2009) |
16,379,492 | 8,877,980 | |||||||
Unbilled revenue |
7,057,331 | 1,894,075 | |||||||
Inventories, net |
27,940,237 | 12,987,048 | |||||||
Recoverable income taxes |
4,930 | 1,850,699 | |||||||
Deferred income taxes |
2,127,911 | 1,943,679 | |||||||
Consignment inventory |
662,795 | 486,527 | |||||||
Other current assets |
2,780,517 | 667,592 | |||||||
Total current assets |
79,412,222 | 52,739,391 | |||||||
Investment in joint venture |
2,070,576 | 2,216,638 | |||||||
Property, plant and equipment, net |
9,750,047 | 3,612,935 | |||||||
Intangible assets, net |
700,888 | 1,103,128 | |||||||
Other assets |
22,000 | 17,257 | |||||||
Deferred income taxes |
75,698 | 520,951 | |||||||
Total assets |
$ | 92,031,431 | $ | 60,210,300 | |||||
Liabilities and Stockholders' Equity |
|||||||||
Current liabilities: |
|||||||||
Accounts payable |
$ | 30,751,310 | $ | 9,768,896 | |||||
Other accrued expenses |
3,889,836 | 3,623,143 | |||||||
Customer deposits |
2,849,555 | 2,295,946 | |||||||
Income tax payable |
1,520,769 | 1,246,247 | |||||||
Total current liabilities |
39,011,470 | 16,934,232 | |||||||
Deferred income taxes |
266,439 | 274,977 | |||||||
Other accrued expenses, net of current portion |
376,703 | 483,425 | |||||||
Total liabilities |
39,654,612 | 17,692,634 | |||||||
Commitments and contingencies |
|||||||||
Stockholders' equity: |
|||||||||
Preferred stock, par value $.01 per share; Authorized 1,000,000 shares, none outstanding |
— | — | |||||||
Common stock, par value $.01 per share; Authorized 25,000,000 shares; |
164,531 | 162,836 | |||||||
Additional paid-in capital |
36,241,154 | 35,332,787 | |||||||
Accumulated other comprehensive loss: |
|||||||||
Foreign currency translation |
259,833 | (286,086 | ) | ||||||
Minimum pension liability |
80,384 | 110,665 | |||||||
Retained earnings |
31,013,597 | 22,580,144 | |||||||
|
67,759,499 | 57,900,346 | |||||||
Less 2,139,982 of common shares in treasury, at cost |
(15,382,680 | ) | (15,382,680 | ) | |||||
Total stockholders' equity |
52,376,819 | 42,517,666 | |||||||
Total liabilities and stockholders' equity |
$ | 92,031,431 | $ | 60,210,300 | |||||
See accompanying notes to consolidated financial statements.
38
Ballantyne Strong, Inc. and Subsidiaries
Consolidated Statements of Operations
Years Ended December 31, 2010, 2009 and
2008
| |
2010 | 2009 | 2008 | |||||||||
|---|---|---|---|---|---|---|---|---|---|---|---|---|
Net revenues |
$ | 136,334,617 | $ | 72,145,757 | $ | 54,814,561 | ||||||
Cost of revenues |
111,596,028 | 57,413,724 | 46,021,049 | |||||||||
Gross profit |
24,738,589 | 14,732,033 | 8,793,512 | |||||||||
Selling and administrative expenses: |
||||||||||||
Selling |
3,822,494 | 2,914,019 | 3,327,967 | |||||||||
Administrative |
9,068,557 | 8,147,861 | 7,487,172 | |||||||||
Goodwill impairment |
— | — | 2,314,282 | |||||||||
Total selling and administrative expenses |
12,891,051 | 11,061,880 | 13,129,421 | |||||||||
Gain on transfer of assets |
172,332 | — | — | |||||||||
Gain (loss) on sale or disposal of assets |
(21,675 | ) | (16,911 | ) | 275,406 | |||||||
Income (loss) from operations |
11,998,195 | 3,653,242 | (4,060,503 | ) | ||||||||
Interest income |
20,873 |
87,203 |
513,990 |
|||||||||
Interest expense |
(45,890 | ) | (33,316 | ) | (35,437 | ) | ||||||
Equity in income (loss) of joint venture |
581,495 | (889,997 | ) | (683,311 | ) | |||||||
Other income (expense), net |
(163,224 | ) | (67,156 | ) | 320,530 | |||||||
Earnings (loss) before income taxes |
12,391,449 | 2,749,976 | (3,944,731 | ) | ||||||||
Income tax benefit (expense) |
(3,957,996 | ) | (679,458 | ) | 911,041 | |||||||
Net earnings (loss) |
$ | 8,433,453 | $ | 2,070,518 | $ | (3,033,690 | ) | |||||
Basic earnings (loss) per share |
$ |
0.60 |
$ |
0.15 |
$ |
(0.22 |
) |
|||||
Diluted earnings (loss) per share |
$ | 0.59 | $ | 0.15 | $ | (0.22 | ) | |||||
Weighted average shares outstanding: |
||||||||||||
Basic |
14,163,088 | 14,002,985 | 13,914,743 | |||||||||
Diluted |
14,371,430 | 14,161,255 | 13,914,743 | |||||||||
See accompanying notes to consolidated financial statements.
39
Ballantyne Strong, Inc. and Subsidiaries
Consolidated Statements of Stockholders' Equity and Comprehensive Income (Loss)
Years Ended December 31, 2010, 2009 and 2008
| |
Common Stock |
Additional Paid-In Capital |
Comprehensive Income (Loss) |
Retained Earnings |
Treasury Stock |
Accumulated Other Comprehensive Income (Loss) |
Total Stockholders' Equity |
|||||||||||||||
|---|---|---|---|---|---|---|---|---|---|---|---|---|---|---|---|---|---|---|---|---|---|---|
Balance at December 31, 2007 |
$ | 159,562 | 34,637,868 | 23,543,316 | (15,315,454 | ) | 16,406 | 43,041,698 | ||||||||||||||
Comprehensive Loss: |
||||||||||||||||||||||
Net loss |
— | — | (3,033,690 | ) | (3,033,690 | ) | — | — | (3,033,690 | ) | ||||||||||||
Foreign currency translation |
— | — | (831,424 | ) | — | (831,424 | ) | (831,424 | ) | |||||||||||||
Unrealized loss on investments in securities, net of tax |
— | — | (742,027 | ) | — | (742,027 | ) | (742,027 | ) | |||||||||||||
Adjustment to minimum pension liability |
— | — | 17,825 | — | 17,825 | 17,825 | ||||||||||||||||
Comprehensive Loss |
(4,589,316 | ) | ||||||||||||||||||||
Issuance of 123,625 shares of common stock upon exercise of stock options |
1,236 | 88,187 | — | — | — | 89,423 | ||||||||||||||||
Issuance of 69,000 shares of common stock under the restricted stock plan |
690 | — | — | — | — | 690 | ||||||||||||||||
Issuance of 19,642 shares of common stock under the employees stock purchase plan |
197 | 34,766 | — | — | — | 34,963 | ||||||||||||||||
Stock Buyback |
— | — | — | (67,226 | ) | — | (67,226 | ) | ||||||||||||||
Income tax benefit related to stock option plans |
— | 92,362 | — | — | — | 92,362 | ||||||||||||||||
Stock compensation expense |
— | 232,045 | — | — | 232,045 | |||||||||||||||||
Balance at December 31, 2008 |
$ | 161,685 | 35,085,228 | 20,509,626 | (15,382,680 | ) | (1,539,220 | ) | 38,834,639 | |||||||||||||
Comprehensive Income: |
||||||||||||||||||||||
Net income |
— | — | 2,070,518 | 2,070,518 | 2,070,518 | |||||||||||||||||
Foreign currency translation |
— | — | 604,765 | 604,765 | 604,765 | |||||||||||||||||
Unrealized gain on investments in securities, net of tax |
— | — | 742,027 | 742,027 | 742,027 | |||||||||||||||||
Adjustment to minimum pension liability |
— | — | 17,007 | 17,007 | 17,007 | |||||||||||||||||
Comprehensive income |
3,434,317 | |||||||||||||||||||||
Issuance of 99,615 shares of common stock under the restricted stock plans |
996 | 34,259 | — | — | — | 35,255 | ||||||||||||||||
Issuance of 15,551 shares of common stock under the employees stock purchase plan |
155 | 27,837 | — | — | — | 27,992 | ||||||||||||||||
Stock compensation expense |
— | 185,463 | — | — | 185,463 | |||||||||||||||||
Balance at December 31, 2009 |
$ | 162,836 | 35,332,787 | 22,580,144 | (15,382,680 | ) | (175,421 | ) | 42,517,666 | |||||||||||||
Comprehensive Income: |
||||||||||||||||||||||
Net income |
8,433,453 | 8,433,453 | 8,433,453 | |||||||||||||||||||
Foreign currency translation |
545,919 | 545,919 | 545,919 | |||||||||||||||||||
Unrealized gain on investments in securities, net of tax |
— | — | — | — | ||||||||||||||||||
Adjustment to minimum pension liability |
— | — | (30,281 | ) | (30,281 | ) | (30,281 | ) | ||||||||||||||
Comprehensive income |
8,949,091 | |||||||||||||||||||||
Issuance of 105,875 shares of common stock upon exercise of stock options |
1,059 | 357,648 | 358,707 | |||||||||||||||||||
Issuance of 51,230 shares of common stock under the restricted stock plans |
512 | 151,095 | 151,607 | |||||||||||||||||||
Issuance of 12,359 shares of common stock under the employees stock purchase plan |
124 | 36,459 | 36,583 | |||||||||||||||||||
Income tax benefit related to stock option plans |
155,804 | 155,804 | ||||||||||||||||||||
Stock compensation expense |
207,361 | 207,361 | ||||||||||||||||||||
Balance at December 31, 2010 |
$ | 164,531 | 36,241,154 | 31,013,597 | (15,382,680 | ) | 340,217 | 52,376,819 | ||||||||||||||
See accompanying notes to consolidated financial statements.
40
Ballantyne Strong, Inc. and Subsidiaries
Consolidated Statements of Cash Flows
Years Ended December 31, 2010, 2009 and
2008
| |
2010 | 2009 | 2008 | ||||||||||
|---|---|---|---|---|---|---|---|---|---|---|---|---|---|
Cash flows from operating activities: |
|||||||||||||
Net earnings (loss) |
$ | 8,433,453 | $ | 2,070,518 | $ | (3,033,690 | ) | ||||||
Adjustments to reconcile net earnings (loss) to net cash provided by operating activities: |
|||||||||||||
Provision for doubtful accounts |
127,893 | 32,358 | 44,602 | ||||||||||
Provision for obsolete inventory |
395,308 | 523,015 | 1,246,867 | ||||||||||
Provision for warranty |
844,476 | 289,150 | 594,421 | ||||||||||
Depreciation of other assets |
171,348 | 516,811 | 993,602 | ||||||||||
Depreciation of property, plant and equipment |
884,378 | 837,097 | 924,247 | ||||||||||
Amortization of intangibles |
434,520 | 398,642 | 421,113 | ||||||||||
Equity in (income) loss of joint venture |
(581,495 | ) | 889,997 | 683,311 | |||||||||
Goodwill impairment |
— | — | 2,314,282 | ||||||||||
Loss on forward contracts |
106,413 | 47,752 | — | ||||||||||
Loss (gain) on the sale of assets |
21,675 | 1,482 | (258,170 | ) | |||||||||
Loss (gain) on disposal of assets |
(172,332 | ) | 15,429 | (17,236 | ) | ||||||||
Deferred income taxes |
242,467 | 708,846 | (1,224,685 | ) | |||||||||
Share-based compensation expense |
381,129 | 379,325 | 271,498 | ||||||||||
Excess tax benefits from share-based arrangements |
(155,804 | ) | — | (92,362 | ) | ||||||||
Changes in assets and liabilities: |
|||||||||||||
Accounts receivable |
(7,272,972 | ) | (1,875,812 | ) | 665,543 | ||||||||
Unbilled revenue |
(5,163,256 | ) | (1,894,075 | ) | — | ||||||||
Inventories |
(15,308,266 | ) | (3,930,485 | ) | (1,024,226 | ) | |||||||
Consignment inventory |
(347,616 | ) | (476,311 | ) | 1,247,472 | ||||||||
Other current assets |
(2,111,796 | ) | (306,993 | ) | (34,666 | ) | |||||||
Accounts payable |
20,774,007 | 3,320,026 | 293,331 | ||||||||||
Other accrued expenses |
(842,673 | ) | (201,312 | ) | (784,381 | ) | |||||||
Customer deposits |
548,103 | 1,071,716 | 253,022 | ||||||||||
Current income taxes |
2,239,015 | (50,009 | ) | 841,301 | |||||||||
Other assets |
(4,743 | ) | — | 28,393 | |||||||||
Net cash provided by operating activities |
3,643,232 | 2,367,167 | 4,353,589 | ||||||||||
Cash flows from investing activities: |
|||||||||||||
Acquisitions, net of cash acquired |
— | — | (8,751 | ) | |||||||||
Investment in joint venture/return of investment |
888,000 | — | (94,395 | ) | |||||||||
Decrease in restricted investments |
238,677 | 258,732 | 490,249 | ||||||||||
Capital expenditures |
(6,811,667 | ) | (907,659 | ) | (818,626 | ) | |||||||
Proceeds from sale of assets |
25,539 | 2,222 | 271,369 | ||||||||||
Proceeds from sales of investments in securities |
— | 10,025,000 | 2,975,000 | ||||||||||
Net cash provided by (used in) investing activities |
(5,659,451 | ) | 9,378,295 | 2,814,846 | |||||||||
Cash flows from financing activities: |
|||||||||||||
Increase in checks outstanding in excess of bank balances |
— | — | 106,782 | ||||||||||
Proceeds from employee stock purchase plan |
36,583 | 27,992 | 34,963 | ||||||||||
Payments under share repurchase program |
— | — | (67,226 | ) | |||||||||
Proceeds from exercise of stock options |
358,707 | — | 90,113 | ||||||||||
Excess tax benefits from stock options exercised |
155,804 | — | 92,362 | ||||||||||
Net cash provided by financing activities |
551,094 | 27,992 | 256,994 | ||||||||||
Effect of exchange rate changes on cash and cash equivalents |
126,254 | 390,587 | (220,800 | ) | |||||||||
Net increase (decrease) in cash and cash equivalents |
(1,338,871 | ) | 12,164,041 | 7,204,629 | |||||||||
Cash and cash equivalents at beginning of year |
23,589,025 | 11,424,984 | 4,220,355 | ||||||||||
Cash and cash equivalents at end of year |
$ | 22,250,154 | $ | 23,589,025 | $ | 11,424,984 | |||||||
See accompanying notes to consolidated financial statements.
41
Ballantyne Strong, Inc. and Subsidiaries
Notes to the Consolidated Financial Statements
Years ended December 31, 2010, 2009 and 2008
1. Nature of Operations
Ballantyne Strong, Inc. ("Ballantyne" or the "Company"), a Delaware corporation, and its wholly owned subsidiaries Strong Westrex, Inc., Strong Technical Services, Inc., Strong/MDI Screen Systems, Inc., and the American West Beijing Trading Company, Ltd., design, develop, manufacture, service and distribute theatre and lighting systems. The Company's products are distributed to movie exhibition companies, sports arenas, auditoriums, amusement parks and special venues.
2. Summary of Significant Accounting Policies
Basis of Presentation and Principles of Consolidation
The consolidated financial statements include the accounts of the Company and all majority owned and controlled domestic and foreign subsidiaries. All significant intercompany balances and transactions have been eliminated in consolidation.
Use of Management Estimates
The preparation of consolidated financial statements in conformity with U.S. generally accepted accounting principles requires management to make estimates and assumptions that affect the reported amounts of assets and liabilities and disclosure of contingent assets and liabilities at the date of the consolidated financial statements and the reported amounts of revenues and expenses during the reporting period. Actual results and changes in facts and circumstances may alter such estimates and affect results of operations and financial position in future periods. Certain amounts in the accompanying consolidated financial statements and notes thereto have been reclassified to conform to the 2010 presentation.
Revenue Recognition
Ballantyne sells movie projectors which are highly complex and have many components that make up a complete system, which is referred to as an "integrated system." Each customer selects options for certain components in determining the integrated system they chose to purchase. To recognize revenue, the Company follows the requirements of Accounting Standards Codification (ASC) Subtopic 605-10, Revenue Recognition—General, which consists of determining that:
- •
- Persuasive evidence of an arrangement exists
- •
- Delivery has occurred or services have been rendered
- •
- The seller's price to the buyer is fixed or determinable
- •
- Collectability is reasonably assured
Once the customer has determined the features for their integrated system, the Company either manufactures or integrates the system to their preference and then ships the system when it is complete. Revenue is generally recognized upon shipment of the product to the third party. In those limited situations where the shipping terms are FOB destination point, the Company recognizes revenue when the product is delivered. For services, primarily installation and maintenance related, revenue is recognized when the services have been rendered. Unbilled revenue represents revenue recognized in accordance with our revenue recognition policy for which the invoice had not been processed and sent to the customer as of December 31, 2010 and 2009.
42
Ballantyne Strong, Inc. and Subsidiaries
Notes to the Consolidated Financial Statements (Continued)
Years ended December 31, 2010, 2009 and 2008
Trade Accounts Receivable
Trade accounts receivable are recorded at the invoiced amount and do not bear interest. Amounts collected on trade accounts receivable are included in net cash provided by operating activities in the consolidated statements of cash flows.
The Company maintained an allowance for doubtful accounts of $0.3 million and $0.2 million at December 31, 2010 and 2009, respectively. This allowance is developed based on several factors including overall customer credit quality, historical write-off experience and a specific analysis that projects the ultimate collectability of the account. As such, these factors may change over time causing the reserve level to adjust accordingly.
Consignment Inventory
Digital and film projection equipment is provided to potential customers for consignment and demonstration purposes under customer use agreements. The Company considered the guidance contained within ASC Subtopic 605-10 to determine the proper accounting treatment for these agreements.
Consignment inventory is reviewed for impairment by comparing the inventory to the estimated future usage and sales. Digital and film projection equipment on consignment amounted to approximately $0.7 million at December 31, 2010 compared to $0.5 million at December 31, 2009.
Inventories
Inventories are stated at the lower of cost (first-in, first-out) or market and include appropriate elements of material, labor and manufacturing overhead. Inventory balances are net of reserves of slow moving or obsolete inventory based on management's review of inventories on hand compared to estimated future usage and sales.
Intangible Assets
We evaluate the carrying value of our indefinite-lived intangible assets for impairment at least annually as well as when events and circumstances indicate impairment may have occurred. We evaluate our other tangible and intangible assets for impairment when there is evidence that events or circumstances indicate that the carrying amount of these assets may not be recoverable. Intangible assets with definite lives are amortized over their respective estimate useful lives to their estimated residual values. Significant judgments and assumptions are required in the impairment evaluations.
Property, Plant and Equipment
Significant expenditures for the replacement or expansion of property, plant and equipment are capitalized. Depreciation of property, plant and equipment is provided over the estimated useful lives of the respective assets using the straight-line method. For financial reporting purposes, assets are depreciated over the estimated useful lives of 20 years for buildings and improvements, 3 to 10 years for machinery and equipment, 7 years for furniture and fixtures and 3 years for computers and accessories. The Company generally uses accelerated methods of depreciation for income tax purposes.
43
Ballantyne Strong, Inc. and Subsidiaries
Notes to the Consolidated Financial Statements (Continued)
Years ended December 31, 2010, 2009 and 2008
Major Maintenance Activities
The Company incurs maintenance costs on all its major equipment. Repair and maintenance costs are expensed as incurred.
Income Taxes
Income taxes are accounted for under the asset and liability method. The Company uses an estimate of its annual effective rate at each interim period based on the facts and circumstances at the time while the actual effective rate is calculated at year-end. Deferred tax assets and liabilities are recognized for the future tax consequences attributable to differences between the financial statement carrying amounts of existing assets and liabilities and their respective tax bases and operating loss and tax credit carry forwards. Deferred tax assets and liabilities are measured using enacted tax rates expected to apply to taxable income in the years in which those temporary differences are expected to be recovered or settled. The effect on deferred tax assets and liabilities of a change in tax rates is recognized in income in the period that includes the enactment date. In assessing whether the deferred tax assets are realizable management considers whether it is more likely than not that some portion or all of the deferred tax assets will not be realized.
Other Taxes
Sales taxes assessed by governmental authorities including sales, use, and excise taxes are on a net basis and therefore the presentation of these taxes is excluded from revenues and is shown as a liability on the balance sheet until remitted to the appropriate taxing authorities.
Research and Development
Research and development related costs are charged to operations in the period incurred. Such costs amounted to approximately $1.2, $0.7 and $0.6 million for the years ended December 31, 2010, 2009 and 2008, respectively.
Advertising Costs
Advertising and promotional costs are expensed as incurred and amounted to approximately $0.8 million for each of the years ended December 31, 2010, 2009 and 2008.
Fair Value of Financial and Derivative Instruments
The Company follows the FASB issued authoritative guidance with regards to accounting for fair value measurements and disclosures. The carrying values of cash and cash equivalents, receivables, accounts payable and accrued expenses reported in the consolidated balance sheets equal or approximate their fair values due to the short-term nature of these instruments.
The Company follows the FASB issued authoritative guidance with regards to accounting for derivatives whereby the Company recognizes all derivative financial instruments as either assets or liabilities at their fair value. During 2010, the Company maintained forward contracts to hedge its exposure to foreign currency risk related to transactions being conducted at the Company's Canadian subsidiary. The contracts did not have a material impact on the Company's statement of operations.
44
Ballantyne Strong, Inc. and Subsidiaries
Notes to the Consolidated Financial Statements (Continued)
Years ended December 31, 2010, 2009 and 2008
Cash and Cash Equivalents
All short-term, highly liquid financial instruments are classified as cash equivalents in the consolidated balance sheets and statements of cash flows. Generally, these instruments have maturities of three months or less from date of purchase.
Earnings (loss) Per Common Share
Basic earnings (loss) per share have been computed on the basis of the weighted average number of shares of common stock outstanding. Diluted earnings (loss) per share has been computed on the basis of the weighted average number of shares of common stock outstanding after giving effect to potential common shares from dilutive stock options. The following table provides reconciliation between basic and diluted earnings (loss) per share:
| |
Years Ended December 31, | |||||||||
|---|---|---|---|---|---|---|---|---|---|---|
| |
2010 | 2009 | 2008 | |||||||
Basic earnings (loss) per share: |
||||||||||
Earnings (loss) applicable to common stock |
$ | 8,433,453 | $ | 2,070,518 | $ | (3,033,690 | ) | |||
Weighted average common shares outstanding |
14,163,088 | 14,002,985 | 13,914,743 | |||||||
Basic earnings (loss) per share |
$ | 0.60 | $ | 0.15 | $ | (0.22 | ) | |||
Diluted earnings (loss) per share: |
||||||||||
Earnings (loss) applicable to common stock |
$ | 8,433,453 | $ | 2,070,518 | $ | (3,033,690 | ) | |||
Weighted average common shares outstanding |
14,163,088 | 14,002,985 | 13,914,743 | |||||||
Assuming conversion of options and restricted stock awards outstanding |
208,342 | 158,270 | — | |||||||
Weighted average common shares outstanding, as adjusted |
14,371,430 | 14,161,255 | 13,914,743 | |||||||
Diluted earnings (loss) per share |
$ | 0.59 | $ | 0.15 | $ | (0.22 | ) | |||
Options to purchase 50,000 and 118,125 shares of common stock at a weighted average price of $8.32 and $4.55 were outstanding as of December 31, 2010 and 2009, respectively, but were not included in the computation of diluted earnings per shares as the option's exercise price was greater than the average market price of the common shares for the respective period. These instruments expire between May 2011 and November 2020. In addition, 10,200 shares of restricted stock were excluded from the diluted EPS calculation as these shares were anti-dilutive as of December 31, 2010. At December 31, 2008, options and restricted stock outstanding were not included in the computation of diluted earnings (loss) per share as the Company reported a loss from continuing operations available to common stockholders.
Stock Compensation Plans
The Company recognizes compensation expense for all share-based payment awards made to employees and directors based on estimated values. The Company uses the straight-line amortization method over the vesting period of the awards. The Company has historically issued shares upon exercise of stock options or vesting of restricted stock from new stock issuances.
Share-based compensation cost that has been included in income (loss) from operations amounted to $0.4 million for each of the twelve months ended December 31, 2010 and 2009 and $0.3 million for
45
Ballantyne Strong, Inc. and Subsidiaries
Notes to the Consolidated Financial Statements (Continued)
Years ended December 31, 2010, 2009 and 2008
the twelve months ended December 31 2008. No share-based compensation cost was capitalized as a part of inventory as of December 31, 2010 and 2009.
Impairment of Long-Lived Assets and Amortizable Intangibles
The Company reviews long-lived assets and amortizable intangibles, exclusive of goodwill, for impairment whenever events or changes in circumstances indicate that the carrying amount of an asset may not be recoverable in accordance with ASC 360-10 "Property, Plant and Equipment".
The Company's most significant long-lived assets subject to these periodic assessments of recoverability are property, plant and equipment, which have a net book value of $9.8 million at December 31, 2010. The Company's amortizable intangibles which are subject to recovery consist of trademarks, customer relationships and non-competition agreements which have a carrying value of $0.7 million at December 31, 2010. The recoverability of property, plant and equipment and intangibles is based on management's estimates of future undiscounted cash flows, these estimates may vary due to a number of factors, some of which may be outside of management's control. To the extent that the Company is unable to achieve management's forecasts of future income, it may become necessary to record impairment losses for any excess of the net book value of property, plant and equipment or intangibles over their fair value. In addition, the Company has long-lived assets which consist of the Company's equity method investment in a joint venture. The Company would recognize a loss when there is a loss in value of the equity method investment which is other than a temporary decline. No impairment existed at December 31, 2010.
Retirement Benefits
The Company follows the FASB issued authoritative guidance with regards to postretirement defined benefit plans. The guidance requires the recognition of the overfunded or underfunded position of a defined benefit postretirement plan as an asset or liability in the balance sheet, the measurement of a plan's assets and its obligations that determine its funded status as of the end of the employer's fiscal year, and the recognition of changes in the funded status through comprehensive income in the year in which the changes occur.
Foreign Currency Translation
For foreign subsidiaries, the environment in which the business conducts operations is considered the functional currency, generally the local currency. The assets and liabilities of foreign subsidiaries are translated into the United States dollar at the foreign exchange rates in effect at the end of the period. Revenue and expenses of foreign subsidiaries are translated using an average of the foreign exchange rates in effect during the period. Translation adjustments are not included in determining net earnings (loss) but are presented in comprehensive income (loss) within the consolidated statements of changes in shareholder's equity and comprehensive income (loss).
Transaction gains and losses that arise from foreign exchange rate fluctuations on transactions denominated in a currency other than the functional currency are included in the statements of operations as incurred.
46
Ballantyne Strong, Inc. and Subsidiaries
Notes to the Consolidated Financial Statements (Continued)
Years ended December 31, 2010, 2009 and 2008
Warranty Reserves
The Company generally grants a warranty to its customers for a one-year period following the sale of all new equipment, and on selected repaired equipment for a one-year period following the repair. The warranty period is extended under certain circumstances and for certain products. In most instances the digital products are covered by the manufacturing firm's OEM warranty; however, there are certain customers where the Company may grant warranties in excess of the manufacturer's warranty. The Company accrues for these costs at the time of sale or repair, when events dictate that additional accruals are necessary.
The following table summarizes warranty activity for the three years ended December 31, 2010.
Warranty accrual at December 31, 2007 |
$ | 381,710 | |||
Charged to expense |
594,421 | ||||
Amounts written off, net of recoveries |
(429,666 | ) | |||
Foreign currency translation adjustment |
(54,909 | ) | |||
Warranty accrual at December 31, 2008 |
$ | 491,556 | |||
Charged to expense |
289,150 | ||||
Amounts written off, net of recoveries |
(417,937 | ) | |||
Foreign currency translation adjustment |
15,376 | ||||
Warranty accrual at December 31, 2009 |
$ | 378,145 | |||
Charged to expense |
841,068 | ||||
Amounts written off, net of recoveries |
(378,302 | ) | |||
Foreign currency translation adjustment |
7,446 | ||||
Warranty accrual as of December 31, 2010 |
$ | 848,357 | |||
Recently Issued Accounting Pronouncements
In June 2009, the Financial Accounting Standards Board ("FASB") issued authoritative guidance related to the accounting for variable interest entities ("VIE's"). The guidance requires reporting entities to evaluate former Qualifying Special Purpose Entities ("QSPE's") for consolidation and changes the approach to determining a VIE's primary beneficiary from a quantitative assessment to a qualitative assessment designed to identify a controlling financial interest. The guidance was effective as of the beginning of a Company's first fiscal year that begins after November 15, 2009. The adoption did not impact the condensed consolidated financial statements.
47
Ballantyne Strong, Inc. and Subsidiaries
Notes to the Consolidated Financial Statements (Continued)
Years ended December 31, 2010, 2009 and 2008
In June 2009, the FASB issued authoritative guidance related to accounting for multiple-deliverable revenue arrangements. This guidance amends ASC 605-25 to eliminate the requirement that all undelivered elements have vendor specific objective evidence ("VSOE") or third-party evidence ("TPE") before an entity can recognize the portion of the overall arrangement fee that is attributable to items that already have been delivered. The guidance is effective prospectively for revenue arrangements entered into or materially modified in fiscal years beginning on or after June 15, 2010. Early adoption is permitted. The adoption did not materially impact the condensed consolidated financial statements.
In January 2010, the FASB issued authoritative guidance on the accounting for fair value measurements and disclosures (Topic 820). The guidance enhances disclosure requirements related to fair value measurements. Certain provisions of the guidance are effective for annual and interim periods beginning after December 15, 2009 and others for fiscal years beginning after December 15, 2010. Beginning with the quarter ended March 31, 2010 we provided new disclosures, as applicable, to the fair value instruments discussion. The disclosures required for fiscal periods beginning after December 15, 2010 are currently not applicable to our financial statements.
3. Comprehensive Income (Loss)
The accumulated other comprehensive income (loss), net, shown in the Company's consolidated balance sheets includes the unrealized loss on investments in securities, pension liability adjustments and the accumulated foreign currency translation adjustments. The following table shows the difference between the Company's reported net earnings (loss) and its comprehensive income (loss):
| |
Years Ended December 31, | ||||||||||
|---|---|---|---|---|---|---|---|---|---|---|---|
| |
2010 | 2009 | 2008 | ||||||||
Comprehensive income (loss): |
|||||||||||
Net income (loss) |
$ | 8,433,453 | $ | 2,070,518 | $ | (3,033,690 | ) | ||||
Other comprehensive income (loss): |
|||||||||||
Unrealized gain (loss) on investment in securities |
— | 742,027 | (742,027 | ) | |||||||
Foreign currency translation adjustment |
545,919 | 604,765 | (831,424 | ) | |||||||
Adjustment to minimum pension liability |
(30,281 | ) | 17,007 | 17,825 | |||||||
Total comprehensive income (loss) |
$ | 8,949,091 | $ | 3,434,317 | $ | (4,589,316 | ) | ||||
Included in unrealized gain (loss) on investment in securities for the twelve months ended December 31, 2009 are realized holding losses of approximately $1.1 million less a reclassification adjustment for gains recorded on the settlement of the securities included in net earnings of approximately $1.1 million. No such losses were incurred during the year ended December 31, 2010.
4. Digital Link II Joint Venture
Investment in Digital Link II
On March 6, 2007, the Company entered into an agreement with RealD to form an operating entity Digital Link II, LLC (the "LLC"). Under the agreement, the LLC was formed with the Company and RealD as the only two members with membership interests of 44.4% and 55.6%, respectively. The LLC was formed for purposes of commercializing certain 3D technology and to fund
48
Ballantyne Strong, Inc. and Subsidiaries
Notes to the Consolidated Financial Statements (Continued)
Years ended December 31, 2010, 2009 and 2008
the deployment of digital projector systems and servers to exhibitors. Summarized financial data for the LLC is as follows (unaudited), in thousands:
Balance Sheet
|
December 31, 2010 |
December 31, 2009 |
|||||
|---|---|---|---|---|---|---|---|
Current assets |
$ | 3,316 | $ | 877 | |||
Non-current assets |
9,419 | 12,935 | |||||
Current liabilities |
3,011 | 3,047 | |||||
Non-current liabilities |
5,361 | 5,574 | |||||
Equity |
$ | 4,363 | $ | 5,191 | |||
| |
Twelve months ended December 31, | |||||||||
|---|---|---|---|---|---|---|---|---|---|---|
Statement of Operations
|
2010 | 2009 | 2008 | |||||||
Revenue |
$ | 8,240 | $ | 22 | $ | (29 | ) | |||
Cost of sales |
(6,455 | ) | (1,553 | ) | (1,064 | ) | ||||
Selling and administrative expenses |
(258 | ) | (295 | ) | (274 | ) | ||||
Operating income (loss) |
1,527 | (1,826 | ) | (1,367 | ) | |||||
Other expense |
(358 | ) | (270 | ) | (54 | ) | ||||
Net income (loss) |
$ | 1,169 | $ | (2,096 | ) | $ | (1,421 | ) | ||
The Company accounts for its investment by the equity method. Under this method, the Company recorded its proportionate share of LLC net income or loss based on the LLC's financial statements as of December 24, 2010. The LLC uses four 13-week periods for a total of 52 weeks to align its fiscal year end with that of its majority interest holder, RealD. The Company's portion of income of the LLC was $0.6 million for the year ended December 31, 2010 as compared to the portion of loss of the LLC of approximately $0.9 million and $0.7 million for the years ended December 31, 2009 and 2008, respectively.
The Company sold digital theatre projection equipment, in the normal course of business, to the LLC for approximately $4.7 million, $2.2 million and $3.7 million during the twelve months ended December 31, 2010, 2009 and 2008, respectively. The LLC in turn provides and sells the digital projection equipment to third party customers under system use agreements or through sales agreements. Revenue recognized by the Company was $4.1 million, $1.2 million and $2.1 million during the twelve months ended December 31, 2010, 2009 and 2008, respectively. Revenue recognized by the Company on the sale transaction to the LLC is limited by its 44.4% ownership in the joint venture which will be recognized upon sale of the equipment to the third parties. The total receivable balance due from the LLC was insignificant at December 31, 2010 and $0.2 million at December 31, 2009.
During the second quarter of 2010, the LLC made a significant sale of equipment to a third party customer that resulted in the LLC recording a gain on the sale of assets of approximately $2.8 million.
During the third quarter of 2010 the Company received a $0.9 million return of the investment in the LLC. The Company received no other distributions from the LLC.
49
Ballantyne Strong, Inc. and Subsidiaries
Notes to the Consolidated Financial Statements (Continued)
Years ended December 31, 2010, 2009 and 2008
Guarantees
During 2010 and 2009, the Company and RealD provided guarantees to notes payable entered into by Digital Link II, LLC to finance digital projection equipment deployed in the normal course of business. The notes bear interest at rates ranging from 7.0% to 7.46%. The following table summarizes the Company's guarantees:
Guarantee Date
|
Interest Rate | Original Notes Payable Balance |
Ballantyne Ownership |
Original Guarantee |
Remaining Guarantee as of 12/31/10 |
|||||||||||
|---|---|---|---|---|---|---|---|---|---|---|---|---|---|---|---|---|
July-08 |
7.0 | % | $ | 626,663 | 44.40 | % | $ | 278,238 | $ | 58,837 | ||||||
November-08 |
7.2 | % | 756,440 | 44.40 | % | 335,860 | — | |||||||||
November-08 |
7.0 | % | 1,142,239 | 44.40 | % | 507,154 | 120,799 | |||||||||
January-09 |
7.2 | % | 265,538 | 44.40 | % | 117,899 | 10,493 | |||||||||
April-09 |
7.2 | % | 1,039,646 | 44.40 | % | 461,603 | 22,326 | |||||||||
September-09 |
7.0 | % | 184,098 | 44.40 | % | 81,739 | 45,403 | |||||||||
October-09 |
7.25 | % | 152,850 | 44.40 | % | 67,865 | 32,143 | |||||||||
March-10 |
7.46 | % | 1,824,774 | 44.40 | % | 810,200 | 520,719 | |||||||||
March-10 |
7.46 | % | 749,308 | 44.40 | % | 332,693 | 223,288 | |||||||||
March-10 |
7.46 | % | 423,224 | 44.40 | % | 187,912 | 135,626 | |||||||||
March-10 |
7.46 | % | 216,141 | 44.40 | % | 95,966 | 74,161 | |||||||||
|
$ | 7,380,921 | $ | 3,277,129 | $ | 1,243,795 | ||||||||||
Under terms of the guarantees, the Company and RealD would be required to fulfill the guarantee should the joint venture be in default of its loans or contract terms. The Company has recorded an insignificant liability for the fair value of the obligations undertaken by issuing the guarantees at December 31, 2010. The guarantees will expire at the time each loan is paid off.
5. Sale of Product Line
During 2008, the Company sold its coater and marinade product line in exchange for $0.3 million in cash. In connection with the sale, the Company recorded a pre-tax net gain of approximately $0.3 million (estimated $0.2 million after-tax) which is net of related costs to sell.
6. Investments
Prior to 2010, the Company had certain investments in auction-rate securities which were classified as available-for-sale securities and accounted for in accordance with SFAS No. 115, "Accounting for Certain Investments in Debt and Equity Securities." In June 2009, the Company entered into a settlement agreement with a financial institution with whom the Company had a banking relationship to sell, at the Company's option, all or a portion of its outstanding auction-rate securities ("ARS") at par, plus accrued interest. The settlement agreement provided for a provision on confidentiality and a release of the financial institution from claims related to the Company's purchase, ownership and sale of the securities. Subsequently, in June 2009, the Company sold its remaining outstanding ARS under the terms of the settlement agreement which amounted to $9.4 million plus interest accrued. During 2009, the Company also liquidated, at par, outstanding ARS which amounted to $0.7 million of which
50
Ballantyne Strong, Inc. and Subsidiaries
Notes to the Consolidated Financial Statements (Continued)
Years ended December 31, 2010, 2009 and 2008
$0.05 million were sold through the normal auction process and $0.6 million were redeemed by the fund itself.
The Company previously recorded a temporary impairment as an unrealized loss on the outstanding ARS in other comprehensive income (loss) prior to settlement of the ARS. As a result of entering into the settlement agreement, the Company recorded the temporary impairment as a realized loss of approximately $1.1 million within other income (expense). The Company also recorded an offsetting gain on the settlement in the amount of $1.1 million which was recorded in other income (expense) during twelve months ended December 31, 2009. No such investments were acquired or sold during the year ended December 31, 2010.
7. Fair Value of Financial Instruments
The fair value of the Company's cash and cash equivalents, accounts receivable, accounts payable and accrued expenses equal or approximate their fair values due to the short-term nature of these instruments. The estimated fair values and related assumptions used to estimate fair value of the Company's financial instruments are disclosed below.
ASC 820 "Fair Value Measurements and Disclosures" establishes a hierarchy for fair value measurements based upon observable independent market inputs and unobservable market assumptions. Inputs refer broadly to the assumptions that market participants would use in pricing the assets or liability, including assumptions about risk. Considerable judgment is required in interpreting market data used to develop the estimates of fair value. The following represents the three categories of inputs used in determining the fair value of financial assets and liabilities:
Level 1: |
Quoted market prices in active markets for identical assets or liabilities. |
|
Level 2: |
Observable market based inputs or unobservable inputs that are corroborated by market data. |
|
Level 3: |
Unobservable inputs that are used in the measurement of assets and liabilities. Unobservable inputs require management to make certain projections and assumptions about the information that would be used by market participants in pricing the asset or liability. |
The Company held no assets or liabilities measured at fair value on a recurring basis with the use of significant unobservable inputs (Level 3) during the years ended December 31, 2010 and 2009.
51
Ballantyne Strong, Inc. and Subsidiaries
Notes to the Consolidated Financial Statements (Continued)
Years ended December 31, 2010, 2009 and 2008
8. Inventories
Inventories consist of the following:
| |
December 31, 2010 | December 31, 2009 | |||||
|---|---|---|---|---|---|---|---|
Raw materials and components |
$ | 5,651,083 | $ | 4,714,956 | |||
Work in process |
431,962 | 169,707 | |||||
Finished goods |
21,857,192 | 8,102,385 | |||||
|
$ | 27,940,237 | $ | 12,987,048 | |||
The inventory balances are net of reserves of approximately $2.9 million and $2.7 million as of December 31, 2010 and December 31, 2009, respectively.
9. Property, Plant and Equipment
Property, plant and equipment include the following:
| |
December 31, 2010 | December 31, 2009 | ||||||
|---|---|---|---|---|---|---|---|---|
Land |
$ | 378,195 | $ | 313,500 | ||||
Buildings and improvements |
8,955,504 | 4,106,869 | ||||||
Machinery and equipment |
8,182,312 | 5,802,596 | ||||||
Office furniture and fixtures |
1,659,920 | 2,196,827 | ||||||
Total properties cost |
19,175,931 | 12,419,792 | ||||||
Less accumulated depreciation |
(9,425,884 | ) | (8,806,857 | ) | ||||
Net property, plant and equipment |
$ | 9,750,047 | $ | 3,612,935 | ||||
Depreciation expense amounted to approximately $0.9 million, $0.8 million and $0.9 million for the years ended December 31, 2010, 2009 and 2008, respectively.
10. Intangible Assets
As of December 31, 2010 and December 31, 2009, the Company had unamortized identifiable net assets of $0.7 million and $1.1 million, respectively. The following table details amounts relating to those assets as of December 31, 2010:
| |
Useful life | Gross | Accumulated amortization |
Net | ||||||||||
|---|---|---|---|---|---|---|---|---|---|---|---|---|---|---|
| |
(Years) |
|
|
|
||||||||||
Intangible assets subject to amortization: |
||||||||||||||
Customer relationships |
3 - 40 | $ | 1,801,055 | $ | (1,209,358 | ) | $ | 591,697 | ||||||
Trademarks |
2 - 23 | 270,576 | (178,409 | ) | 92,167 | |||||||||
Non-competition agreement |
167,528 | (150,504 | ) | 17,024 | ||||||||||
Total |
$ | 2,239,159 | $ | (1,538,271 | ) | $ | 700,888 | |||||||
52
Ballantyne Strong, Inc. and Subsidiaries
Notes to the Consolidated Financial Statements (Continued)
Years ended December 31, 2010, 2009 and 2008
The following table details amounts relating to those assets as of December 31, 2009:
| |
Useful life | Gross | Accumulated amortization |
Net | ||||||||||
|---|---|---|---|---|---|---|---|---|---|---|---|---|---|---|
| |
(Years) |
|
|
|
||||||||||
Intangible assets subject to amortization: |
||||||||||||||
Customer relationships |
4 - 5 | $ | 1,706,003 | $ | (741,061 | ) | $ | 964,942 | ||||||
Trademarks |
3 | 227,470 | (165,066 | ) | 62,404 | |||||||||
Non-competition agreement |
3 - 5 | 166,158 | (116,376 | ) | 49,782 | |||||||||
Intangible assets not subject to amortization: |
||||||||||||||
Trademark |
Indefinite | 26,000 | — | 26,000 | ||||||||||
Total |
$ | 2,125,631 | $ | (1,022,503 | ) | $ | 1,103,128 | |||||||
The increase in the cost of the identifiable assets is due to certain intangibles recorded in a foreign currency and therefore affected by fluctuations in the exchange rate. Intangible assets, other than goodwill, with definitive lives are amortized over their useful lives.
The Company recorded amortization expense relating to other identifiable intangible assets of $0.4 million during each of the years ended December 31, 2010, 2009 and 2008. The difference between the amortization expense recorded and the change in accumulated amortization is the result of translating the intangible assets carried in Canadian dollars at each period end. The following table shows the Company's estimated future amortization expense related to intangible assets for the next five years.
| |
Amount | |||
|---|---|---|---|---|
2011 |
$ | 420,665 | ||
2012 |
$ | 175,154 | ||
2013 |
$ | 43,474 | ||
2014 |
$ | 43,474 | ||
2015 |
$ | 18,110 | ||
11. Goodwill
During 2008 the Company recorded a non-cash impairment charge for the entire carrying value of goodwill or $2.3 million. After this charge no goodwill balance remains on the books for the years ended December 31, 2010 and 2009.
53
Ballantyne Strong, Inc. and Subsidiaries
Notes to the Consolidated Financial Statements (Continued)
Years ended December 31, 2010, 2009 and 2008
12. Other Accrued Expenses
The major components of other current accrued expenses are as follows:
| |
December 31, | |||||||
|---|---|---|---|---|---|---|---|---|
| |
2010 | 2009 | ||||||
Employee related |
$ | 2,050,494 | $ | 1,809,825 | ||||
Interest and taxes |
590,461 | 571,366 | ||||||
Acquisition and related accruals |
— | 233,874 | ||||||
Post-retirement benefit obligation |
15,054 | 17,342 | ||||||
Legal and professional fees |
116,992 | 495,844 | ||||||
Warranty obligation |
848,357 | 378,145 | ||||||
Other |
268,478 | 116,747 | ||||||
Total |
$ | 3,889,836 | $ | 3,623,143 | ||||
The major components of long-term accrued expenses are as follows:
| |
December 31, | |||||||
|---|---|---|---|---|---|---|---|---|
| |
2010 | 2009 | ||||||
Acquisition and related accruals |
$ | — | $ | 92,371 | ||||
Post-retirement benefit obligation |
357,639 | 342,669 | ||||||
Other |
19,064 | 48,385 | ||||||
Total |
$ | 376,703 | $ | 483,425 | ||||
13. Debt
Effective June 30, 2010, the Company entered into a $20 million Revolving Credit Agreement and Note (collectively, the "Revolving Credit Agreement"), each effective as of June 30, 2010, with Wells Fargo Bank, N.A. ("Wells Fargo"). The Company may request an increase in the Revolving Credit Agreement of up to an additional $5 million; however, any advances on the additional $5 million are subject to approval of Wells Fargo. The borrowings from the Revolving Credit Agreement will primarily be used for working capital purposes and for other general corporate purposes. The Company's accounts receivable, general intangibles and inventory secure the Revolving Credit Agreement.
Borrowings under the Revolving Credit Agreement bear interest at a rate equal to LIBOR plus 125 basis points. Interest is paid on a monthly basis. The Company will pay a fee of 0.15% per annum on any unused portion. The Revolving Credit Agreement expires on June 30, 2011 at which time all unpaid principal and interest is due.
The Revolving Credit Agreement contains certain covenants, including those relating to the Company's financial condition and limitations on the ability of the Company to pay dividends. The primary financial condition covenant pertains to the Company maintaining a minimum net profit before taxes plus or minus non-cash equity in income of the Digital Link II, LLC joint venture, plus any non-cash charges related to the legacy film projector business, of $1, measured quarterly, on a rolling 4-quarter basis. Other covenants pertain to items such as certain limits on incurring additional debt or lease obligations, certain limits on issuing guarantees and certain limits on loans, advances and investments with third parties. Upon the occurrence of any event of default specified in the Revolving
54
Ballantyne Strong, Inc. and Subsidiaries
Notes to the Consolidated Financial Statements (Continued)
Years ended December 31, 2010, 2009 and 2008
Credit Agreement, including a change in control of the Company (as defined in the Revolving Credit Agreement), all amounts due there under may be declared to be immediately due and payable. No amounts are currently outstanding on the Revolving Credit Agreement.
The Company previously was a party to a revolving credit facility with First National Bank of Omaha. This revolving credit facility expired on July 1, 2010.
14. Income Taxes
Income (loss) before income taxes consists of:
| |
Years Ended December 31, | |||||||||
|---|---|---|---|---|---|---|---|---|---|---|
| |
2010 | 2009 | 2008 | |||||||
United States |
$ | 1,021,373 | $ | (3,382,912 | ) | $ | (5,670,768 | ) | ||
Foreign |
11,370,076 | 6,132,888 | 1,726,037 | |||||||
|
$ | 12,391,449 | $ | 2,749,976 | $ | (3,944,731 | ) | |||
Income tax expense (benefit) attributable to income from continuing operations consists of:
| |
Years Ended December 31, | ||||||||||
|---|---|---|---|---|---|---|---|---|---|---|---|
| |
2010 | 2009 | 2008 | ||||||||
Current: |
|||||||||||
Federal expense (benefit) |
$ | 543,970 | $ | (1,763,604 | ) | $ | (815,539 | ) | |||
State expense (benefit) |
11,089 | (65,085 | ) | 4,286 | |||||||
Foreign expense |
3,150,454 | 1,799,301 | 1,201,317 | ||||||||
Deferred: |
|||||||||||
Federal expense (benefit) |
233,059 | 727,052 | (845,050 | ) | |||||||
State expense (benefit) |
32,044 | (3,750 | ) | (120,286 | ) | ||||||
Foreign expense (benefit) |
(12,620 | ) | (14,456 | ) | (335,769 | ) | |||||
|
$ | 3,957,996 | $ | 679,458 | $ | (911,041 | ) | ||||
Income tax expense attributable to income (loss) from continuing operations differed from the amounts computed by applying the U.S. Federal income tax rate of 34 percent to pretax income (loss) from continuing operations as follows:
| |
Years Ended December 31, | |||||||||
|---|---|---|---|---|---|---|---|---|---|---|
| |
2010 | 2009 | 2008 | |||||||
Expected tax expense (benefit) |
$ | 4,213,093 | $ | 934,992 | $ | (1,341,208 | ) | |||
State income taxes, net of federal effect |
28,468 | (45,431 | ) | (76,560 | ) | |||||
Foreign tax rates varying from 34% |
(372,628 | ) | (263,203 | ) | — | |||||
Tax-exempt interest |
— | (12,252 | ) | (103,198 | ) | |||||
Non-deductible goodwill |
— | — | 557,305 | |||||||
Other |
89,063 | 65,352 | 52,620 | |||||||
|
$ | 3,957,996 | $ | 679,458 | $ | (911,041 | ) | |||
55
Ballantyne Strong, Inc. and Subsidiaries
Notes to the Consolidated Financial Statements (Continued)
Years ended December 31, 2010, 2009 and 2008
Deferred tax assets and liabilities were comprised of the following:
| |
December 31, | ||||||||
|---|---|---|---|---|---|---|---|---|---|
| |
2010 | 2009 | |||||||
Deferred tax assets: |
|||||||||
Non-deductible accruals |
$ | 270,541 | $ | 292,049 | |||||
Inventory reserves |
1,448,570 | 1,448,463 | |||||||
Warranty reserves |
147,055 | 126,564 | |||||||
Net operating losses |
114,619 | 157,455 | |||||||
Uncollectible receivable reserves |
308,831 | 247,038 | |||||||
Accrued group health insurance claims |
112,369 | 59,313 | |||||||
AMT credit carry forward |
87,956 | 161,886 | |||||||
Stock compensation expense |
144,311 | 69,404 | |||||||
Depreciation and amortization |
476,564 | 310,979 | |||||||
Other |
174,119 | 176,659 | |||||||
Net deferred tax assets |
3,284,935 | 3,049,810 | |||||||
Deferred tax liability—equity in loss of joint venture |
(1,347,765 | ) | (860,157 | ) | |||||
Net deferred tax assets |
$ | 1,937,170 | $ | 2,189,653 | |||||
Federal and state income taxes have not been provided on accumulated but undistributed earnings of foreign subsidiaries aggregating approximately $12.4 million at December 31, 2010 as these earnings have been permanently reinvested in the business. The determination of the amount of the unrecognized deferred tax liability related to the undistributed earnings is not practicable.
The Company follows the guidance in ASC 740 Income Taxes as it pertains to uncertain tax positions. The guidance requires that uncertain tax positions are evaluated in a two-step process, whereby 1) the Company determines whether it is more likely than not that the tax positions will be sustained based on the technical merits of the position and 2) for those tax positions that meet the more likely than not recognition threshold, the Company would recognize the largest amount of tax benefit that is greater than fifty percent likely to be realized upon ultimate settlement with the related tax authority. The Company's uncertain tax positions are related to tax years that remain subject to examination by the relevant taxable authorities. The Company has examinations not yet initiated for Federal purposes for fiscal years 2006 through 2009. In most cases, the Company has examinations open for State or local jurisdictions based on the particular jurisdiction's statute of limitations. The Company does not currently have any examinations in process. As of December 31, 2010 and 2009, total unrecognized tax benefits amounted to approximately $0.1 million.
Estimated amounts related to estimated underpayment of income taxes, including interest and penalties, are classified as a component of tax (benefit) expense in the consolidated statements of operations and were not material for the year ended December 31, 2010. Amounts accrued for estimated underpayment of income taxes amounted to $0.1 million as of December 31, 2010. The accruals largely related to state tax matters.
15. Note Receivable
During July 2006, the Company entered into a note receivable arrangement with Digital Link LLC (Digital Link) pertaining to the sale and installation of digital projectors. The sale amounted to
56
Ballantyne Strong, Inc. and Subsidiaries
Notes to the Consolidated Financial Statements (Continued)
Years ended December 31, 2010, 2009 and 2008
$0.8 million of which 25% was due upon installation and was collected. The remaining amounts are due over a 5-year period at an 8% interest rate. The costs incurred with the sale of projectors to Digital Link were expensed during 2006 with no future associated costs to be incurred. During 2010 the remaining $0.2 million owed under the note receivable was received from Digital Link and recorded to revenue.
16. Supplemental Cash Flow Information
Supplemental disclosures to the consolidated statements of cash flows are as follows:
| |
Years Ended December 31, | ||||||||||
|---|---|---|---|---|---|---|---|---|---|---|---|
| |
2010 | 2009 | 2008 | ||||||||
Cash paid during the year for: |
|||||||||||
Interest |
$ | 16,496 | $ | 9,964 | $ | 7,411 | |||||
Income taxes |
$ | 3,117,344 | $ | 1,456,741 | $ | 683,491 | |||||
17. Stock Compensation
The Company accounts for awards of share-based compensation in accordance with ASC 718, Stock Compensation—Overall, which requires the measurement and recognition of compensation expense for all share-based payment awards made to employees and directors based on estimated fair values. Share-based compensation expense recorded amounted to $0.4 million for each of the years ended December 31, 2010 and 2009 and $0.3 million for the year ended December 31, 2008.
During the second quarter of 2010, the Company adopted and, at the 2010 Annual Meeting of Stockholders, the stockholders approved the 2010 Long-Term Incentive Plan ("2010 Plan"). Subject to the terms of the 2010 Plan, the Compensation Committee has the discretion to determine the terms of each award, including which award, if any, may be subject to vesting upon a "change in control" of the Company. The Committee may grant stock options, stock appreciation rights, restricted shares, restricted stock units, performance shares, or performance units. The total number of shares reserved for issuance under the 2010 Plan was 600,000 shares. No shares were granted during the twelve months ended December 31, 2010.
Options
The Company currently maintains a 2005 Outside Directors Stock Option Plan which was approved by the Company's stockholders. During fiscal 2008, the Board of Directors made the decision to discontinue granting further stock options under this plan, however, there are outstanding stock options remaining under this plan. The Company also maintained a 1995 Employee Stock Option Plan which expired in 2005, however, there are outstanding stock options remaining under this expired plan.
All past and future grants under the Company's stock option plans were granted at exercise prices based on the fair market value of the Company's common stock on the date of grant. The outstanding options generally vested over periods ranging from zero to three years from the grant date and expired between 5 and 10 years after the grant date. No stock options were granted under these plans during the years ended December 31, 2010 and 2009, respectively.
57
Ballantyne Strong, Inc. and Subsidiaries
Notes to the Consolidated Financial Statements (Continued)
Years ended December 31, 2010, 2009 and 2008
During the fourth quarter of fiscal 2010, the Board of Directors granted the Company's President and CEO 50,000 non-qualified stock options upon his being hired by the Company. The options were granted at an exercise price based on the fair market value of the Company's common stock on the date of grant and expire 10 years after the date of grant. These options were granted outside of any of the Company's existing stock compensation plans pursuant to applicable regulations allowing for such a grant.
The estimated grant date fair value of the options granted during the twelve months ended December 31, 2010 of $5.12 was calculated using the Black-Scholes option-pricing model using the following weighted average assumptions:
| |
2010 | |||
|---|---|---|---|---|
Expected dividend yield |
0.0 | % | ||
Risk-free interest rate |
0.50 | % | ||
Expected volatility |
67.30 | % | ||
Expected life (in years) |
6.5 | |||
The share-based compensation expense related to stock options included in earnings (loss) before income taxes included an insignificant amount for the year ended December 31, 2010; no expense in the year ended December 31, 2009 and an insignificant amount for the year ended December 31, 2008. Likewise, the associated tax benefits in each of the three years ended December 31, 2010, 2009 and 2008 was insignificant. All stock options outstanding pursuant to the Company's stock option plans were fully vested as of January 1, 2009.
The following table summarizes the Company's activities with respect to its stock options:
| |
Number of Options |
Weighted Average Exercise Price Per Share |
Weighted Average Remaining Contractual Term |
Aggregate Intrinsic Value |
||||||||||
|---|---|---|---|---|---|---|---|---|---|---|---|---|---|---|
Outstanding at December 31, 2007 |
443,750 | 2.33 | ||||||||||||
Granted |
— | — | ||||||||||||
Exercised |
(123,625 | ) | 0.73 | |||||||||||
Forfeited |
(42,000 | ) | 7.30 | |||||||||||
Outstanding at December 31, 2008 |
278,125 | 2.29 | 2.69 | $ | 113,250 | |||||||||
Granted |
— | — | ||||||||||||
Exercised |
— | — | ||||||||||||
Forfeited |
— | — | ||||||||||||
Outstanding at December 31, 2009 |
278,125 | 2.29 | 1.69 | $ | 480,450 | |||||||||
Granted |
50,000 | 8.32 | ||||||||||||
Exercised |
(105,875 | ) | 3.39 | |||||||||||
Forfeited |
— | — | ||||||||||||
Outstanding at December 31, 2010 |
222,250 | $ | 3.12 | 3.05 | $ | 1,071,464 | ||||||||
Exercisable at December 31, 2010 |
172,250 | $ | 1.62 | 1.08 | $ | 1,090,214 | ||||||||
The aggregate intrinsic value in the table above represents the total that would have been received by the option holders if all in-the-money options had been exercised on December 31, 2010.
58
Ballantyne Strong, Inc. and Subsidiaries
Notes to the Consolidated Financial Statements (Continued)
Years ended December 31, 2010, 2009 and 2008
The following table summarizes information about stock options outstanding and exercisable at December 31, 2010:
| |
Options Outstanding at December 31, 2010 |
Options Exercisable at December 31, 2010 |
|||||||||||||||||
|---|---|---|---|---|---|---|---|---|---|---|---|---|---|---|---|---|---|---|---|
Range of option exercise price
|
Number of options |
Weighted average remaining contractual life |
Weighted average exercise price per option |
Number of options |
Weighted average remaining contractual life |
Weighted average exercise price per option |
|||||||||||||
$0.62 |
125,000 | 1.33 | $ | 0.62 | 125,000 | 1.33 | $ | 0.62 | |||||||||||
$4.25 |
47,250 | 0.42 | $ | 4.25 | 47,250 | 0.42 | $ | 4.25 | |||||||||||
$8.32 |
50,000 | 9.83 | 8.32 | — | — | — | |||||||||||||
$0.62 to 8.32 |
222,250 | 3.05 | $ | 3.12 | 172,250 | 1.08 | $ | 1.62 | |||||||||||
As of December 31, 2010, 50,000 stock option awards were non-vested. Unrecognized compensation cost related to non-vested stock option awards was $0.2 million for the twelve months ended December 31, 2010. No unrecognized compensation cost related to non-vested stock option awards existed as of the years ended December 31, 2009 and 2008.
Restricted Stock Plans
During 2005, the Company adopted and the stockholders approved, the 2005 Restricted Stock Plan. Under terms of the plan, the Compensation Committee of the Board of Directors selects which employees of the Company are to receive restricted stock awards and the terms of such awards. The total number of shares reserved for issuance under the plan was 250,000 shares. The plan was set to expire in September 2010; however, at the 2010 Annual Meeting of Stockholders, the stockholders of the Company adopted an amendment to extend the duration of the Plan until September 1, 2013. During May 2008, the Company granted 54,000 shares to certain employees. A portion of the shares vested on January 1, 2009 with the remaining shares vesting on January 1, 2010 as the Company achieved certain earning thresholds, as defined within the restricted stock agreements. During February of 2009, 64,491 shares of restricted stock were granted under this plan as partial payment under the Company's 2008 Short-Term Incentive Plan. Additionally, during February of 2010, 41,030 shares of restricted stock were granted under this plan as partial payment under the Company's 2009 Short-Term Incentive Plan. At December 31, 2010, 90,479 shares remain available for issuance under the Plan.
During 2008, the Company adopted and the stockholders approved, the Ballantyne Strong, Inc. Non-Employee Directors' Restricted Stock Plan (Non-Employee Plan) to replace the 2005 Outside Directors' Stock Option Plan. The total number of shares reserved for issuance under the Non-Employee Plan was increased from 120,000 shares to 250,000 by a vote of the stockholders at the 2009 Annual Stockholders Meeting. During May 2008, the Company granted 15,000 restricted shares under the Non-Employee Plan to the Board of Directors. These shares vested on May 21, 2009. During May 2009, the Company granted 27,000 restricted shares under the Non-Employee Plan to the Board of Directors. These shares vested on May 20, 2010. Additionally, in April 2009, 18,889 restricted shares were issued in conjunction with an agreement entered into with a member of the Company's Board of Directors to provide consulting services. Subsequently, in September 2009, the consulting agreement was mutually terminated as the objectives of the agreement were achieved. As a result, 8,124 shares vested on the date of the termination agreement and the remaining 10,765 shares were cancelled and
59
Ballantyne Strong, Inc. and Subsidiaries
Notes to the Consolidated Financial Statements (Continued)
Years ended December 31, 2010, 2009 and 2008
made available for future issuance in accordance with the Non-Employee Plan. In May 2010, the Company granted 10,200 restricted shares under the Non-Employee Plan to the Board of Directors. These shares will vest the day after the Company's 2011 Annual Stockholder Meeting. At December 31, 2010, 189,676 shares remain available for issuance under the Plan.
In connection with the restricted stock granted to certain employees and non-employee directors, the Company is accruing compensation expense based on the estimated number of shares expected to be issued utilizing the most current information available to the Company at the date of the financial statements. The Company estimates the fair value of restricted stock awards based upon the market price of the underlying common stock on the date of grant.
As of December 31, 2010, the total unrecognized compensation cost related to non-vested restricted stock awarded was insignificant and is expected to be recognized over a weighted average period of 5.5 months.
The following table summarizes restricted stock activity for the years ended December 31:
| |
Number of Restricted Stock Shares |
Weighted Average Grant Price Fair Value |
||||||
|---|---|---|---|---|---|---|---|---|
Nonvested at December 31, 2008 |
69,000 | $ | 4.48 | |||||
Granted |
110,380 | 1.88 | ||||||
Shares vested |
(52,124 | ) | 4.11 | |||||
Shares forfeited |
(10,765 | ) | 2.25 | |||||
Nonvested at December 31, 2009 |
116,491 | $ | 2.38 | |||||
Granted |
51,230 | 4.88 | ||||||
Shares vested |
(93,030 | ) | 3.65 | |||||
Shares forfeited |
— | |||||||
Nonvested at December 31, 2010 |
74,691 | $ | 2.51 | |||||
Employee Stock Purchase Plan
The Company's Employee Stock Purchase Plan, approved by the stockholders, provides for the purchase of shares of Ballantyne common stock by eligible employees at a per share purchase price equal to 85% of the fair market value of a share of Ballantyne common stock at either the beginning or end of the offering period, as defined, whichever is lower. Purchases are made through payroll deductions of up to 10% of each participating employee's salary. The maximum number of shares that can be purchased by participants in any offering period is 2,000 shares. Additionally, the Plan has set certain limits, as defined, in regard to the number of shares that may be purchased by all eligible employees during an offering period. At December 31, 2010, 76,194 shares of common stock remained available for issuance under the Plan. The Plan was set to expire in October 2010; however, at the 2010 Annual Meeting of Stockholders, the stockholders of the Company adopted an amendment to extend the duration of the Plan until October 31, 2013.
60
Ballantyne Strong, Inc. and Subsidiaries
Notes to the Consolidated Financial Statements (Continued)
Years ended December 31, 2010, 2009 and 2008
The total estimated grant date fair value of purchase rights outstanding under the Employee Stock Purchase Plan of $4.04 was calculated using the Black-Scholes option pricing model using weighted average assumptions as follows:
| |
For the years ended December 31, | |||||||||
|---|---|---|---|---|---|---|---|---|---|---|
| |
2010 | 2009 | 2008 | |||||||
Risk-free interest rate |
0.30 | % | 0.47 | % | 0.37 | % | ||||
Dividend yield |
— | % | — | % | — | % | ||||
Expected volatility |
56.94 | % | 69.95 | % | 86.09 | % | ||||
Expected term (years) |
1.0 | 1.0 | 1.0 | |||||||
Estimated grant date fair value |
$ | 4.04 | $ | 2.05 | $ | 0.91 | ||||
The Company recorded approximately $0.07 million, $0.03 million and an insignificant amount of share-based compensation expense pertaining to the stock purchase plan during the years ended December 31, 2010, 2009 and 2008, respectively. The associated tax benefits recorded in 2010, 2009 and 2008 were insignificant. At December 31, 2010, the total unrecognized estimated compensation cost was $0.02 million which is expected to be recognized over a period of 10 months.
18. Share Repurchase Program
On November 12, 2008, the Company's Board of Directors approved a share repurchase program. Under the share repurchase program, the Company may repurchase up to $1.0 million of the Company's outstanding shares of common stock. As of December 31, 2010, the Company has repurchased 42,177 shares at a weighted average cost of approximately $1.59 per share for a total cost of $0.07 million which were recorded to treasury stock. No repurchases were made during fiscal 2010 or 2009. At December 31, 2010, $0.9 million remains available under the authorized program.
19. Stockholder Rights Plan
The Company's Stockholders Rights Plan expired on June 9, 2010 in accordance with the terms of the Plan.
20. Related Party Transactions
The Company sold digital projection equipment, in the normal course of business, to its joint venture, Digital Link II, LLC for approximately $4.7 million, $2.2 million and $3.7 million for the years ended December 31, 2010, 2009 and 2008, respectively. The LLC in turn provides the digital projection equipment to third party customers under system use agreements. Revenue recognized by the Company was $4.1 million, $1.2 million and $2.1 million for the years ended December 31, 2010, 2009 and 2008, respectively. Revenue recognized by the Company on the sale transaction to the LLC is limited by its 44.4% ownership in the joint venture which will be recognized upon sale of the equipment to the third parties. The total receivable balance due from the LLC was insignificant at December 31, 2010 and $0.2 million at December 31, 2009.
21. Foreign Exchange Contracts
The Company's primary exposure to foreign currency fluctuations pertains to its subsidiaries in Canada and China. In certain instances the Company may enter into foreign exchange forward
61
Ballantyne Strong, Inc. and Subsidiaries
Notes to the Consolidated Financial Statements (Continued)
Years ended December 31, 2010, 2009 and 2008
contracts to manage a portion of this risk. At December 31, 2010, 2009 and 2008, the Company had open forward exchange contracts to purchase Canadian dollars at a fixed rate of U.S. dollars with notional amounts totaling $3.1 million, $3.2 million and $0.6 million, respectively. The fair value of the open contracts amounted to approximately $3.1 million and $3.0 million at December 31, 2010 and 2009, respectively. The Company recorded insignificant unrealized gains (losses) associated with these open contracts in its consolidated statement of operations at December 31, 2010, 2009 and 2008.
22. Commitments, Contingencies and Concentrations
- a.
- Bonus Plans
The Compensation Committee of the Board of Directors administers a Short-Term Incentive Plan (the "Plan"). The Plan is an annual incentive program that provides certain officers and key employee's bonuses in the form of cash or restricted stock or a combination of both if the Company achieves certain financial goals. Each payout is further subject to the achievement of certain individual goals, as defined in the Plan.
The Company has recorded expenses related to the Plan of approximately $0.6 million, $0.4 million and $0.1 million for the years ended December 31, 2010, 2009 and 2008. The bonuses are generally paid through a distribution of cash and restricted stock.
- b.
- Retirement Plan
The Company sponsors a defined contribution 401-K plan (the "Plan") for all eligible employees. Pursuant to the provisions of the Plan, employees may defer up to 100% of their compensation. The Company will match 50% of the amount deferred up to 6% of their compensation. The contributions made to the Plan by the Company was approximately $0.2 million for each of the years ended December 31, 2010, 2009 and 2008.
- c.
- Postretirement Health Care
The Company sponsors a postretirement health care plan (the "Plan") for certain current and former executives and their spouses. The Company's policy is to fund the cost of the Plan as expenses are incurred. The costs of the postretirement benefits are accrued over the employees' service lives.
The Company accounts for this plan in accordance with ASC 715 Compensation—Retirement Benefits. The guidance requires companies to recognize the funded status of defined benefit pension and other postretirement plans as a net asset or liability on its balance sheet. Actuarial gains and losses are generally amortized subject to the corridor, over the average remaining service life of the Company's active employees.
62
Ballantyne Strong, Inc. and Subsidiaries
Notes to the Consolidated Financial Statements (Continued)
Years ended December 31, 2010, 2009 and 2008
The following table sets forth the Plan's benefit obligations, fair value of plan assets, and funded status at December 31, 2010 and 2009:
| |
2010 | 2009 | |||||||
|---|---|---|---|---|---|---|---|---|---|
Reconciliation of benefit obligation |
|||||||||
Benefit obligation at January 1 |
$ | 293,851 | $ | 304,713 | |||||
Interest cost |
15,245 | 16,567 | |||||||
Benefits paid, net of contributions |
(12,220 | ) | (4,429 | ) | |||||
Actuarial gain |
20,822 | (23,000 | ) | ||||||
Benefit obligation at December 31 |
317,698 | 293,851 | |||||||
Fair value of plan assets at December 31 |
— | — | |||||||
Funded status at end of year |
$ | (317,698 | ) | $ | (293,851 | ) | |||
Amounts recognized in the balance sheet consist of: |
|||||||||
Noncurrent assets |
$ | — | $ | — | |||||
Current liabilities |
(17,011 | ) | (17,342 | ) | |||||
Noncurrent liabilities |
(300,687 | ) | (276,509 | ) | |||||
Accumulated other comprehensive income |
(80,384 | ) | (110,665 | ) | |||||
Net amount recognized |
$ | (398,082 | ) | $ | (404,516 | ) | |||
Amounts recognized in accumulated other comprehensive income consists of:
| |
2010 | 2009 | ||||||
|---|---|---|---|---|---|---|---|---|
Net actuarial gain |
$ | 80,384 | $ | 110,665 | ||||
Total accumulated other comprehensive income |
$ | 80,384 | $ | 110,665 | ||||
The accumulated benefit obligation for the Plan was $318,000 and $294,000 at December 31, 2010 and 2009, respectively. Net periodic benefit cost recognized in 2010, 2009 and 2008 was:
| |
2010 | 2009 | 2008 | |||||||
|---|---|---|---|---|---|---|---|---|---|---|
Interest cost |
$ | 15,245 | $ | 16,567 | $ | 17,128 | ||||
Amortization of gain |
(9,459 | ) | (5,993 | ) | (4,128 | ) | ||||
Net periodic benefit cost recognized |
$ | 5,786 | $ | 10,574 | $ | 13,000 | ||||
63
Ballantyne Strong, Inc. and Subsidiaries
Notes to the Consolidated Financial Statements (Continued)
Years ended December 31, 2010, 2009 and 2008
Other changes in plan assets and benefit obligations recognized in accumulated other comprehensive income in December 31, 2010, 2009 and 2008 are as follows:
| |
2010 | 2009 | 2008 | ||||||||
|---|---|---|---|---|---|---|---|---|---|---|---|
Net actuarial gain (loss) |
$ | (20,822 | ) | $ | 23,000 | $ | 21,953 | ||||
Amortization of (gain) loss |
(9,459 | ) | (5,993 | ) | (4,128 | ) | |||||
Total recognized in accumulated other comprehensive income |
$ | (30,281 | ) | $ | 17,007 | $ | 17,825 | ||||
Total recognized in net periodic benefit cost and accumulated other comprehensive income |
$ | (24,495 | ) | $ | 27,581 | $ | 30,825 | ||||
For the defined postretirement benefits plan, amortization of the net gain from accumulated other comprehensive income into net periodic benefit cost in the amount of $4,419 is expected to be recognized in the next fiscal year.
Weighted average assumptions used to determine benefit obligations at December 31, 2010, 2009 and 2008 were as follows:
| |
2010 | 2009 | 2008 | |||||||
|---|---|---|---|---|---|---|---|---|---|---|
Discount rate |
5.25 | % | 5.75 | % | 5.75 | % | ||||
Rate of compensation increase |
N/A | N/A | N/A | |||||||
Health care cost trend rate |
9.0 | % | 6.5 | % | 7.00 | % | ||||
Weighted average assumptions used to determine net periodic postretirement benefit cost for the years ended December 31, 2010, 2009 and 2008 were as follows:
| |
2010 | 2009 | 2008 | |||||||
|---|---|---|---|---|---|---|---|---|---|---|
Discount rate |
5.75 | % | 5.75 | % | 5.75 | % | ||||
Expected long-term rate of return on plan assets |
N/A | N/A | N/A | |||||||
Rate of compensation increase |
N/A | N/A | N/A | |||||||
Health care cost trend rate |
9.0 | % | 6.5 | % | 7.00 | % | ||||
Assumed health care trend rates have a significant effect on the amounts reported for health care plans. A 1% change in assumed health care cost trend rates would have the following effects:
| |
1% Increase |
1% Decrease |
|||||
|---|---|---|---|---|---|---|---|
Effect on total service and interest cost components of periodic postretirement health care benefit cost |
$ | 1,810 | $ | (1,607 | ) | ||
Effect on the health care component of the accumulated postretirement benefit obligation |
$ | 36,828 | $ | (32,945 | ) | ||
64
Ballantyne Strong, Inc. and Subsidiaries
Notes to the Consolidated Financial Statements (Continued)
Years ended December 31, 2010, 2009 and 2008
For measurement purposes, a 9.0% annual rate of increase in the per capita cost of covered health care benefits was assumed for 2010. The rate was assumed to decrease gradually to 6.0% through 2014 and remain at that level thereafter.
| |
2010 | 2009 | 2008 | |||||||
|---|---|---|---|---|---|---|---|---|---|---|
Benefit cost |
$ | 5,786 | $ | 10,574 | $ | 13,000 | ||||
Employer contribution |
— | — | — | |||||||
Plan participants' contributions |
1,800 | 1,800 | 1,800 | |||||||
Benefits paid |
14,020 | 6,229 | 5,774 | |||||||
The Company expects to contribute $17,011 to its postretirement benefit plan in 2011.
The benefits expected to be paid from the postretirement benefit plan are as follows:
| |
Amount | |||
|---|---|---|---|---|
2011 |
$ | 17,011 | ||
2012 |
$ | 17,914 | ||
2013 |
$ | 18,821 | ||
2014 |
$ | 19,727 | ||
2015 |
$ | 20,626 | ||
2016 - 2020 |
$ | 91,061 | ||
The expected benefits are based on the same assumptions used to measure the Company's benefit obligation at December 31, 2010 and include estimated future employee service.
- d.
- Concentrations
The Company's top ten customers accounted for approximately 42% of 2010 consolidated net revenues and were primarily from the theatre segment. Trade accounts receivable from these customers represented approximately 40% of net consolidated receivables at December 31, 2010. Sales to China Film Jingdian Cinema Investment Company, Ltd. represented approximately 8% of total sales, while sales to Regal Cinemas, Inc. were the next highest at 7%. Additionally, receivables from China Film Jingdian Cinema Investment Company, Ltd. and Kasima, LLC represented approximately 14% and 8% of net consolidated receivables at December 31, 2010, respectively. While the Company believes its relationships with such customers are stable, most arrangements are made by purchase order and are terminable at will by either party. A significant decrease or interruption in business from the Company's significant customers could have a material adverse effect on the Company's business, financial condition and results of operations. The Company could also be adversely affected by such factors as changes in foreign currency rates and weak economic and political conditions in each of the countries in which the Company sells its products.
Financial instruments that potentially expose the Company to a concentration of credit risk principally consist of accounts receivable. The Company sells product to a large number of customers in many different geographic regions. To minimize credit concentration risk, the Company performs ongoing credit evaluations of its customers' financial condition.
Through distribution agreements with NEC, the Company distributes Starus DLP Cinema projectors to North and South America, the Caribbean, Hong Kong, China and certain other areas of Asia. These agreements are non-exclusive distributorship agreements and some of which can be
65
Ballantyne Strong, Inc. and Subsidiaries
Notes to the Consolidated Financial Statements (Continued)
Years ended December 31, 2010, 2009 and 2008
terminated with 90 day advance notice. NEC is the primary supplier of the digital products the Company distributes to the Theatre Industry. If the Company is unable to maintain its relationship with NEC, the results would have a material adverse impact on its business, financial condition and operating results until the Company could find an alternative source of digital equipment to distribute. The principal raw materials and components used in the Company's manufacturing processes include aluminum, reflectors, electronic subassemblies and sheet metal. The Company uses a single manufacturer for each of its intermittent movement components, reflectors, aluminum castings, lenses and xenon lamps. Although the Company has not to-date experienced a significant difficulty in obtaining these components, no assurance can be given that shortages will not arise in the future. The loss of any one or more of such contract manufacturers could have a short-term adverse effect on the Company until alternative manufacturing arrangements are secured.
- e.
- Leases
The Company and its subsidiaries lease plant and office facilities, furniture, autos and equipment under operating leases expiring through 2012. These leases generally contain renewal options and the Company expects to renew or replace certain of these leases in the ordinary course of business. Rent expense under operating lease agreements amounted to approximately $0.4 million, $0.4 million and $0.3 million for the years ended December 31, 2010, 2009 and 2008, respectively.
On June 29, 2010 the Company purchased the land and building facility in Joliette, Province of Quebec in Canada that was previously being leased.
The Company has future minimum lease payments for operating leases having initial or remaining non-cancelable lease terms as follows:
| |
Payments due by period | |||||||||||||||
|---|---|---|---|---|---|---|---|---|---|---|---|---|---|---|---|---|
| |
Total | Less than 1 year | 1 - 3 years | 3 - 5 years | More than 5 years | |||||||||||
Operating leases |
272,711 | 183,572 | 81,249 | 7,890 | — | |||||||||||
- f.
- Self-Insurance
The Company is self-insured up to certain stop loss limits for group health insurance. Accruals for claims incurred but not paid as of December 31, 2010 and 2009 are included in accrued group health insurance claims in the accompanying consolidated balance sheets. The Company's policy is to accrue the employee health benefit accruals based on historical information along with certain assumptions about future events.
- g.
- Litigation
The Company is currently a defendant in an asbestos case entitled Manuel H. Chinea and Janet M. Chinea v. American Optical Company, Ballantyne Strong, Inc. a/k/a Ballantyne of Omaha, Inc. et al, filed August 17, 2010 in the Superior Court of the State of New York. The Company is one of twenty-five defendants. The Plaintiffs have agreed to dismiss the Company. The dismissal will be final assuming no defendant objects.
During December 2009, the Company settled an asbestos case entitled Larry C. Stehman and Leila Stehman v. Asbestos Corporation, Limited and Ballantyne of Omaha, Inc. individually and as successor in interest to Strong International, Strong Electric Corporation and Century Projector Corporation, et al, in the Superior Court of the State of California, County of San Francisco. The settlement, including legal fees resulted in charges of $0.4 million during the year ended December 31, 2009.
66
Ballantyne Strong, Inc. and Subsidiaries
Notes to the Consolidated Financial Statements (Continued)
Years ended December 31, 2010, 2009 and 2008
23. Business Segment Information
The presentation of segment information reflects the manner in which management organizes segments for making operating decisions and assessing performance.
As of December 31, 2010, the Company's operations were conducted principally through two business segments: Theatre and Lighting. Theatre operations include the design, manufacture, assembly, sale and service of motion picture projectors, xenon lamphouses and power supplies. Theatre operations also include the sale and service of digital projection equipment and accessories, sound systems, xenon lamps and lenses. The lighting segment operations include the design, manufacture, assembly and sale of follow spotlights, stationary searchlights and computer operated lighting systems for the motion picture production, television, live entertainment, theme parks and architectural industries. The Company allocates resources to business segments and evaluates the performance of these segments based upon reported segment operating profit. The Company previously evaluated the performance of the segments based on reported segment gross profit. Prior year amounts have been reclassified to conform to the 2010 presentation. All significant intercompany sales are eliminated in consolidation.
67
Ballantyne Strong, Inc. and Subsidiaries
Notes to the Consolidated Financial Statements (Continued)
Years ended December 31, 2010, 2009 and 2008
Summary by Business Segments
| |
2010 | 2009 | 2008 | ||||||||||
|---|---|---|---|---|---|---|---|---|---|---|---|---|---|
Net revenue |
|||||||||||||
Theatre |
|||||||||||||
Products |
$ | 125,043,983 | $ | 65,186,543 | $ | 47,158,724 | |||||||
Services |
7,881,593 | 3,810,626 | 3,186,650 | ||||||||||
Total theatre |
132,925,576 | 68,997,169 | 50,345,374 | ||||||||||
Lighting |
3,409,041 | 3,121,840 | 4,260,868 | ||||||||||
Other |
— | 26,748 | 208,319 | ||||||||||
Total revenue |
$ | 136,334,617 | $ | 72,145,757 | $ | 54,814,561 | |||||||
Operating income (loss) |
|||||||||||||
Theatre |
|||||||||||||
Products |
$ | 17,187,174 | $ | 9,993,972 | $ | 3,232,948 | |||||||
Services |
611,632 | (451,392 | ) | (1,907,083 | ) | ||||||||
Total theatre |
17,798,806 | 9,542,580 | 1,325,865 | ||||||||||
Lighting |
39,694 | 69,702 | 189,714 | ||||||||||
Other |
— | 13,100 | 89,651 | ||||||||||
Total segment operating income |
17,838,500 | 9,625,382 | 1,605,230 | ||||||||||
Unallocated general and administrative expenses |
(5,990,962 | ) | (5,955,229 | ) | (5,941,139 | ) | |||||||
Gain on disposal or transfer of assets |
150,657 | (16,911 | ) | 275,406 | |||||||||
Interest, net |
(25,017 | ) | 53,887 | 478,553 | |||||||||
Equity in loss of joint venture |
581,495 | (889,997 | ) | (683,311 | ) | ||||||||
Other income (loss) |
(163,224 | ) | (67,156 | ) | 320,530 | ||||||||
Income (loss) before income taxes |
$ | 12,391,449 | $ | 2,749,976 | $ | (3,944,731 | ) | ||||||
Expenditures on capital equipment |
|||||||||||||
Theatre |
|||||||||||||
Products |
$ | 6,193,349 | $ | 844,121 | $ | 511,568 | |||||||
Services |
604,956 | 59,698 | 282,911 | ||||||||||
Total theatre |
6,798,305 | 903,819 | 794,479 | ||||||||||
Lighting |
13,362 | 3,840 | 24,147 | ||||||||||
Total |
$ | 6,811,667 | $ | 907,659 | $ | 818,626 | |||||||
Depreciation, amortization and impairment |
|||||||||||||
Theatre |
|||||||||||||
Products |
$ | 1,249,384 | $ | 1,471,600 | $ | 4,312,839 | |||||||
Services |
207,595 | 242,618 | 265,818 | ||||||||||
Total theatre |
1,456,979 | 1,714,218 | 4,578,657 | ||||||||||
Lighting |
33,267 | 38,332 | 74,587 | ||||||||||
Total |
$ | 1,490,246 | $ | 1,752,550 | $ | 4,653,244 | |||||||
68
Ballantyne Strong, Inc. and Subsidiaries
Notes to the Consolidated Financial Statements (Continued)
Years ended December 31, 2010, 2009 and 2008
| |
2010 | 2009 | 2008 | ||||||||||
|---|---|---|---|---|---|---|---|---|---|---|---|---|---|
Gain (loss) on disposal of long-lived assets |
|||||||||||||
Theatre |
|||||||||||||
Products |
$ | 138,266 | $ | (16,911 | ) | $ | 15,285 | ||||||
Services |
12,391 | — | — | ||||||||||
Total theatre |
150,657 | (16,911 | ) | 15,285 | |||||||||
Lighting |
— | — | 1,951 | ||||||||||
Other |
— | — | 258,170 | ||||||||||
Total |
$ | 150,657 | $ | (16,911 | ) | $ | 275,406 | ||||||
| |
December 31, 2010 |
December 31, 2009 |
|
||||||||||
|---|---|---|---|---|---|---|---|---|---|---|---|---|---|
Identifiable assets |
|||||||||||||
Theatre |
|||||||||||||
Products |
$ | 86,156,070 | $ | 55,720,203 | |||||||||
Services |
3,358,154 | 1,225,122 | |||||||||||
Total theatre |
89,514,224 | 56,945,325 | |||||||||||
Lighting |
2,517,207 | 3,264,975 | |||||||||||
Total |
$ | 92,031,431 | $ | 60,210,300 | |||||||||
Summary by Geographical Area
| |
2010 | 2009 | 2008 | |||||||||
|---|---|---|---|---|---|---|---|---|---|---|---|---|
Net revenue |
||||||||||||
United States |
$ | 76,209,618 | $ | 38,963,004 | $ | 36,587,451 | ||||||
Canada |
4,447,992 | 4,285,478 | 1,694,384 | |||||||||
China |
34,914,017 | 11,531,934 | 5,648,450 | |||||||||
Asia (excluding China) |
1,677,650 | 1,404,476 | 2,028,579 | |||||||||
Mexico |
5,721,885 | 8,323,095 | 3,938,821 | |||||||||
South America |
10,073,442 | 4,444,458 | 1,906,745 | |||||||||
Europe |
2,787,309 | 2,646,155 | 1,620,346 | |||||||||
Other |
502,704 | 547,157 | 1,389,785 | |||||||||
Total |
$ | 136,334,617 | $ | 72,145,757 | $ | 54,814,561 | ||||||
| |
December 31, 2010 | December 31, 2009 | |||||||
|---|---|---|---|---|---|---|---|---|---|
Identifiable assets |
|||||||||
United States |
$ | 59,972,216 | $ | 43,982,105 | |||||
China |
11,908,572 | 4,030,131 | |||||||
Asia (excluding China) |
5,781,015 | 4,029,054 | |||||||
Canada |
14,369,628 | 8,169,010 | |||||||
Total |
$ | 92,031,431 | $ | 60,210,300 | |||||
Net revenues by business segment are to unaffiliated customers. Identifiable assets by geographical area are based on location of facilities. Net sales by geographical area are based on destination of sales.
69
Ballantyne Strong, Inc. and Subsidiaries
Notes to the Consolidated Financial Statements (Continued)
Years ended December 31, 2010, 2009 and 2008
24. Quarterly Financial Data (Unaudited)
The following is a summary of the unaudited quarterly results of operations for 2010 and 2009.
| |
First Quarter | Second Quarter | Third Quarter | Fourth Quarter | ||||||||||
|---|---|---|---|---|---|---|---|---|---|---|---|---|---|---|
2010: |
||||||||||||||
Net revenue |
$ | 25,337,509 | $ | 32,748,573 | $ | 32,929,645 | $ | 45,318,890 | ||||||
Gross profit |
4,295,536 | 5,970,945 | 6,468,301 | 8,003,807 | ||||||||||
Net earnings |
998,850 | 2,778,109 | 2,320,721 | 2,335,773 | ||||||||||
Basic and diluted earnings per share: |
||||||||||||||
Basic(2) |
0.07 | 0.20 | 0.16 | 0.16 | ||||||||||
Diluted(2) |
0.07 | 0.19 | 0.16 | 0.16 | ||||||||||
Stock price: |
||||||||||||||
High |
5.89 | 9.00 | 9.66 | 9.74 | ||||||||||
Low |
3.1 | 5.45 | 6.91 | 6.48 | ||||||||||
2009: |
||||||||||||||
Net revenue |
$ | 17,143,453 | $ | 19,602,707 | $ | 16,552,036 | $ | 18,847,561 | ||||||
Gross profit |
3,379,070 | 4,252,593 | 3,555,283 | 3,545,087 | ||||||||||
Net earnings(1) |
541,719 | 933,921 | 543,096 | 51,782 | ||||||||||
Basic and diluted earnings per share: |
||||||||||||||
Basic(2) |
0.04 | 0.07 | 0.04 | 0.00 | ||||||||||
Diluted(2) |
0.04 | 0.07 | 0.04 | 0.00 | ||||||||||
Stock price: |
||||||||||||||
High |
2.42 | 3.27 | 3.88 | 3.98 | ||||||||||
Low |
0.88 | 1.80 | 2.02 | 3.08 | ||||||||||
- (1)
- During
the fourth quarter of 2009, the Company settled a lawsuit resulting in a charge of approximately $0.3 million during the quarter.
- (2)
- Earnings per share is computed independently for each of the quarters. Therefore, the sum of the quarterly earnings (loss) per share may not equal the total for the year.
70
Schedule II
Ballantyne Strong, Inc.
and Subsidiaries
Valuation and Qualifying Accounts
| |
Balance at beginning of year |
Charged to costs and expenses |
Amounts Written off(1) |
Balance at end of year |
||||||||||
|---|---|---|---|---|---|---|---|---|---|---|---|---|---|---|
Allowance for doubtful accounts and notes |
||||||||||||||
Year ended December 31, 2010— |
||||||||||||||
Allowance for doubtful accounts |
$ | 205,314 | 135,428 | (34,609 | ) | 306,133 | ||||||||
Year ended December 31, 2009— |
||||||||||||||
Allowance for doubtful accounts |
$ | 195,141 | 32,358 | (22,185 | ) | 205,314 | ||||||||
Year ended December 31, 2008— |
||||||||||||||
Allowance for doubtful accounts |
$ | 534,526 | 44,602 | (383,987 | ) | 195,141 | ||||||||
Inventory reserves |
||||||||||||||
Year ended December 31, 2010— |
||||||||||||||
Inventory reserves |
$ | 2,665,436 | 448,770 | (193,041 | ) | 2,921,165 | ||||||||
Year ended December 31, 2009— |
||||||||||||||
Inventory reserves |
$ | 2,791,644 | 523,015 | (649,223 | ) | 2,665,436 | ||||||||
Year ended December 31, 2008— |
||||||||||||||
Inventory reserves |
$ | 1,901,038 | 1,246,867 | (356,261 | ) | 2,791,644 | ||||||||
- (1)
- The deductions from reserves are net of recoveries.
71
Item 9. Changes in and Disagreements with Accountants on Accounting and Financial Disclosure
None
Item 9A. Controls and Procedures
1. Evaluation of Disclosure Controls and Procedures
As of the end of the period covered by this report, the Company carried out an evaluation, under the supervision and with the participation of the Company's management, including the Company's Chief Executive Officer and Chief Financial Officer, of the effectiveness of the design and operation of the Company's disclosure controls and procedures, as defined in Exchange Act Rules 13a-15 (e) and 15d-15(e) and internal control over financial reporting, as defined in Exchange Act Rules 13a-15(f) and 15d-15(f). Based upon that evaluation, the Company's Chief Executive Officer and Chief Financial Officer concluded that the Company's disclosure controls and procedures are effective.
2. Internal Control over Financial Reporting
(a) Management's Report on Internal Control over Financial Reporting
The Company's management is responsible for establishing and maintaining adequate internal control over financial reporting as such term is defined in Securities Exchange Act Rule 13a-15(f). The Company carried out an evaluation under the supervision and with the participation of the Company's management, including the Company's Chief Executive Officer and Chief Financial Officer, of the effectiveness of the Company's internal control over financial reporting. The Company's management used the framework in Internal Control-Integrated Framework issued by the Committee of Sponsoring Organizations (COSO) to perform this evaluation. Based on that evaluation, the Company's management concluded that the Company's internal control over financial reporting was effective as of December 31, 2010.
The effectiveness of the Company's internal control over financial reporting as of December 31, 2010 has been audited by KPMG LLP, an independent registered public accounting firm, as stated in their report, a copy of which is included in this Annual Report on Form 10-K.
72
(b) Report of Independent Registered Public Accounting Firm
Report of Independent Registered Public Accounting Firm
The
Board of Directors and Stockholders
Ballantyne Strong, Inc.:
We have audited the internal control over financial reporting of Ballantyne Strong, Inc. and subsidiaries (the Company) as of December 31, 2010, based on criteria established in Internal Control—Integrated Framework issued by the Committee of Sponsoring Organizations of the Treadway Commission (COSO). The Company's management is responsible for maintaining effective internal control over financial reporting and for its assessment of the effectiveness of internal control over financial reporting, included in the accompanying Management's Report on Internal Control over Financial Reporting. Our responsibility is to express an opinion on the Company's internal control over financial reporting based on our audit.
We conducted our audit in accordance with the standards of the Public Company Accounting Oversight Board (United States). Those standards require that we plan and perform the audit to obtain reasonable assurance about whether effective internal control over financial reporting was maintained in all material respects. Our audit included obtaining an understanding of internal control over financial reporting, assessing the risk that a material weakness exists, and testing and evaluating the design and operating effectiveness of internal control based on the assessed risk. Our audit also included performing such other procedures as we considered necessary in the circumstances. We believe that our audit provides a reasonable basis for our opinion.
A company's internal control over financial reporting is a process designed to provide reasonable assurance regarding the reliability of financial reporting and the preparation of financial statements for external purposes in accordance with generally accepted accounting principles. A company's internal control over financial reporting includes those policies and procedures that (1) pertain to the maintenance of records that, in reasonable detail, accurately and fairly reflect the transactions and dispositions of the assets of the company; (2) provide reasonable assurance that transactions are recorded as necessary to permit preparation of financial statements in accordance with generally accepted accounting principles, and that receipts and expenditures of the company are being made only in accordance with authorizations of management and directors of the company; and (3) provide reasonable assurance regarding prevention or timely detection of unauthorized acquisition, use, or disposition of the company's assets that could have a material effect on the financial statements.
Because of its inherent limitations, internal control over financial reporting may not prevent or detect misstatements. Also, projections of any evaluation of effectiveness to future periods are subject to the risk that controls may become inadequate because of changes in conditions, or that the degree of compliance with the policies or procedures may deteriorate.
In our opinion, the Company maintained, in all material respects, effective internal control over financial reporting as of December 31, 2010, based on criteria established in Internal Control—Integrated Framework issued by the Committee of Sponsoring Organizations of the Treadway Commission.
We also have audited, in accordance with the standards of the Public Company Accounting Oversight Board (United States), the consolidated balance sheets of Ballantyne Strong, Inc. and subsidiaries as of December 31, 2010 and 2009, and the related consolidated statements of operations, stockholders' equity and comprehensive income (loss) , and cash flows for each of the years in the three-year period ended December 31, 2010, and the related financial statement schedule and our report dated March 16, 2011 expressed an unqualified opinion on those consolidated financial statements and related financial statement schedule.
| /s/ KPMG LLP |
Omaha,
Nebraska
March 16, 2011
73
Changes in Internal Control over Financial Reporting
Management, under the supervision and with the participation of our Chief Executive Officer and Chief Financial Officer, concluded that no changes in our internal control over financial reporting occurred during the quarter ended December 31, 2009 that have materially affected, or are reasonably likely to materially affect, our internal control over financial reporting.
None
Item 10. Directors, Executive Officers and Corporate Governance
Incorporated by reference to the Ballantyne Strong, Inc. Proxy Statement for the Annual Meeting of Stockholders to be held May 4, 2011.
Item 11. Executive Compensation
Incorporated by reference to the Ballantyne Strong, Inc. Proxy Statement for the Annual Meeting of Stockholders to be held May 4, 2011.
Item 12. Security Ownership of Certain Beneficial Owners and Management and Related Stockholder Matters
Incorporated by reference to the Ballantyne Strong, Inc. Proxy Statement for the Annual Meeting of Stockholders to be held May 4, 2011.
Item 13. Certain Relationships and Related Transactions, and Director Independence
Incorporated by reference to the Ballantyne Strong, Inc. Proxy Statement for the Annual Meeting of Stockholders to be held May 4, 2011.
Item 14. Principal Accounting Fees and Services
Incorporated by reference to the Ballantyne Strong, Inc. Proxy Statement for the Annual Meeting of Stockholders to be held May 4, 2011.
Item 15. Exhibits, Financial Statement Schedules
- a.
- The
following documents are filed as part of this report on Form 10-K:
- 1.
- Consolidated
Financial Statements:
An Index to the Consolidated Financial Statements is filed as a part of Item 8.
- 2.
- Financial
Statement Schedules:
Schedule II—Valuation and Qualifying Accounts for each of the three years ended December 31, 2010, 2009 and 2008.
Financial Statements of the Registrant's subsidiaries are omitted because the Registrant is primarily an operating company and the subsidiaries are wholly owned.
- 3.
- Exhibit
list.
- b.
- Filed as Financial Statement Schedules beginning on page 76, are the separate Financial Statements of Digital Link II, a fifty percent or less owned entity of the Registrant.
74
Pursuant to the requirements of Section 13 or 15(d) of the Securities Exchange Act of 1934, the registrant has duly caused this report to be signed on its behalf by the undersigned, thereunto duly authorized.
| BALLANTYNE STRONG, INC. | ||||||
By: |
/s/ GARY L. CAVEY |
By: |
/s/ KEVIN S. HERRMANN |
|||
| Gary L. Cavey, President, Chief Executive Officer and Director |
Kevin S. Herrmann, Secretary/Treasurer and Chief Financial Officer |
|||||
Date: June 23, 2011 |
Date: June 23, 2011 |
|||||
Pursuant to the requirements of the Securities Exchange Act of 1934, this report has been signed below by the following persons on behalf of the Registrant and in the capacities and on the dates indicated.
By: |
/s/ WILLIAM F. WELSH, II (1) William F. Welsh, II, Chairman |
|||
Date: |
June 23, 2011 |
|||
By: |
/s/ ALVIN ABRAMSON (1) Alvin Abramson, Director |
|||
Date: |
June 23, 2011 |
|||
By: |
Donde Plowman, Director |
|||
Date: |
||||
By: |
/s/ MARC E. LEBARON (1) Marc E. LeBaron, Director |
|||
Date: |
June 23, 2011 |
|||
By: |
/s/ MARK D. HASEBROOCK (1) Mark D. Hasebroock, Director |
|||
Date: |
June 23, 2011 |
|||
By: |
Samuel L. Freitag, Director |
|||
Date: |
||||
(1) By: |
/s/ KEVIN S. HERRMANN Kevin S. Herrmann, Attorney-In-Fact |
|||
Date: |
June 23, 2011 |
75
YEARS ENDED MARCH 25, 2011 (Unaudited), MARCH 26, 2010 AND MARCH 27, 2009
76
DIGITAL LINK II, LLC
TABLE OF CONTENTS
77
Report of Independent Registered Public Accounting Firm
To
the Members of
Digital Link II, LLC
We have audited the accompanying balance sheet of Digital Link II, LLC, a California limited liability company, as of March 26, 2010, and the related statements of operations and cash flows for each of the two years in the period ended March 26, 2010. These financial statements are the responsibility of the Company's management. Our responsibility is to express an opinion on these financial statements based on our audits.
We conducted our audits in accordance with the standards of the Public Company Accounting Oversight Board (United States). Those standards require that we plan and perform the audit to obtain reasonable assurance about whether the financial statements are free of material misstatement. We were not engaged to perform an audit of the Company's internal control over financial reporting. Our audits included consideration of internal control over financial reporting as a basis for designing audit procedures that are appropriate in the circumstances, but not for the purpose of expressing an opinion on the effectiveness of the Company's internal control over financial reporting. Accordingly, we express no such opinion. An audit also includes examining, on a test basis, evidence supporting the amounts and disclosures in the financial statements, assessing the accounting principles used and significant estimates made by management, and evaluating the overall financial statement presentation. We believe that our audits provide a reasonable basis for our opinion.
In our opinion, the financial statements referred to above present fairly, in all material respects, the financial position of Digital Link II, LLC at March 26, 2010, and the results of its operations and its cash flows for each of the two years in the period ended March 26, 2010, in conformity with U.S. generally accepted accounting principles.
/s/ ERNST & YOUNG LLP
Los
Angeles, California
June 24, 2010
78
Digital Link II, LLC
Balance Sheet
(in 000's)
| |
March 25, 2011 | March 26, 2010 | |||||||
|---|---|---|---|---|---|---|---|---|---|
| |
(Unaudited) |
|
|||||||
Assets |
|||||||||
Current assets: |
|||||||||
Cash and cash equivalents |
$ | 2,365 | $ | 784 | |||||
Accounts receivable |
328 | 438 | |||||||
Total current assets |
2,693 | 1,222 | |||||||
Digital equipment |
9,142 |
15,847 |
|||||||
Total assets |
$ | 11,835 | $ | 17,069 | |||||
Liabilities and Members' Equity |
|||||||||
Current liabilities: |
|||||||||
Accounts payable |
$ | 6 | $ | 2 | |||||
Current portion of long-term debt |
2,173 | 3,673 | |||||||
Deferred revenue |
3 | 4 | |||||||
Accrued property taxes |
522 | 531 | |||||||
Due to related parties |
1,295 | 1,761 | |||||||
Other accrued expenses |
141 | 51 | |||||||
Total current liabilities |
4,140 | 6,022 | |||||||
Virtual print fees |
880 |
2,751 |
|||||||
Customer deposits |
2,780 | 1,581 | |||||||
Deferred revenue, net of current portion |
33 | 37 | |||||||
Long-term debt, net of current portion |
19 | 1,867 | |||||||
Total liabilities |
7,852 | 12,258 | |||||||
Members' equity |
3,983 |
4,811 |
|||||||
Total liabilities and members' equity |
$ |
11,835 |
$ |
17,069 |
|||||
See accompanying notes to the financial statements.
79
Digital Link II, LLC
Statements of Operations
(in 000's)
| |
Year Ended March 25, 2011 |
Year Ended March 26, 2010 |
Year Ended March 27, 2009 |
|||||||||
|---|---|---|---|---|---|---|---|---|---|---|---|---|
| |
(Unaudited) |
|
|
|||||||||
Digital equipment revenues |
$ | 9,299 | $ | 1,019 | $ | — | ||||||
Installation revenues |
4 | 4 | 3 | |||||||||
Total revenues |
9,303 | 1,023 | 3 | |||||||||
Cost of revenues |
7,576 |
2,450 |
1,154 |
|||||||||
Gross profit (loss) |
1,727 | (1,427 | ) | (1,151 | ) | |||||||
Operating expenses |
||||||||||||
Selling and marketing expenses |
21 | 94 | 107 | |||||||||
Administrative expenses |
196 | 209 | 260 | |||||||||
Income (loss) from operations |
1,510 | (1,730 | ) | (1,518 | ) | |||||||
Interest expense, net |
(300 |
) |
(288 |
) |
(98 |
) |
||||||
Income (loss) before income taxes |
1,210 | (2,018 | ) | (1,616 | ) | |||||||
Income tax expense |
38 |
2 |
1 |
|||||||||
Net income (loss) |
$ | 1,172 | $ | (2,020 | ) | $ | (1,617 | ) | ||||
See accompanying notes to the financial statements
80
Digital Link II, LLC
Statements of Cash Flows
(in 000's)
| |
Year ended March 25, 2011 |
Year ended March 26, 2010 |
Year ended March 27, 2009 |
||||||||||
|---|---|---|---|---|---|---|---|---|---|---|---|---|---|
| |
(Unaudited) |
|
|
||||||||||
Cash flows from operating activities: |
|||||||||||||
Net income (loss) |
$ | 1,172 | $ | (2,020 | ) | $ | (1,617 | ) | |||||
Adjustments to reconcile net income (loss) to net provided by operating activities: |
|||||||||||||
Depreciation of digital equipment |
1,123 | 1,579 | 1,154 | ||||||||||
Interest on long-term debt |
— | 33 | 30 | ||||||||||
Non-cash effect of digital equipment sold |
6,424 | 845 | — | ||||||||||
Changes in assets and liabilities: |
|||||||||||||
Accounts receivable |
110 | 1,129 | (1,308 | ) | |||||||||
Accounts payable |
4 | 2 | (12 | ) | |||||||||
Accrued property tax |
(9 | ) | 162 | 248 | |||||||||
Due to related parties |
(466 | ) | 113 | 1,616 | |||||||||
Other accrued expenses |
90 | 51 | — | ||||||||||
Deferred revenue |
(5 | ) | — | 9 | |||||||||
Customer deposits |
1,199 | 165 | 1,415 | ||||||||||
Virtual print fees |
(1,871 | ) | 773 | 1,778 | |||||||||
Net cash provided by operating activities |
7,771 | 2,832 | 3,313 | ||||||||||
Cash flows from investing activities: |
|||||||||||||
Purchases of digital equipment |
(842 | ) | (4,623 | ) | (5,949 | ) | |||||||
Net cash used in investing activities |
(842 | ) | (4,623 | ) | (5,949 | ) | |||||||
Cash flows from financing activities: |
|||||||||||||
Payments on long-term debt |
(4,014 | ) | (1,835 | ) | (481 | ) | |||||||
Proceeds from the issuance of long-term debt |
666 | 3,951 | 3,493 | ||||||||||
Proceeds from member contributions |
— | — | 15 | ||||||||||
Distribution to members |
(2,000 | ) | — | — | |||||||||
Net cash provided by (used in) financing activities |
(5,348 | ) | 2,116 | 3,027 | |||||||||
Net increase in cash and cash equivalents |
1,581 | 325 | 391 | ||||||||||
Cash and cash equivalents at beginning of year |
784 | 459 | 68 | ||||||||||
Cash and cash equivalents at end of year |
$ | 2,365 | $ | 784 | $ | 459 | |||||||
See accompanying notes to the financial statements.
81
Digital Link II, LLC
Notes to the Financial Statements
Years ended March 25, 2011 (Unaudited), March 26, 2010 and March 27, 2009
(in 000's)
1. Nature of Operations
Company
On March 6, 2007, Digital Link II, LLC (the "Company") was formed between Ballantyne Strong, Inc. and RealD with member interests of 44.4% and 55.6%, respectively. The Company was formed for purposes of commercializing certain 3D technology and to fund the deployment of digital projector systems and servers to third-party exhibitors.
Fiscal Period
The Company's fiscal year consists of four 13-week periods for a total of 52 weeks to align its year end with that of RealD, the majority interest holder in the Company. As a result, the Company's year-end for the fiscal years ended 2011, 2010, and 2009 were March 25, 2011, March 26, 2010 and March 27, 2009, respectively.
2. Summary of Significant Accounting Policies
Use of Estimates
The preparation of financial statements in conformity with U.S. GAAP requires management to make estimates and assumptions that affect the reported amounts of assets and liabilities and disclosure of contingent assets and liabilities at the date of the financial statements and the reported amounts of revenues and expenses during the reporting period. Actual results and changes in facts and circumstances may alter such estimates and affect results of operations and financial position in future periods.
Cash and Cash Equivalents
All highly liquid financial instruments with maturities of three months or less from date of purchase are classified as cash equivalents in the accompanying balance sheets and statements of cash flows.
Trade Accounts Receivable
Trade accounts receivable are recorded at the invoiced amount and do not bear interest. The Company continually monitors the trade accounts receivable to determine if an allowance for doubtful accounts is necessary. This allowance is developed based on several factors including overall customer credit quality, historical write-off experience and a specific analysis that projects the ultimate collectibility of the account. As such, these factors may change over time causing the reserve level to adjust accordingly. No allowance for doubtful accounts exists at March 25, 2011 or March 26, 2010.
Digital Equipment
Digital equipment also includes digital servers, lenses and accessories and are stated at cost. Depreciation is computed using the straight-line method over the estimated useful life of 10 years. Upon installation at the customer location, the Company retains title to the digital equipment which is held and used by customers. The digital equipment is held for sale at either a specified date or upon occurrence of certain contingent events. As of March 25, 2011, digital equipment scheduled to be purchased within the next twelve months had a carrying value of $3.8 million (unaudited). Depreciation is included in cost of revenue.
82
Digital Link II, LLC
Notes to the Financial Statements (Continued)
Years ended March 25, 2011 (Unaudited), March 26, 2010 and March 27, 2009
(in 000's)
Revenue Recognition
The Company has entered into various system use agreements with third-party exhibitors which provide for the use of digital projection equipment with a purchase option in the future. In accordance with the requirements of Accounting Standards Codification (ASC) subtopic 605-10, Revenue Recognition-General, the Company recognizes revenue when title has transferred to the exhibitor and collectibility is reasonably assured if the option to purchase is made by the exhibitor. Revenues recognized by the Company under the system use agreements consist of installation fees received from these exhibitors. The Company recognizes these revenues over the terms of the use agreements.
Repairs and Maintenance
Repair and maintenance costs are expensed as incurred.
Fair Value of Financial Instruments
The Company's financial assets and liabilities are measured and reported in accordance with Accounting Standards Codification Topic (ASC) 820-10, Fair Value Accounting (ASC 820), which provides a common definition of fair value and establishes a framework to make the measurement of fair value in U.S. GAAP more consistent and comparable. This guidance also requires expanded disclosures to provide information about the extent to which fair value is used to measure assets and liabilities, the methods and assumptions used to measure fair value, and the effect of fair value measures on earnings. Fair value is defined as the amount that would be received for selling an asset or paid to transfer a liability in an orderly transaction between market participants and requires that assets and liabilities carried at fair value be classified and disclosed in the following three categories:
- •
- Level 1—Quoted prices for identical instruments in active markets.
- •
- Level 2—Quoted prices for similar instruments in active markets; quoted prices for identical or similar
instruments in markets that are not active; and model-derived valuations in which all significant inputs and significant value drivers are observable in active markets.
- •
- Level 3—Valuations derived from valuation techniques in which one or more significant inputs or significant value drivers are unobservable.
The Company's financial assets and liabilities, which include financial instruments as defined by ASC 820, include cash and cash equivalents, accounts receivable, accounts payable and long-term debt. The carrying amounts of cash and cash equivalents, accounts receivable and accounts payable are a reasonable approximation of fair value due to the short maturities of these instruments. The carrying amount of long-term debt approximates fair value based on borrowing rates currently available to the Company.
Impairment of Long-Lived Assets
The Company reviews long-lived assets for impairment whenever events or changes in circumstances indicate that the carrying amount of an asset may not be recoverable. Factors or circumstances that could indicate the occurrence of such events include current period operating or cash flow losses combined with a history of operating or cash flow losses, a projection or forecast that demonstrates continuing operating or cash flow losses, or incurring costs in excess of amounts originally expected to acquire or construct an asset. If the asset is not recoverable, an impairment loss is recognized as the amount by which the carrying amount of the asset exceeds its fair value. The
83
Digital Link II, LLC
Notes to the Financial Statements (Continued)
Years ended March 25, 2011 (Unaudited), March 26, 2010 and March 27, 2009
(in 000's)
Company's most significant long-lived assets subject to these periodic assessments of recoverability are digital equipment, which have a net book value of $9,142 (unaudited) and $15,847 at March 25, 2011 and March 26, 2010, respectively. As of March 25, 2011 and March 26, 2010 the Company concluded that no impairments related to long-lived assets exist.
Income Taxes
The Company is treated as a limited liability company for federal and state income tax purposes. Under this treatment, state and federal income taxes are the responsibility of the Company's members. The Company is also subject to minimum and capital tax requirements in certain states.
Reclassifications
Certain prior year amounts in the accompanying consolidated financial statements have been reclassified to conform to the current year presentation.
Recent Accounting Pronouncements
In January 2010, Accounting Standards Update 2010-6, Fair Value Measurements and Disclosures: Improving Disclosures About Fair Value Measurements (ASU 2010-6) was issued which requires entities to make new disclosures about recurring or nonrecurring fair value measurements including significant transfers into and out of Level 1 and Level 2 fair value measurements and information on purchases, sales, issuances and settlements on a gross basis in the reconciliation of Level 3 fair value measurements. The Company adopted ASU 2010-6 beginning in the first quarter of fiscal 2010, except for level 3 reconciliation disclosures which are effective for the Company beginning in the first quarter of fiscal 2011. The adoption of disclosure requirements for fair value measurements did not affect the disclosures because the Company did not transfer financial assets or liabilities between levels in the fair value hierarchy.
In October 2009, ASU No. 2009-13, Revenue Recognition (Topic 605)-Multiple—Deliverable Revenue Arrangements-a consensus of the Emerging Issues Task Force (ASU 2009-13) amends Accounting Standards Codification Subtopic 605-25, Revenue Recognition-Multiple-Element Arrangements (ASC 605-25). The amendments in ASU 2009-13 enable vendors to account for products or services separately rather than as a combined unit upon meeting certain criteria and establish a hierarchy for determining the selling price of a deliverable. In addition, a vendor can determine a best estimate of the selling price, in a manner that is consistent with that used to determine the price to sell the deliverable on a standalone basis, if a vendor does not have vendor specific objective evidence or third-party evidence of selling price. ASC 605-25 is also amended to eliminate the use of the residual method and requires a vendor to allocate revenue using the relative selling price method. The amendments in ASU 2009-13 will be effective prospectively, with an option for retrospective restatement of the financial statements, for revenue arrangements entered into or materially modified in fiscal years beginning on or after June 15, 2010 with early adoption permitted at the beginning of an entity's fiscal year. The Company expects to prospectively adopt the amendments in ASU 2009-13 beginning in the first quarter of fiscal 2012. The company is currently evaluating the impact the adoption of the new guidance will have on its consolidated financial statements.
84
Digital Link II, LLC
Notes to the Financial Statements (Continued)
Years ended March 25, 2011 (Unaudited), March 26, 2010 and March 27, 2009
(in 000's)
3. Accounts Receivable
Accounts receivable consist of the following:
| |
March 25, 2011 |
March 26, 2010 |
|||||
|---|---|---|---|---|---|---|---|
| |
(Unaudited) |
|
|||||
Trade accounts receivable |
$ | 180 | $ | 307 | |||
Accounts receivable from Digital Link I, LLC |
148 | 131 | |||||
|
$ | 328 | $ | 438 | |||
Accounts receivable from RealD and Digital Link I, LLC, a wholly-owned subsidiary of RealD, consist of virtual print fees collected from third-party studios by RealD on the Company's behalf.
4. Digital Equipment
Digital equipment includes the following:
| |
March 25, 2011 |
March 26, 2010 |
||||||
|---|---|---|---|---|---|---|---|---|
| |
(Unaudited) |
|
||||||
Digital equipment |
$ | 11,075 | $ | 19,224 | ||||
Less accumulated depreciation |
(1,933 | ) | (3,377 | ) | ||||
Net digital equipment |
$ | 9,142 | $ | 15,847 | ||||
Depreciation expense amounted to approximately $1,123 (unaudited) and $1,579 for the twelve months ended March 25, 2011 and March 26, 2010, respectively.
5. Virtual Print Fees
The Company has entered into customer use agreements with third-party film exhibitors which provide for the use of digital equipment with a purchase option in the future. Under the terms of the agreement, the studios have agreed to pay the Company a Virtual Print Fee for every print shown on the projection equipment. If the option to purchase is made by the exhibitor, the overall purchase price to the exhibitor will be reduced by the Virtual Print Fees paid by the studios and collected by the Company. Therefore, the Virtual Print Fees collected are recorded as a non-current liability within the Balance Sheet.
6. Customer Deposits
The Company has entered into customer use agreements with third-party film exhibitors which provide for the use of digital theatre projection equipment with a purchase option in the future. Certain operating lease agreements entered into by the Company required the third-party exhibitors to make a deposit on the digital projection equipment provided for use. The customer deposits collected are recorded as a non-current liability within the Balance Sheet.
85
Digital Link II, LLC
Notes to the Financial Statements (Continued)
Years ended March 25, 2011 (Unaudited), March 26, 2010 and March 27, 2009
(in 000's)
7. Debt
The Company has entered into various loan financing agreements with NEC Financial Corporation to fund the purchase of digital projection equipment. Pursuant to the terms of the agreement, the loans are to be repaid over periods ranging from 22 to 36 months and bear interest rates ranging from 7.0% to 7.46% per annum. Equal payments of principal and interest are due on a monthly basis. The loans are guaranteed by Ballantyne Strong, Inc. and RealD in proportion to each member's respective ownership interests. The loans are secured by a security interest on the digital equipment. At March 25, 2011, the loan agreements with NEC Financial Corporation had a balance of $2,192 (unaudited). The final loan agreement payment is due on June 1, 2012.
Total remaining payments due and outstanding in aggregate by fiscal year are as follows (unaudited): 2012—$2,173; 2013—$19.
8. Members' Equity
All contributions are to be made in proportion to the members' respective ownership interests. For financial reporting and income tax purposes, all items of income and loss are allocated to the members in accordance with their respective ownership interests.
The following table summarizes the changes in members' equity for the 3-year period:
| |
Ballantyne Strong, Inc. |
RealD | Total | |||||||
|---|---|---|---|---|---|---|---|---|---|---|
Members' equity at March 31, 2008 |
$ | 3,745 | $ | 4,689 | $ | 8,434 | ||||
Capital contributions |
5 | 9 | 14 | |||||||
Net loss |
(718 | ) | (899 | ) | (1,617 | ) | ||||
Members' equity at March 27, 2009 |
$ | 3,032 | $ | 3,799 | $ | 6,831 | ||||
Net loss |
(897 | ) | (1,123 | ) | (2,020 | ) | ||||
Members' equity at March 26, 2010 |
$ | 2,135 | $ | 2,676 | $ | 4,811 | ||||
Capital Distributions (unaudited) |
(888 | ) | (1,112 | ) | (2,000 | ) | ||||
Net income (unaudited) |
521 | 651 | 1,172 | |||||||
Members' equity at March 25, 2011 (Unaudited) |
$ | 1,768 | $ | 2,215 | $ | 3,983 | ||||
9. Supplemental Cash Flow Information
Supplemental disclosures to the statement of cash flows are as follows:
| |
March 25, 2011 | March 26, 2010 | March 27, 2009 | ||||||||
|---|---|---|---|---|---|---|---|---|---|---|---|
| |
(Unaudited) |
|
|
||||||||
Cash paid during the period for: |
|||||||||||
Interest |
$ | 300 | $ | 255 | $ | 68 | |||||
Taxes |
$ | 38 | $ | 2 | $ | 1 | |||||
86
Digital Link II, LLC
Notes to the Financial Statements (Continued)
Years ended March 25, 2011 (Unaudited), March 26, 2010 and March 27, 2009
(in 000's)