Attached files
| file | filename |
|---|---|
| 8-K - FORM 8-K - GOLD RESOURCE CORP | d8k.htm |
 6-21-11
2011 ANNUAL MEETING
2011 ANNUAL MEETING
Exhibit 99.1 |
 This
brochure contains statements that plan for or anticipate the future.
Forward-looking statements include statements about the Company's ability
to develop and produce gold or other precious metals, statements
about
our future business plans and strategies, statements about future revenue
and the receipt of working capital, and most other statements that are not
historical in nature. Forward-looking statements are often identified by
words such as "anticipate," "plan," "believe," "expect,"
"estimate," and the like. Because forward-looking statements involve
future risks and uncertainties, there are factors that could cause actual
results to differ
materially from those expressed or implied, including those described in our
filings with the SEC. Prospective investors are urged not to put undue
reliance on these forward-looking statements.
This presentation is to be read in conjunction with the most current 10K
available at the Securities & Exchange Commission website
www.sec.gov. or
www.Goldresourcecorp.com
Forward Looking Statements
Forward Looking Statements |
 High-Grade Asset Base with Significant Exploration Potential
Low Cost Gold Producer Focused on Growth
Low Cost Gold Producer Focused on Growth
Engineered To Maximize Shareholder Value
Engineered To Maximize Shareholder Value
Focused on Cash Flow and Dividends
Focused on Cash Flow and Dividends |
 Delivering Shareholder Value
 |
 Recent
events Recent events
Mine cleanup after rain /hail storm is
complete
Precautionary measures
Mine development continues
1
Stope (L4-L5) underway
Descending benches
Consider long hole stoping
Decline progressing ~6 meters
per day
Progressing towards Level 7
Ore blending program during cleanup
underground and open pit ore
Mill optimization continues
Cu/Au, Pb/Ag, Zn concentrates
Underground Au, Ag +90% recovery
st |
 Recent
events Recent events
Overcame adversity
Optimizing operations
Foresee Q2
record
production, revenues
and earnings
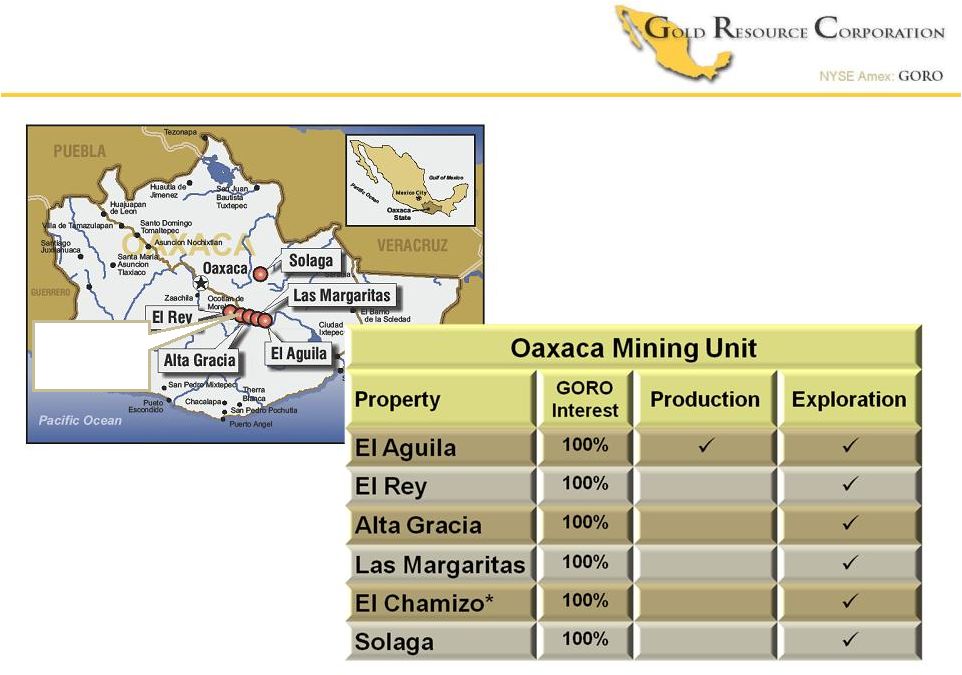
Oaxaca Mining Unit Team
Oaxaca Mining Unit Team |
 Aggressive Growth Profile
Calendar
Year-end
Production
Targets
Mill capacity as built = ~200,000 oz. Above targets do not include Company’s
remaining open pit ore stockpiles and stated long term goal of increasing mill capacity
to ~300,000 oz’s Internal Estimate, Not SEC Proven & Probable Reserves; see Risk
Factors in Company’s 10K Requires rapid stope
development and
Company will reevaluate
after Q2
10,493
90,000
155,000
200,000
0
25,000
50,000
75,000
100,000
125,000
150,000
175,000
200,000
225,000 |
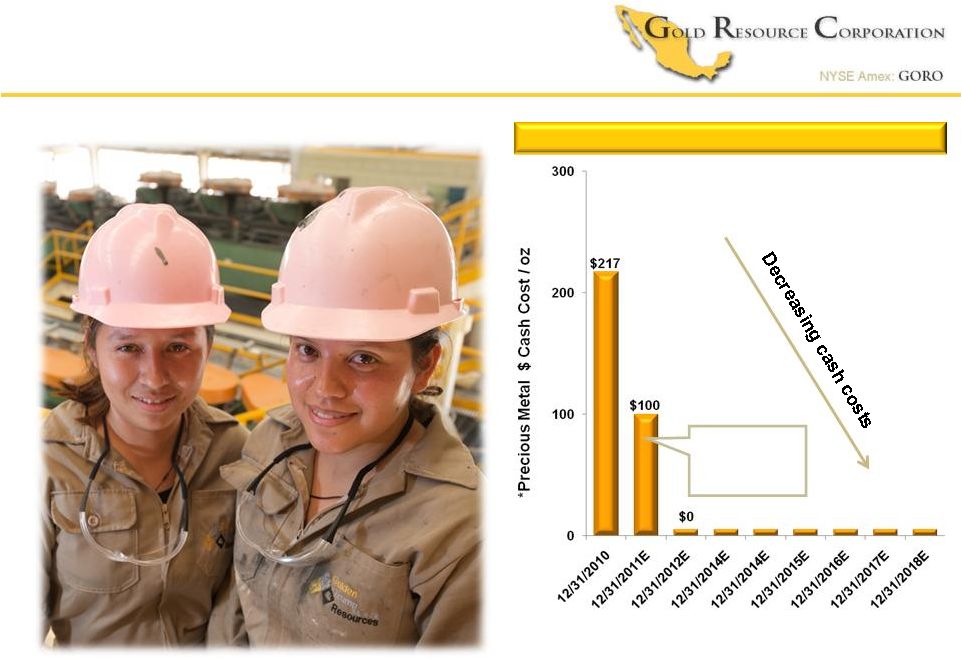 Continued Lower costs
Cash Cost / Ounce Targets
Cash Cost / Ounce Targets
*Precious metals $0 cash cost / oz production targeted
using industry standard base metal by-product credits
of; Cu, Pb, Zn
Internal Estimate, Not SEC Proven & Probable Reserves; see Risk Factors in Company’s
10K Q1 2011
$87 |
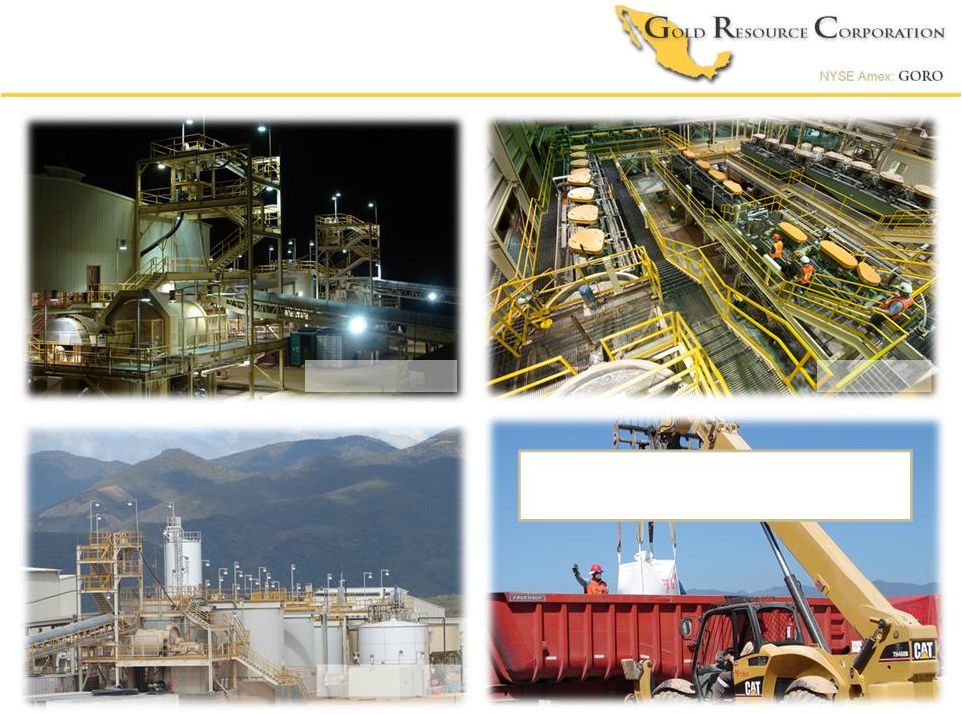 Company’s First Profit
Flotation
Agitated leach
Two mill circuits
Q1 2011 First Company Profit |
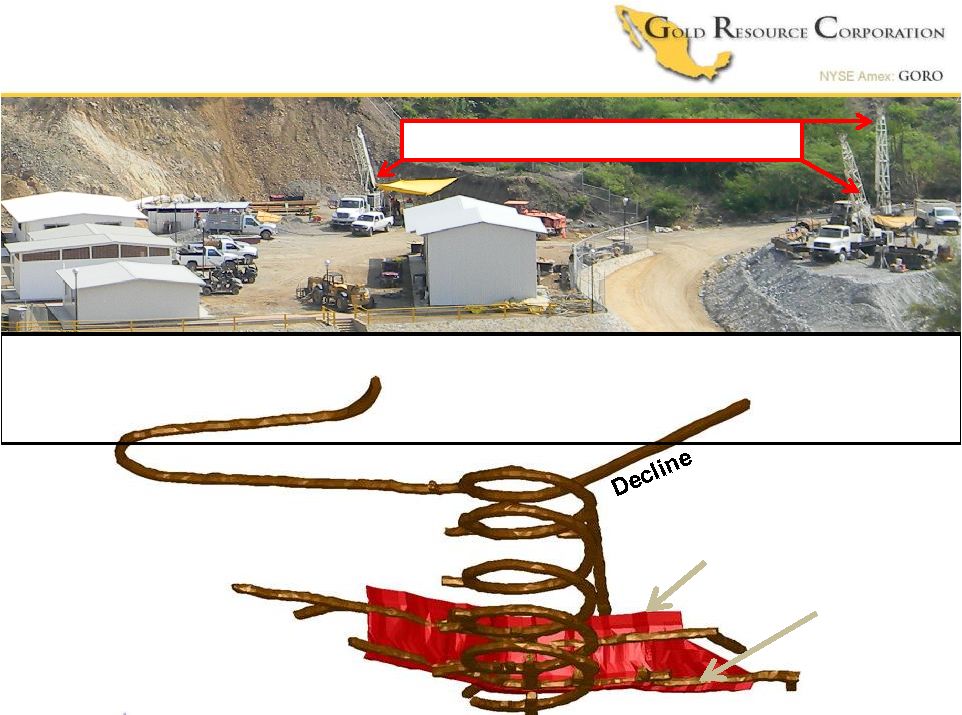
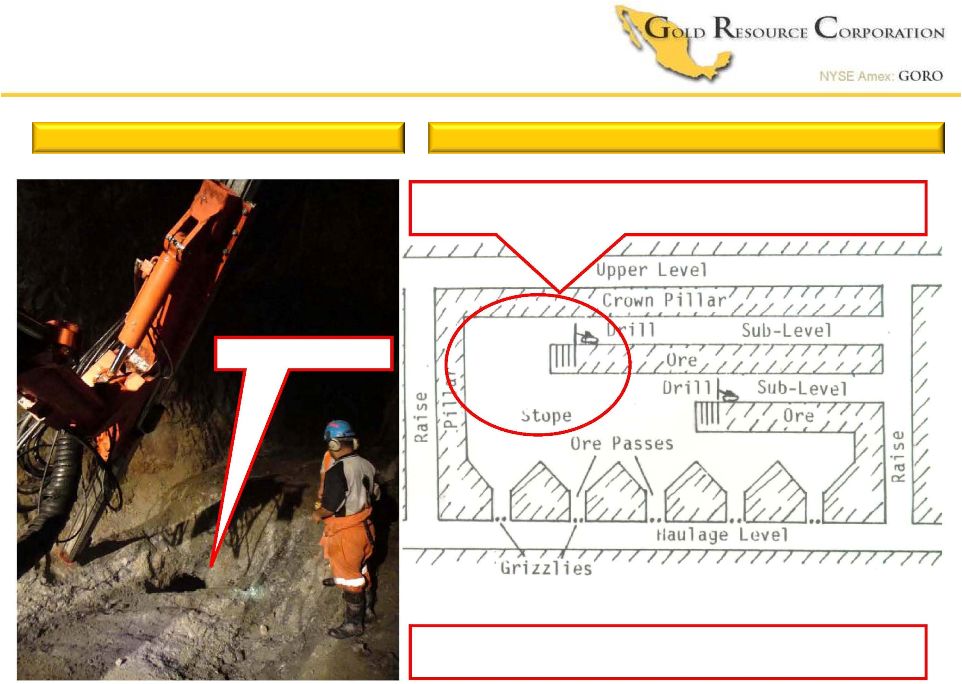 Descending Benches
Schematic of Mine Development
Schematic of Mine Development
Arista Underground Mine development
Arista Underground Mine development
Currently stoping between levels 4 and 5
L4
L 5
~450-650 nominal tonnes per day
Ore Pass |
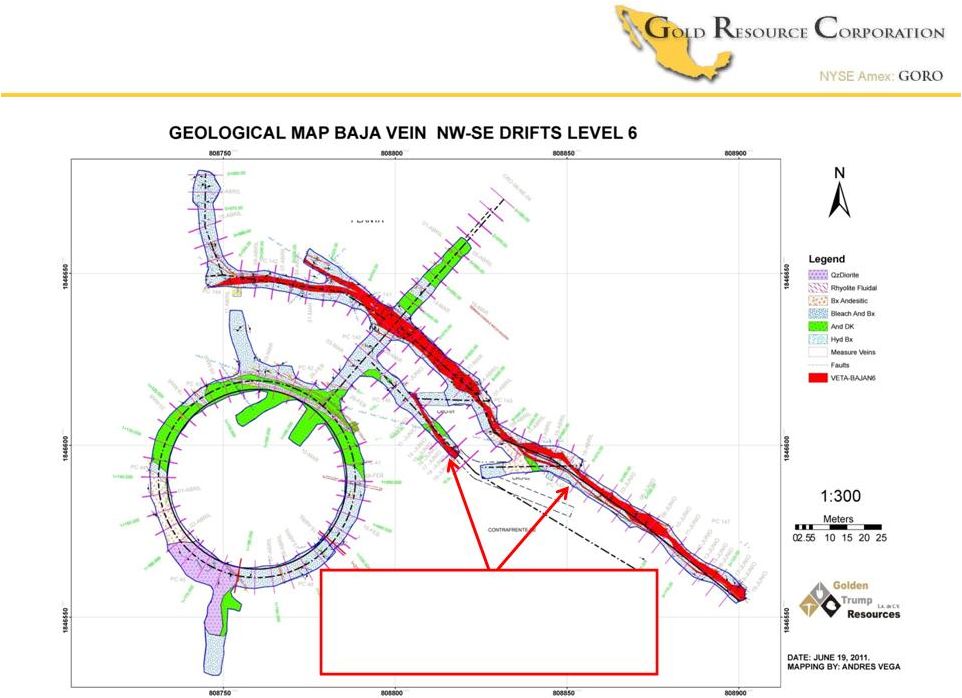 Arista Underground Mine development
Level 6 development:
Multiple veins being mined |
  1
st
Stope
L4
L 5
Hole #
from
Meters
Au g/t
Ag g/t
Cu%
Pb%
Zn% (weighted avg. not true width)
5110004 79.47
33.81
18.49
1853
1.59
1.76
5.21
L 6
Safety ramp
Arista Mine Development
Arista Mine Development
3 drills assisting development work
Hole 5110004 |
 Arista Mine Development
2011 Arista Drilling focus has been
mine development
NI-43-101 support
Underground development intercepts include (weighted avg. not true
width): Hole
#
from
Meters
Au g/t
Ag g/t
Cu%
Pb%
Zn%
5110004
79.47
33.81
18.49
1853
1.59
1.76
5.21
5110005
60.55
11.90
5.14
546
0.48
1.47
4.50
5110006
67.89
2.91
28.01
455
0.76
3.02
7.45
5110006
73.76
7.28
6.18
496
0.76
1.38
7.79
5110007
93.93
8.42
2.97
122
0.35
2.77
3.95
5110008
60.65
2.00
6.35
685
0.63
6.16
8.34
5110008
104.6
2.00
7.50
43
0.17
0.38
1.28
5110009
64.57
5.45
3.34
646
0.53
1.54
3.60
5110012
89.11
6.19
4.71
583
0.44
0.78
0.78
5110013
27.86
4.37
5.33
466
0.68
2.53
4.11
5110014
16.04
6.44
8.95
11116
0.54
1.55
2.51
2011 Arista Drilling focus going forward
Continued mine development
NI-43-101 support
Arista expansion drilling |
 Strategy
Decisions based on financial performance
Payback CAPEX less than 1 year/ IRR >100%
Production at earliest possible date
Build company with cash flow
Limit shareholder dilution
Distribute meaningful dividend
(Disciplined
Cap
Structure)
(Approx.1/3
Cash
Flow) |
 Exploration; 6 property acquired
New land acquisition*
48 kilometers on trend
+200sq miles
New
Property
*
th |
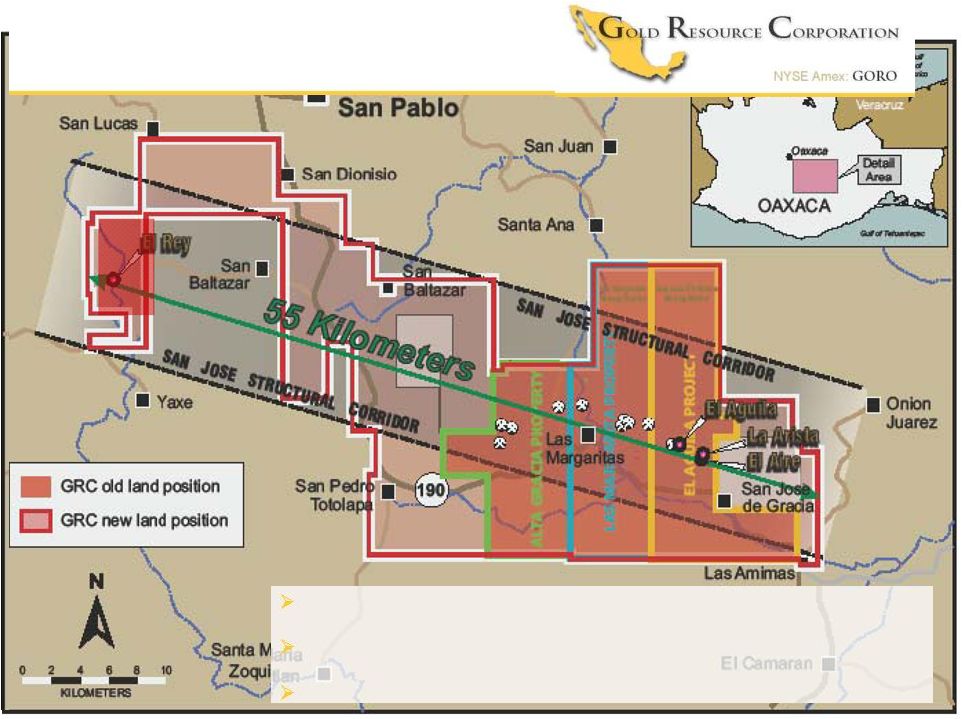 Exploration; New Land Acquisition
Oaxaca Mining Unit expansion
Dominant land position
5 properties on N70W regional structural corridor |
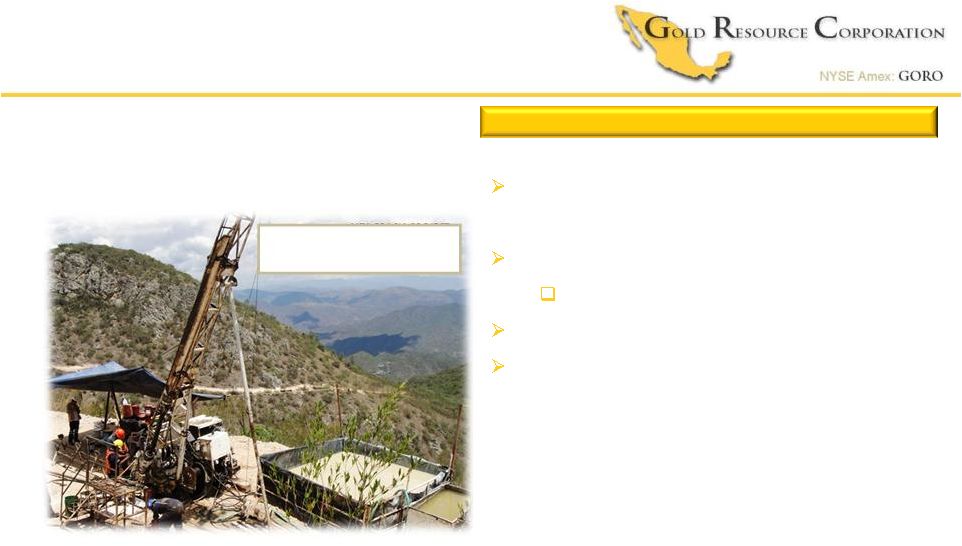
 Exploration; Drill Rigs
Two drill companies currently contracted
GeoDrill and Alta Drilling
Additional drills being evaluated
* The Company currently targets adding these drills subject to drill availability
and / or order timeframes |
 Advancing Exploration
The El Rey Property
Discovered high-grade gold vein system
Exploration / development underground
Mineralization
within 100 meters of the surface
Vein
drill
intercepts
include
(5
holes)
(1)
:
1 m of 132.5 g/t Au
1.4 m of 55.3 g/t Au
9 m of 19.4 g/t Au including
1 m of 66.4 g/t Au
1 m of 31.8 g/t Au
1 m of 30.3 g/t Au
1 m of 29.1 g/t Au
1 m of 23.7 g/t Au
Refurbish & extend existing shaft
Drive 2 development drifts along veins
Development Exploration
Development Exploration |
 Advanced Exploration
Alta Gracia Property
Developed many high-grade targets
High up in the system
May be above boiling point
Old workings utilized for new exploration
Surface samples (rock chip) include:
#
Meter
Ag g/t
Au g/t
101814
0.3
2590
4.75
101815
1.2
604
1.32
101817
0.3
431
1.08
101820
0.3
801
1.69
101828
0.5
356
0.39
101837
1.0
287
2.08
101841
0.3
560
0.36
101793
0.3
926
2.10
Development Exploration
Development Exploration
Alta Gracia Property |
 Advanced Exploration
Drill rig
Pad for mine works
exploration
Old workings |
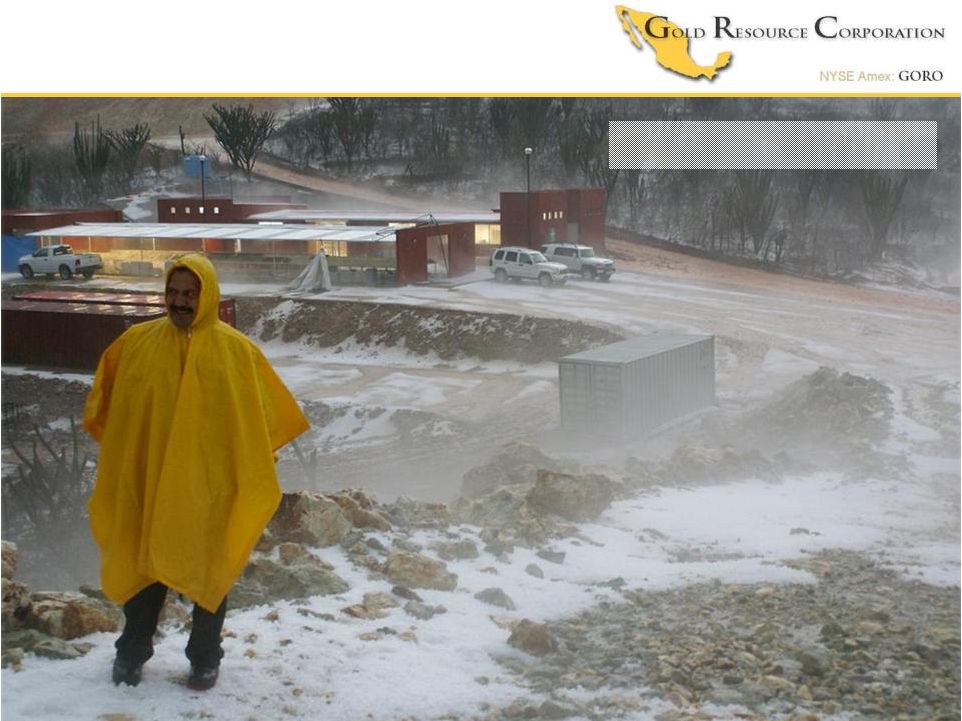
 Overcame Adversity
Typical day at the mill |
 Overcame Adversity
Freak hail storm |
 Overcame Adversity
Gold Resource Corporation
2886 Carriage Manor Point
Colorado Springs, CO. 80906 USA
Office: (303) 320-7708
Fax: (303) 320-7835
Email: gregpatterson@goldresourcecorp.com
Website: www.goldresourcecorp.com
10”
of rain and hail in three hours |
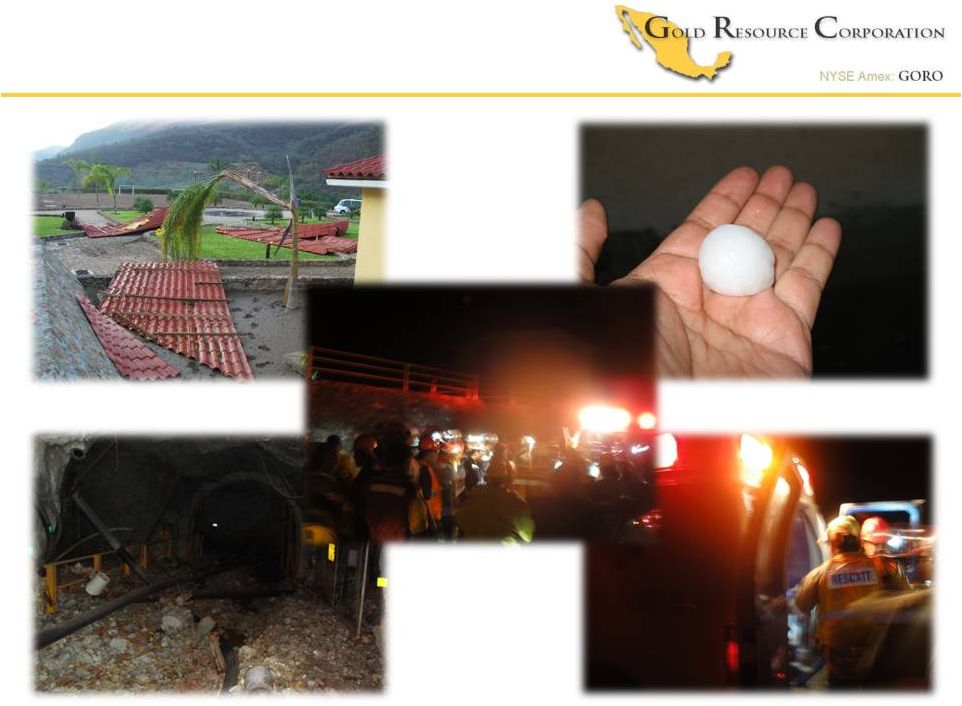 Overcame Adversity
Mill remained
operational
No serious
injuries |
    Overcame Adversity
Flood cleanup complete
Mine development continues
First stope underway |
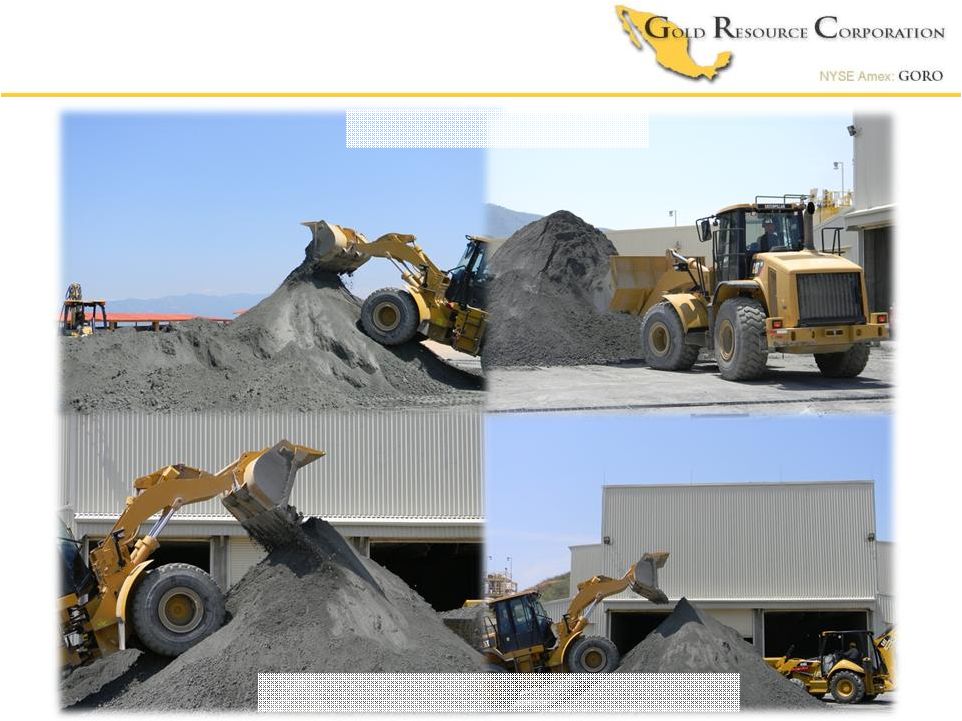 Overcame Adversity
Production continued
Record production forecasted Q2 |
 Overcame Adversity
 |
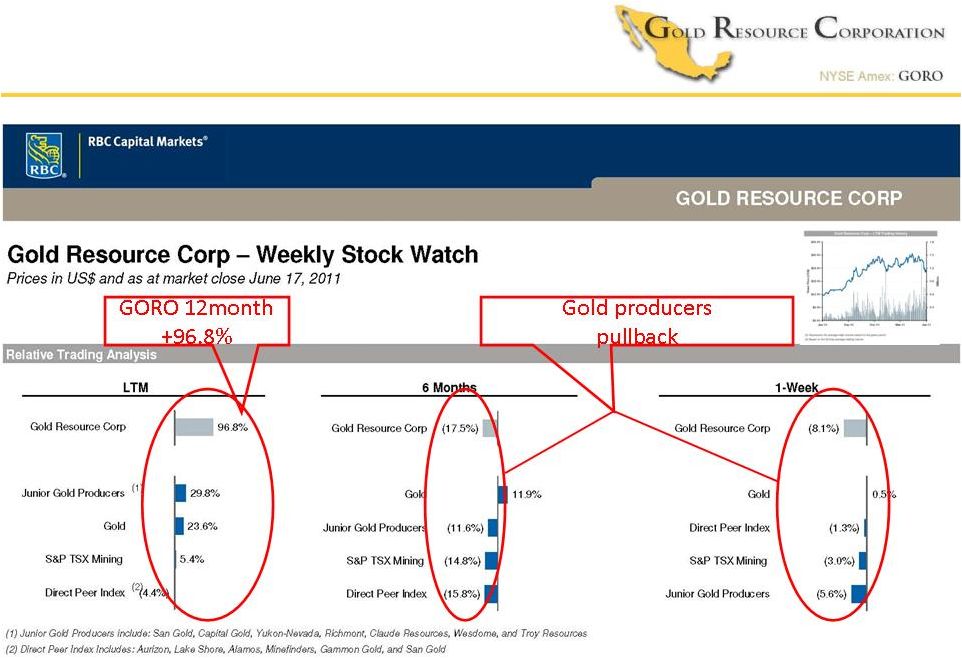 Gold
Market / Equities pullback Gold Market / Equities pullback
|
 Gold
Market Gold Market
“While the party continues for gold bullion prices,
stocks of gold companies have been a no-show.”
Frank Holmes June 2011
“Gold equities underperformed gold bullion in 2000 and 2008 during times
of extreme market negativity and uncertainty. These previous instances
have been merely temporary setbacks and markets generally
reverted back
to
their
long-term
trends.”
Frank
Holmes
June
2011
Gold Market / Equities Pullback
Gold Market / Equities Pullback |
 Where
We Are Going Where We Are Going
Development of Expanded Oaxaca Mining Unit
Development of Expanded Oaxaca Mining Unit
Increase Shareholder Value
Increase Shareholder Value
Continue “Mainstream”
Continue “Mainstream”
Thrust for Institutional Investors
Thrust for Institutional Investors
Focused on Production and Increasing Cash Flow
Focused on Production and Increasing Cash Flow
Position GORO as “GO TO”
Position GORO as “GO TO”
Gold Investment
Gold Investment |
 Mainstream Exposure
 |
 Mainstream Thrust
Formal Resource Report
Formal Resource Report
NYSE Amex Listing
NYSE Amex Listing
“Mainstream”
“Mainstream”
for Institutional Investors
for Institutional Investors
Coverage
Coverage
TSX Secondary Listing
TSX Secondary Listing
2010
2011 |
 Strike a
balance between ~Company Growth
~Return to Owners
Measurement
~Cash balance for near term growth
~Cash generated by Mine Gross Profit
Mine Gross Profit
Dividends
7/1/2010-3/30/2011
$18 million
$13 million
SPECIAL CASH DIVIDENDS
SPECIAL CASH DIVIDENDS
GORO; Unique Gold Investment
GORO; Unique Gold Investment
New
Generated
Cash
~Future project expectations |
 Cash
flow (Mine Gross Profit) and dividend focused. Company long term
estimate:
~1/3
cash flow for taxes
~1/3
cash flow targeted for growth
~1/3
cash flow targeted to be paid
back to shareholders as dividends
SPECIAL CASH DIVIDENDS
SPECIAL CASH DIVIDENDS
Special
dividend
declared
Payable to
shareholders
of record as of
Special
dividend
amount
Total Special
Dividends Returned to
shareholders
Jul.–
Dec.
2010
$0.18
$0.35
Jan. 31
Feb. 14, 2011
$0.03
Feb. 28
Mar. 18, 2011
$0.03
Mar. 31
April 15, 2011
$0.03
Apr. 28
May 13, 2011
$0.04
May. 27
June 13, 2011
$0.04
Special dividends should not be considered a prediction or guarantee of future
dividends. Potential special dividends may vary in amount and
consistency or be discontinued at management’s discretion depending on
variables including but not limited to operational cash flows, Company
development requirements and strategies, spot gold and silver prices,
taxation, general market conditions and other factors described in the
Company’s public filings. GORO; Unique Gold Investment
GORO; Unique Gold Investment
(GRC targets, performance not guaranteed, see Risk Factors in Company’s
10K) |
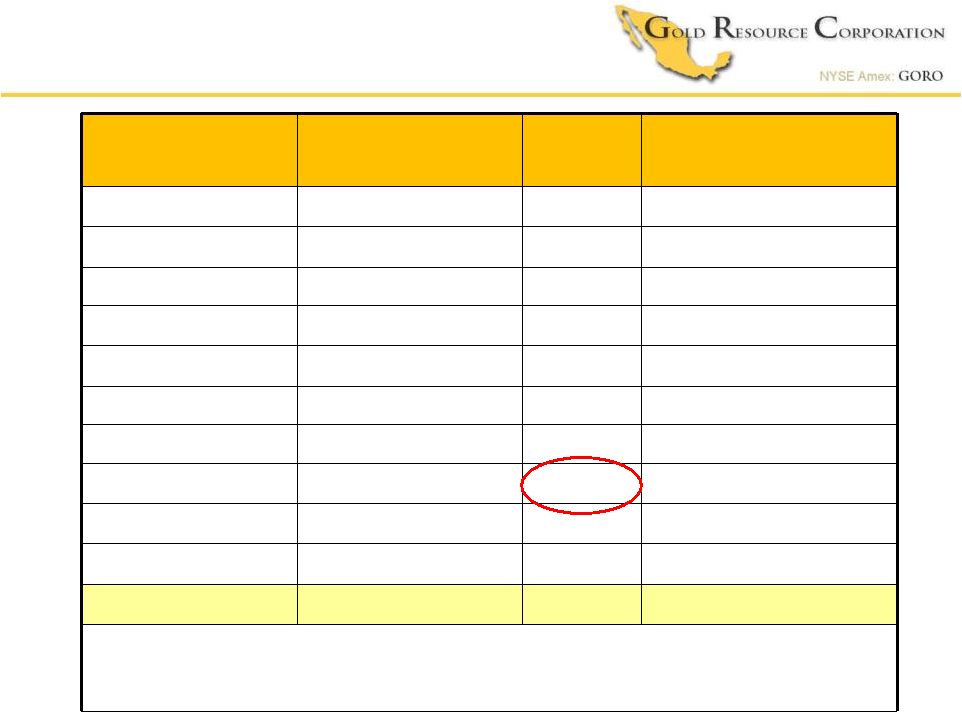 Company
Annual Dividend
Estimate
Yield
%
Share Price Close
6/20/2011
Agnico Eagle
U.S.$0.65
1.1%
U.S.$60.98
Barrick
U.S.$0.49
1.1%
U.S.$43.17
Goldcorp
U.S.$0.42
0.9%
U.S.$47.35
Kinross
U.S.$0.10
0.7%
U.S.$14.88
Newmont
U.S.$0.80
0.8%
U.S.$51.82
Yamana
U.S.$0.12
1.1%
U.S.$11.32
Royal Gold
U.S.$0.44
0.8%
U.S.$56.39
PEER AVERAGE
0.9%
Hypothetical*
Gold Resource
U.S.$0.48*
2.0%
U.S.$24.30
Source: Based on each company’s annual public filing and Bloomberg.
*Hypothetical
special dividend distribution, NOT GUARANTEED Dividend &
Yields Dividend & Yields |
 Cash
Flow Cash Flow
Become the “Go To”
Become the “Go To”
Gold Investment
Gold Investment
Dividends
Dividends
Dividends
Dividends
“In Kind”
“In Kind”
Treasury %
Treasury %
in Physical
in Physical
Adding Ounces
Adding Ounces
Capitalize on
Capitalize on
Opportunities
Opportunities
Low Cost
Low Cost
Producer
Producer
The “Go To”
The “Go To”
Gold Company
Gold Company
(GRC targets, performance not guaranteed, see Risk Factors in Company’s
10K) Growth
Growth |
 Conclusion
Exploration of High-Grade Asset Base
Exploration of High-Grade Asset Base
Low Cost Gold Producer
Low Cost Gold Producer
Increasing Production Profile
Increasing Production Profile |