Attached files
| file | filename |
|---|---|
| EX-3.1 - EX-3.1 - ISLE OF CAPRI CASINOS INC | a2204428zex-3_1.htm |
| EX-31.1 - EX-31.1 - ISLE OF CAPRI CASINOS INC | a2204428zex-31_1.htm |
| EX-21.1 - EX-21.1 - ISLE OF CAPRI CASINOS INC | a2204428zex-21_1.htm |
| EX-32.2 - EX-32.2 - ISLE OF CAPRI CASINOS INC | a2204428zex-32_2.htm |
| EX-99.1 - EX-99.1 - ISLE OF CAPRI CASINOS INC | a2204428zex-99_1.htm |
| EX-23.1 - EX-23.1 - ISLE OF CAPRI CASINOS INC | a2204428zex-23_1.htm |
| EX-31.2 - EX-31.2 - ISLE OF CAPRI CASINOS INC | a2204428zex-31_2.htm |
| EX-32.1 - EX-32.1 - ISLE OF CAPRI CASINOS INC | a2204428zex-32_1.htm |
Use these links to rapidly review the document
Table of Contents
ITEM 8. FINANCIAL STATEMENTS AND SUPPLEMENTARY DATA
UNITED STATES
SECURITIES AND EXCHANGE COMMISSION
Washington, D.C. 20549
FORM 10-K
| (Mark One) | ||
ý |
ANNUAL REPORT PURSUANT TO SECTION 13 OR 15(d) OF THE SECURITIES EXCHANGE ACT OF 1934 |
|
For the fiscal year ended April 24, 2011 |
||
OR |
||
o |
TRANSITION REPORT PURSUANT TO SECTION 13 OR 15(d) OF THE SECURITIES EXCHANGE ACT OF 1934 |
|
For the transition period from to |
||
Commission File Number 0-20538
ISLE OF CAPRI CASINOS, INC.
(Exact name of registrant as specified in its charter)
| Delaware (State or other jurisdiction of incorporation or organization) |
41-1659606 (I.R.S. Employer Identification Number) |
|
600 Emerson Road, Suite 300, St. Louis, Missouri (Address of principal executive offices) |
63141 (Zip Code) |
Registrant's telephone number, including area code: (314) 813-9200
Securities Registered Pursuant to Section 12(b) of the Act:
Common Stock, $.01 Par Value Per Share
(Title of Class)
Securities Registered Pursuant to Section 12(g) of the Act:
Indicate by check mark if the registrant is a well-known seasoned issuer, as defined in Rule 405 of the Securities Act. Yes o No ý
Indicate by check mark if the registrant is not required to file reports pursuant to Section 13 or Section 15(d) of the Act. Yes o No ý
Indicate by check mark whether the registrant (1) has filed all reports required to be filed by Section 13 or 15(d) of the Securities Exchange Act of 1934 during the preceding 12 months (or for such shorter period that the registrant was required to file such reports), and (2) has been subject to such filing requirements for the past 90 days. Yes ý No o
Indicate by check mark whether the registrant has submitted electronically and posted on its corporate Web site, if any, every Interactive Data File required to be submitted and posted pursuant to Rule 405 of Regulation S-T (§ 229.405 of this chapter) during the preceding 12 months (or for such shorter period that the registrant was required to submit and post such files). Yes o No o
Indicate by check mark if disclosure of delinquent filers pursuant to Item 405 of Regulation S-K is not contained herein, and will not be contained, to the best of registrant's knowledge, in definitive proxy or information statements incorporated by reference in Part III of this Form 10-K or any amendment to this Form 10-K. o
Indicate by check mark whether the registrant is a large accelerated filer, accelerated filer, a non-accelerated filer, or a smaller reporting company. See the definitions of "large accelerated filer," "accelerated filer" and "smaller reporting company" in Rule 12b-2 of the Exchange Act.
Large accelerated filer o |
Accelerated filer ý | Non-accelerated filer o (Do not check if a smaller reporting company) |
Smaller reporting company o |
Indicate by check mark whether the registrant is a shell company (as defined in Rule 12b-2 of the Exchange Act). Yes o No ý
The aggregate market value of the voting and non-voting stock held by non-affiliates(1) of the Company is $131,766,870, based on the last reported sale price of $7.93 per share on October 25, 2010 on the NASDAQ Stock Market; multiplied by 16,616,251 shares of Common Stock outstanding and held by non-affiliates of the Company on such date.
- (1)
- Affiliates for the purpose of this item refer to the directors, named executive officers and/or persons owning 10% or more of the Company's common stock, both of record and beneficially; however, this determination does not constitute an admission of affiliate status for any of the individual stockholders.
As of June 13, 2011, the Company had a total of 38,222,865 shares of Common Stock outstanding (which excludes 3,841,283 shares held by us in treasury).
Part III incorporates information by reference to the Registrant's definitive proxy statement to be filed with the Securities and Exchange Commission within 120 days after the end of the fiscal year.
DISCLOSURE REGARDING FORWARD-LOOKING STATEMENTS
This Annual Report contains statements that we believe are, or may be considered to be, "forward-looking statements" within the meaning of the Private Securities Litigation Reform Act of 1995. All statements other than statements of historical fact included in this Annual Report regarding the prospects of our industry or our prospects, plans, financial position or business strategy, may constitute forward-looking statements. In addition, forward-looking statements generally can be identified by the use of forward-looking words such as "may," "will," "expect," "intend," "estimate," "foresee," "project," "anticipate," "believe," "plans," "forecasts," "continue" or "could" or the negatives of these terms or variations of them or similar terms. Furthermore, such forward-looking statements may be included in various filings that we make with the SEC or press releases or oral statements made by or with the approval of one of our authorized executive officers. Although we believe that the expectations reflected in these forward-looking statements are reasonable, we cannot assure you that these expectations will prove to be correct. These forward-looking statements are subject to certain known and unknown risks and uncertainties, as well as assumptions that could cause actual results to differ materially from those reflected in these forward-looking statements. Factors that might cause actual results to differ include, but are not limited to, those discussed in the section entitled "Risk Factors" beginning on page 9 of this report. Readers are cautioned not to place undue reliance on any forward-looking statements contained herein, which reflect management's opinions only as of the date hereof. Except as required by law, we undertake no obligation to revise or publicly release the results of any revision to any forward-looking statements. You are advised, however, to consult any additional disclosures we make in our reports to the SEC. All subsequent written and oral forward-looking statements attributable to us or persons acting on our behalf are expressly qualified in their entirety by the cautionary statements contained in this Annual Report.
1
Overview
We are a leading developer, owner and operator of branded gaming facilities and related lodging and entertainment facilities in regional markets in the United States. We own and operate 15 gaming and entertainment facilities in Louisiana, Mississippi, Missouri, Iowa, Colorado and Florida. Collectively, these properties feature approximately 15,000 slot machines and over 370 table games (including approximately 110 poker tables) over 3,000 hotel rooms and more than 40 restaurants. We also operate a harness racing track at our casino in Florida. Our portfolio of properties provides us with a diverse geographic footprint that minimizes geographically concentrated risks caused by weather, regional economic difficulties, gaming tax rates and regulations imposed by local gaming authorities.
Strategic Plan Components
The Isle of Capri senior management team brings over 200 collective years of gaming industry experience spanning 20 states, six foreign jurisdictions and over 75 individual gaming properties. Since joining the company in 2007, this team developed and are executing a strategic operating plan that focuses on the financial discipline and core operating principles of the company in order to increase our customer's satisfaction with our product offerings while at the same time increasing stockholder value. Our business approach is anchored by the following strategic components:
Financial discipline.
We utilize a disciplined approach to evaluate financial decisions with the continuing goal to improve our capital structure and financial flexibility. We have reduced our outstanding debt from approximately $1.5 billion as of April 27, 2008 to approximately $1.2 billion as of April 24, 2011, a reduction of approximately $310 million. We achieved this reduction primarily through the use of cash obtained from the settlement of our Hurricane Katrina claim and cash flows from operations. We retired $142.7 million of our 7% senior subordinated notes for $82.8 million through a tender offer in February 2009 and prepaid $35.0 million of our term loans under our credit facility in March 2009.
On January 25, 2011, we continued to improve our capital structure by raising $51.2 million in net proceeds through the issuance of 5.3 million shares of our common stock. In March 2011, we issued $300 million in 7.75% senior notes and utilized the proceeds to repay borrowings under our credit facility. Also in March 2011, we entered into an amendment to our Credit Facility, which, among other things, extended the maturity of the revolving credit facility and term loan and increased flexibility in operations and capital spending. We continually seek opportunities to improve our capital structure.
Focusing on core operating principles that have proven successful.
Our operating focus is to deliver a superior guest experience by providing customers with the most popular gaming product in a clean, safe, friendly and fun environment. These areas have been shown through customer research to embody the attributes of a gaming entertainment experience most important to our customers in choosing which casino to visit. We emphasize, among other things, customer courtesy and we have implemented a proprietary program to measure our progress against standards for certain courteous behaviors. In addition, many of our capital and operating plans are intended to improve on guest satisfaction, including quality, accessibility and cleanliness of areas frequented by our customers, such as hotel rooms and other public areas in our hotels and casino floors. We also have implemented employee incentive programs designed to encourage employees to deliver superior customer service and courtesy.
2
Driving value through product offerings and branding.
Our current branding strategy includes two separate brand names: Isle and Lady Luck (which we re-launched in fiscal 2009). Through comprehensive market studies and customer feedback, we have found that our brands convey excitement, entertainment, consistent high-quality service and value to our customers.
We use the Isle brand primarily at properties that have a regional draw. These are generally casinos in larger markets where we have expansion potential demonstrated by either the size of the market or excess land that we control. The Isle-branded properties typically offer expanded amenities, such as hotel rooms, expanded food and beverage offerings and conference and convention capabilities.
We use the Lady Luck brand for properties that predominantly draw local customers, which are typically in smaller markets with less expansion potential. The goal of the Lady Luck brand is to offer a first-class gaming experience and high quality entertainment options, featuring casual dining and popular local entertainment in a comfortable setting.
We have completed the refurbishment and rebranding of three of our existing Isle properties under the Lady Luck brand: Marquette, Iowa in September 2009, Colorado Central Station in Black Hawk, Colorado in June 2009 and Caruthersville, Missouri in December 2008. Assuming economic conditions improve and capital availability is enhanced, we intend to rebrand additional properties under the Lady Luck name during the next few years. Our current expectations are that Natchez, Lula and Vicksburg, Mississippi; Lake Charles, Louisiana; Boonville, and Kansas City, Missouri will eventually be rebranded as Lady Luck casinos.
We offer all customers membership in our customer loyalty program, which rewards customers with points and complimentary benefits that can be redeemed at any of our properties by using a players' club card. As a result, we have developed an extensive proprietary database that allows us to create effective targeted marketing and promotional programs, merchandise giveaways, gaming tournaments and other special events. As of April 24, 2011, our database contained approximately 1.3 million members, of whom approximately 0.5 million receive regular communications from us. We believe we effectively use our database to encourage repeat visits and increase our customers' length of stay at our properties.
Aggressively pursuing prudent growth opportunities.
On December 1, 2010, the Missouri Gaming Commission selected our proposed casino project in Cape Girardeau (the "Cape Girardeau Project") for prioritization for the thirteenth and final gaming license in the State of Missouri. We intend to brand this casino as an Isle property, which we expect to include approximately 1,000 slot machines, 28 table games, three restaurants, a lounge and terrace overlooking the Mississippi River and a 750-seat event center at an estimated cost of $125 million. We anticipate construction to begin in summer 2011 and casino operations to begin in the fourth calendar quarter of 2012.
We also continue to seek to expand our operations through acquisitions, such as our acquisition of the Rainbow Casino located in Vicksburg, Mississippi in June 2010 for approximately $76 million. Vicksburg is located approximately one mile south of Interstate 20, the main road connecting Jackson, Mississippi to Vicksburg. The casino features 762 slot machines, 6 table games, a 224-seat Riverview Buffet, a 26-seat Crossroads Deli and 977 parking spots.
Additionally, we formed Isle Gaming Management, a management and consulting division of the Company, in 2009 to leverage our experienced and respected management team and intellectual property by managing and operating casinos owned by third parties in exchange for management and other fees. The goal of Isle Gaming Management is to allow us to manage additional casino properties without requiring extensive capital investment. On April 14, 2011, the Nemacolin Woodlands Resort
3
("Nemacolin") in Farmington, Pennsylvania was selected by the Pennsylvania Gaming Control Board for the final Category 3 resort gaming license. We had previously entered into an agreement with Nemacolin to complete the build-out of the casino space and provide management services for the casino. The casino is expected to include 600 slot machines, 28 table games, a casual dining restaurant and lounge. We will pay an annual fee to the resort owner and in return will receive a management fee equal to the EBITDA of the casino after payment of the fee to Nemacolin. We currently estimate the project cost at approximately $50 million and expect to be complete within nine months of the commencement of construction. The award of the license to Nemacolin is subject to a 30-day appeal period, which ends on June 20, 2011, and the obtainment of a management license.
Finally, in September 2010, we were awarded a gaming license by Nevada's Gaming Control Board, expanding the universe of opportunities that we can ultimately pursue.
Casino Properties
The following is an overview of our existing casino properties as of April 24, 2011:
Property
|
Date Acquired or Opened | Slot Machines |
Table Games |
Hotel Rooms |
Parking Spaces |
|||||||||||
|---|---|---|---|---|---|---|---|---|---|---|---|---|---|---|---|---|
Louisiana |
||||||||||||||||
Lake Charles |
July 1995 | 1,806 | 78 | 493 | 2,335 | |||||||||||
Mississippi |
||||||||||||||||
Lula |
March 2000 | 1,177 | 12 | 484 | 1,611 | |||||||||||
Biloxi |
August 1992 | 1,219 | 36 | 709 | 1,339 | |||||||||||
Natchez |
March 2000 | 617 | 10 | 141 | 645 | |||||||||||
Vicksburg |
June 2010 | 762 | 6 | — | 977 | |||||||||||
Missouri |
||||||||||||||||
Kansas City |
June 2000 | 1,161 | 22 | — | 1,731 | |||||||||||
Boonville |
December 2001 | 991 | 19 | 140 | 1,101 | |||||||||||
Caruthersville |
June 2007 | 595 | 16 | — | 1,000 | |||||||||||
Iowa |
||||||||||||||||
Bettendorf |
March 2000 | 1,022 | 28 | 514 | 2,057 | |||||||||||
Rhythm City—Davenport |
October 2000 | 949 | 15 | — | 911 | |||||||||||
Marquette |
March 2000 | 600 | 11 | — | 475 | |||||||||||
Waterloo |
June 2007 | 1,040 | 32 | 195 | 1,500 | |||||||||||
Colorado |
||||||||||||||||
Isle Casino Hotel-Black Hawk |
December 1998 | 1,036 | 35 | 238 | 1,100 | |||||||||||
Lady Luck Casino-Black Hawk |
April 2003 | 524 | 17 | 164 | 1,200 | |||||||||||
Florida |
||||||||||||||||
Pompano Park |
July 1995/April 2007 | 1,448 | 38 | — | 3,800 | |||||||||||
|
14,947 | 375 | 3,078 | 21,782 | ||||||||||||
Louisiana
Lake Charles
Our Lake Charles property, which commenced operations in July 1995, is located on a 19-acre site along Interstate 10, the main thoroughfare connecting Houston, Texas to Lake Charles, Louisiana. The property consists of two dockside casinos offering 1,806 slot machines, 50 table games, 28 poker tables, two hotels offering 493 rooms, a 105,000 square foot land-based pavilion and entertainment center, and
4
2,335 parking spaces, including approximately 1,400 spaces in an attached parking garage. The pavilion and entertainment center offer customers a wide variety of non-gaming amenities, including a 109-seat Otis & Henry's restaurant, a 290-seat Calypso's buffet, a 70-seat Lucky Wins Asian-inspired restaurant, which also includes a grab and go deli, and Caribbean Cove featuring free live entertainment and can accommodate 180 guests. The pavilion also has a 14,750 square foot entertainment center comprised of a 1,100-seat special events center designed for concerts, live boxing, televised pay-per-view events, banquets and other events, meeting facilities and administrative offices. On June 13, 2011, we granted an option agreement to a third party which could result in the sale of certain assets used at our Lake Charles, Louisiana property. The option agreement expires on November 30, 2011 and is subject to a number of conditions. The transaction is also subject to regulatory and other approvals, and passage of a local referendum to relocate the vessel to a different market. If the option is exercised and the transaction closes, we would continue to operate our Lake Charles hotel and land-based operations and consolidate our gaming operations onto one gaming vessel.
The Lake Charles market currently consists of two dockside gaming facilities, a Native American casino and a pari-mutuel facility/racino. The current number of slot machines in the market exceeds 7,900 machines and table games exceed 125 tables. In calendar year 2010, the two gaming facilities and one racino, in the aggregate, generated gaming revenues of approximately $638 million. Revenues for the Native American property are not published. Gaming revenues for our Lake Charles property for calendar year 2010 were approximately $138 million. Lake Charles is the closest gaming market to the Houston metropolitan area, which has a population of approximately 5.5 million and is located approximately 140 miles west of Lake Charles. We believe that our Lake Charles property attracts customers primarily from southeast Texas, including Houston, Beaumont, Galveston, Orange and Port Arthur and from local area residents. Approximately 500,000 and 1.6 million people reside within 50 and 100 miles, respectively, of the Lake Charles property.
Mississippi
Lula
Our Lula property, which we acquired in March 2000, is strategically located off of Highway 49, the only road crossing the Mississippi River between Mississippi and Arkansas for more than 50 miles in either direction. The property consists of two dockside casinos containing 1,177 slot machines and 12 table games, two on-site hotels with a total of 484 rooms, a land-based pavilion and entertainment center, 1,611 parking spaces, and a 28-space RV Park. The pavilion and entertainment center offer a wide variety of non-gaming amenities, including a 131-seat Farraddays' restaurant, a 328-seat Calypso's buffet and a 46-seat Tradewinds Marketplace, and a gift shop.
Our Lula property is the only gaming facility in Coahoma County, Mississippi and generated gaming revenues of approximately $66 million in calendar year 2010. Lula draws a significant amount of business from the Little Rock, Arkansas metropolitan area, which has a population of approximately 675,000 and is located approximately 120 miles west of the property. Coahoma County is also located approximately 60 miles southwest of Memphis, Tennessee, which is primarily served by nine casinos in Tunica County, Mississippi. Approximately 1.1 million people reside within 60 miles of the property. Lula also competes with Native American casinos in Oklahoma and a racino in West Memphis, Arkansas.
Biloxi
Our Biloxi property, which commenced operations in August 1992, is located on a 17-acre site at the eastern end of a cluster of facilities formerly known as "Casino Row" in Biloxi, Mississippi, and is the first property reached by visitors coming from Alabama, Florida and Georgia via Highway 90.
5
In October 2005, the Mississippi legislature amended its gaming laws to allow casinos to operate land-based facilities within 800 feet of the mean high water line. Our Biloxi property is now a land-based casino offering approximately 1,200 slot machines, 27 table games, a nine-table poker room, a 709-room hotel including 200 whirlpool suites, a 120-seat banquet room called "Paradise Room," 138-seat Farraddays' restaurant, a 200-seat Calypso's buffet, a 128-seat Café at the Point restaurant, a 94-seat Tradewinds marketplace, a multi-story feature bar, a full service Starbucks and over 1,300 parking spaces.
The Mississippi Gulf Coast market (which includes Biloxi, Gulfport and Bay St. Louis) consists of 11 dockside gaming facilities, which in the aggregate, generated gaming revenues of approximately $1.1 billion during calendar year 2010. Our Biloxi property generated gaming revenues of approximately $69 million during calendar year 2010. Approximately one million people reside within 60 miles of the property.
Natchez
Our Natchez property, which we acquired in March 2000, is located off of Highways 84 and 61 in western Mississippi. The property consists of a dockside casino offering 617 slot machines and 10 table games, a 141-room off-site hotel located approximately one mile from the casino, a 150-seat Calypso's buffet and 645 parking spaces.
Our Natchez property is currently the only gaming facility in the Natchez market and generated total gaming revenues of approximately $33 million in calendar year 2010. We believe that the Natchez property attracts customers primarily from among the approximately 350,000 people residing within 60 miles of the Natchez property.
Vicksburg
Our Vicksburg property, which we acquired in June 2010, is located off Interstate 20 and Highway 61 in western Mississippi, approximately 50 miles west of Jackson, Mississippi. The property consists of a dockside casino offering 762 slot machines and six table games, a 224-seat Riverview Buffet, a 26-seat Crossroads Deli and 977 parking spaces.
The Vicksburg market consists of five dockside casinos and approximately 700,000 people reside within 60 miles of the property.
Missouri
Kansas City
Our Kansas City property, which we acquired in June 2000, is the closest gaming facility to downtown Kansas City and consists of a dockside casino offering 1,161 slot machines and 22 table games, a 285-seat Calypso's buffet, a 80-seat Lone Wolf restaurant, a 58-seat Tradewinds Marketplace and 1,731 parking spaces.
The Kansas City market consists of four dockside gaming facilities and a Native American casino. Operating statistics for the Native American casino are not published. The four dockside gaming facilities generated gaming revenues of approximately $714 million in calendar year 2010. Our Kansas City property generated gaming revenues of approximately $82 million during calendar year 2010. We believe that our Kansas City casino attracts customers primarily from the Kansas City metropolitan area, which has approximately 1.9 million residents
A competitor is currently constructing a $411 million casino at the Kansas Speedway located in Wyandotte County, Kansas. This casino is located approximately 20 miles from our Kansas City property and is expected to open in the first half of 2012.
6
Boonville
Our Boonville property, which opened in December 2001, is located three miles off Interstate 70, approximately halfway between Kansas City and St. Louis. The property consists of a single level dockside casino offering 989 slot machines, 19 table games, a 140-room hotel, a 32,400 square foot pavilion and entertainment center and 1,101 parking spaces. The pavilion and entertainment center offers customers a wide variety of non-gaming amenities, including an 83-seat Farraddays' restaurant, a 218-seat Calypso's buffet, a 24-seat Tradewinds Marketplace, an 800 seat event center, and an historic display area. Our Boonville property is the only gaming facility in central Missouri and generated gaming revenues of approximately $81 million in calendar year 2010. We believe that our Boonville casino attracts customers primarily from the approximately 580,000 people who reside within 60 miles of the property which includes the Columbia and Jefferson City areas.
Caruthersville
Our Caruthersville property was acquired in June 2007 and is a riverboat casino located along the Mississippi River in Southeast Missouri. In June 2008, the casino was re-branded as a Lady Luck casino with the construction and refurbishment completed in December 2008. The dockside casino offers 595 slot machines, 11 table games and 5 poker tables. As part of the re-branding, we renovated our 40,000 square foot pavilion, which includes a 130-seat Lone Wolf restaurant, bar and lounge and a 270-seat Otis & Henry's restaurant. Renovations to the riverboat, including the casino floor, were completed in the summer of 2009. The property also operates a 10,000 square foot exposition center with seating for up to 1,100 patrons and has 1,000 parking spaces. Our Caruthersville facility is the only casino located in Southeast Missouri and generated gaming revenues of approximately $34 million in calendar year 2010. Approximately 650,000 people reside within 60 miles of the property.
Iowa
Bettendorf
Our Bettendorf property, which we acquired in March 2000, is located off of Interstate 74, an interstate highway serving the Quad Cities metropolitan area, which consists of Bettendorf and Davenport, Iowa and Moline and Rock Island, Illinois. The property consists of a dockside casino offering 1,022 slot machines, 24 table games, 4 poker tables, 514 hotel rooms, 40,000 square feet of flexible convention/banquet space, a 120-seat Farraddays' restaurant, a 272-seat Calypso's buffet, a 42-seat Tradewinds Marketplace and 2,057 parking spaces. We have entered into agreements with the City of Bettendorf, Iowa under which we manage and provide financial and operating support for the QC Waterfront Convention Center that is adjacent to our hotel. The QC Waterfront Convention Center opened in January 2009.
Davenport
Our Davenport property, which we acquired in October 2000, is located at the intersection of River Drive and Highway 61, a state highway serving the Quad Cities metropolitan area. The property consists of a dockside gaming facility offering 949 slot machines, 16 table games, a 209-seat Hit Parade buffet, a Grab-n-Go food outlet and 911 parking spaces.
The Quad Cities metropolitan area currently has three gaming operations—our two gaming facilities in Bettendorf and in Davenport, and one operator, which opened a larger land-based facility, including a hotel, in December 2008. The three operations in the Quad Cities generated total gaming revenues of approximately $210 million in calendar year 2010. Our Bettendorf and Davenport properties generated casino revenues for calendar year 2010 of approximately $78 million and $53 million, respectively. Our operations in the Quad Cities also compete with other gaming operations
7
in Illinois and Iowa. Approximately 923,000 people reside within 60 miles of our Bettendorf and Davenport properties.
Marquette
Our Marquette property, which we acquired in March 2000, is located in Marquette, Iowa, approximately 60 miles north of Dubuque, Iowa. The property consists of a dockside casino offering 600 slot machines and 11 table games, a marina and 475 parking spaces. During fiscal 2010, we completed the rebranding of the property as a Lady Luck casino. The facility now includes a newly themed 142-seat buffet restaurant, an Otis and Henry's Express food outlet and a Lone Wolf restaurant and bar.
Our Marquette property is the only gaming facility in the Marquette, Iowa market and generated gaming revenues of approximately $29 million in calendar year 2010. We believe most of our Marquette customers are from northeast Iowa and Wisconsin, which includes approximately 490,000 people within 60 miles of our property, and we compete for those customers with other gaming facilities in Dubuque, Iowa and Native American casinos in southwestern Wisconsin.
Waterloo
Our Waterloo property, which opened on June 30, 2007, is located adjacent to Highway 218 and US 20 in Waterloo, Iowa. The property consists of a single-level casino offering 1,040 slot machines, 27 table games and 5 poker tables. The property also offers a wide variety of non-gaming amenities, including a 123-seat Otis & Henry's restaurant, a 208-seat Isle buffet, a 44-seat Tradewinds marketplace, Club Capri Lounge, Fling feature bar, 5,000 square feet of meeting space, 1,500 parking spaces and a 195-room hotel, which includes 27 suites, as well as an indoor pool and hot tub area.
Our Waterloo property is the only gaming facility in the Waterloo, Iowa market and approximately 640,000 people live within 60 miles of the property. We compete with other casinos in eastern Iowa. We generated gaming revenues of approximately $80 million in calendar year 2010.
Colorado
Isle Casino Hotel-Black Hawk
Isle Casino Hotel-Black Hawk commenced operations in December 1998, is located on an approximately 10-acre site and is one of the first gaming facilities reached by customers arriving from Denver via Highway 119, the main thoroughfare connecting Denver to Black Hawk. The property includes a land-based casino with 1,036 slot machines, 24 standard table games, an 11 table poker room, a 238-room hotel and 1,100 parking spaces in an attached parking garage. Isle Casino Hotel-Black Hawk also offers customers three restaurants, including a 128-seat Farraddays' restaurant, a 270-seat Calypso's buffet and a 40-seat Tradewinds Marketplace.
Lady Luck Casino-Black Hawk
Lady Luck Casino-Black Hawk, which we acquired in April 2003 and rebranded in June 2009, is located across the intersection of Main Street and Mill Street from the Isle Casino Hotel-Black Hawk. The property consists of a land-based casino with 524 slot machines, 11 standard table games, 6 poker tables, a 164-room hotel that opened in December 2005 and 1,200 parking spaces in our parking structure connecting Isle Casino Hotel-Black Hawk and Lady Luck Casino-Black Hawk. The property also offers guests dining in its newly renovated and rebranded 79-seat Otis & Henry's restaurant as well as a grab-and-go fast serve food cart that is located in the main level of the facility. The property has also recently converted approximately 2,250 square feet of space to flex space that can be used for meetings and special events. Our Black Hawk sites are connected via sky bridges.
8
When casinos having multiple gaming licenses in the same building are combined, the Black Hawk/Central City market consists of 24 gaming facilities (seven of which have more than 600 slot machines), which in aggregate, generated gaming revenues of approximately $625 million in calendar year 2010. Our Black Hawk properties generated casino revenues for calendar year 2010 of approximately $123 million. Black Hawk is the closest gaming market to the Denver, Colorado metropolitan area, which has a population of approximately 2.9 million and is located approximately 40 miles east of Black Hawk and serves as the primary feeder market for Black Hawk.
Florida
Pompano
In 1995, we acquired Pompano Park, a harness racing track located in Pompano Beach, Florida. Pompano Park is located off of Interstate 95 and the Florida Turnpike on a 223-acre owned site, near Fort Lauderdale, midway between Miami and West Palm Beach. Pompano Park is the only racetrack licensed to conduct harness racing in Florida.
Our Pompano facility includes 1,448 slot machines, a 38-table poker room, four restaurants, a feature bar and 3,800 parking spaces.
Approximately 2.6 million people reside within a 25-mile radius of our Pompano facility, which competes with four other racinos and three Native American gaming facilities in the market. While casino revenues are not available for all market competitors, we estimate that we operate approximately 14% of the slot machines in the market and generated approximately $130 million in casino revenues for calendar year 2010.
Recent Changes to Florida Gaming Laws—In April 2010, changes were made to Florida law which, among other things, lowered our state gaming tax rate from 50% to 35% effective July 1, 2010. This legislation also allows the poker operations to remain open for the same hours as the slot floor and removes the poker betting limits. The changes to Florida law were combined with the approval of a gaming compact between the State of Florida and the Seminole Tribe of Florida. This gaming compact allows the tribe the exclusive right outside of Miami-Dade and Broward counties to operate slot machines and other similar electronic gaming devices and the right to operate live blackjack and baccarat table games for a period of five years at certain tribal gaming locations.
International Operations
Lucaya—We operated a casino in Grand Bahama from December 2003 through November 2009, when we exited the operation.
Blue Chip—We operated casinos in Dudley and Wolverhampton, England. These casinos opened during fiscal 2004 and were operated by us until they were sold in November 2009.
Coventry—We operated a casino in the Coventry Convention Center from July 2007 through April 2009, when we terminated our lease and sold the casino and related assets.
Marketing
Our marketing programs are designed to promote our overall business strategy of providing customers with a safe, clean, friendly and fun gaming experience at each of our properties. We have developed an extensive proprietary database of customers that allows us to create effective targeted marketing and promotional programs that are designed to reward customer loyalty, attract new customers to our properties and maintain high recognition of our brands.
9
Specifically, our marketing programs and initiatives are tailored to support this corporate strategic plan and are generally focused on the following areas:
- •
- Customer Research: Our marketing strategies have been
developed and implemented to meet the needs and desires of our casino customers in each of our locations. In order to assess these needs and desires, we engage in significant customer research in each
of our markets by conducting periodic surveys. Upon receipt of these surveys, we assess the attitudes of our customers and the customers of our competitors' properties towards the most important
attributes of their experience in a regional and/or local gaming facility. We use the extensive information gathered from these research initiatives to make marketing, operating and development
decisions that, we believe, will optimize the position of our properties relative to our competition.
- •
- Branding Initiatives: Our strategic plan is designed to
consolidate our property portfolio from four brands into two brands as the economy improves and we undertake significant new capital improvement programs. To date, we have begun this initiative
through the re-branding of our properties in Caruthersville, Missouri, Marquette, Iowa, and the conversion of Colorado Central Station in Black Hawk, Colorado to Lady
Luck-Black Hawk. As a component of these re-branding programs, we have also implemented newly-branded customer outlets, including custom restaurants and lounges that we are
expanding through our portfolio to other properties. We believe, over time, this approach will allow us to more effectively align and promote our properties based upon customer needs and desires and
market our properties on a consolidated basis. Furthermore, we expect our approach will streamline the costs associated with marketing our portfolio.
- •
- Database Marketing: We have streamlined our database
marketing initiatives across the Company in order to focus our marketing efforts on profitable customers who have demonstrated a willingness to regularly visit our properties. Specifically, we have
focused on eliminating from our database customers who have historically been included in significant marketing efforts but have proven costly either as a result of excessive marketing expenditures on
the part of the Company, or because these customers have become relatively dormant in terms of customer activity.
- •
- Segmentation: We have compiled an extensive database of
customer information over time. Among our most important marketing initiatives, we have introduced database segmentation to our properties and at the corporate level in order to adjust investment
rates to a level at which we expect to meet a reasonable level of customer profit contribution.
- •
- Retail Development: We believe that we must more effectively attract new, non-database customers to our properties in order to increase profitability and free cash flow. These customers are generally less expensive to attract and retain and, therefore, currently represent a significant opportunity for our operations.
Employees
As of April 24, 2011, we employed approximately 8,600 full and part-time people. We have a collective bargaining agreement with UNITE HERE covering approximately 400 employees at our Pompano property which expires in May 2012. We believe that our relationship with our employees is satisfactory.
Governmental Regulations
The gaming and racing industries are highly regulated, and we must maintain our licenses and pay gaming taxes to continue our operations. Each of our facilities is subject to extensive regulation under the laws, rules and regulations of the jurisdiction where it is located. These laws, rules and regulations
10
generally relate to the responsibility, financial stability and character of the owners, managers and persons with financial interests in the gaming operations. Violations of laws in one jurisdiction could result in disciplinary action in other jurisdictions. A more detailed description of the regulations to which we are subject is contained in Exhibit 99.1 to this Annual Report on Form 10-K.
Our businesses are subject to various federal, state and local laws and regulations in addition to gaming regulations. These laws and regulations include, but are not limited to, restrictions and conditions concerning alcoholic beverages, food service, smoking, environmental matters, employees and employment practices, currency transactions, taxation, zoning and building codes, and marketing and advertising. Such laws and regulations could change or could be interpreted differently in the future, or new laws and regulations could be enacted. Material changes, new laws or regulations, or material differences in interpretations by courts or governmental authorities could adversely affect our operating results.
Available Information
For more information about us, visit our web site at www.isleofcapricasinos.com. Our electronic filings with the U.S. Securities and Exchange Commission (including all annual reports on Form 10-K, quarter reports on Form 10-Q, and current reports on Form 8-K, and any amendments to these reports), including the exhibits, are available free of charge through our web site as soon as reasonably practicable after we electronically file them with or furnish them to the U.S. Securities and Exchange Commission.
We face significant competition from other gaming operations, including Native American gaming facilities, that could have a material adverse effect on our future operations.
The gaming industry is intensely competitive, and we face a high degree of competition in the markets in which we operate. We have numerous competitors, including land-based casinos, dockside casinos, riverboat casinos, casinos located on racing, pari-mutuel operations or Native American-owned lands and video lottery and poker machines not located in casinos. Some of our competitors may have better name recognition, marketing and financial resources than we do; competitors with more financial resources may therefore be able to improve the quality of, or expand, their gaming facilities in a way that we may be unable to match.
Legalized gaming is currently permitted in various forms throughout the United States. Certain states have recently legalized, and other states are currently considering legalizing gaming. Our existing gaming facilities compete directly with other gaming properties in the states in which we operate. Our existing casinos attract a significant number of their customers from Houston, Texas; Mobile, Alabama; Kansas City, Kansas; Southern Florida; Little Rock, Arkansas; and Denver, Colorado. Legalization of gaming in jurisdictions closer to these geographic markets other than the jurisdictions in which our facilities are located would have a material adverse effect on our operating results. Other jurisdictions, including states in close proximity to jurisdictions where we currently have operations, have considered and may consider legalizing casino gaming and other forms of competition. In addition, there is no limit on the number of gaming licenses that may be granted in several of the markets in which we operate. As a result, new gaming licenses could be awarded in these markets, which could allow new gaming operators to enter our markets that could have an adverse effect on our operating results. On February 17, 2011, a project was awarded a gaming license in Lake Charles, Louisiana which, if completed, will compete with our existing Lake Charles property.
Our continued success depends upon drawing customers from each of these geographic markets. We expect competition to increase as new gaming operators enter our markets, existing competitors expand their operations, gaming activities expand in existing jurisdictions and gaming is legalized in new jurisdictions. We cannot predict with any certainty the effects of existing and future competition on our operating results.
11
We also compete with other forms of legalized gaming and entertainment such as online computer gambling, bingo, pull tab games, card parlors, sports books, "cruise-to-nowhere" operations, pari-mutuel or telephonic betting on horse racing and dog racing, state-sponsored lotteries, jai-alai, and, in the future, may compete with gaming at other venues. In addition, we compete more generally with other forms of entertainment for the discretionary spending of our customers.
We are subject to extensive regulation from gaming and other regulatory authorities that could adversely affect us.
Licensing requirements. As owners and operators of gaming and pari-mutuel wagering facilities, we are subject to extensive state and local regulation. State and local authorities require us and our subsidiaries to demonstrate suitability to obtain and retain various licenses and require that we have registrations, permits and approvals to conduct gaming operations. The regulatory authorities in the jurisdictions in which we operate have very broad discretion with regard to their regulation of gaming operators, and may for a broad variety of reasons and in accordance with applicable laws, rules and regulations, limit, condition, suspend, fail to renew or revoke a license to conduct gaming operations or prevent us from owning the securities of any of our gaming subsidiaries, or prevent other persons from owning an interest in us or doing business with us. We may also be deemed responsible for the acts and conduct of our employees. Substantial fines or forfeiture of assets for violations of gaming laws or regulations may be levied against us, our subsidiaries and the persons involved, and some regulatory authorities have the ability to require us to suspend our operations. The suspension or revocation of any of our licenses or our operations or the levy on us or our subsidiaries of a substantial fine would have a material adverse effect on our business.
To date, we have demonstrated suitability to obtain and have obtained all governmental licenses, registrations, permits and approvals necessary for us to operate our existing gaming facilities. We cannot assure you that we will be able to retain these licenses, registrations, permits and approvals or that we will be able to obtain any new ones in order to expand our business, or that our attempts to do so will be timely. Like all gaming operators in the jurisdictions in which we operate, we must periodically apply to renew our gaming licenses and have the suitability of certain of our directors, officers and employees approved. We cannot assure you that we will be able to obtain such renewals or approvals.
In addition, regulatory authorities in certain jurisdictions must approve, in advance, any restrictions on transfers of, agreements not to encumber or pledges of equity securities issued by a corporation that is registered as an intermediary company with such state, or that holds a gaming license. If these restrictions are not approved in advance, they will be invalid.
Compliance with other laws. We are also subject to a variety of other federal, state and local laws, rules, regulations and ordinances that apply to non-gaming businesses, including zoning, environmental, construction and land-use laws and regulations governing the serving of alcoholic beverages. Under various federal, state and local laws and regulations, an owner or operator of real property may be held liable for the costs of removal or remediation of certain hazardous or toxic substances or wastes located on its property, regardless of whether or not the present owner or operator knows of, or is responsible for, the presence of such substances or wastes. We have not identified any issues associated with our properties that could reasonably be expected to have an adverse effect on us or the results of our operations. However, several of our properties are located in industrial areas or were used for industrial purposes for many years. As a consequence, it is possible that historical or neighboring activities have affected one or more of our properties and that, as a result, environmental issues could arise in the future, the precise nature of which we cannot now predict. The coverage and attendant compliance costs associated with these laws, regulations and ordinances may result in future additional costs.
12
Regulations adopted by the Financial Crimes Enforcement Network of the U.S. Treasury Department require us to report currency transactions in excess of $10,000 occurring within a gaming day, including identification of the patron by name and social security number. U.S. Treasury Department regulations also require us to report certain suspicious activity, including any transaction that exceeds $5,000 if we know, suspect or have reason to believe that the transaction involves funds from illegal activity or is designed to evade federal regulations or reporting requirements. Substantial penalties can be imposed against us if we fail to comply with these regulations.
Several of our riverboats must comply with U.S. Coast Guard requirements as to boat design, on-board facilities, equipment, personnel and safety and must hold U.S. Coast Guard Certificates of Documentation and Inspection. The U.S. Coast Guard requirements also set limits on the operation of the riverboats and mandate licensing of certain personnel involved with the operation of the riverboats. Loss of a riverboat's Certificate of Documentation and Inspection could preclude its use as a riverboat casino. The U.S. Coast Guard has shifted inspection duties related to permanently moored casino vessels to the individual states. Louisiana and Missouri have elected to utilize the services of the American Bureau of Shipping to undertake the inspections. Iowa has elected to handle the inspections through the Iowa Department of Natural Resources. The states will continue the same inspection criteria as the U.S. Coast Guard in regard to annual and five year inspections. Depending on the outcome of these inspections a vessel could become subject to dry-docking for inspection of its hull, which could result in a temporary loss of service.
We are required to have third parties periodically inspect and certify all of our casino barges for stability and single compartment flooding integrity. Our casino barges and other facilities must also meet local fire safety standards. We would incur additional costs if any of our gaming facilities were not in compliance with one or more of these regulations.
Potential changes in legislation and regulation of our operations. From time to time, legislators and special interest groups have proposed legislation that would expand, restrict or prevent gaming operations in the jurisdictions in which we operate. In addition, from time to time, certain anti-gaming groups have challenged constitutional amendments or legislation that would limit our ability to continue to operate in those jurisdictions in which these constitutional amendments or legislation have been adopted.
Taxation and fees. State and local authorities raise a significant amount of revenue through taxes and fees on gaming activities. We believe that the prospect of significant revenue is one of the primary reasons that jurisdictions permit legalized gaming. As a result, gaming companies are typically subject to significant taxes and fees in addition to normal federal, state, local and provincial income taxes, and such taxes and fees are subject to increase at any time. We pay substantial taxes and fees with respect to our operations. From time to time, federal, state, local and provincial legislators and officials have proposed changes in tax laws, or in the administration of such laws, affecting the gaming industry. Any material increase, or the adoption of additional taxes or fees, could have a material adverse effect on our future financial results.
Our business may be adversely affected by legislation prohibiting tobacco smoking.
Legislation in various forms to ban indoor tobacco smoking has recently been enacted or introduced in many states and local jurisdictions, including several of the jurisdictions in which we operate. If additional restrictions on smoking are enacted in jurisdictions in which we operate, we could experience a significant decrease in gaming revenue and particularly, if such restrictions are not applicable to all competitive facilities in that gaming market, our business could be materially adversely affected.
13
Our substantial indebtedness could adversely affect our financial health and restrict our operations.
We have a significant amount of indebtedness. As of April 24, 2011, we had approximately $1.2 billion of total debt outstanding.
Our significant indebtedness could have important consequences to our financial health, such as:
- •
- limiting our ability to use operating cash flow or obtain additional financing to fund working capital, capital
expenditures, expansion and other important areas of our business because we must dedicate a significant portion of our cash flow to make principal and interest payments on our indebtedness;
- •
- causing an event of default if we fail to satisfy the financial and restrictive covenants contained in the indenture and
agreements governing our senior secured credit facility, our 7.75% senior notes due 2019, our 7% senior subordinated notes due 2014 and our other indebtedness, which could result in all of our debt
becoming immediately due and payable, could permit our secured lenders to foreclose on the assets securing our secured debt and have other adverse consequences, any of which, if not cured or waived,
could have a material adverse effect on us;
- •
- if the indebtedness under our 7.75% senior notes, our 7% senior subordinated notes, our senior secured credit facility, or
our other indebtedness were to be accelerated, there can be no assurance that our assets would be sufficient to repay such indebtedness in full;
- •
- placing us at a competitive disadvantage to our competitors who are not as highly leveraged;
- •
- increasing our vulnerability to and limiting our ability to react to changing market conditions, changes in our industry
and economic downturns or downturns in our business; and
- •
- our agreements governing our indebtedness, among other things, require us to maintain certain specified financial ratios
and to meet certain financial tests. Our debt agreements also limit our ability to:
- i.
- borrow
money;
- ii.
- make
capital expenditures;
- iii.
- use
assets as security in other transactions;
- iv.
- make
restricted payments or restricted investments;
- v.
- incur
contingent obligations; and
- vi.
- sell assets and enter into leases and transactions with affiliates.
A substantial portion of our outstanding debt bears interest at variable rates, although we have entered into interest rate protection agreements expiring through fiscal 2014 with counterparty banks with respect to $320 million of our term loans under our senior secured credit facility. If short-term interest rates rise, our interest cost will increase on the unhedged portion of our variable rate indebtedness, which will adversely affect our results of operations and available cash.
Any of the factors listed above could have a material adverse effect on our business, financial condition and results of operations. We cannot assure you that our business will continue to generate sufficient cash flow, or that future available draws under our senior secured credit facility will be sufficient, to enable us to meet our liquidity needs, including those needed to service our indebtedness.
14
Despite our significant indebtedness, we may still be able to incur significantly more debt. This could intensify the risks described above.
The terms of the indenture and agreements governing our senior secured credit facility, our 7.75% senior notes, our 7% senior subordinated notes and our other indebtedness limit, but do not prohibit, us or our subsidiaries from incurring significant additional indebtedness in the future.
As of April 24, 2011, we had the capacity to incur additional indebtedness, including the ability to incur additional indebtedness under all of our lines of credit, of approximately $175 million. Approximately $23 million of these lines of credit were used to support letters of credit and surety bonds. Our capacity to issue additional indebtedness is subject to the limitations imposed by the covenants in our senior secured credit facility, the indenture governing our 7.75% senior notes and the indenture governing our 7% senior subordinated notes. The indenture governing our 7% senior subordinated notes, the indenture governing our 7.75% senior notes and our senior secured credit facility contain financial and other restrictive covenants, but will not fully prohibit us from incurring additional debt. If new debt is added to our current level of indebtedness, the related risks that we now face could intensify.
If we cannot refinance our 7% senior subordinated notes on or prior to November 1, 2013, then our senior secured credit facility matures on that date and we may not be able to renew or extend our senior secured credit facility or enter into a new credit facility in today's difficult markets. If we are able to refinance our 7% senior subordinated notes or, in the alternative, renew or extend our senior secured credit facility, it may be on terms substantially less favorable than the current notes or senior secured credit facility.
Our senior secured credit facility matures on November 1, 2013 if we have not refinanced or otherwise retired the 7% senior subordinated notes on or prior to such date. Our cash flow from operations is unlikely to be sufficient to retire all of such notes at or prior to November 1, 2013. We may therefore be forced to refinance the 7% senior subordinated notes on materially worse terms than we have currently. Failure to obtain new debt on favorable or reasonable terms to replace existing debt could affect our liquidity and the value of our other securities, including our equity. Our ability to refinance or otherwise retire our 7% senior subordinated notes prior to November 1, 2013, or in the alternative to renew or extend our existing senior secured credit facility or to enter into a new credit facility to replace the existing senior secured credit facility could be impaired if market conditions worsen. In the current environment, lenders may seek more restrictive lending provisions and higher interest rates that may reduce our borrowing capacity and increase our costs. We can make no assurances that we will be able to refinance or otherwise retire our 7% senior subordinated notes prior to November 1, 2013, and if we are unable to do so, that we will be able to enter into a new credit facility or renew or extend our existing senior secured credit facility, or whether any such credit facility will be available under acceptable terms. Failure to obtain sufficient financing or financing on acceptable terms would constrain our ability to operate our business and to continue our development and expansion projects. Any of these circumstances could have a material adverse effect on our business, financial condition and results of operations.
We may not be able to successfully expand to new locations or recover our investment in new properties which would adversely affect our operations and available resources.
We regularly evaluate opportunities for growth through development of gaming operations in existing or new markets, through acquiring or managing other gaming entertainment facilities or through redeveloping our existing facilities. The expansion of our operations, whether through acquisitions, development, management contracts or internal growth, could divert management's attention and could also cause us to incur substantial costs, including legal, professional and consulting
15
fees. To the extent that we elect to pursue any new gaming acquisition, management or development opportunity, our ability to benefit from our investment will depend on many factors, including:
- •
- our ability to successfully identify attractive acquisition and development opportunities;
- •
- our ability to successfully operate any developed, managed or acquired properties;
- •
- our ability to attract and retain competent management and employees for the new locations;
- •
- our ability to secure required federal, state and local licenses, permits and approvals, which in some jurisdictions are
limited in number and subject to intense competition; and
- •
- the availability of adequate financing on acceptable terms.
Many of these factors are beyond our control. There have been significant disruptions in the global capital markets that have adversely impacted the ability of borrowers to access capital. Accordingly, it is likely that we are dependent on free cash flow from operations and remaining borrowing capacity under our senior secured credit facility to implement our near-term expansion plans and fund our planned capital expenditures. As a result of these and other considerations, we cannot be sure that we will be able to recover our investments in any new gaming development or management opportunities or acquired facilities, or successfully expand to additional locations.
We may experience construction delays during our expansion or development projects that could adversely affect our operations.
From time to time we may commence construction projects at our properties. We also evaluate other expansion opportunities as they become available and we may in the future engage in additional construction projects. On December 1, 2010, the Missouri Gaming Commission selected our proposed Cape Girardeau Project for prioritization for the 13th and final gaming license in the State of Missouri. The Cape Girardeau Project is expected to include approximately 1,000 slot machines, 28 table games, 3 restaurants, a lounge and terrace overlooking the Mississippi River and a 750-seat event center at an estimated cost of $125 million. On April 14, 2011, our project at the Nemacolin Woodlands Resort was selected by the Pennsylvania Gaming Control Board for the final Category 3 resort gaming license. We had previously entered into an agreement with Nemacolin to complete the build-out of the casino space and provide management services to the casino. The Nemacolin project is expected to include 600 slot machines, 28 table games, a casual dining restaurant and lounge. We currently estimate the project cost at approximately $50 million and expect to be complete within nine months of the commencement of construction. The anticipated costs and construction periods for the Cape Girardeau Project, the Nemacolin Project and other projects are based upon budgets, conceptual design documents and construction schedule estimates prepared by us in consultation with our architects. Construction projects entail significant risks, which can substantially increase costs or delay completion of a project. Such risks include shortages of materials or skilled labor, unforeseen engineering, environmental or geological problems, work stoppages, weather interference and unanticipated cost increases. Most of these factors are beyond our control. In addition, difficulties or delays in obtaining any of the requisite licenses, permits or authorizations from regulatory authorities can increase the cost or delay the completion of an expansion or development. Significant budget overruns or delays with respect to expansion and development projects could adversely affect our results of operations.
If we construct the Cape Girardeau Project and we are not granted gaming licenses, our financial condition could be materially adversely affected.
On December 1, 2010, the Missouri Gaming Commission selected our proposed Cape Girardeau Project for prioritization for the 13th and final gaming license in the State of Missouri. As a participant in this process, our subsidiary IOC-Cape Girardeau LLC applied for a Class B Riverboat Gaming License in Missouri. The decision by the Missouri Gaming Commission to prioritize its casino
16
development does not provide IOC-Cape Girardeau LLC with any license to open the casino once developed or any assurance that such a license will be granted. The Class B license required for IOC-Cape Girardeau LLC to operate its proposed gaming facility cannot be granted by the Missouri Gaming Commission until the gaming facility development is substantially complete and ready to accept patrons. The grant of this license would be subject to numerous conditions as described in "Description of Government Regulations—Missouri" in Exhibit 99.1 to this Annual Report on Form 10-K for the fiscal year ended April 24, 2011. If, as a result of these regulatory conditions or otherwise, we are unable to receive the gaming license after we construct the Cape Girardeau Project, our financial condition could be materially adversely affected.
If we are not licensed in Pennsylvania in connection with the proposed resort casino at Nemacolin Woodlands Resort or if our management agreement is not approved in its current form or if either of these matters are materially delayed, we may not manage the casino or the terms upon which we manage may be less favorable to us.
On April 14, 2011, the Pennsylvania Gaming Control Board (the "PGCB") awarded a Category 3 slot machine license to Woodlands Fayette, LLC for a resort casino at the Nemacolin Woodlands Resort in Fayette County, Pennsylvania. Although we have a management agreement with Woodlands Fayette to manage the proposed casino, we have not yet been licensed by the PGCB in connection with the casino project, nor has the management agreement been approved by the PGCB. There is no guaranty that we will be approved or that the management agreement will be approved in its current form. Further, the award of the license to Woodlands Fayette is subject to a 30-day appeal period which ends on June 20, 2011. Any such appeals would be made directly to the Pennsylvania Supreme Court and could take a significant period of time before a ruling is made by the court. If such an appeal is filed, it is possible that the PGCB will refrain from most, if not all, rulings regarding the casino project during the pendency of such appeal, including our licensure and approval of the management agreement.
If our key personnel leave us, our business could be adversely affected.
Our continued success will depend, among other things, on the efforts and skills of a few key executive officers and the experience of our property managers. Our ability to retain key personnel is affected by the competitiveness of our compensation packages and the other terms and conditions of employment, our continued ability to compete effectively against other gaming companies and our growth prospects. The loss of the services of any of these key individuals could have a material adverse effect on our business, financial condition and results of operations. We do not maintain "key man" life insurance for any of our employees.
We are effectively controlled by members of the Goldstein Family and their decisions may differ from those that may be made by other stockholders.
Robert S. Goldstein, our Vice Chairman of the Board, and Jeffrey D. Goldstein and Richard A. Goldstein, two of our directors, and various family trusts associated with members of the Goldstein family and entities associated with certain members of the Goldstein family, (collectively the "Goldstein Parties") directly and indirectly collectively own and control approximately 42.6% of our common stock as of April 24, 2011.
The Goldstein Parties have substantial control over the election of our board of directors and the outcome of the vote on substantially all other matters, including amendment of our amended and restated certificate of incorporation, amendment of our by-laws and significant corporate transactions, such as the approval of a merger or other transactions involving a sale of the Company. Such substantial control may have the effect of discouraging transactions involving an actual or potential change of control, which in turn could have a material adverse effect on the market price of our
17
common stock or prevent our stockholders from realizing a premium over the market price for their shares of common stock. The interests of the Goldstein Parties may differ from those of our other stockholders.
Our amended and restated certificate of incorporation contains provisions that could delay and discourage takeover attempts that stockholders may consider favorable.
Certain provisions of our amended and restated certificate of incorporation may make it more difficult or prevent a third party from acquiring control of us, including:
- •
- we may not, until the Supermajority Expiration Time (as defined below), without the affirmative vote of the holders of at
least 662/3% of the Company's voting power, voting as a single class, authorize, adopt or approve certain extraordinary corporate transactions; and
- •
- the classification of our board of directors and staggered three-year terms of service for each class of directors.
"Supermajority Expiration Time" means the first to occur of (i) the Goldstein Group ceasing to hold common stock of the Company representing at least 22.5% of our outstanding common stock, not including any shares of Class B common stock or shares of common stock issued upon conversion of any preferred stock and (ii) April 8, 2021. The "Goldstein Group" means Robert S. Goldstein, our Vice Chairman, and Jeffrey D. Goldstein and Richard A. Goldstein, two of our directors, spouses, children and grandchildren of certain members of the Goldstein family and entities associated with certain members of the Goldstein family.
These provisions may make mergers, acquisitions, tender offers, the removal of management and certain other transactions more difficult or more costly and could discourage or limit stockholder participation in such types of transactions, whether or not such transactions are favored by the stockholders. The provisions also could limit the price that investors might be willing to pay in the future for shares of our common stock. Further, the existence of these anti-takeover measures may cause potential bidders to look elsewhere, rather than initiating acquisition discussions with us. Any of these factors could reduce the price of our common stock.
We have a history of fluctuations in our operating income (losses) from continuing operations, and we may incur additional operating losses from continuing operations in the future. Our operating results could fluctuate significantly on a periodic basis.
We earned income from continuing operations of $1.1 million in fiscal 2011 and sustained a (loss) from continuing operations of $(1.5) million in fiscal 2010. Companies with fluctuations in income (loss) from continuing operations often find it more challenging to raise capital to finance improvements in their businesses and to undertake other activities that return value to their stockholders. In addition, companies with operating results that fluctuate significantly on a quarterly or annual basis experience increased volatility in their stock prices in addition to difficulties in raising capital. We cannot assure you that we will not have fluctuations in our income (losses) from continuing operations in the future, and should that occur, that we would not suffer adverse consequences to our business as a result, which could decrease the value of our common stock.
Inclement weather and other conditions could seriously disrupt our business and have a material, adverse effect on our financial condition and results of operations.
The operations of our facilities are subject to disruptions or reduced patronage as a result of severe weather conditions, natural disasters and other casualties. Because many of our gaming operations are located on or adjacent to bodies of water, these facilities are subject to risks in addition to those associated with other casinos, including loss of service due to casualty, forces of nature,
18
mechanical failure, extended or extraordinary maintenance, flood, hurricane or other severe weather conditions and other disasters. In addition, severe weather such as high winds and blizzards occasionally limits access to our land-based facilities in Colorado. We cannot be sure that the proceeds from any future insurance claim will be sufficient to compensate us if one or more of our casinos experience a closure.
Reductions in discretionary consumer spending could have a material adverse effect on our business.
Our business has been and may continue to be adversely affected by the economic recession currently being experienced in the United States, as we are highly dependent on discretionary spending by our patrons. Changes in discretionary consumer spending or consumer preferences brought about by factors such as increased unemployment, significant increases in energy prices, perceived or actual deterioration in general economic conditions, the current housing market crisis, bank failures and the potential for additional bank failures, perceived or actual decline in disposable consumer income and wealth, the current global economic recession and changes in consumer confidence in the economy may continue to reduce customer demand for the leisure activities we offer and may adversely affect our revenues and operating cash flow. We are not able to predict the length or severity of the current economic circumstances.
The market price of our common stock may fluctuate significantly.
The market price of our common stock has historically been volatile and may continue to fluctuate substantially due to a number of factors, including actual or anticipated changes in our results of operations, the announcement of significant transactions or other agreements by our competitors, conditions or trends in the our industry or other entertainment industries with which we compete, general economic conditions including those affecting our customers' discretionary spending, changes in the cost of air travel or the cost of gasoline, changes in the gaming markets in which we operate and changes in the trading value of our common stock. The stock market in general, as well as stocks in the gaming sector have been subject to significant volatility and extreme price fluctuations that have sometimes been unrelated or disproportionate to individual companies' operating performances. Broad market or industry factors may harm the market price of our common stock, regardless of our operating performance.
Work stoppages, organizing drives and other labor problems could negatively impact our future profits.
Some of our employees are currently represented by a labor union or have begun organizing a drive for labor union representation. Labor unions are making a concerted effort to recruit more employees in the gaming industry. In addition, organized labor may benefit from new legislation or legal interpretations by the current presidential administration. We cannot provide any assurance that we will not experience additional or more successful union activity in the future.
Additionally, lengthy strikes or other work stoppages at any of our casino properties or construction projects could have an adverse effect on our business and result of operations.
We are or may become involved in legal proceedings that, if adversely adjudicated or settled, could impact our financial condition.
From time to time, we are defendants in various lawsuits and gaming regulatory proceedings relating to matters incidental to our business. As with all litigation, no assurance can be provided as to the outcome of these matters and, in general, litigation can be expensive and time consuming. We may not be successful in the defense or prosecution of our current or future legal proceedings, which could result in settlements or damages that could significantly impact our business, financial condition and results of operations.
19
Our insurance coverage may not be adequate to cover all possible losses that our properties could suffer. In addition, our insurance costs may increase and we may not be able to obtain the same insurance coverage in the future.
We may suffer damage to our property caused by a casualty loss (such as fire, natural disasters, acts of war or terrorism), that could severely disrupt our business or subject us to claims by third parties who are injured or harmed. Although we maintain insurance customary in our industry, (including property, casualty, terrorism and business interruption insurance) that insurance may not be adequate or available to cover all the risks to which our business and assets may be subject. The lack of sufficient insurance for these types of acts could expose us to heavy losses if any damages occur, directly or indirectly, that could have a significant adverse impact on our operations.
We renew our insurance policies on an annual basis. The cost of coverage may become so high that we may need to further reduce our policy limits or agree to certain exclusions from our coverage. Among other factors, it is possible that regional political tensions, homeland security concerns, other catastrophic events or any change in government legislation governing insurance coverage for acts of terrorism could materially adversely affect available insurance coverage and result in increased premiums on available coverage (which may cause us to elect to reduce our policy limits), additional exclusions from coverage or higher deductibles. Among other potential future adverse changes, in the future we may elect to not, or may not be able to, obtain any coverage for losses due to acts of terrorism.
The concentration and evolution of the slot machine manufacturing industry could impose additional costs on us.
A large majority of our revenues are attributable to slot machines at our casinos. It is important, for competitive reasons, we offer the most popular and up-to-date slot machine games, with the latest technology to our customers.
In recent years, slot machine manufacturers have frequently refused to sell slot machines featuring the most popular games, instead requiring participating lease arrangements. Generally, a participating lease is substantially more expensive over the long-term than the cost to purchase a new slot machine.
For competitive reasons, we may be forced to purchase new slot machines, slot machine systems, or enter into participating lease arrangements that are more expensive than our current costs associated with the continued operation of our existing slot machines. If the newer slot machines do not result in sufficient incremental revenues to offset the increased investment and participating lease costs, it could adversely affect our profitability.
* * * * * * *
In addition to the foregoing, you should consider each of the factors set forth in this Annual Report in evaluating our business and our prospects. The factors described in our Part 1, Item 1A are not the only ones we face. Additional risks and uncertainties not presently known to us or that we currently consider immaterial may also impair our business operations. This Annual Report is qualified in its entirety by these risk factors. If any of the foregoing risks actually occur, our business, financial condition and results of operation could be materially harmed. In that case, the trading price of our securities, including our common stock, could decline significantly.
ITEM 1B. UNRESOLVED STAFF COMMENTS
None.
20
Lake Charles
We own approximately 2.7 acres and lease approximately 16.2 acres of land in Calcasieu Parish, Louisiana for use in connection with our Lake Charles operations. This lease automatically renewed in March 2010 for five years and we have the option to renew it for 14 additional terms of five years each, subject to increases based on the Consumer Price Index ("CPI") with a minimum of 10% and construction of hotel facilities on the property. We own two hotels in Lake Charles with a total of 493 rooms. Annual rent payments under the Lake Charles lease are approximately $2.1 million.
Lula
We lease approximately 1,000 acres of land in Coahoma County, Mississippi and utilize approximately 50 acres in connection with the operations in Lula, Mississippi. Unless terminated by us at an earlier date, the lease expires in 2033. Rent under the lease is currently 5.5% of gross gaming revenue as reported to the Mississippi Gaming Commission, plus $100,000 annually. We also own approximately 100 acres in Coahoma County, which may be utilized for future development.
Biloxi
We lease the real estate upon which some of our land-based facilities, including the casino, are located from the City of Biloxi and the Mississippi Secretary of State at current annual rent of $595,508 per year, plus 3% of our Biloxi property's gross gaming revenues, net of state and local gaming taxes and fees, in excess of $25.0 million. The lease terminates on July 1, 2014, but it is renewable at our option for four additional terms of five years each and one more option renewal term, concluding on January 31, 2034, subject to rent increases based on the CPI, limited to 6% for each renewal period.
In April 1994, in connection with the construction of a hotel, we entered into a lease for additional land adjoining our Biloxi property. This lease with the City of Biloxi and the Mississippi Secretary of State is for an initial term of 25 years, with options to renew for six additional terms of ten years each and a final option period concluding December 31, 2085. Current annual rent is $665,500 plus 4% of gross non-gaming revenues, as defined in the lease, and renewals are subject to rent increases based on the CPI. The annual rent is adjusted after each five-year period based on increases in the CPI, limited to a 10% increase in any five-year period.
In August 2002, we entered into a lease for two additional parcels of land adjoining our property and the hotel. On the parcel adjoining the Biloxi property, we constructed a multi-level parking garage that has approximately 1,000 parking spaces. There is additional ground level parking on a parcel of land in front of the garage, also subject to this lease, with approximately 600 parking spaces. We have constructed a 400-room addition to the existing hotel on the parcel leased next to the existing hotel. In addition, we may construct a hotel above the parking garage. This lease with the City of Biloxi and the Mississippi Secretary of State is for an initial term of forty years, with one option to renew for an additional twenty-five years and additional options thereafter, with the consent of the Mississippi Secretary of State, consistent with the term of the lease described in the preceding paragraph. When combined with the base and percentage rents described for the leases in the preceding two paragraphs, annual rent under those two leases and this lease was $3.8 million for lease year ending July 31, 2010, and estimated to be $3.8 million for the lease year ending July 31, 2011. Such amounts are subject to decreases due to market adjustments and increases based on the CPI. Also, we are responsible for annual rent equal to 4% of gross retail revenue and gross cash revenue (as defined in the lease), but without double counting. If the rent minimum described in the preceding sentences is not otherwise satisfied from other rents, then this percentage rent is not in addition to the minimum rent, but rather is to be applied to that minimum.
21
We also lease our Biloxi berth from the Biloxi Port Commission at an annual rent of the greater of $510,000 or 1% of the gross gaming revenue net of state and local gaming taxes. The lease terminates on July 1, 2014 and we have the option to renew it for six additional terms of five years each subject to increases based on the CPI, limited to 6% for each renewal period.
In connection with and pursuant to a settlement between the City of Biloxi and the State of Mississippi concerning the control and management of the area where we are located, we also have agreed to pay the City of Biloxi's lease obligations to the State of Mississippi for an agreed upon period of time. This amount is $580,000 per year, payable on June 30, subject to increases based on the CPI and decreases if there are other tenants of the subject property. This obligation ends after June 2018 but may be renewed for thirty years.
Natchez
Through numerous lease agreements, we lease approximately 24 acres of land in Natchez, Mississippi that are used in connection with the operations of our Natchez property. Unless terminated by us at an earlier date, the leases have varying expiration dates through 2037. Annual rent under the leases total approximately $1.2 million. We also lease approximately 7.5 acres of land that is utilized for parking at the facility. We own approximately 6 additional acres of property in Natchez, Mississippi, as well as the property upon which our hotel is located.
Vicksburg
We own approximately 60 acres in Vicksburg, Mississippi which are used in connection with the operations of our Vicksburg property.
Kansas City
We lease approximately 28 acres of land from the Kansas City Port Authority in connection with the operation of our Kansas City property. The term of the original lease was ten years and was renewed in October 2006 for an additional five years. The lease includes seven additional five-year renewal options. The minimum lease payments correspond to any rise or fall in the CPI, initially after the ten-year term of the lease or October 18, 2006 and thereafter, at each five year renewal date. Rent under the lease currently is the greater of $2.6 million (minimum rent) per year, or 3.25% of gross revenues, less complimentaries.
Boonville
We lease our 27 acre casino site in Boonville pursuant to a lease agreement with the City of Boonville. Under the terms of agreement, we lease the site for a period of ninety-nine years. In lieu of rent, we are assessed additional amounts by the City of Boonville based on a 3.5% tax on gaming revenue, up to $1.0 million, which we recognize as additional gaming taxes.
Caruthersville
We own approximately 37 acres, including our riverboat casino and 1,000 parking spaces in Caruthersville, Missouri.
Bettendorf
We own approximately 24.6 acres of land in Bettendorf, Iowa used in connection with the operations of our Bettendorf property. We also operate under a long-term lease with the City of Bettendorf, the QC Waterfront Convention Center that is adjacent to our new hotel tower. Future minimum payments associated with the convention center are approximately $1.1 million per year. We
22
also lease approximately eight acres of land on a month-to-month basis from an entity owned by members of the Goldstein family, including Robert S. Goldstein, our Vice Chairman of the Board and Jeffrey D. Goldstein and Richard A. Goldstein, directors of our company, which we utilize for parking. The initial term of the lease expires 60 days after written notice is given to either party and rent under the lease is currently $60,000 annually. We terminated a lease for warehouse space in January 2010 with the same entity.
Davenport
Pursuant to various lease agreements with the City of Davenport, we lease approximately 12 acres of land in Davenport, Iowa used in connection with the operations of our Davenport property. The aggregate annual rent on these leases is approximately $0.2 million and they have varying expiration dates through 2022.
Marquette
We lease the dock site in Marquette, Iowa that is used in connection with our Marquette operations. The lease expires in 2019, and annual rent under the lease is approximately $180,000, plus $1.00 per passenger, plus 2.5% of gaming revenues (less state wagering taxes) in excess of $20.0 million but less than $40.0 million; 5% of gaming revenues (less state wagering taxes) in excess of $40.0 million but less than $60.0 million; and 7.5% of gaming revenues (less state wagering taxes) in excess of $60.0 million. We have an easement related to an overhead pedestrian bridge and driveway that is an annual payment of approximately $6,300. We also own approximately 25 acres of land for the pavilion, satellite offices, warehouse, lots by the marina and other property.
Waterloo
We own approximately 54 acres of land in Waterloo, Iowa used in connection with the operation of our Waterloo property. We also entered into a three-year lease agreement for 17,517 square feet of warehouse space. Rent under this lease is currently $5,021 per month.
Isle-Black Hawk
We own approximately 10 acres of land in Black Hawk, Colorado for use in connection with our Black Hawk operations. The property leases an additional parcel of land adjoining the Isle-Black Hawk where the Lady Luck Hotel and parking are located. This lease is for an initial term of nine years with options to renew for 18 additional terms of five years each with the final option period concluding June 1, 2094. Annual rent is currently $1.85 million indexed to correspond to any rise or fall in the CPI at one-year intervals, not to exceed a 3% increase or decrease from the previous year's rate.
Lady Luck-Black Hawk
We own or lease approximately seven acres of land in Black Hawk, Colorado for use in connection with the Lady Luck-Black Hawk. The property leases an additional parcel of land near the Lady Luck-Black Hawk for parking as described above. This lease is for an initial term of 10 years with options to renew for nine additional terms of 10 years each with the final option period concluding August 2094. Currently the annual rent is $576,000 and renewals are subject to 20% rent increases over the rate of the previous term.
Pompano
We own approximately 223 acres at Pompano.
23
Other
We own all of the riverboats and barges utilized at our facilities. We also own or lease all of our gaming and non-gaming equipment.
We lease our principal corporate office in Creve Coeur, Missouri, and office space in Biloxi, Mississippi.
We own additional property and have various property leases and options to either lease or purchase property that are not directly related to our existing operations and that may be utilized in the future in connection with expansion projects at our existing facilities or development of new projects.
Our wholly owned subsidiary, Lady Luck Gaming Corporation, and several joint venture partners have been defendants in the Greek Civil Courts and the Greek Administrative Courts in similar lawsuits brought by the country of Greece. The actions allege that the defendants failed to make specified payments in connection with the gaming license bid process for Patras, Greece. Although it is difficult to determine the damages being sought from the lawsuits, the action may seek damages up to that aggregate amount plus interest from the date of the action.
In the Civil Court lawsuit, the Civil Court of First Instance ruled in our favor and dismissed the lawsuit in 2001. Greece appealed to the Civil Appeal Court and, in 2003, the Court rejected the appeal. Greece then appealed to the Civil Supreme Court and, in 2007, the Supreme Court ruled that the matter was not properly before the Civil Courts and should be before the Administrative Court.
In the Administrative Court lawsuit, the Administrative Court of First Instance rejected the lawsuit stating that it was not competent to hear the matter. Greece then appealed to the Administrative Appeal Court, which court rejected the appeal in 2003. Greece then appealed to the Supreme Administrative Court, which remanded the matter back to the Administrative Appeal Court for a hearing on the merits. The re-hearing took place in 2006, and in 2008 the Administrative Appeal Court rejected Greece's appeal on procedural grounds. On December 22, 2008 and January 23, 2009, Greece appealed the ruling to the Supreme Administrative Court. A hearing has tentatively been scheduled for October 2011.
The outcome of this matter is still in doubt and cannot be predicted with any degree of certainty. We intend to continue a vigorous and appropriate defense to the claims asserted in this matter. Through April 24, 2011, we have accrued an estimated liability including interest of $11.7 million. Our accrual is based upon management's estimate of the original claim by the plaintiffs for lost payments. We continue to accrue interest on the asserted claim. We are unable to estimate a total possible loss as information as to possible additional claims, if any, have not been asserted or quantified by the plaintiffs at this time.
We and our wholly-owned subsidiary, Riverboat Corporation of Mississippi ("RCM"), are defendants in a lawsuit filed in the Circuit Court of Adams County, Mississippi by Silver Land, Inc., alleging breach of contract in connection with our 2006 sale of casino operations in Vicksburg, Mississippi, to a third party. In January 2011, the court ruled in favor of Silver Land and scheduled a hearing for damages. The hearing is currently scheduled for September 2011 and Silver Land has asserted damages of approximately $2.4 million plus interest from the original judgment date in January 2011. The outcome of this matter is still in doubt and cannot be predicated with any degree of certainty. We intend to continue a vigorous and appropriate defense to the claims asserted by Silver Land in this matter. After damages are assessed, we plan to appeal the judgment of the circuit court and we believe it is more likely than not we will obtain a favorable ruling on appeal.
24
We are subject to certain federal, state and local environmental protection, health and safety laws, regulations and ordinances that apply to businesses generally, and are subject to cleanup requirements at certain of our facilities as a result thereof. We have not made, and do not anticipate making material expenditures, nor do we anticipate incurring delays with respect to environmental remediation or protection. However, in part because our present and future development sites have, in some cases, been used as manufacturing facilities or other facilities that generate materials that are required to be remediated under environmental laws and regulations, there can be no guarantee that additional pre-existing conditions will not be discovered and we will not experience material liabilities or delays.
We are subject to various contingencies and litigation matters and have a number of unresolved claims. Although the ultimate liability of these contingencies, this litigation and these claims cannot be determined at this time, we believe they will not have a material adverse effect on our consolidated financial position, results of operations or cash flows.
ITEM 4. [REMOVED AND RESERVED]
25
ITEM 5. MARKET FOR REGISTRANT'S COMMON EQUITY, RELATED STOCKHOLDER MATTERS AND ISSUER PURCHASES OF EQUITY SECURITIES
- (a)
- i.
- Market Information. Our common stock is traded on the NASDAQ Global Select Market under the symbol "ISLE". The following table presents the high and low closing sales prices for our common stock as reported by the NASDAQ Global Select Market for the fiscal periods indicated.
| |
High | Low | |||||
|---|---|---|---|---|---|---|---|
First Quarter (through June 13, 2011) |
$ | 9.73 | $ | 7.89 | |||
Fiscal Year Ending April 24, 2011 |
|||||||
Fourth Quarter |
$ | 9.89 | $ | 8.85 | |||
Third Quarter |
11.16 | 7.80 | |||||
Second Quarter |
8.95 | 6.66 | |||||
First Quarter |
12.41 | 8.37 | |||||
Fiscal Year Ending April 25, 2010 |
|||||||
Fourth Quarter |
$ | 11.81 | $ | 7.28 | |||
Third Quarter |
9.41 | 7.21 | |||||
Second Quarter |
12.25 | 9.75 | |||||
First Quarter |
13.78 | 8.65 | |||||
- ii.
- Holders of Common Stock. As of June 13, 2011, there were approximately 1,344 holders of
record of our common stock.
- iii.
- Dividends. We have never declared or paid any dividends with respect to our common stock and
the current policy of our board of directors is to retain earnings to provide for the growth of our company. In addition, our senior secured credit facility and the indentures governing our 7% senior
subordinated notes and our 7.75% senior notes limit our ability to pay dividends. See "Item 8—Financial Statements and Supplementary Data—Isle of Capri
Casinos, Inc.—Notes to Consolidated Financial Statements—Note 8." Consequently, no cash dividends are expected to be paid on our common stock in the foreseeable
future. Further, there can be no assurance that our current and proposed operations would generate the funds needed to declare a cash dividend or that we would have legally available funds to pay
dividends. In addition, we may fund part of our operations in the future from indebtedness, the terms of which may further prohibit or restrict the payment of cash dividends. If a holder of common
stock is disqualified by the regulatory authorities from owning such shares, such holder will not be permitted to receive any dividends with respect to such stock. See
"Item 1—Business—Governmental Regulations."
- (b)
- Issuance of Unregistered Securities
None.
- (c)
- Purchases of our Common Stock
We have purchased our common stock under stock repurchase programs. These programs allow for the repurchase of up to 6,000,000 shares. To date we have purchased 4,895,792 shares of common stock under these programs. These programs have no approved dollar amount, nor expiration dates. No purchases were made during the fiscal year ended April 24, 2011.
26
COMPARISON OF 5 YEAR CUMULATIVE TOTAL RETURN*
Among Isle of Capri Casinos, Inc., the NASDAQ Composite Index
and the Dow Jones US Gambling Index
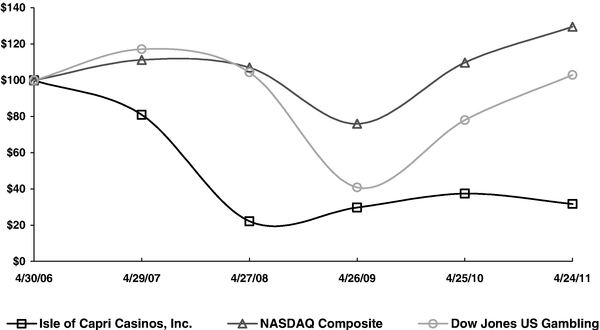
- *
- $100
invested on 4/30/06 in stock or index, including reinvestment of dividends.
Indexes calculated on month-end basis.
Copyright© 2011 Dow Jones & Co. All rights reserved.
27
ITEM 6. SELECTED FINANCIAL DATA.
The following table presents our selected consolidated financial data for the five most recent fiscal years, which is derived from our audited consolidated financial statements and the notes to those statements. Because the data in this table does not provide all of the data contained in our consolidated financial statements, including the related notes, you should read "Management's Discussion and Analysis of Financial Condition and Results of Operations," our consolidated financial statements, including the related notes contained elsewhere in this document and other data we have filed with the U.S. Securities and Exchange Commission.
| |
Fiscal Year Ended(1) | ||||||||||||||||||
|---|---|---|---|---|---|---|---|---|---|---|---|---|---|---|---|---|---|---|---|
| |
April 24, 2011 |
April 25, 2010 |
April 26, 2009 |
April 27, 2008 |
April 29, 2007 |
||||||||||||||
| |
(dollars in millions, except per share data) |
||||||||||||||||||
Statement of Operations |
|||||||||||||||||||
Revenues: |
|||||||||||||||||||
Casino |
$ | 1,036.5 | $ | 1,013.4 | $ | 1,055.7 | $ | 1,092.3 | $ | 991.4 | |||||||||
Rooms |
40.3 | 43.0 | 46.4 | 49.5 | 49.6 | ||||||||||||||
Food, beverage, pari-mutuel and other |
134.7 | 135.0 | 138.6 | 150.1 | 145.6 | ||||||||||||||
Hurricane and other insurance recoveries |
— | — | 62.9 | 0.4 | 2.8 | ||||||||||||||
Gross revenues |
1,211.5 | 1,191.4 | 1,303.6 | 1,292.3 | 1,189.4 | ||||||||||||||
Less promotional allowances |
(206.5 | ) | (191.6 | ) | (195.6 | ) | (200.9 | ) | (214.1 | ) | |||||||||
Net revenues |
1,005.0 | 999.8 | 1,108.0 | 1,091.4 | 975.3 | ||||||||||||||
Operating expenses: |
|||||||||||||||||||
Casino |
158.6 | 153.8 | 151.6 | 151.1 | 154.2 | ||||||||||||||
Gaming taxes |
250.1 | 262.2 | 269.9 | 285.4 | 213.7 | ||||||||||||||
Rooms |
9.8 | 10.9 | 12.3 | 12.5 | 10.6 | ||||||||||||||
Food, beverage, pari-mutuel and other |
45.0 | 44.8 | 51.5 | 57.0 | 44.6 | ||||||||||||||
Marine and facilities |
60.5 | 61.5 | 64.4 | 65.5 | 58.5 | ||||||||||||||
Marketing and administrative |
253.4 | 253.1 | 256.2 | 270.1 | 256.4 | ||||||||||||||
Corporate and development |
42.7 | 46.8 | 41.3 | 47.3 | 56.1 | ||||||||||||||
Expense recoveries and other charges, net |
— | (6.8 | ) | 36.1 | 6.5 | 7.8 | |||||||||||||
Hurricane and other insurance recoveries |
— | — | (32.3 | ) | (1.8 | ) | — | ||||||||||||
Preopening |
— | — | — | 3.7 | 11.4 | ||||||||||||||
Depreciation and amortization |
89.0 | 109.5 | 122.5 | 128.9 | 96.7 | ||||||||||||||
Total operating expenses |
909.1 | 935.8 | 973.5 | 1,026.2 | 910.0 | ||||||||||||||
Operating income |
95.9 | 64.0 | 134.5 | 65.2 | 65.3 | ||||||||||||||
Interest expense |
(91.9 | ) | (75.4 | ) | (92.0 | ) | (106.8 | ) | (88.1 | ) | |||||||||
Interest income |
1.9 | 1.8 | 2.1 | 3.2 | 7.0 | ||||||||||||||
Other |
(1.2 | ) | (0.3 | ) | — | — | — | ||||||||||||
Gain (loss) on early extinguishment of debt |
— | — | 57.7 | (15.3 | ) | — | |||||||||||||
Income (loss) from continuing operations before income taxes and including noncontolling interest |
4.7 | (9.9 | ) | 102.3 | (53.7 | ) | (15.8 | ) | |||||||||||
Income tax benefit (provision) |
(3.6 | ) | 8.4 | (41.1 | ) | 20.9 | 0.8 | ||||||||||||
Income (loss) from continuing operations including noncontrolling interest |
1.1 | (1.5 | ) | 61.2 | (32.8 | ) | (15.0 | ) | |||||||||||
Income (loss) from discontinued operations, net of income taxes |
3.4 | (1.8 | ) | (17.6 | ) | (59.2 | ) | 13.9 | |||||||||||
Net income (loss) including noncontolling interest |
4.5 | (3.3 | ) | 43.6 | (92.0 | ) | (1.1 | ) | |||||||||||
Less net income (loss) attributable to the nocontrolling interest |
— | — | — | (4.9 | ) | (3.5 | ) | ||||||||||||
Net income (loss) attributable to common stockholders |
$ | 4.5 | $ | (3.3 | ) | $ | 43.6 | $ | (96.9 | ) | $ | (4.6 | ) | ||||||
Income (loss) per common share attributable to common stockholders |
|||||||||||||||||||
Basic |
|||||||||||||||||||
Income (loss) from continuing operations |
$ | 0.03 | $ | (0.05 | ) | $ | 1.95 | $ | (1.24 | ) | $ | (0.61 | ) | ||||||
Income (loss) from discontinued operations |
0.10 | (0.05 | ) | (0.56 | ) | (1.92 | ) | 0.46 | |||||||||||
Net Income (loss) |
$ | 0.13 | $ | (0.10 | ) | $ | 1.39 | $ | (3.16 | ) | $ | (0.15 | ) | ||||||
Diluted |
|||||||||||||||||||
Income (loss) from continuing operations |
$ | 0.03 | $ | (0.05 | ) | $ | 1.95 | $ | (1.24 | ) | $ | (0.61 | ) | ||||||
Income (loss) from discontinued operations |
0.10 | (0.05 | ) | (0.56 | ) | (1.92 | ) | 0.46 | |||||||||||
Net Income (loss) |
$ | 0.13 | $ | (0.10 | ) | $ | 1.39 | $ | (3.16 | ) | $ | (0.15 | ) | ||||||
28
| |
Fiscal Year Ended(1) | ||||||||||||||||
|---|---|---|---|---|---|---|---|---|---|---|---|---|---|---|---|---|---|
| |
April 24, 2011 |
April 25, 2010 |
April 26, 2009 |
April 27, 2008 |
April 29, 2007 |
||||||||||||
| |
(dollars in millions, except per share data) |
||||||||||||||||
Other Data: |
|||||||||||||||||
Net cash provided by (used in): |
|||||||||||||||||
Operating activities |
$ | 123.7 | $ | 106.4 | $ | 190.6 | $ | 133.4 | $ | 70.9 | |||||||
Investing activities |
(144.6 | ) | (31.0 | ) | (27.9 | ) | (302.4 | ) | (197.3 | ) | |||||||
Financing activities |
28.1 | (104.0 | ) | (157.2 | ) | 72.5 | 193.5 | ||||||||||
Capital expenditures |
(58.6 | ) | (27.7 | ) | (58.6 | ) | (190.5 | ) | (451.4 | ) | |||||||
Balance Sheet Data: |
|||||||||||||||||
Cash and cash equivalents |
$ | 75.2 | $ | 68.1 | $ | 96.7 | $ | 91.8 | $ | 188.1 | |||||||
Total assets |
1,733.9 | 1,674.8 | 1,782.7 | 1,974.2 | 2,075.7 | ||||||||||||
Long-term debt, including current portion |
1,192.6 | 1,200.9 | 1,301.1 | 1,507.3 | 1,418.0 | ||||||||||||
Stockholders' equity |
309.0 | 240.2 | 228.4 | 188.0 | 281.8 | ||||||||||||
Operating Data: |
|||||||||||||||||
Number of slot machines |
14,947 | 14,579 | 15,373 | 15,393 | 14,121 | ||||||||||||
Number of table games |
375 | 368 | 369 | 387 | 324 | ||||||||||||
Number of hotel rooms |
3,078 | 3,079 | 3,104 | 3,107 | 2,674 | ||||||||||||
Number of parking spaces |
21,782 | 20,696 | 22,290 | 21,229 | 19,484 | ||||||||||||
- (1)
- Our fiscal year ended April 30, 2006 includes 53 weeks while all other fiscal years include 52 weeks. The results reflect Lucaya, Blue Chip, Coventry, Bossier City and our previous Vicksburg properties as discontinued operations. We opened new casino operations in Pompano, Florida and Waterloo, Iowa in April 2007 and June 2007, respectively. We acquired our casino operations in Caruthersville, Missouri in June 2007. We acquired our current casino operations in Vicksburg, Mississippi in June 2010.
29
ITEM 7. MANAGEMENT'S DISCUSSION AND ANALYSIS OF FINANCIAL CONDITION AND RESULTS OF OPERATIONS
You should read the following discussion together with the financial statements, including the related notes and the other financial information, contained in this Annual Report on Form 10-K.
Executive Overview
We are a leading developer, owner and operator of branded gaming facilities and related lodging and entertainment facilities in regional markets in the United States. We have sought and established geographic diversity to limit the risks caused by weather, regional economic difficulties, gaming tax rates and regulations of local gaming authorities. We currently operate casinos in Mississippi, Louisiana, Missouri, Iowa, Colorado and Florida. We also operate a harness racing track at our casino in Florida.
Significant Accomplishments Impacting Current and Future Operations—During the fiscal year ended April 24, 2011, we completed several significant accomplishments as follows:
Acquisition
Acquisition of Rainbow Casino—We acquired Rainbow Casino—Vicksburg Partnership, L.P. ("Rainbow") located in Vicksburg, Mississippi on June 8, 2010 acquiring 100% of the partnership interests for $76.2 million and have included the results of Rainbow in our consolidated financial statements subsequent to June 8, 2010. The acquisition was funded by borrowings from our senior secured credit facility.
Capital Transactions
Equity Offering—During January 2011, we completed the sale of 5.3 million shares of common stock generating net proceeds of $51.2 million. Proceeds from our equity offering have been used to repay long-term debt.
Senior Notes—On March 7, 2011, we issued $300 million of 7.75% senior notes due 2019. Proceeds from this debt issuance were used to repay borrowings under our senior secured credit facility.
Senior Secured Credit Facility—On March 25, 2011, we amended our senior secured credit facility. Following this amendment, our credit facility totals $800 million, consisting of a $300 million revolving line of credit and a $500 million term loan. The credit facility matures on November 1, 2013, or if the 7% senior subordinated notes are refinanced on or prior to that date, the revolving line of credit matures on March 25, 2016 and the term loan matures on March 25, 2017.
These equity and debt transactions have resulted in a reduction in our total debt, extension of our maturities and provide borrowing capacity to fund current and future capital expenditures for both our existing properties and for our development projects.
Development Activities
Cape Girardeau—On December 1, 2010, our proposed casino in Cape Girardeau, Missouri was selected by the Missouri Gaming Commission for prioritization for the 13th and final gaming license in the State of Missouri. We had previously entered into a development agreement with the City of Cape Girardeau. The project is expected to include 1,000 slot machines, 28 table games, three restaurants, a lounge and terrace overlooking the Mississippi River and a 750-seat event
30
center. We currently estimate the cost of the project at approximately $125 million with $13.0 million spent through April 24, 2011. We anticipate opening by the end of calendar 2012.
Nemacolin—On April 14, 2011, our proposed project at the Nemacolin Woodlands Resort was selected by the Pennsylvania Gaming Control Board for the final category 3 gaming license in Pennsylvania. We had previously entered into an agreement with Nemacolin to complete the build-out of the casino space and provide management services of the casino. The casino is expected to include 600 slot machines, 28 table games, a casual dining restaurant and lounge. We will pay an annual fee to the resort owner and in return will receive a management fee equal to the EBITDA of the casino after payment of the fee to Nemacolin. We currently estimate the cost of the project at approximately $50 million and expect to be complete within nine months of the commencement of construction. The award of the license to Nemacolin is subject to a 30-day appeal period, which ends on June 20, 2011, and the obtainment of a management license.
Operating Results—Our operating results for the periods presented have been affected, both positively and negatively, by current economic conditions and several other factors discussed in detail below. Our historical operating results may not be indicative of our future results of operations because of these factors and the changing competitive landscape in each of our markets, as well as by factors discussed elsewhere herein. This Management's Discussion and Analysis of Financial Condition and Results of Operations should be read in conjunction with and giving consideration to the following:
Items Impacting Income (Loss) from Continuing Operations—Significant items impacting our income (loss) from continuing operations during the fiscal years ended April 24, 2011, April 25, 2010 and April 26, 2009 are as follows:
Florida Gaming Law Changes—Effective July 1, 2010, the state portion of gaming taxes applicable to our Pompano property was reduced from 50% to 35% of gaming revenues. Additionally, this legislation removed poker betting limits and allowed us to expand our poker hours from 12 hours per day to 18 hours per day Monday through Thursday and 24 hours per day on Friday through Sunday. Our casino revenues and gaming taxes reflect the favorable impact of these changes in state gaming laws.
Increased Competition—The opening of a new hotel in October 2009 by a competitor in Black Hawk, Colorado has had a negative impact on our Black Hawk, Colorado property.
Expense Recoveries and Other Charges, net—During fiscal 2010, we recorded an other expense reduction of $6.8 million representing the discounted value of a receivable for reimbursement of development costs expensed in prior periods relating to a terminated plan to develop a casino in Pittsburgh, Pennsylvania. This receivable was recorded following our assessment of collectability.
As a result of our annual impairment tests of goodwill and long-lived intangible assets under ASC 350, we recorded impairment charges of $18.3 million at our Black Hawk property in fiscal 2009. The results from operations for fiscal 2009 also include a $11.9 million write-off of construction in progress at our Biloxi property following our decision not to continue a previously anticipated construction project, and a $6.0 million charge following our termination of an agreement for a potential development of a casino in Portland, Oregon.
Hurricane and Other Insurance Recoveries, net—Our insurance recoveries for fiscal 2009 include $92.2 million relating to the final settlement of our Hurricane Katrina claim at our Biloxi property and other insurance recoveries.
Gain (Loss) on Early Extinguishment of Debt—During fiscal 2009, we retired $142.7 million of our senior subordinated notes, through a tender offer, for a cash payment of $82.8 million utilizing the proceeds from our Hurricane Katrina settlement and repaid
31
$35.0 million of our variable rate term loans as required under our senior secured credit facility. After expenses related to the elimination of deferred financing costs and transactions costs, we recognized a net pretax gain of $57.7 million related to these transactions.
Discontinued Operations—Discontinued operations include the results of our international operations including our former Blue Chip, Grand Bahamas and Coventry casino operations. During fiscal 2010, we completed the sale of our Blue Chip casino properties under a plan of administration and have no continuing involvement in its operation. During fiscal 2009, we recorded a $1.4 million charge to reduce the Blue Chip assets held for sale to their estimated fair value. During fiscal 2011 we recognized a gain of $2.7 million, including tax benefits of $1.2 million, upon completion of the administration process. We also recognized in fiscal 2011 a tax benefit of $0.8 million in discontinued operations representing the resolution of previously unrecognized tax positions following the completion of certain federal tax reviews.
On April 23, 2009, we completed the sale of our assets and terminated our lease of Arena Coventry Convention Center relating to our casino operations in Coventry, England. Our lease termination costs and other expenses, net of cash proceeds from our assets sales, resulted in a pretax charge of $12.0 million recorded in fiscal 2009 related to our discontinued Coventry operations.
The exit from our Grand Bahamas casino operations was substantially completed during November 2009.
Flooding—Due to flooding along the Mississippi River, certain of our properties have been closed during fiscal 2011 and subsequent to our fiscal 2011 year-end. Our Davenport property closed on April 15, 2011, 10 days prior to our fiscal year end and did not reopen until May 1, 2011. Subsequent to year end our Caruthersville and Vicksburg properties were closed for 13 and 17 days respectively. Our Lula property closed on May 3, 2011 and partially reopened on June 3, 2011. Our Natchez property closed on May 7, 2011 and will remain closed until the Mississippi River recedes further. While we maintain insurance coverage subject to various deductibles, recognition of certain business interruption insurance proceeds are contingent upon filing and settlement of our insurance claims in future periods.
Results of Operations
Our results of continuing operations for the fiscal years ended April 24, 2011, April 25, 2010 and April 26, 2009 reflect the consolidated operations of all of our subsidiaries. Our former international operations, consisting of Coventry, Blue Chip and Lucaya are presented as discontinued operations. The results for our fiscal year 2009 have been reclassified to reflect the classification of all international operations as discontinued operations as well as to conform our financial presentation to our current year financial statement format. Our Lucaya operations were classified as discontinued operations in the third quarter of fiscal 2010, and our Coventry and Blue Chip Casino operations were classified as discontinued operations in the fourth quarter of fiscal 2009.
Our fiscal year ends on the last Sunday in April. This fiscal year convention creates more comparability of our quarterly operations, by generally having an equal number of weeks (13) and weekend days (26) in each quarter. Periodically, this convention necessitates a 53-week year. The fiscal years ended April 24, 2011, April 25, 2010 and April 26, 2009 were all 52-week years.
32
ISLE OF CAPRI CASINOS, INC.
(In thousands)
| |
Net Revenues Fiscal Year Ended | Operating Income (Loss) Fiscal Year Ended |
||||||||||||||||||
|---|---|---|---|---|---|---|---|---|---|---|---|---|---|---|---|---|---|---|---|---|
(in thousands)
|
April 24, 2011 |
April 25, 2010 |
April 26, 2009 |
April 24, 2011 |
April 25, 2010 |
April 26, 2009 |
||||||||||||||
Mississippi |
||||||||||||||||||||
Biloxi |
$ | 68,335 | $ | 72,602 | $ | 83,880 | $ | (6,011 | ) | $ | (8,306 | ) | $ | (7,952 | ) | |||||
Natchez |
30,787 | 32,826 | 37,023 | 7,591 | 8,868 | 10,811 | ||||||||||||||
Lula |
67,340 | 68,147 | 70,985 | 12,471 | 10,692 | 11,498 | ||||||||||||||
Vicksburg(1) |
27,935 | 4,188 | ||||||||||||||||||
Mississippi Total |
194,397 | 173,575 | 191,888 | 18,239 | 11,254 | 14,357 | ||||||||||||||
Louisiana |
||||||||||||||||||||
Lakes Charles |
131,214 | 139,423 | 152,112 | 13,638 | 13,317 | 22,041 | ||||||||||||||
Missouri |
||||||||||||||||||||
Kansas City |
77,710 | 76,815 | 74,435 | 14,619 | 13,717 | 10,369 | ||||||||||||||
Boonville |
78,776 | 77,759 | 78,582 | 22,670 | 21,125 | 20,737 | ||||||||||||||
Caruthersville |
33,696 | 32,685 | 31,579 | 3,909 | 3,853 | 1,638 | ||||||||||||||
Missouri Total |
190,182 | 187,259 | 184,596 | 41,198 | 38,695 | 32,744 | ||||||||||||||
Iowa |
||||||||||||||||||||
Bettendorf |
79,003 | 79,527 | 91,661 | 13,386 | 12,624 | 20,090 | ||||||||||||||
Davenport |
43,651 | 48,075 | 49,005 | 8,171 | 10,494 | 10,351 | ||||||||||||||
Marquette |
27,397 | 27,176 | 29,875 | 3,780 | 1,330 | 3,705 | ||||||||||||||
Waterloo |
83,197 | 81,261 | 80,544 | 17,953 | 11,614 | 11,377 | ||||||||||||||
Iowa Total |
233,248 | 236,039 | 251,085 | 43,290 | 36,062 | 45,523 | ||||||||||||||
Colorado |
||||||||||||||||||||
Black Hawk |
115,482 | 126,140 | 123,382 | 10,993 | 14,891 | 14,688 | ||||||||||||||
Florida |
||||||||||||||||||||
Pompano |
138,704 | 135,998 | 142,672 | 12,030 | (6,951 | ) | (6,434 | ) | ||||||||||||
Insurance recoveries(2) |
— |
— |
61,845 |
— |
— |
94,073 |
||||||||||||||
Expense recoveries and other charges, net(3) |
— | — | — | — | 6,762 | (36,125 | ) | |||||||||||||
Corporate and other |
1,768 | 1,402 | 455 | (43,468 | ) | (49,974 | ) | (46,335 | ) | |||||||||||
From continuing operations |
$ | 1,004,995 | $ | 999,836 | $ | 1,108,035 | $ | 95,920 | $ | 64,056 | $ | 134,532 | ||||||||
Note: This table excludes our international properties which have been classified as discontinued operations.
- (1)
- Reflects
results since the June 2010 acquisition effective date.
- (2)
- Insurance
recoveries include business interruption proceeds of $62,932, included in net revenues in fiscal 2009. $61,845 of this amount relates to
settlement for events that occurred prior to fiscal 2009 (primarily Hurricane Katrina)
- (3)
- Expense recoveries and other charges include expense recoveries, valuations and other charges. See Executive Overview—Expense Recoveries and Other Charges, net for a detailed discussion of such items.
33
Fiscal 2011 Compared to Fiscal 2010
Revenues
Revenues for the fiscal years 2011 and 2010 are as follows:
| |
Fiscal Year Ended | |
|
||||||||||||||
|---|---|---|---|---|---|---|---|---|---|---|---|---|---|---|---|---|---|
(in thousands)
|
April 24, 2011 |
April 25, 2010 |
Variance | Percentage Variance |
|||||||||||||
Revenues: |
|||||||||||||||||
Casino |
$ | 1,036,538 | $ | 1,013,386 | $ | 23,152 | 2.3 | % | |||||||||
Rooms |
40,271 | 43,007 | (2,736 | ) | (6.4 | )% | |||||||||||
Food, beverage, pari-mutuel and other |
134,725 | 134,994 | (269 | ) | (0.2 | )% | |||||||||||
Gross revenues |
1,211,534 | 1,191,387 | 20,147 | 1.7 | % | ||||||||||||
Less promotional allowances |
(206,539 | ) | (191,551 | ) | (14,988 | ) | (7.8 | )% | |||||||||
Net revenues |
$ | 1,004,995 | $ | 999,836 | 5,159 | 0.5 | % | ||||||||||
Casino Revenues—Casino revenues increased $23.2 million, or 2.3%, in fiscal 2011 compared to fiscal 2010. For fiscal 2011, casino revenues increased $8.9 million at our Pompano property, and included $36.8 million from our Vicksburg casino. These increases were offset by decreased casino revenues at our Black Hawk and Quad Cities properties of $15.2 million reflecting the impact of competition and a decrease at our Lake Charles, Lula, Natchez and Biloxi properties of approximately $13.5 million primarily due to current economic conditions. Our other properties combined for a net increase of $6.2 million in casino revenues.
Rooms Revenue—Rooms revenue decreased $2.7 million, or 6.4%, in fiscal 2011 compared to fiscal 2010. The majority of this decrease has occurred at our Black Hawk property where we have experienced declines in both room rates and occupancy following the opening of a competitor's new hotel during October 2009 and at our Biloxi property where market and economic conditions resulted in reduced overall hotel room rates.
Pari-mutuel, Food, Beverage and Other Revenues —Pari-mutuel, food, beverage and other revenues decreased $0.3 million, or 0.2%, in fiscal 2011 compared to fiscal 2010. Food, beverage and other revenues for fiscal 2011 included $2.3 million from our recently acquired Vicksburg casino.
Promotional Allowances—Promotional allowances increased $15.0 million, or 7.8%, in fiscal 2011 compared to fiscal 2010. Promotional allowances for fiscal 2011 included $11.1 million from our Vicksburg casino. At our existing properties, changes in our promotional allowances reflect revisions to our marketing plans as a result of competitive factors, economic conditions and regulations.
34
Operating Expenses
Operating expenses for the fiscal years 2011 and 2010 are as follows:
| |
Fiscal Year Ended | |
|
||||||||||||
|---|---|---|---|---|---|---|---|---|---|---|---|---|---|---|---|
(in thousands)
|
April 24, 2011 |
April 25, 2010 |
Variance | Percentage Variance |
|||||||||||
Operating expenses: |
|||||||||||||||
Casino |
$ | 158,580 | $ | 153,838 | $ | 4,742 | 3.1 | % | |||||||
Gaming taxes |
250,102 | 262,241 | (12,139 | ) | (4.6 | )% | |||||||||
Rooms |
9,793 | 10,845 | (1,052 | ) | (9.7 | )% | |||||||||
Food, beverage, pari-mutuel and other |
44,943 | 44,760 | 183 | 0.4 | % | ||||||||||
Marine and facilities |
60,485 | 61,507 | (1,022 | ) | (1.7 | )% | |||||||||
Marketing and administrative |
253,423 | 253,097 | 326 | 0.1 | % | ||||||||||
Corporate and development |
42,709 | 46,750 | (4,041 | ) | (8.6 | )% | |||||||||
Expense recoveries and other charges, net |
— | (6,762 | ) | 6,762 | (100.0 | )% | |||||||||
Hurricane and other insurance recoveries |
— | — | — | N/M | |||||||||||
Depreciation and amortization |
89,040 | 109,504 | (20,464 | ) | (18.7 | )% | |||||||||
Total operating expenses |
$ | 909,075 | $ | 935,780 | (26,705 | ) | (2.9 | )% | |||||||
Casino—Casino operating expenses increased $4.7 million, or 3.1% for fiscal 2011 compared to fiscal 2010. Excluding casino costs of $4.8 million incurred by our Vicksburg casino, our casino costs would have decreased $0.1 million. This net change in casino operating expenses reflects net cost reductions in casino expense at most of our properties offset by a slight increase in casino expenses at our Pompano property following the expansion of gaming hours effective July 1, 2010.
Gaming Taxes—State and local gaming taxes decreased $12.1 million, or 4.6% for fiscal 2011 compared to fiscal 2010. Reductions in gaming taxes for fiscal 2011 reflect the decrease in state gaming taxes at our Pompano facility from 50% to 35% effective July 1, 2010 and changes in the mix of our gaming revenues derived from states with different gaming tax rates. Gaming taxes for fiscal 2011 included $3.2 million from our Vicksburg casino.
Rooms—Rooms expenses decreased by $1.1 million or 9.7% in fiscal 2011 compared to fiscal 2010. This decrease in rooms expense is reflective of a 6.4% reduction in our hotel revenues for fiscal 2011, respectively, as compared to fiscal 2010.
Pari-mutuel, Food, Beverage and Other—Pari-mutuel, food, beverage and other expenses were relatively flat for fiscal 2011 compared to fiscal 2010. Excluding food beverage and other costs of $1.1 million incurred by our Vicksburg casino, our food, beverage and other expenses would have decreased $0.9 million.
Marine and Facilities—Marine and facilities expenses decreased $1.0 million, or 1.7% for fiscal 2011 compared to fiscal 2010. Excluding marine and facility costs of $1.4 million incurred by our acquired Vicksburg casino, our marine and facility costs would have decreased $2.4 million. This decrease includes reductions in facility costs across most properties as we continue to focus on cost reductions efforts.
Marketing and Administrative—Marketing and administrative expenses increased $0.3 million, or 0.1% for fiscal 2011 compared to fiscal 2010. Excluding marketing and administrative costs of $8.6 million incurred by our Vicksburg casino, our marketing and administrative costs would have
35
decreased $8.3 million. These decreases reflect reductions in our operating cost to align such expenditures with changes in visitation and spend per visit by our customers.
Corporate and Development—During fiscal 2011, our corporate and development expenses were $42.7 million compared to $46.8 million for fiscal 2010. The net decrease in corporate and development expense reflects decreases in insurance costs and incentive compensation. Corporate and development expenses for fiscal 2011 include financing related costs of $4.0 million and development and acquisition costs of $4.0 million. In fiscal 2010 we incurred $1.8 million in costs related to an amendment of our senior credit facility.
Depreciation and Amortization—Depreciation and amortization expense for fiscal 2011 compared to fiscal 2010 decreased $20.5 million, primarily due to certain assets becoming fully depreciated offset by depreciation at Vicksburg of $4.6 million.
Other Income (Expense), Income Taxes and Discontinued Operations
Interest expense, interest income, derivative expense, income tax (provision) benefit and income from discontinued operations, net of income taxes for the fiscal years 2011 and 2010 are as follows:
| |
Fiscal Year Ended | |
|
||||||||||
|---|---|---|---|---|---|---|---|---|---|---|---|---|---|
(in thousands)
|
April 24, 2011 |
April 25, 2010 |
Variance | Percentage Variance |
|||||||||
Interest expense |
$ | (91,934 | ) | $ | (75,434 | ) | $ | (16,500 | ) | 21.9 | % | ||
Interest income |
1,916 | 1,833 | 83 | 4.5 | % | ||||||||
Derivative expense |
(1,214 | ) | (370 | ) | (844 | ) | N/M | ||||||
Income tax (provision) benefit |
(3,600 | ) | 8,374 | (11,974 | ) | (143.0 | )% | ||||||
Income (loss) from discontinued operations, net of income taxes |
3,452 | (1,732 | ) | 5,184 | (299.3 | )% | |||||||
Interest Expense—Interest expense increased $16.5 million, or 21.9%, in fiscal 2011 compared to fiscal 2010 primarily due increased interest rates on borrowings under our senior secured credit facility following our amendment of this facility during the fourth quarter of fiscal 2010 and higher outstanding borrowings following our acquisition of Vicksburg casino during June 2010. Fiscal 2011 interest expense includes a $3.2 million write-off of deferred financing costs as a result of the amendment of our senior secured credit facility during the fourth quarter and a $8.5 million decrease in interest associated with our interest rate swaps as certain of our swaps have matured.
Income Tax (Provision) Benefit—Our income tax (provision) benefit from continuing operations and our effective income tax rate have been impacted by our state income taxes and our income for financial statement purposes as well as our percentage of permanent and other items in relation to our income or loss. During fiscal 2010, our effective income tax rate was also impacted by our settlement of certain tax liabilities for $4.7 million less than our estimated accrual.
36
Fiscal 2010 Compared to Fiscal 2009
Revenues
Revenues for the fiscal years 2010 and 2009 are as follows:
| |
Fiscal Year Ended | |
|
||||||||||||||
|---|---|---|---|---|---|---|---|---|---|---|---|---|---|---|---|---|---|
(in thousands)
|
April 25, 2010 |
April 26, 2009 |
Variance | Percentage Variance |
|||||||||||||
Revenues: |
|||||||||||||||||
Casino |
$ | 1,013,386 | $ | 1,055,694 | $ | (42,308 | ) | (4.0 | )% | ||||||||
Rooms |
43,007 | 46,380 | (3,373 | ) | (7.3 | )% | |||||||||||
Food, beverage, pari-mutuel and other |
134,994 | 138,632 | (3,638 | ) | (2.6 | )% | |||||||||||
Hurricane and other insurance recoveries |
— | 62,932 | (62,932 | ) | N/M | ||||||||||||
Gross revenues |
1,191,387 | 1,303,638 | (112,251 | ) | (8.6 | )% | |||||||||||
Less promotional allowances |
(191,551 | ) | (195,603 | ) | 4,052 | 2.1 | % | ||||||||||
Net revenues |
$ | 999,836 | $ | 1,108,035 | (108,199 | ) | (9.8 | )% | |||||||||
Casino Revenues—Casino revenues decreased $42.3 million, or 4.0%, in fiscal 2010 compared to fiscal 2009. We experienced a decrease in casino revenues at most of our properties primarily as a result of the continued deterioration in discretionary consumer spending in conjunction with poor economic conditions, with our properties in Lake Charles and Biloxi experiencing decreases of $9.5 million and $8.1 million, respectively. Casino revenues at our Quad Cities properties declined $13.9 million due to competition from a new land-based facility and casino revenues at our Pompano slot facility declined $3.6 million due to expansion of nearby competing Native American casinos.
Rooms Revenue—Rooms revenue decreased $3.4 million, or 7.3%, in fiscal 2010 compared to fiscal 2009 primarily resulting from decreased occupancy and lower average room rates as a result of reduced consumer demand for rooms.
Pari-mutuel, Food, Beverage and Other Revenues —Pari-mutuel, food, beverage and other revenues decreased $3.6 million, or 2.6%, in fiscal 2010 compared to fiscal 2009. This decrease was a result of a decrease of $3.7 million in pari-mutuel revenues at Pompano as a result of a 33 day decrease in year over year live racing days offset by a net increase in food, beverage and other revenues.
Promotional Allowances—Promotional allowances, which are made up of complimentary revenues, cash points and coupons, are rewards that we give our loyal customers to encourage them to continue to patronize our properties. These allowances decreased by $4.1 million in fiscal 2010 compared to fiscal 2009 due to changes in our promotions and corresponding reductions in our revenues. For fiscal 2010 and 2009, promotional allowances as a percentage of casino revenues were 18.9% and 18.5%, respectively.
37
Operating Expenses
Operating expenses for the fiscal years 2010 and 2009 are as follows:
| |
Fiscal Year Ended | |
|
||||||||||||
|---|---|---|---|---|---|---|---|---|---|---|---|---|---|---|---|
(in thousands)
|
April 25, 2010 |
April 26, 2009 |
Variance | Percentage Variance |
|||||||||||
Operating expenses: |
|||||||||||||||
Casino |
$ | 153,838 | $ | 151,610 | $ | 2,228 | 1.5 | % | |||||||
Gaming taxes |
262,241 | 269,928 | (7,687 | ) | (2.8 | )% | |||||||||
Rooms |
10,845 | 12,306 | (1,461 | ) | (11.9 | )% | |||||||||
Food, beverage, pari-mutuel and other |
44,760 | 51,462 | (6,702 | ) | (13.0 | )% | |||||||||
Marine and facilities |
61,507 | 64,368 | (2,861 | ) | (4.4 | )% | |||||||||
Marketing and administrative |
253,097 | 256,210 | (3,113 | ) | (1.2 | )% | |||||||||
Corporate and development |
46,750 | 41,331 | 5,419 | 13.1 | % | ||||||||||
Expense recoveries and other charges, net |
(6,762 | ) | 36,125 | (42,887 | ) | (118.7 | )% | ||||||||
Hurricane and other insurance recoveries |
— | (32,277 | ) | 32,277 | N/M | ||||||||||
Depreciation and amortization |
109,504 | 122,440 | (12,936 | ) | (10.6 | )% | |||||||||
Total operating expenses |
$ | 935,780 | $ | 973,503 | (37,723 | ) | (3.9 | )% | |||||||
Casino—Casino operating expenses increased $2.2 million, or 1.5% in fiscal 2010 compared to fiscal 2009. These expenses are primarily comprised of salaries, wages and benefits and other operating expenses of our casinos. This increase was primarily the result of increased cost of casino operations at our Black Hawk casinos following a July 2009 regulatory change expanding the hours of gaming operations.
Gaming Taxes—Gaming taxes decreased by $7.7 million, or 2.8%, in fiscal 2010 compared to fiscal 2009. This reduction in gaming taxes is primarily a result of a 4.0% decrease in casino gaming revenue and changes in mix of gaming revenues among states with differing gaming tax rates.
Rooms—Rooms expenses decreased by $1.5 million or 11.9% in fiscal 2010 compared to fiscal 2009. Overall reductions in rooms expenses corresponds to our 7.3% decline in rooms revenue.
Pari-mutuel, Food, Beverage and Other—Pari-mutuel, food, beverage and other expenses decreased $6.7 million, or 13.0%, in fiscal 2010 as compared to fiscal 2009. Pari-mutuel operating costs at Pompano decreased $4.2 million in fiscal 2010 compared to fiscal 2009. Such costs consist primarily of compensation, benefits, purses, simulcast fees and other direct costs of track operations. The decreases in current year as compared to prior year are a result of reduction of 33 live racing days during the current fiscal year. The reduction in food and beverage expenses resulted primarily from labor and other cost reductions. Food and beverage expenses consist primarily of the cost of goods sold, salaries, wages and benefits and other operating expenses of these departments.
Marine and Facilities—These expenses include salaries, wages and benefits of the marine and facilities departments, operating expenses of the marine crews, maintenance of public areas, housekeeping and general maintenance of the riverboats and pavilions. Marine and facilities expenses decreased $2.9 million, or 4.4%, in fiscal 2010 compared to fiscal 2009 and is the result of $1.5 million in utility cost reductions, $0.5 million in reduced payroll costs and $0.9 million in other cost reductions.
Marketing and Administrative—These expenses include salaries, wages and benefits of the marketing and sales departments, as well as promotions, direct mail, advertising, special events and entertainment. Administrative expenses include administration and human resource department expenses, rent,
38
professional fees, insurance and property taxes. The $3.1 million decrease in marketing and administrative expenses in fiscal 2010, as compared to fiscal 2009, reflects our decision to reduce marketing costs to less profitable customer segments and to reduce our administrative costs.
Corporate and Development—During fiscal 2010, our corporate and development expenses were $46.8 million compared to $41.3 million for fiscal 2009. This increase in corporate and development expense reflects $1.8 million of costs associated with the amendment of our credit facility, a $1.1 million increase in stock compensation expense and other increases in professional and other expenses associated with our development and acquisition activities.
Depreciation and Amortization—Depreciation and amortization expense decreased by $12.9 million, or 10.6%, in fiscal 2010, as compared to fiscal 2009 primarily due to certain assets becoming fully depreciated during the current year.
Other Income (Expense), Income Taxes and Discontinued Operations
Interest expense, interest income, derivative expense, gain on early extinguishment of debt, income tax (provision) benefit and income from discontinued operations, net of income taxes for the fiscal years 2010 and 2009 are as follows:
| |
Fiscal Year Ended | |
|
||||||||||
|---|---|---|---|---|---|---|---|---|---|---|---|---|---|
(in thousands)
|
April 25, 2010 |
April 26, 2009 |
Variance | Percentage Variance |
|||||||||
Interest expense |
$ | (75,434 | ) | $ | (92,065 | ) | $ | 16,631 | (18.1 | )% | |||
Interest income |
1,833 | 2,112 | (279 | ) | (13.2 | )% | |||||||
Derivative expense |
(370 | ) | — | (370 | ) | N/M | |||||||
Gain on early extinguishment of debt |
— | 57,693 | (57,693 | ) | N/M | ||||||||
Income tax (provision) benefit |
8,374 | (41,039 | ) | 49,413 | (120.4 | )% | |||||||
Loss from discontinued operations, net of income taxes |
(1,732 | ) | (17,658 | ) | 15,926 | (90.2 | )% | ||||||
Interest Expense—Interest expense decreased $16.6 million, or 18.1%, in fiscal 2010 compared to fiscal 2009 resulting from lower average debt balances. Our lower average debt balance resulted from the reduction of $142.7 million of our senior subordinated 7% notes and a $35.0 million repayment on our senior secured credit facility debt in February and March 2009, respectively. While we have experienced a decrease in the interest rate on the variable interest rate components of our debt through the third quarter of fiscal 2010, our senior secured credit facility amendment during the fourth quarter of fiscal 2010 increased our overall interest rates. See liquidity and capital resources for additional discussion of our senior secured credit facility amendment.
Interest Income—During fiscal 2010, our interest income decreased $0.3 million as compared to fiscal 2009. The change in interest income reflects changes in our invested cash and marketable securities balances and lower interest rates.
Other—This includes expenses related to the change in fair value of our ineffective interest rate swap agreements.
Income Tax (Provision) Benefit—Our income tax (provision) benefit from continuing operations and our effective income tax rate has been impacted by our settlement of certain tax liabilities for $4.7 million less than our estimated accrual, our amount of annual taxable income (loss) for financial statement purposes as well as our percentage of permanent items in relation to such income or loss.
39
Liquidity and Capital Resources
Cash Flows from Operating Activities—During fiscal 2011, we generated $123.7 million in cash flows from operating activities compared to generating $106.4 million during fiscal 2010. The increase in cash flows from operating activities is primarily due to increased income from operations and a $4.2 million decrease in our income tax receivable.
Cash Flows used in Investing Activities—During fiscal 2011 we used $144.6 million for investing activities compared to using $31.0 million during fiscal 2010. Significant investing activities during fiscal 2011 included the purchase of the Rainbow Casino in Vicksburg, Mississippi for $76.2 million, capital expenditures of $58.6 million, including $13.3 million relating to Cape Girardeau and Nemacolin, and increases in restricted cash and investments at our captive insurance company by $9.5 million to fund insurance reserves in lieu of providing letters of credit. Significant investing activities during fiscal 2010 included the purchase of property and equipment for $27.7 million and payment of $4.0 million towards our Waterloo gaming license.
Cash Flows used by Financing Activities—During fiscal 2011 our net cash flows provided by financing activities were $28.1 million primarily comprised of:
- •
- Net proceeds from our common stock offering of $51.2 million;
- •
- Net proceeds from the issuance of our 7.75% senior notes of $297.8 million;
- •
- Net reductions in our Senior Secured Credit Facility of $306.1 million; and
- •
- Payment of $14.8 million in deferred financing costs associated with the issuance of our 7.75% senior notes and amendment of our senior secured credit facility.
During fiscal year ended 2010 our net cash flows used by financing activities were $104.0 million primarily comprised of:
- •
- Repayment of $8.4 million of our senior secured term loans;
- •
- Net repayments of $90.5 million under our revolving credit agreement; and
- •
- Payment of $3.9 million in deferred financing costs associated with the amendment of our senior secured credit facility.
Availability of Cash and Additional Capital—At April 24, 2011, we had cash and cash equivalents of $75.2 million and marketable securities of $22.2 million. As of April 24, 2011, we had $33.0 million in borrowings under our revolving credit and $500.0 million in term loans outstanding under our senior secured credit facility. Our net line of credit availability at April 24, 2011 was approximately $175 million as limited by our leverage ratio.
Capital Expenditures and Development Activities—As part of our business development activities, historically we have entered into agreements which have resulted in the acquisition or development of businesses or assets. These business development efforts and related agreements typically require the expenditure of cash, which may be significant. The amount and timing of our cash expenditures relating to development activities may vary based upon our evaluation of current and future development opportunities, our financial condition and the condition of the financing markets. Our development activities are subject to a variety of factors including but not limited to: obtaining permits, licenses and approvals from appropriate regulatory and other agencies, legislative changes and, in certain circumstances, negotiating acceptable leases.
On December 1, 2010, our proposed casino in Cape Girardeau, Missouri was selected by the Missouri Gaming Commission for prioritization for the 13th and final gaming license in the State of Missouri. We had previously entered into a development agreement with the City of Cape Girardeau.
40
The project is expected to include 1,000 slot machines, 28 table games, three restaurants, a lounge and terrace overlooking the Mississippi River and a 750-seat event center. We currently estimate the cost of the project at approximately $125 million with an anticipated opening date by the end of calendar 2012. At April 24, 2011, we have incurred capital expenditures, including capitalized interest, of $13.0 million.
On April 14, 2011, our proposed casino in Nemacolin, Pennsylvania was selected by the Pennsylvania Gaming Control Board. We have entered into a development and management agreement with Namacolin Woodlands resort to build and operate a casino with 600 slot machines and 28 table games. We expect to begin construction later this summer and to open approximately nine months thereafter. The award of the license to Nemacolin is subject to a 30-day appeal period which ends on June 20, 2011 and the obtainment of a management license. We currently estimate the cost of the project at approximately $50 million. At April 24, 2011, we have incurred capital expenditures, including capitalized interest, of $0.3 million.
Historically, we have made significant investments in property and equipment and expect that our operations will continue to demand ongoing investments to keep our properties competitive. In fiscal 2012, we plan to invest approximately $90 million to $100 million in project capital in our Cape Girardeau and Nemacolin development projects, barring any delays related to licensing and permitting, contractor negotiations, weather or other items, and approximately $50 million in maintenance capital expenditures at our existing properties.
We have identified several capital projects primarily focused on refreshing our hotel room inventory as well as additional improvements to our Black Hawk and Lake Charles properties, and further Lady Luck conversions. The timing, completion and amount of these capital projects will be determined as we gain more clarity as to improvement of economic and local market conditions, cash flows from our continuing operations and borrowing availability under our senior secured credit facility.
Typically, we have funded our daily operations through net cash provided by operating activities and our significant capital expenditures through operating cash flow and debt financing. While we believe that cash on hand, proceeds from our recent equity offering, cash flow from operations, and available borrowings under our senior secured credit facility will be sufficient to support our working capital needs, planned capital expenditures and debt service requirements for the foreseeable future, there is no assurance that these sources will in fact provide adequate funding for our planned and necessary expenditures or that the level of our capital investments will be sufficient to allow us to remain competitive in our existing markets.
We are highly leveraged and may be unable to obtain additional debt or equity financing on acceptable terms if our current sources of liquidity are not sufficient or if we fail to stay in compliance with the covenants of our senior secured credit facility. We will continue to evaluate our planned capital expenditures at each of our existing locations in light of the operating performance of the facilities at such locations.
Critical Accounting Estimates
Our consolidated financial statements are prepared in accordance with U.S. generally accepted accounting principles that require our management to make estimates and assumptions that affect reported amounts and related disclosures. Management identifies critical accounting estimates as:
- •
- those that require the use of assumptions about matters that are inherently and highly uncertain at the time the estimates
are made;
- •
- those estimates where, had we chosen different estimates or assumptions, the resulting differences would have had a material impact on our financial condition, changes in financial condition or results of operations; and
41
- •
- those estimates that, if they were to change from period to period, likely would result in a material impact on our financial condition, changes in financial condition or results of operations.
Based upon management's discussion of the development and selection of these critical accounting estimates with the Audit Committee of our Board of Directors, we believe the following accounting estimates involve a higher degree of judgment and complexity.
Goodwill and Other Intangible Assets—At April 24, 2011, we had goodwill and other intangible assets of $427.5 million, representing 24.8% of total assets. In accordance with ASC Topic 350, Intangibles—Goodwill and Other, we perform an annual impairment test for goodwill and indefinite-lived intangible assets in the fourth fiscal quarter of each year, or on an interim basis if indicators of impairment exist. For properties with goodwill and/or other intangible assets with indefinite lives, this test requires the comparison of the implied fair value of each reporting unit to carrying value.
We must make various assumptions and estimates in performing our impairment testing. The implied fair value includes estimates of future cash flows that are based on reasonable and supportable assumptions which represent our best estimates of the cash flows expected to result from the use of the assets including their eventual disposition and by a market approach based upon valuation multiples for similar companies. Changes in estimates, increases in our cost of capital, reductions in transaction multiples, operating and capital expenditure assumptions or application of alternative assumptions and definitions could produce significantly different results. Future cash flow estimates are, by their nature, subjective and actual results may differ materially from our estimates. If our ongoing estimates of future cash flows are not met, we may have to record additional impairment charges in future accounting periods. Our estimates of cash flows are based on the current regulatory, social and economic climates, recent operating information and budgets of the various properties where we conduct operations. These estimates could be negatively impacted by changes in federal, state or local regulations, economic downturns, or other events affecting various forms of travel and access to our properties.
We engaged an independent third party valuation firm to assist management in our annual impairment testing for fiscal 2011. Our reporting units with goodwill and/or other long-lived intangibles had fair values which exceeded their carrying values by at least 15%, except for our Black Hawk reporting unit with goodwill and indefinite-lived assets as of April 24, 2011 of $30.6 million, in which fair value exceeded its carrying value by 7% and our Vicksburg reporting unit acquired during the current fiscal year. During our 2009 annual impairment test, we recorded an impairment charge of $18.3 million to write-down goodwill and indefinite lived intangible assets at our Black Hawk reporting unit.
Property and Equipment—At April 24, 2011, we had property and equipment, net of accumulated depreciation of $1.1 billion, representing 65% of our total assets. We capitalize the cost of property and equipment. Maintenance and repairs that neither materially add to the value of the property or equipment nor appreciably prolong its life are charged to expense as incurred. We depreciate property and equipment on a straight-line basis over their estimated useful lives. The estimated useful lives are based on the nature of the assets as well as our current operating strategy. Future events such as property expansions, new competition, changes in technology and new regulations could result in a change in the manner in which we are using certain assets requiring a change in the estimated useful lives of such assets.
Impairment of Long-lived Assets—We evaluate long-lived assets for impairment in accordance with the guidance in the Impairment or Disposal of Long Lived Assets subsection of ASC Topic 360, Property, Plant and Equipment (ASC Topic 360"). For a long-lived asset to be held and used, we review the asset for impairment whenever events or changes in circumstances indicate the carrying
42
amount may not be recoverable. In assessing the recoverability of the carrying value of such property, equipment and other long-lived assets, we make assumptions regarding future cash flows and residual values. If these estimates or the related assumptions are not achieved or change in the future, we may be required to record an impairment loss for these assets. In evaluating impairment of long-lived assets for newly opened operations, estimates of future cash flows and residual values may require some period of actual results to provide the basis for an opinion of future cash flows and residual values used in the determination of an impairment loss for these assets. For assets held for disposal, we recognize the asset at the lower of carrying value or fair market value, less cost of disposal based upon appraisals, discounted cash flows or other methods as appropriate. An impairment loss would be recognized as a non-cash component of operating income.
During the fourth quarter of fiscal 2009, we recorded a charge of $1.4 million to reduce our Blue Chip assets held for sale to their estimated fair value less the cost to sell.
Self-Insurance Liabilities—We are self-funded up to a maximum amount per claim for our employee-related health care benefits program, workers' compensation and general liabilities. Claims in excess of this maximum are fully insured through a stop-loss insurance policy. We accrue a discounted estimate for workers' compensation liability and general liabilities based on claims filed and estimates of claims incurred but not reported. We rely on independent consultants to assist in the determination of estimated accruals. While the ultimate cost of claims incurred depends on future developments, such as increases in health care costs, in our opinion, recorded reserves are adequate to cover future claims payments. Based upon our current accrued insurance liabilities, a 1% change in our discount factor would cause a $0.6 million change in our accrued self-insurance liability.
Income Tax Assets and Liabilities—We account for income taxes in accordance with the guidance in ASC Topic 740, Income Taxes ("ASC Topic 740"). We are subject to income taxes in the United States and in several states in which we operate. We recognize a current tax asset or liability for the estimated taxes payable or refundable based upon application of the enacted tax rates to taxable income in the current year. Additionally, we are required to recognize a deferred tax liability or asset for the estimated future tax effects attributable to temporary differences. Temporary differences occur when differences arise between: (a) the amount of taxable income and pretax financial income for a year and (b) the tax basis of assets or liabilities and their reported amounts in financial statements. Deferred tax assets recognized must be reduced by a valuation allowance for any tax benefits that, in our judgment and based upon available evidence, may not be realizable.
We assess our tax positions using a two-step process. A tax position is recognized if it meets a "more likely than not" threshold, and is measured at the largest amount of benefit that is greater than 50 percent likely of being realized. Uncertain tax positions must be reviewed at each balance sheet date. Liabilities recorded as a result of this analysis must generally be recorded separately from any current or deferred income tax accounts, and are classified as current or long-term in the balance sheet based on the time until expected payment in accounts accrued liabilities-other or other long-term liabilities, respectively. We recognize accrued interest and penalties related to unrecognized tax benefits in income tax expense.
Stock Based Compensation—We apply the guidance of ASC Topic 718, Compensation—Stock Compensation ("ASC Topic 718") in accounting for stock compensation. Generally, we are required to measure the cost of employee services received in exchange for an award of equity instruments based on the grant-date fair value of the award. The estimate of the fair value of the stock options is calculated using the Black-Scholes-Merton option-pricing model. This model requires the use of various assumptions, including the historical volatility of our stock price, the risk free interest rate, estimated expected life of the grants, the estimated dividend yield and estimated rate of forfeitures. Stock based compensation expense is included in the expense category corresponding to the employees' regular compensation in the accompanying consolidated statements of operations.
43
Derivative Instruments—We utilize an investment policy for managing risks associated with our current and anticipated future borrowings, such as interest rate risk and its potential impact on our fixed and variable rate debt. The policy does not allow for the use of derivative financial instruments for trading or speculative purposes. To the extent we employ such financial instruments pursuant to this policy, and the instruments qualify for hedge accounting, we may designate and account for them as hedged instruments. In order to qualify for hedge accounting, the underlying hedged item must expose us to risks associated with market fluctuations and the financial instrument used must be designated as a hedge and must reduce our exposure to market fluctuations throughout the hedged period. If these criteria are not met, a change in the market value of the financial instrument is recognized as a gain (loss) in the period of change. Otherwise, gains and losses related to the change in the market value are not recognized except to the extent that the hedged debt is disposed of prior to maturity or to the extent that unacceptable ranges of ineffectiveness exist in the hedge. Net interest paid or received pursuant to the hedged financial instrument is included in interest expense in the period. Our current interest rate swap agreements, which were designated as cash flow hedges, became ineffective upon the amendment of our senior secured credit facility in February 2010. We record them at fair value and measure their effectiveness using the long-haul method. The effective portion of any gain or loss on our interest rate swaps is recorded in other comprehensive income (loss). We use the hypothetical derivative method to measure the ineffective portion of our interest rate swaps. The ineffective portion, if any, is recorded in other income (expense). We measure the mark-to-market value of our interest rate swaps using a discounted cash flow analysis of the projected future receipts or payments based upon the forward yield curve on the date of measurement. We adjust this amount to measure the fair value of our interest rate swaps by applying a credit valuation adjustment to the mark-to-market exposure profile.
Contingencies—We are involved in various legal proceedings and have identified certain loss contingencies. We record liabilities related to these contingencies when it is determined that a loss is probable and reasonably estimable in accordance with the guidance of ASC Topic 450 Contingencies ("ASC Topic 450"). These assessments are based on our knowledge and experience as well as the advice of legal counsel regarding current and past events. Any such estimates are also subject to future events, court rulings, negotiations between the parties and other uncertainties. If an actual loss differs from our estimate, or the actual outcome of any of the legal proceedings differs from expectations, future operating results could be impacted.
Contractual Obligations and Commercial Commitments
The following table provides information as of the end of fiscal 2011, about our contractual obligations and commercial commitments. The table presents contractual obligations by due dates and related contractual commitments by expiration dates (in millions).
| |
Payments Due by Period | |||||||||||||||
|---|---|---|---|---|---|---|---|---|---|---|---|---|---|---|---|---|
Contractual Obligations
|
Total | Less Than 1 Year |
1 - 3 Years | 4 - 5 Years | After 5 Years | |||||||||||
Long-Term Debt |
$ | 1,194.8 | $ | 5.4 | $ | 886.1 | $ | 0.6 | $ | 302.7 | ||||||
Estimated interest payments on long-term debt(1) |
336.3 | 78.3 | 137.6 | 47.5 | 72.9 | |||||||||||
Operating Leases |
502.2 | 18.6 | 31.6 | 31.5 | 420.5 | |||||||||||
Long-Term Obligations(2) |
12.4 | 7.8 | 4.0 | 0.5 | 0.1 | |||||||||||
Other Long-Term Obligations |
22.6 | 1.1 | 2.4 | 3.3 | 15.8 | |||||||||||
Total Contractual Cash Obligations |
$ | 2,104.3 | $ | 111.2 | $ | 1,072.5 | $ | 90.6 | $ | 830.0 | ||||||
- (1)
- Estimated
interest payment on long-term debt are based on principal amounts outstanding at our fiscal year end and forecasted LIBOR rates for
our senior secured credit facility.
- (2)
- Long-term obligations include future purchase commitments.
44
Recently Issued Accounting Standards
Recently Issued Accounting Standards—ASU No. 2010-16, Entertainment-Casinos (Topic 924): Accruals for Casino Jackpot Liabilities. The Financial Accounting Standards Board issued ASU No. 2010-16, Entertainment-Casinos (Topic 924): Accruals for Casino Jackpot Liabilities. The guidance clarifies that an entity should not accrue jackpot liabilities (or portions thereof) before a jackpot is won if the entity can avoid paying that jackpot since the machine can legally be removed from the gaming floor without payment of the base amount. Jackpots should be accrued and charged to revenue when an entity has the obligation to pay the jackpot. This guidance applies to both base jackpots and the incremental portion of progressive jackpots. The guidance is effective for fiscal years, and interim periods within those fiscal years, beginning on or after December 15, 2010. This guidance should be applied by recording a cumulative-effect adjustment to opening retained earnings in the period of adoption. Our current accounting policy conforms to the new guidance and as such we expect the adoption to have no cumulative effect.
ITEM 7A. QUANTITATIVE AND QUALITATIVE DISCLOSURES ABOUT MARKET RISK
Market risk is the risk of loss arising from adverse changes in market rates and prices, including interest rates, foreign currency exchange rates, commodity prices and equity prices. Our primary exposure to market risk is interest rate risk associated with our senior secured credit facility.
Senior Secured Credit Facility
During fiscal 2011, we maintained interest rate swap agreements and interest rate cap arrangements with an aggregate notional value of $100 million and $220 million as of April 24, 2011, respectively. The swap agreements effectively convert portions of the senior secured credit facility variable debt to a fixed-rate basis until the respective swap agreements terminate, which occurs through fiscal 2014.
The following table provides information at April 24, 2011 about our financial instruments that are sensitive to changes in interest rates. The table presents principal cash flows and related weighted average interest rates by expected maturity dates.
45
Interest Rate Sensitivity
Principal (Notional) Amount by Expected Maturity
Average Interest (Swap) Rate
Fiscal year (dollars in millions) |
2012 | 2013 | 2014 | 2015 | 2016 | Thereafter | Total | Fair Value 4/24/2011 |
||||||||||||||||||
|---|---|---|---|---|---|---|---|---|---|---|---|---|---|---|---|---|---|---|---|---|---|---|---|---|---|---|
Liabilities |
||||||||||||||||||||||||||
Long-term debt, including current portion |
||||||||||||||||||||||||||
Fixed rate |
$ | 0.2 | $ | 0.2 | $ | 357.5 | $ | 0.2 | $ | 0.2 | $ | 302.7 | $ | 661.0 | $ | 667.4 | ||||||||||
Average interest rate |
7.45 | % | 7.38 | % | 7.08 | % | 7.84 | % | 7.85 | % | 7.76 | % | ||||||||||||||
Variable rate |
$ |
5.2 |
$ |
5.2 |
$ |
523.2 |
$ |
0.2 |
$ |
— |
$ |
— |
$ |
533.8 |
$ |
537.1 |
||||||||||
Average interest rate(1) |
4.95 | % | 5.00 | % | 5.75 | % | 9.97 | % | 0.00 | % | 0.00 | % | ||||||||||||||
Interest Rate Derivative Financial Instruments Related to Debt |
||||||||||||||||||||||||||
Interest rate swaps |
||||||||||||||||||||||||||
Pay fixed/receive variable |
$ | 50.0 | $ | — | $ | 50.0 | $ | — | $ | — | $ | — | $ | 100.0 | ||||||||||||
Average pay rate |
4.21 | % | 4.00 | % | 4.00 | % | 0.00 | % | 0.00 | % | 0.00 | % | ||||||||||||||
Average receive rate |
0.34 | % | 1.12 | % | 2.06 | % | 0.00 | % | 0.00 | % | 0.00 | % | ||||||||||||||
- (1)
- Represents the annual average LIBOR from the forward yield curve at April 24, 2011 plus the weighted average margin above LIBOR on all consolidated variable rate debt.
As of April, 24, 2011, our senior secured credit facility contained variable rate debt based on LIBOR with a floor of 1.25%, which is above the current market LIBOR rates we receive under our interest rate swap agreement. In addition, we have purchased interest rate caps at 3% for a notional amount of $120 million and 2% for a notional amount of $100 million to further hedge our interest rate exposure. The following table depicts the estimated impact on our annual interest expense for the relative changes in interest rate based upon current debt levels:
| Increase to variable rate |
Increase/(decrease) (in millions) |
||||
|---|---|---|---|---|---|
1 |
% | $ | (1.0 | ) | |
2 |
% | (0.7 | ) | ||
3 |
% | 2.3 | |||
4 |
% | 4.4 | |||
5 |
% | 6.6 | |||
46
ITEM 8. FINANCIAL STATEMENTS AND SUPPLEMENTARY DATA
The following consolidated financial statements are included in this report:
47
Report of Independent Registered Public Accounting Firm
The
Board of Directors and Stockholders
Isle of Capri Casinos, Inc.
We have audited Isle of Capri Casinos, Inc.'s internal control over financial reporting as of April 24, 2011, based on criteria established in Internal Control—Integrated Framework issued by the Committee of Sponsoring Organizations of the Treadway Commission (the COSO criteria). Isle of Capri Casinos, Inc.'s management is responsible for maintaining effective internal control over financial reporting, and for its assessment of the effectiveness of internal control over financial reporting included in the accompanying Management's Report on Internal Control over Financial Reporting. Our responsibility is to express an opinion on the company's internal control over financial reporting based on our audit.
We conducted our audit in accordance with the standards of the Public Company Accounting Oversight Board (United States). Those standards require that we plan and perform the audit to obtain reasonable assurance about whether effective internal control over financial reporting was maintained in all material respects. Our audit included obtaining an understanding of internal control over financial reporting, assessing the risk that a material weakness exists, testing and evaluating the design and operating effectiveness of internal control based on the assessed risk, and performing such other procedures as we considered necessary in the circumstances. We believe that our audit provides a reasonable basis for our opinion.
A company's internal control over financial reporting is a process designed to provide reasonable assurance regarding the reliability of financial reporting and the preparation of financial statements for external purposes in accordance with generally accepted accounting principles. A company's internal control over financial reporting includes those policies and procedures that (1) pertain to the maintenance of records that, in reasonable detail, accurately and fairly reflect the transactions and dispositions of the assets of the company; (2) provide reasonable assurance that transactions are recorded as necessary to permit preparation of financial statements in accordance with generally accepted accounting principles, and that receipts and expenditures of the company are being made only in accordance with authorizations of management and directors of the company; and (3) provide reasonable assurance regarding prevention or timely detection of unauthorized acquisition, use or disposition of the company's assets that could have a material effect on the financial statements.
Because of its inherent limitations, internal control over financial reporting may not prevent or detect misstatements. Also, projections of any evaluation of effectiveness to future periods are subject to the risk that controls may become inadequate because of changes in conditions, or that the degree of compliance with the policies or procedures may deteriorate.
In our opinion, Isle of Capri Casinos, Inc. maintained, in all material respects, effective internal control over financial reporting as of April 24, 2011, based on the COSO criteria.
We also have audited, in accordance with the standards of the Public Company Accounting Oversight Board (United States), the consolidated balance sheets of Isle of Capri Casinos, Inc. as of April 24, 2011, and April 25, 2010, and the related consolidated statements of operations, stockholders' equity, and cash flows for the fiscal years ended April 24, 2011, April 25, 2010, and April 24, 2009, of Isle of Capri Casinos, Inc. and our report dated June 16, 2011, expressed an unqualified opinion thereon.
/s/ Ernst & Young LLP
St. Louis,
Missouri
June 16, 2011
48
Report of Independent Registered Public Accounting Firm
The
Board of Directors and Stockholders
Isle of Capri Casinos, Inc.
We have audited the accompanying consolidated balance sheets of Isle of Capri Casinos, Inc. (the Company) as of April 24, 2011, and April 25, 2010, and the related consolidated statements of operations, stockholders' equity, and cash flows for the fiscal years ended April 24, 2011, April 25, 2010, and April 26, 2009. Our audits also included the financial statement schedule listed in the Index at Item 15(a). These financial statements and schedule are the responsibility of the Company's management. Our responsibility is to express an opinion on these financial statements and schedule based on our audits.
We conducted our audits in accordance with the standards of the Public Company Accounting Oversight Board (United States). Those standards require that we plan and perform the audit to obtain reasonable assurance about whether the financial statements are free of material misstatement. An audit includes examining, on a test basis, evidence supporting the amounts and disclosures in the financial statements. An audit also includes assessing the accounting principles used and significant estimates made by management, as well as evaluating the overall financial statement presentation. We believe that our audits provide a reasonable basis for our opinion.
In our opinion, the financial statements referred to above present fairly, in all material respects, the consolidated financial position of Isle of Capri Casinos, Inc. at April 24, 2011, and April 25, 2010, and the consolidated results of its operations and its cash flows for the years ended April 24, 2011, April 25, 2010, and April 26, 2009, in conformity with U.S. generally accepted accounting principles. Also, in our opinion, the related financial statement schedule, when considered in relation to the basic consolidated financial statements taken as a whole, presents fairly, in all material respects, the information set forth therein.
We also have audited, in accordance with the standards of the Public Company Accounting Oversight Board (United States), Isle of Capri Casinos, Inc.'s internal control over financial reporting as of April 24, 2011, based on the criteria established in Internal Control—Integrated Framework issued by the Committee of Sponsoring Organizations of the Treadway Commission, and our report date June 16, 2011, expressed an unqualified opinion thereon.
/s/ Ernst & Young LLP
St. Louis,
Missouri
June 16, 2011
49
ISLE OF CAPRI CASINOS, INC.
CONSOLIDATED BALANCE SHEETS
(In thousands, except share and per share amounts)
| |
April 24, 2011 |
April 25, 2010 |
||||||||
|---|---|---|---|---|---|---|---|---|---|---|
ASSETS |
||||||||||
Current assets: |
||||||||||
Cash and cash equivalents |
$ | 75,178 | $ | 68,069 | ||||||
Marketable securities |
22,173 | 22,926 | ||||||||
Accounts receivable, net of allowance for doubtful accounts of $1,010 and $1,955, respectively |
9,601 | 8,879 | ||||||||
Income taxes receivable |
3,866 | 8,109 | ||||||||
Deferred income taxes |
12,097 | 16,826 | ||||||||
Prepaid expenses and other assets |
25,444 | 25,095 | ||||||||
Total current assets |
148,359 | 149,904 | ||||||||
Property and equipment, net |
1,113,549 | 1,098,942 | ||||||||
Other assets: |
||||||||||
Goodwill |
345,303 | 313,136 | ||||||||
Other intangible assets, net |
82,207 | 79,675 | ||||||||
Deferred financing costs, net |
18,911 | 10,354 | ||||||||
Restricted cash and investments |
12,810 | 2,774 | ||||||||
Prepaid deposits and other |
12,749 | 20,055 | ||||||||
Total assets |
$ | 1,733,888 | $ | 1,674,840 | ||||||
LIABILITIES AND STOCKHOLDERS' EQUITY |
||||||||||
Current liabilities: |
||||||||||
Current maturities of long-term debt |
$ | 5,373 | $ | 8,754 | ||||||
Accounts payable |
26,013 | 24,072 | ||||||||
Accrued liabilities: |
||||||||||
Payroll and related |
44,187 | 45,863 | ||||||||
Property and other taxes |
19,891 | 20,253 | ||||||||
Interest |
10,802 | 14,779 | ||||||||
Progressive jackpots and slot club awards |
15,280 | 14,144 | ||||||||
Other |
32,332 | 29,290 | ||||||||
Total current liabilities |
153,878 | 157,155 | ||||||||
Long-term debt, less current maturities |
1,187,221 | 1,192,135 | ||||||||
Deferred income taxes |
30,762 | 29,193 | ||||||||
Other accrued liabilities |
36,305 | 38,972 | ||||||||
Other long-term liabilities |
16,694 | 17,166 | ||||||||
Stockholders' equity: |
||||||||||
Preferred stock, $.01 par value; 2,000,000 shares authorized; none issued |
— | — | ||||||||
Common stock, $.01 par value; 60,000,000 shares authorized; shares issued: 42,063,569 at April 24, 2011, and 36,771,730 at April 25, 2010 |
421 | 367 | ||||||||
Class B common stock, $.01 par value; 3,000,000 shares authorized; none issued |
— | — | ||||||||
Additional paid-in capital |
254,013 | 201,464 | ||||||||
Retained earnings |
103,095 | 98,555 | ||||||||
Accumulated other comprehensive income (loss) |
(2,235 | ) | (8,060 | ) | ||||||
|
355,294 | 292,326 | ||||||||
Treasury stock, 3,841,283 shares at April 24, 2011 and 4,326,242 shares at April 25, 2010 |
(46,266 | ) | (52,107 | ) | ||||||
Total stockholders' equity |
309,028 | 240,219 | ||||||||
Total liabilities and stockholders' equity |
$ | 1,733,888 | $ | 1,674,840 | ||||||
See accompanying notes to consolidated financial statements.
50
ISLE OF CAPRI CASINOS, INC.
CONSOLIDATED STATEMENTS OF OPERATIONS
(In thousands, except share and per share amounts)
| |
Fiscal Year Ended | |||||||||||||
|---|---|---|---|---|---|---|---|---|---|---|---|---|---|---|
| |
April 24, 2011 |
April 25, 2010 |
April 26, 2009 |
|||||||||||
Revenues: |
||||||||||||||
Casino |
$ | 1,036,538 | $ | 1,013,386 | $ | 1,055,694 | ||||||||
Rooms |
40,271 | 43,007 | 46,380 | |||||||||||
Food, beverage, pari-mutuel and other |
134,725 | 134,994 | 138,632 | |||||||||||
Hurricane and other insurance recoveries |
— | — | 62,932 | |||||||||||
Gross revenues |
1,211,534 | 1,191,387 | 1,303,638 | |||||||||||
Less promotional allowances |
(206,539 | ) | (191,551 | ) | (195,603 | ) | ||||||||
Net revenues |
1,004,995 | 999,836 | 1,108,035 | |||||||||||
Operating expenses: |
||||||||||||||
Casino |
158,580 | 153,838 | 151,610 | |||||||||||
Gaming taxes |
250,102 | 262,241 | 269,928 | |||||||||||
Rooms |
9,793 | 10,845 | 12,306 | |||||||||||
Food, beverage, pari-mutuel and other |
44,943 | 44,760 | 51,462 | |||||||||||
Marine and facilities |
60,485 | 61,507 | 64,368 | |||||||||||
Marketing and administrative |
253,423 | 253,097 | 256,210 | |||||||||||
Corporate and development |
42,709 | 46,750 | 41,331 | |||||||||||
Expense recoveries and other charges, net |
— | (6,762 | ) | 36,125 | ||||||||||
Hurricane and other insurance recoveries |
— | — | (32,277 | ) | ||||||||||
Depreciation and amortization |
89,040 | 109,504 | 122,440 | |||||||||||
Total operating expenses |
909,075 | 935,780 | 973,503 | |||||||||||
Operating income |
95,920 | 64,056 | 134,532 | |||||||||||
Interest expense |
(91,934 | ) | (75,434 | ) | (92,065 | ) | ||||||||
Interest income |
1,916 | 1,833 | 2,112 | |||||||||||
Gain on early extinguishment of debt |
— | — | 57,693 | |||||||||||
Derivative expense |
(1,214 | ) | (370 | ) | — | |||||||||
Income (loss) from continuing operations before income taxes |
4,688 | (9,915 | ) | 102,272 | ||||||||||
Income tax (provision) benefit |
(3,600 | ) | 8,374 | (41,039 | ) | |||||||||
Income (loss) from continuing operations |
1,088 | (1,541 | ) | 61,233 | ||||||||||
Income (loss) from discontinued operations, including loss on sale, net of income tax benefit of $1,978, $566 and $9,887 for the fiscal years ended 2011, 2010 and 2009, respectively |
3,452 | (1,732 | ) | (17,658 | ) | |||||||||
Net income (loss) attributable to common stockholders |
$ | 4,540 | $ | (3,273 | ) | $ | 43,575 | |||||||
Earnings (loss) per common share attributable to common stockholders—basic: |
||||||||||||||
Income (loss) from continuing operations |
$ | 0.03 | $ | (0.05 | ) | $ | 1.95 | |||||||
Income (loss) from discontinued operations including gain on sale, net of income taxes |
0.10 | (0.05 | ) | (0.56 | ) | |||||||||
Net income (loss) attributable common stockholders |
$ | 0.13 | $ | (0.10 | ) | $ | 1.39 | |||||||
Earnings (loss) per common share attributable to common stockholders—diluted |
||||||||||||||
Income (loss) from continuing operations |
$ | 0.03 | $ | (0.05 | ) | $ | 1.95 | |||||||
Income (loss) from discontinued operations including gain on sale, net of income taxes |
0.10 | (0.05 | ) | (0.56 | ) | |||||||||
Net income (loss) attributable common stockholders |
$ | 0.13 | $ | (0.10 | ) | $ | 1.39 | |||||||
Weighted average basic shares |
34,066,159 | 32,245,769 | 31,372,670 | |||||||||||
Weighted average diluted shares |
34,174,717 | 32,245,769 | 31,379,016 | |||||||||||
See accompanying notes to consolidated financial statements.
51
ISLE OF CAPRI CASINOS, INC.
CONSOLIDATED STATEMENTS OF STOCKHOLDERS' EQUITY
(In thousands, except share amounts)
| |
Shares of Common Stock |
Common Stock |
Additional Paid-in Capital |
Retained Earnings |
Accum. Other Comprehensive Income (Loss) |
Treasury Stock |
Total Stock-holders' Equity |
|||||||||||||||
|---|---|---|---|---|---|---|---|---|---|---|---|---|---|---|---|---|---|---|---|---|---|---|
Balance, April 27, 2008 |
35,229,006 | $ | 353 | $ | 188,036 | $ | 58,253 | $ | (5,601 | ) | $ | (53,029 | ) | $ | 188,012 | |||||||
Net income |
— | — | — | 43,575 | — | — | 43,575 | |||||||||||||||
Unrealized loss on interest rate swap contracts net of income tax benefit of $3,720 |
— | — | — | — | (6,255 | ) | — | (6,255 | ) | |||||||||||||
Foreign currency translation adjustments |
— | — | — | — | (3,335 | ) | — | (3,335 | ) | |||||||||||||
Comprehensive income |
33,985 | |||||||||||||||||||||
Exercise of stock options |
36,414 | — | 110 | — | — | — | 110 | |||||||||||||||
Issuance of deferred bonus shares from treasury stock |
— | — | (630 | ) | — | — | 630 | — | ||||||||||||||
Other |
664 | — | (806 | ) | — | — | — | (806 | ) | |||||||||||||
Issuance of restricted stock, net of forfeitures |
845,005 | 8 | (8 | ) | — | — | — | — | ||||||||||||||
Stock compensation expense |
— | — | 7,125 | — | — | — | 7,125 | |||||||||||||||
Balance, April 26, 2009 |
36,111,089 | 361 | 193,827 | 101,828 | (15,191 | ) | (52,399 | ) | 228,426 | |||||||||||||
Net loss |
— | — | — | (3,273 | ) | — | — | (3,273 | ) | |||||||||||||
Unrealized gain on interest rate swap contracts net of income tax provision of $2,683 |
— | — | — | — | 4,456 | — | 4,456 | |||||||||||||||
Deferred hedge adjustment net of income tax provision of $1,463 |
— | — | — | — | 2,449 | — | 2,449 | |||||||||||||||
Foreign currency translation adjustments |
— | — | — | — | 226 | — | 226 | |||||||||||||||
Comprehensive income |
3,858 | |||||||||||||||||||||
Exercise of stock options |
21,602 | — | 204 | — | — | — | 204 | |||||||||||||||
Issuance of deferred bonus shares from treasury stock |
— | — | (292 | ) | — | — | 292 | — | ||||||||||||||
Other |
664 | — | 103 | — | — | — | 103 | |||||||||||||||
Issuance of restricted stock, net of forfeitures |
638,375 | 6 | (6 | ) | — | — | — | — | ||||||||||||||
Stock compensation expense |
— | — | 7,628 | — | — | — | 7,628 | |||||||||||||||
Balance, April 25, 2010 |
36,771,730 | 367 | 201,464 | 98,555 | (8,060 | ) | (52,107 | ) | 240,219 | |||||||||||||
Net income |
— | — | — | 4,540 | — | — | 4,540 | |||||||||||||||
Deferred hedge adjustment net of income tax provision of $3,408 |
— | — | — | — | 5,724 | — | 5,724 | |||||||||||||||
Unrealized loss on interest rate cap contracts net of income tax benefit of $19 |
— | — | — | — | (32 | ) | — | (32 | ) | |||||||||||||
Foreign currency translation adjustments |
— | — | — | — | 133 | — | 133 | |||||||||||||||
Comprehensive income |
10,365 | |||||||||||||||||||||
Common stock offering |
5,300,000 | 53 | 51,174 | — | — | — | 51,227 | |||||||||||||||
Exercise of stock options |
1,500 | — | (2 | ) | — | — | 25 | 23 | ||||||||||||||
Issuance of deferred bonus shares from common stock |
11,641 | 1 | — | — | — | 1 | ||||||||||||||||
Forfeitures and other |
(21,302 | ) | — | (402 | ) | — | — | — | (402 | ) | ||||||||||||
Issuance of restricted stock from treasury stock |
— | — | (5,816 | ) | — | — | 5,816 | — | ||||||||||||||
Stock compensation expense |
— | — | 7,595 | — | — | — | 7,595 | |||||||||||||||
Balance, April 24, 2011 |
42,063,569 | $ | 421 | $ | 254,013 | $ | 103,095 | $ | (2,235 | ) | $ | (46,266 | ) | $ | 309,028 | |||||||
See accompanying notes to consolidated financial statements.
52
ISLE OF CAPRI CASINOS, INC.
CONSOLIDATED STATEMENTS OF CASH FLOWS
(In thousands)
| |
Fiscal Year Ended | ||||||||||
|---|---|---|---|---|---|---|---|---|---|---|---|
| |
April 24, 2011 |
April 25, 2010 |
April 26, 2009 |
||||||||
Operating activities: |
|||||||||||
Net income (loss) |
$ | 4,540 | $ | (3,273 | ) | $ | 43,575 | ||||
Adjustments to reconcile net income (loss) to net cash provided by operating activities: |
|||||||||||
Depreciation and amortization |
89,040 | 109,504 | 127,222 | ||||||||
Amortization and write-off of deferred financing costs |
6,266 | 2,834 | 2,470 | ||||||||
Gain on early extinguishment of debt |
— | — | (57,693 | ) | |||||||
Property insurance recoveries |
— | — | (32,179 | ) | |||||||
Expense recoveries and other charges, net |
— | (6,762 | ) | 36,525 | |||||||
Deferred income taxes |
2,508 | (455 | ) | 32,751 | |||||||
Stock compensation expense |
7,595 | 7,633 | 7,125 | ||||||||
Deferred compensation expense |
— | 103 | 175 | ||||||||
Loss on derivative instruments |
1,214 | 370 | — | ||||||||
(Gain) loss on disposal of assets |
(296 | ) | 722 | 12,161 | |||||||
Changes in operating assets and liabilities: |
|||||||||||
Sales (purchases) of trading securities |
753 | (5,378 | ) | 985 | |||||||
Accounts receivable |
(460 | ) | 3,274 | 1,548 | |||||||
Income taxes receivable |
4,243 | (365 | ) | 20,919 | |||||||
Insurance receivable |
(234 | ) | 2,204 | 5,486 | |||||||
Prepaid expenses and other assets |
7,426 | 4,546 | 8,551 | ||||||||
Accounts payable and accrued liabilities |
1,066 | (8,575 | ) | (19,011 | ) | ||||||
Net cash provided by operating activities |
123,661 | 106,382 | 190,610 | ||||||||
Investing activities: |
|||||||||||
Purchase of property and equipment |
(58,600 | ) | (27,690 | ) | (58,579 | ) | |||||
Property insurance recoveries |
— | — | 32,179 | ||||||||
Payments towards gaming license |
— | (4,000 | ) | (4,000 | ) | ||||||
Net cash paid for acquisitions |
(76,167 | ) | — | — | |||||||
Proceeds from sales of assets held for sale |
— | 653 | 954 | ||||||||
Restricted cash and investments |
(9,870 | ) | 47 | 1,579 | |||||||
Net cash used in investing activities |
(144,637 | ) | (30,990 | ) | (27,867 | ) | |||||
Financing activities: |
|||||||||||
Principal repayments on long-term debt |
(317,586 | ) | (8,730 | ) | (127,457 | ) | |||||
Net borrowings (repayments) on line of credit |
11,500 | (91,558 | ) | (18,484 | ) | ||||||
Termination payment relating to other long-term liabilities |
— | — | (11,352 | ) | |||||||
Proceeds from long-term debt borrowings |
297,792 | — | — | ||||||||
Payment of deferred financing costs |
(14,823 | ) | (3,874 | ) | — | ||||||
Proceeds from issuance of common stock |
51,227 | — | — | ||||||||
Proceeds from exercise of stock options |
23 | 204 | 110 | ||||||||
Net cash provided by (used by) financing activities |
28,133 | (103,958 | ) | (157,183 | ) | ||||||
Effect of foreign currency exchange rates on cash |
(48 | ) | (19 | ) | (696 | ) | |||||
Net increase (decrease) in cash and cash equivalents |
7,109 | (28,585 | ) | 4,864 | |||||||
Cash and cash equivalents at beginning of year |
68,069 | 96,654 | 91,790 | ||||||||
Cash and cash equivalents at end of year |
$ | 75,178 | $ | 68,069 | $ | 96,654 | |||||
See accompanying notes to consolidated financial statements.
53
ISLE OF CAPRI CASINOS, INC.
NOTES TO CONSOLIDATED FINANCIAL STATEMENTS
(amounts in thousands, except share and per share amounts)
1. Organization
Organization—Isle of Capri Casinos, Inc., a Delaware corporation, was incorporated in February 1990. Except where otherwise noted, the words "we," "us," "our" and similar terms, as well as "Company," refer to Isle of Capri Casinos, Inc. and all of its subsidiaries. We are a leading developer, owner and operator of branded gaming facilities and related lodging and entertainment facilities in markets throughout the United States. Our wholly owned subsidiaries own and operate fourteen casino gaming facilities in the United States located in Black Hawk, Colorado; Lake Charles, Louisiana; Lula, Biloxi, Natchez and Vicksburg, Mississippi; Kansas City, Caruthersville and Boonville, Missouri; Bettendorf, Davenport, Waterloo and Marquette, Iowa; and Pompano Beach, Florida.
2. Summary of Significant Accounting Policies
Basis of Presentation—The consolidated financial statements include the accounts of the Company and its subsidiaries. All significant intercompany balances and transactions have been eliminated. We view each property as an operating segment and all such operating segments have been aggregated into one reporting segment.
Discontinued operations include our former casinos; in Dudley and Wolverhampton, England sold in November 2009; in Freeport; Grand Bahamas exited in November 2009; and in Coventry, England sold in April 2009.
Fiscal Year-End—Our fiscal year ends on the last Sunday in April. Periodically, this system necessitates a 53-week year. Fiscal years 2011, 2010 and 2009 are all 52-week years, which commenced on April 26, 2010, April 27, 2009, and April 28, 2008, respectively.
Use of Estimates—The preparation of financial statements in conformity with accounting principles generally accepted in the United States requires management to make estimates and assumptions that affect the amounts reported in the financial statements and accompanying notes. Actual results could differ from those estimates.
Cash and Cash Equivalents—We consider all highly liquid investments purchased with an original maturity of three months or less as cash equivalents. Cash also includes the minimum operating cash balances required by state regulatory bodies, which totaled $24,230 and $20,846 at April 24, 2011 and April 25, 2010, respectively.
Marketable Securities—Marketable securities consist primarily of trading securities held by our captive insurance subsidiary. The trading securities are primarily debt and equity securities that are purchased with the intention to resell in the near term. The trading securities are carried at fair value with changes in fair value recognized in current period income in the accompanying statements of operations.
Inventories—Inventories are stated at the lower of weighted average cost or market value.
Property and Equipment—Property and equipment are stated at cost or if acquired through acquisition, the value determined under purchase accounting. Assets subject to impairment write downs are recorded at the lower of net book value or fair value. We capitalize the cost of purchased property and equipment and capitalize the cost of improvements to property and equipment that increases the
54
ISLE OF CAPRI CASINOS, INC.
NOTES TO CONSOLIDATED FINANCIAL STATEMENTS (Continued)
(amounts in thousands, except share and per share amounts)
2. Summary of Significant Accounting Policies (Continued)
value or extends the useful lives of the assets. Costs of normal repairs and maintenance are charged to expense as incurred.
Depreciation is computed using the straight-line method over the following estimated useful lives of the assets:
| |
Years | |
|---|---|---|
Slot machines, software and computers |
3 - 5 | |
Furniture, fixtures and equipment |
5 - 10 | |
Leasehold improvements |
Lesser of life of lease or estimated useful life | |
Buildings and improvements |
7 - 39.5 |
Certain property currently leased in Bettendorf, Iowa and property formerly leased in Coventry, England, prior to the termination of such lease, are accounted for in accordance with Accounting Standards Codification ("ASC") Topic 840, Leases ("ASC 840").
Capitalized Interest—The interest cost associated with major development and construction projects is capitalized and included in the cost of the project. When no debt is incurred specifically for a project, interest is capitalized on amounts expended on the project using the weighted-average cost of our borrowings. Capitalization of interest ceases when the project is substantially complete or development activity is suspended for more than a brief period. Capitalized interest was $125, $75, and $1,018 for fiscal years 2011, 2010 and 2009, respectively.
Operating Leases—We recognize rent expense for each lease on the straight line basis, aggregating all future minimum rent payments including any predetermined fixed escalations of the minimum rentals. Our liabilities include the aggregate difference between rent expense recorded on the straight-line basis and amounts paid under the leases.
Restricted Cash and Investments—We classify cash and investments which are either statutorily or contractually restricted as to its withdrawal or usage as restricted cash short or restricted cash and investments long-term based on the duration of the underlying restriction. Restricted cash primarily includes amounts related to state tax bonds and other gaming bonds, and amounts held in escrow related to leases. Restricted investments relate to trading securities pledged as insurance reserves by our captive insurance company.
Goodwill and Other Intangible Assets—Goodwill represents the excess of cost over the net identifiable tangible and intangible assets of acquired businesses and is stated at cost, net of impairments, if any. Other intangible assets include values attributable to acquired gaming licenses, customer lists, and trademarks. ASC Topic 350, Intangibles—Goodwill and Other ("ASC 350") requires these assets be reviewed for impairment at least annually or on an interim basis if indicators of impairment exist. We perform our annual impairment test during our fourth quarter. Goodwill for relevant reporting units is tested for impairment using; 1) a discounted cash flow analysis based on forecasted future results discounted at the weighted average cost of capital and, 2) by using a market approach based upon valuation multiples for similar companies. For intangible assets with indefinite lives not subject to amortization, we review, at least annually, the continued use of an indefinite useful
55
ISLE OF CAPRI CASINOS, INC.
NOTES TO CONSOLIDATED FINANCIAL STATEMENTS (Continued)
(amounts in thousands, except share and per share amounts)
2. Summary of Significant Accounting Policies (Continued)
life. If these intangible assets are determined to have a finite useful life, they are amortized over their estimated remaining useful lives.
Long-Lived Assets—We periodically evaluate the carrying value of long-lived assets to be held and used in accordance with ASC Topic 360, Property, Plant and Equipment ("ASC 360") which requires impairment losses to be recorded on long-lived assets used in operations when indicators of impairment are present and the undiscounted cash flows estimated to be generated by those assets are less than the assets' carrying amounts. In that event, a loss is recognized based on the amount by which the carrying amount exceeds the fair market value of the long-lived assets.
Deferred Financing Costs—The costs of issuing long-term debt are capitalized and amortized using the effective interest method over the term of the related debt.
Self-Insurance—We are self-funded up to a maximum amount per claim for employee-related health care benefits, workers' compensation and general liabilities. Claims in excess of this maximum are fully insured through a stop-loss insurance policy. We accrue for workers' compensation and general liabilities on a discounted basis based on claims filed and estimates of claims incurred but not reported. The estimates have been discounted at 2.0% at April 24, 2011 and April 25, 2010, or a discount of $1,758 and 1,714, respectively. We utilize independent consultants to assist in the determination of estimated liabilities. As of April 24, 2011 and April 25, 2010, our employee-related health care benefits program and discounted workers' compensation and general liabilities for unpaid and incurred but not reported claims are $33,046 and $32,739, respectively and are included in accrued liabilities-payroll and related for health care benefits and workers' compensation liabilities and in accrued liabilities-other for general liability in the accompanying consolidated balance sheets. While the total cost of claims incurred depends on future developments, in management's opinion, recorded reserves are adequate to cover future claims payments.
Derivative Instruments and Hedging Activities—ASC Topic 815, Derivatives and Hedging ("ASC 815") requires we recognize all of our derivative instruments as either assets or liabilities in the consolidated balance sheet at fair value and disclose certain qualitative and quantitative information. We utilize derivative financial instruments to manage interest rate risk associated with a portion of our variable rate borrowings. Derivative financial instruments are intended to reduce our exposure to interest rate volatility. We account for changes in the fair value of a derivative instrument depending on the intended use of the derivative and the resulting designation, which is established at the inception of a derivative. ASC 815 requires that a company formally document, at the inception of a hedge, the hedging relationship and the entity's risk management objective and strategy for undertaking the hedge, including identification of the hedging instrument, the hedged item or transaction, the nature of the risk being hedged, the method used to assess effectiveness and the method that will be used to measure hedge ineffectiveness of derivative instruments that receive hedge accounting treatment. For derivative instruments designated as cash flow hedges, changes in fair value, to the extent the hedge is effective, are recognized in other comprehensive income until the hedged item is recognized in earnings, and ineffective hedges are recognized as other income or loss below operating income. Hedge effectiveness is assessed quarterly.
56
ISLE OF CAPRI CASINOS, INC.
NOTES TO CONSOLIDATED FINANCIAL STATEMENTS (Continued)
(amounts in thousands, except share and per share amounts)
2. Summary of Significant Accounting Policies (Continued)
Revenue Recognition—In accordance with gaming industry practice, we recognize casino revenues as the net win from gaming activities. Casino revenues are net of accruals for anticipated payouts of progressive slot jackpots and certain table games wherein incremental jackpot amounts owed are accrued for games in which certain wagers add to the jackpot total. Revenues from rooms, food, beverage, entertainment and the gift shop are recognized at the time the related service or sale is performed or realized.
Promotional Allowances—The retail value of rooms, food and beverage and other services furnished to guests without charge is included in gross revenues and then deducted as promotional allowances to arrive at net revenues included in the accompanying consolidated statements of operations. We also record the redemption of coupons and points for cash as promotional allowances. The estimated cost of providing such complimentary services from continuing operations are included in casino expense in the accompanying consolidated statements of operations are as follows:
| |
Fiscal Year Ended | ||||||||||
|---|---|---|---|---|---|---|---|---|---|---|---|
| |
April 24, 2011 |
April 25, 2010 |
April 26, 2009 |
||||||||
Rooms |
$ | 9,900 | $ | 9,533 | $ | 8,830 | |||||
Food and beverage |
59,322 | 57,796 | 57,251 | ||||||||
Other |
1,152 | 833 | 534 | ||||||||
Total cost of complimentary services |
$ | 70,374 | $ | 68,162 | $ | 66,615 | |||||
Players Club Awards—We provide patrons with rewards based on the dollar amount of play on casino games. A liability has been established based on the estimated value of these outstanding rewards, utilizing the age of the points and prior history of redemptions.
Advertising—Advertising costs are expensed the first time the related advertisement appears. Total advertising costs, including direct mail costs, from continuing operations were $36,404, $32,981, and $27,496 in fiscal years 2011, 2010 and 2009, respectively.
Development Costs—We pursue development opportunities for new gaming facilities in an ongoing effort to expand our business. In accordance with ASC Topic 720, Other Expenses ("ASC 720), costs related to projects in the development stage are recorded as a development expense, except for those costs capitalized in accordance with the guidance of ASC 720. Capitalized development costs are expensed when the development is deemed less than probable. Total development costs expensed from continuing operations were recorded in the consolidated statements of operations in corporate and development expenses.
Pre-Opening Costs—We expense pre-opening costs as incurred. Pre-opening costs include payroll, outside services, advertising, insurance, utilities, travel and various other expenses related to new operations.
Income Taxes—We account for income taxes in accordance ASC Topic 740, Income Taxes ("ASC 740"). ASC 740 requires the recognition of deferred income tax liabilities, deferred income tax assets, net of valuation allowances related to net operating loss carry forwards and certain temporary
57
ISLE OF CAPRI CASINOS, INC.
NOTES TO CONSOLIDATED FINANCIAL STATEMENTS (Continued)
(amounts in thousands, except share and per share amounts)
2. Summary of Significant Accounting Policies (Continued)
differences. Recognizable future tax benefits are subject to a valuation reserve, unless such tax benefits are determined to be more likely than not realizable. We recognize accrued interest and penalties related to unrecognized tax benefits in income tax expense.
Earnings (Loss) Per Common Share—In accordance with the guidance of ASC 260, Earnings Per Share ("ASC 260"), basic earnings (loss) per share ("EPS") is computed by dividing net income (loss) applicable to common stock by the weighted average common shares outstanding during the period. Diluted EPS reflects the additional dilution for all potentially dilutive securities such as stock options. Any options with an exercise price in excess of the average market price of our common stock during the periods presented are not considered when calculating the dilutive effect of stock options for diluted earnings per share calculations.
Stock Compensation—Our stock compensation is accounted for in accordance with ASC Topic 718, Compensation—Stock Compensation ("ASC 718"). Stock compensation cost is measured at the grant date, based on the estimated fair value of the award and is recognized as expense on a straight-line basis over the requisite service period for each separately vesting portion of the award as if the award was, in-substance, multiple awards.
Foreign Currency Translation—We account for currency translation in accordance with ASC Topic 830, Foreign Currency Matters ("ASC 830"). Assets and liabilities denominated in foreign currencies are translated into U.S. dollars at the exchange rate in effect at each balance sheet date. Statement of operations accounts are translated monthly at the average rate of exchange prevailing during the period. Translation adjustments resulting from this process are included in stockholders' equity as accumulated other comprehensive (loss) income. The cumulative loss from foreign currency translation included in other comprehensive loss is $0 and ($133) as of April 24, 2011 and April 25, 2010, respectively.
Allowance for Doubtful Accounts—We reserve for receivables that may not be collected. Methodologies for estimating the allowance for doubtful accounts range from specific reserves to various percentages applied to aged receivables. Historical collection rates are considered, as are customer relationships, in determining specific reserves.
Fair Value Measurements—We follow the guidance of ASC Topic 820, Fair Value Measurements and Disclosures ("ASC 820") for our financial assets and liabilities including marketable securities, restricted cash and investments and derivative instruments. ASC 820 provides a framework for measuring the fair value of financial assets and liabilities. A description of the valuation methodologies used to measure fair value, key inputs, and significant assumptions follows:
Marketable securities—The estimated fair values of our marketable securities are based upon quoted prices available in active markets and represent the amounts we would expect to receive if we sold these marketable securities.
Restricted cash and investments—The estimated fair values of our restricted cash and investments are based upon quoted prices available in active markets and represent the amounts we would expect to receive if we sold these restricted cash and investments.
58
ISLE OF CAPRI CASINOS, INC.
NOTES TO CONSOLIDATED FINANCIAL STATEMENTS (Continued)
(amounts in thousands, except share and per share amounts)
2. Summary of Significant Accounting Policies (Continued)
Derivative instruments—The estimated fair value of our derivative instruments is based on market prices obtained from dealer quotes, which are based on interest yield curves and such quotes represent the estimated amounts we would receive or pay to terminate the contracts.
Recently Issued Accounting Standards—New Pronouncements—ASU No. 2010-16, Entertainment-Casinos (Topic 924): Accruals for Casino Jackpot Liabilities. The Financial Accounting Standards Board issued ASU No. 2010-16, Entertainment-Casinos (Topic 924): Accruals for Casino Jackpot Liabilities. The guidance clarifies that an entity should not accrue jackpot liabilities (or portions thereof) before a jackpot is won if the entity can avoid paying that jackpot since the machine can legally be removed from the gaming floor without payment of the base amount. Jackpots should be accrued and charged to revenue when an entity has the obligation to pay the jackpot. This guidance applies to both base jackpots and the incremental portion of progressive jackpots. The guidance is effective for fiscal years, and interim periods within those fiscal years, beginning on or after December 15, 2010. This guidance should be applied by recording a cumulative-effect adjustment to opening retained earnings in the period of adoption. Our current accounting policy conforms to the new guidance and as such we expect the adoption to have no cumulative effect.
3. Discontinued Operations
Discontinued operations include our former casinos: Dudley and Wolverhampton, England ("Blue Chip") sold in November 2009, Freeport, Grand Bahamas exited in November 2009; and Coventry, England sold in April 2009.
The results of our discontinued operations are summarized as follows:
| |
Discontinued Operatons Fiscal Year Ended |
|||||||||
|---|---|---|---|---|---|---|---|---|---|---|
| |
April 24, 2011 |
April 25, 2010 |
April 26, 2009 |
|||||||
Net revenues |
$ | — | $ | 7,406 | $ | 27,628 | ||||
Valuation charges |
— | — | (1,400 | ) | ||||||
Pretax (loss) gain on sale of discontinued operations |
— | (617 | ) | (12,016 | ) | |||||
Pretax (loss) income from discontinued operations |
1,474 | (2,298 | ) | (27,545 | ) | |||||
Income tax benefit from discontinued operations |
1,978 | 566 | 9,887 | |||||||
Income (loss) from discontinued operations |
3,452 | (1,732 | ) | (17,658 | ) | |||||
During fiscal 2009, we recorded a pretax charge of $1,400 to reduce our Blue Chip assets held for sale to their estimated fair value less the cost to sell and we completed the sale of our assets and terminated our lease in the Arena Coventry Convention Center relating to our casino operations in Coventry, England. Our lease termination costs and other expenses, net of cash proceeds from our assets sales, resulted in a pretax charge of $12,016 recorded in fiscal 2009.
During fiscal 2010, we completed the sale of our Blue Chip casino properties under a plan of administration and have no continuing involvement in their operation. The sale of our Blue Chip assets resulted in a pretax charge of $617 recorded in fiscal 2010.
59
ISLE OF CAPRI CASINOS, INC.
NOTES TO CONSOLIDATED FINANCIAL STATEMENTS (Continued)
(amounts in thousands, except share and per share amounts)
3. Discontinued Operations (Continued)
During fiscal 2011, we recognized a gain of $2,658 including certain tax benefits upon completion of the Blue Chip administration process. We also recognized a tax benefit of $794 in discontinued operations representing the resolution of previously unrecognized tax positions related to Blue Chip following the completion of certain federal tax reviews.
Net interest income (expense) of $0, $8, and ($1,972) for fiscal years 2011, 2010, and 2009, respectively, has been allocated to discontinued operations. Interest expense allocated to our former international operations was based upon long term debt and other long-term obligations specific to such operations.
4. Acquisitions
Acquisition of Rainbow Casino—On June 8, 2010 we completed the acquisition of Rainbow Casino—Vicksburg Partnership, L.P. ("Rainbow") located in Vicksburg, Mississippi. We acquired 100% of the partnership interests and have included the results of Rainbow in our consolidated financial statements subsequent to June 8, 2010. The allocation of the purchase price for these partnership interests was determined based upon estimates of future cash flows and evaluations of the net assets acquired. The transaction was accounted for using the acquisition method in accordance with the accounting guidance under Accounting Standards Codification Topic 805, Business Combinations. As a result, the net assets of Rainbow were recorded at their estimated fair value with the excess of the purchase price over the fair value of the net assets acquired allocated to goodwill. The acquisition was funded by borrowings from our senior secured credit facility.
60
ISLE OF CAPRI CASINOS, INC.
NOTES TO CONSOLIDATED FINANCIAL STATEMENTS (Continued)
(amounts in thousands, except share and per share amounts)
4. Acquisitions (Continued)
The following table sets forth the determination of the consideration paid for Rainbow and the purchase price allocation based upon management's valuation of the net assets acquired.
| |
|
June 8, 2010 | ||||||||
|---|---|---|---|---|---|---|---|---|---|---|
Gross cash purchase price |
$ | 80,000 | ||||||||
Deduct: |
||||||||||
Cash acquired |
(2,540 | ) | ||||||||
Cash refunded by Seller under purchase price adjustments |
(1,293 | ) | ||||||||
Purchase price |
$ | 76,167 | ||||||||
Purchase price allocation: |
||||||||||
Current assets |
$ | 298 | ||||||||
Property and equipment |
38,387 | |||||||||
Intangible assets: |
||||||||||
Customer list |
$ | 9 | ||||||||
Tradename |
544 | |||||||||
Customer relationships |
6,700 | |||||||||
Total intangibles |
7,253 | |||||||||
Goodwill |
32,167 | |||||||||
Other assets |
392 | |||||||||
Current liabilities |
(1,902 | ) | ||||||||
Other liabilities |
(428 | ) | ||||||||
Purchase price |
$ | 76,167 | ||||||||
The useful lives of assets acquired are estimated as follows: customer list—three years; tradename 1.5 years; customer relationships eight years; furniture and equipment one to five years; and other property and equipment fifteen to twenty-five years. Deductible goodwill for tax purposes is estimated to be approximately $33,000.
Net revenue and income (loss) from continuing operations for fiscal 2011 related to Rainbow were $27,935 and ($1,724), respectively.
61
ISLE OF CAPRI CASINOS, INC.
NOTES TO CONSOLIDATED FINANCIAL STATEMENTS (Continued)
(amounts in thousands, except share and per share amounts)
4. Acquisitions (Continued)
The pro forma results of operations, as if the acquisition of Rainbow had occurred on the first day of fiscal 2011 is as follows:
| |
unaudited Fiscal Year Ended |
|||||||
|---|---|---|---|---|---|---|---|---|
| |
April 24, 2011 | April 25, 2010 | ||||||
Pro forma |
||||||||
Net revenues |
$ | 1,009,023 | $ | 1,036,982 | ||||
Income (loss) from continuing operations before income taxes |
4,986 | (3,282 | ) | |||||
Income (loss) from continuing operations |
1,273 | 2,704 | ||||||
Basic earnings (loss) per share from continuing operations |
0.04 | 0.08 | ||||||
Diluted earnings (loss) per share from continuing operations |
0.04 | 0.08 | ||||||
5. Property and Equipment, Net
Property and equipment, net consists of the following:
| |
April 24, 2011 |
April 25, 2010 |
||||||
|---|---|---|---|---|---|---|---|---|
Property and equipment: |
||||||||
Land and land improvements |
$ | 181,261 | $ | 159,442 | ||||
Leasehold improvements |
337,320 | 335,456 | ||||||
Buildings and improvements |
662,539 | 646,811 | ||||||
Riverboats and floating pavilions |
145,216 | 144,470 | ||||||
Furniture, fixtures and equipment |
535,289 | 508,177 | ||||||
Construction in progress |
23,330 | 11,458 | ||||||
Total property and equipment |
1,884,955 | 1,805,814 | ||||||
Less accumulated depreciation and amortization |
(771,406 | ) | (706,872 | ) | ||||
Property and equipment, net |
$ | 1,113,549 | $ | 1,098,942 | ||||
62
ISLE OF CAPRI CASINOS, INC.
NOTES TO CONSOLIDATED FINANCIAL STATEMENTS (Continued)
(amounts in thousands, except share and per share amounts)
6. Intangible Assets and Goodwill
Intangible assets consist of the following:
| |
April 24, 2011 | April 25, 2010 | ||||||||||||||||||
|---|---|---|---|---|---|---|---|---|---|---|---|---|---|---|---|---|---|---|---|---|
| |
Gross Carrying Amount |
Accumulated Amortization |
Net Carrying Amount |
Gross Carrying Amount |
Accumulated Amortization |
Net Carrying Amount |
||||||||||||||
Indefinite-lived assets |
||||||||||||||||||||
Gaming licenses |
$ | 66,126 | $ | — | $ | 66,126 | $ | 66,126 | $ | — | $ | 66,126 | ||||||||
Trademarks |
7,149 | — | 7,149 | 7,149 | — | 7,149 | ||||||||||||||
Intangible assets—subject to amortization |
||||||||||||||||||||
Customer lists |
15,393 | (12,655 | ) | 2,738 | 15,384 | (8,984 | ) | 6,400 | ||||||||||||
Trade name |
544 | (317 | ) | 227 | — | — | — | |||||||||||||
Customer relationships |
6,700 | (733 | ) | 5,967 | — | — | — | |||||||||||||
Total |
$ | 95,912 | $ | (13,705 | ) | $ | 82,207 | $ | 88,659 | $ | (8,984 | ) | $ | 79,675 | ||||||
Our indefinite-lived intangible assets consist primarily of gaming licenses and trademarks for which it is reasonably assured that we will continue to renew indefinitely. Our finite-lived assets consist of customer lists amortized over 2 to 4 years, trade name amortized over 1.5 years, and customer relationships amortized over 8 years. The weighted average remaining life of our other intangible assets subject to amortization is approximately 5.0 years.
We recorded amortization expense of $4,271, $3,913, and $4,624 for our intangible assets subject to amortization related to our continuing operations for the fiscal years ended 2011, 2010, and 2009, respectively.
Future amortization expense of our amortizable intangible assets is as follows:
2012 |
$ | 3,802 | ||
2013 |
838 | |||
2014 |
838 | |||
2015 |
838 | |||
2016 |
838 | |||
Thereafter |
1,778 | |||
Total |
$ | 8,932 | ||
A roll forward of goodwill is as follows:
| |
April 24, 2011 | April 25, 2010 | |||||
|---|---|---|---|---|---|---|---|
Balance, beginning of period |
$ | 313,136 | $ | 313,136 | |||
Addition from Rainbow acquisition |
32,167 | — | |||||
Balance, end of period |
$ | 345,303 | $ | 313,136 | |||
Goodwill includes accumulated impairment losses of $14,801.
63
ISLE OF CAPRI CASINOS, INC.
NOTES TO CONSOLIDATED FINANCIAL STATEMENTS (Continued)
(amounts in thousands, except share and per share amounts)
7. Expense Recoveries and Other Charges, net
We recorded pretax expense recoveries and other charges from continuing operations as follows:
Fiscal 2010—We recorded an expense recovery of $6,762 representing the discounted value of a receivable for reimbursement of development costs expended in prior periods relating to a terminated plan to develop a casino in Pittsburgh, Pennsylvania. This receivable was recorded following a revised assessment of collectability.
Fiscal 2009—An impairment charge of $18,269 was recorded at our Black Hawk, Colorado property as a result of our annual impairment test required under ASC 350. The Black Hawk impairment charge included $7,000, $7,072 and $4,197 related to goodwill, trademarks and gaming licenses, respectively. Fair values were determined using methods as follows: discounted cash flow and multiples of earnings for goodwill, relief from royalty method for trademarks; and the cost approach for the gaming license. The impairment was a result of decreased operating performance caused by a smoking ban which became effective in January, 2009 and declines in the economy resulting in lower market valuation multiples for gaming assets and higher discount rates.
Following our decision not to complete our construction plan as originally designed for our Biloxi property, we recorded a valuation charge of $11,856 to construction in progress.
Following our termination of an agreement for a potential development of a casino project in Portland Oregon, we recorded a $6,000 charge consisting of a non-cash write-off of $5,000 representing our rights under a land option and $1,000 termination fee. Under the terms of the agreement, we retain certain rights but no continuing obligations with regard to this development project.
8. Long-Term Debt
Long-term debt consists of the following:
| |
April 24, 2011 |
April 25, 2010 |
||||||
|---|---|---|---|---|---|---|---|---|
Senior Secured Credit Facility: |
||||||||
Revolving line of credit, expires November 1, 2013, interest payable at least quarterly at either LIBOR and/or prime plus a margin |
$ | 33,000 | $ | 21,500 | ||||
Variable rate term loans, mature November 1, 2013, principal and interest payments due quarterly at either LIBOR and/or prime plus a margin |
500,000 | 817,256 | ||||||
7.75% Senior Notes, interest payable semi-annually March 15 and September 15, net of discount |
297,815 |
— |
||||||
7% Senior Subordinated Notes, interest payable semi-annually March 1 and September 1 |
357,275 | 357,275 | ||||||
Other |
4,504 |
4,858 |
||||||
|
1,192,594 | 1,200,889 | ||||||
Less current maturities |
5,373 | 8,754 | ||||||
Long-term debt |
$ | 1,187,221 | $ | 1,192,135 | ||||
64
ISLE OF CAPRI CASINOS, INC.
NOTES TO CONSOLIDATED FINANCIAL STATEMENTS (Continued)
(amounts in thousands, except share and per share amounts)
8. Long-Term Debt (Continued)
Senior Secured Credit Facility, as amended and restated—Our Credit Facility as amended and restated ("Credit Facility") consists of a $300,000 revolving line of credit and a $500,000 term loan. The Credit Facility is secured on a first priority basis by substantially all of our assets and guaranteed by substantially all of our significant domestic subsidiaries.
On March 25, 2011, we amended and restated our Credit Facility. Among other things, the amendment and restatement (1) extended the maturity of the credit facility to November 1, 2013, or if the 7% Senior Subordinated Notes are refinanced prior to that date, the revolving line of credit matures on March 25, 2016 and term loan matures on March 25, 2017 (2) added a senior secured leverage ratio and modified the maximum total leverage ratio and a minimum interest coverage ratio as well as other covenants to provide financial flexibility through the term of the loans and (3) set the interest rate to LIBOR plus a margin based on total leverage ratio which is initially 3.50%, decreased the LIBOR floor to 1.25% for term loans and eliminated the floor related to revolving line of credit. As a result of the amendment and restatement and in accordance with ASC 470-50, "Debt Modifications and Extinguishments," we incurred expenses of approximately $6,155 related to fees and the write-off of certain unamortized deferred financing costs, of which approximately $3,167 was non-cash, and capitalized deferred financing costs of $9,477.
As a result of a previous amendment, we incurred a charge of approximately $2,143 related to fees and the write-off of certain unamortized deferred financing costs, of which approximately $309 was non-cash, and capitalized deferred financing costs of $3,874 in fiscal 2010.
Our net revolving line of credit availability at April 24, 2011 as limited by our maximum senior secured leverage covenant was approximately $175,000, after consideration of $23,000 in outstanding surety bonds and letters of credit. We have an annual commitment fee related to the unused portion of the Credit Facility of up to 0.625% which is included in Interest expense in the accompanying consolidated statements of operations. The weighted average effective interest rates of the Credit Facility for the fiscal years 2011 and 2010 were 6.25% and 4.83%, respectively.
The Credit Facility includes a number of affirmative and negative covenants. Additionally, we must comply with certain financial covenants including maintenance of a total leverage ratio, senior secured leverage ratio and minimum interest coverage ratio. The Credit Facility also restricts our ability to make certain investments or distributions. We are in compliance with the covenants as of April 24, 2011.
7.75% Senior Notes—On March 7, 2011, we issued $300,000 of 7.75% Senior Notes due 2019 through a private placement at a price of 99.264% ("7.75% Senior Notes"). The net proceeds from the issuance were used to repay term loans under our Credit Facility. The 7.75% Senior Notes are guaranteed, on a joint and several basis, by substantially all of our significant domestic subsidiaries and certain other subsidiaries as described in Note 21. All of the guarantor subsidiaries are wholly owned by us. The 7.75% Senior Notes are general unsecured obligations and rank junior to all of our senior secured indebtedness and senior to our senior subordinated indebtedness. The 7.75% Senior Notes are redeemable, in whole or in part, at our option at any time on or after March 15, 2015, with call premiums as defined in the indenture governing the 7.75% Senior Notes. In connection with the private placement of the notes, we entered into a registration rights agreement with the initial purchasers in which we agreed to file a registration statement with the SEC to permit the holders to
65
ISLE OF CAPRI CASINOS, INC.
NOTES TO CONSOLIDATED FINANCIAL STATEMENTS (Continued)
(amounts in thousands, except share and per share amounts)
8. Long-Term Debt (Continued)
exchange or resell the notes within 180 days after the issuance of the notes, subject to certain suspension and other rights set forth in the registration rights agreement. As a result of the issuance, we capitalized deferred financing costs of $5,346.
The indenture governing the 7.75% Senior Notes limits, among other things, our ability and our restricted subsidiaries ability to borrow money, make restricted payments, use assets as security in other transactions, enter into transactions with affiliates, pay dividends, or repurchase stock. The indenture also limits our ability to issue and sell capital stock of subsidiaries, sell assets in excess of specified amounts or merge with or into other companies.
7% Senior Subordinated Notes—During 2004, we issued $500,000 of 7% Senior Subordinated Notes due 2014 ("7% Senior Subordinated Notes"). The 7% Senior Subordinated Notes are guaranteed, on a joint and several basis, by all of our significant domestic subsidiaries and certain other subsidiaries as described in Note 21. All of the guarantor subsidiaries are wholly owned by us. The 7% Senior Subordinated Notes are general unsecured obligations and rank junior to all of our senior indebtedness. The 7% Senior Subordinated Notes are redeemable, in whole or in part, at our option at any time on or after March 1, 2009, with call premiums as defined in the indenture governing the 7% Senior Subordinated Notes.
The indenture governing the 7% Senior Subordinated Notes limits, among other things, our ability and our restricted subsidiaries ability to borrow money, make restricted payments, use assets as security in other transactions, enter into transactions with affiliates, pay dividends, or repurchase stock. The indenture also limits our ability to issue and sell capital stock of subsidiaries, sell assets in excess of specified amounts or merge with or into other companies.
Gain (Loss) on Early Extinguishment of Debt—During February 2009, we retired $142,725 of the 7% Senior Subordinated Notes, through a tender offer, for $82,773 from our available Cash and cash equivalents. After expenses related to the elimination of deferred finance costs and transactions costs, we recognized a pretax gain of $57,892 during fiscal 2009. During March 2009, we repaid $35,000 of our term loans under our Credit Facility resulting in a loss on early extinguishment of debt of $199 due to the write-off of deferred financing cost.
Future Principal Payments of Long-term Debt—The aggregate principal payments due on long-term debt as of April 24, 2011 over the next five years and thereafter, are as follows:
Fiscal Years Ending:
|
|
|||
|---|---|---|---|---|
2012 |
$ | 5,362 | ||
2013 |
5,381 | |||
2014 |
880,676 | |||
2015 |
426 | |||
2016 |
215 | |||
Thereafter |
302,719 | |||
|
1,194,779 | |||
Unamortized debt discount |
(2,185 | ) | ||
|
$ | 1,192,594 | ||
66
ISLE OF CAPRI CASINOS, INC.
NOTES TO CONSOLIDATED FINANCIAL STATEMENTS (Continued)
(amounts in thousands, except share and per share amounts)
9. Other Long-Term Obligations
Quad Cities Waterfront Convention Center—We entered into agreements with the City of Bettendorf, Iowa under which the City constructed a convention center which opened in January 2009, adjacent to our hotel. We lease, manage, and provide financial and operating support for the convention center. The Company was deemed, for accounting purposes only, to be the owner of the convention center during the construction period. Upon completion of the convention center we were precluded from accounting for the transaction as a sale and leaseback due to our continuing involvement. Therefore, we are accounting for the transaction using the direct financing method. As of April 24, 2011, we have recorded in other long-term obligations $16,694 related to our liability under ASC 840 related to the convention center. Under the terms of our agreements for the convention center, we have guaranteed certain obligations related to $13,815 of notes issued by the City of Bettendorf, Iowa for the convention center.
The other long term obligation will be reflected in our consolidated balance sheets until completion of the lease term, at which time the related fixed assets, net of accumulated depreciation, will be removed from our consolidated financial statements and the net remaining obligation over the net carrying value of the fixed asset will be recognized as a gain (loss) on sale of the facility.
Future minimum payments due under other long-term obligations, including interest, as of April 24, 2011 as follows:
Fiscal Years Ending:
|
|
|||
|---|---|---|---|---|
2012 |
$ | 1,100 | ||
2013 |
1,100 | |||
2014 |
1,267 | |||
2015 |
1,600 | |||
2016 |
1,766 | |||
Thereafter |
15,770 | |||
Total minimum payments |
$ | 22,603 | ||
67
ISLE OF CAPRI CASINOS, INC.
NOTES TO CONSOLIDATED FINANCIAL STATEMENTS (Continued)
(amounts in thousands, except share and per share amounts)
10. Earnings Per Share
The following table sets forth the computation of basic and diluted earnings (loss) per share (in thousands, except share and per share amounts):
| |
Fiscal Year Ended | ||||||||||||
|---|---|---|---|---|---|---|---|---|---|---|---|---|---|
| |
April 24, 2011 |
April 25, 2010 |
April 26, 2009 |
||||||||||
Numerator: |
|||||||||||||
Income (loss) applicable to common shares: |
|||||||||||||
Income (loss) from continuing operations attributable to common stockholders |
$ | 1,088 | $ | (1,541 | ) | $ | 61,233 | ||||||
Income (loss) from discontinued operations |
3,452 | (1,732 | ) | (17,658 | ) | ||||||||
Net income (loss) attributable to the common stockholders |
$ | 4,540 | $ | (3,273 | ) | $ | 43,575 | ||||||
Denominator: |
|||||||||||||
Denominator for basic earnings (loss) per share—weighted average shares |
34,066,159 | 32,245,769 | 31,372,670 | ||||||||||
Effect of dilutive securities |
|||||||||||||
Employee stock options |
108,558 | — | 6,346 | ||||||||||
Denominator for diluted earnings (loss) per share—adjusted weighted average shares and assumed conversions |
34,174,717 | 32,245,769 | 31,379,016 | ||||||||||
Basic earnings (loss) per share attributable to common stockholders |
|||||||||||||
Income (loss) from continuing operations |
$ | 0.03 | $ | (0.05 | ) | $ | 1.95 | ||||||
Income (loss) from discontinued operations |
0.10 | (0.05 | ) | (0.56 | ) | ||||||||
Net income (loss) attributable to common stockholders |
$ | 0.13 | $ | (0.10 | ) | $ | 1.39 | ||||||
Diluted earnings (loss) per share attributable to common stockholders |
|||||||||||||
Income (loss) from continuing operations |
$ | 0.03 | $ | (0.05 | ) | $ | 1.95 | ||||||
Income (loss) from discontinued operations |
0.10 | (0.05 | ) | (0.56 | ) | ||||||||
Net income (loss) attributable to common stockholders |
$ | 0.13 | $ | (0.10 | ) | $ | 1.39 | ||||||
During January 2011, we completed the sale of 5.3 million shares of common stock generating net proceeds of $51,227. Proceeds from our equity offering were used to repay long-term debt.
Stock options representing 469,710, which were anti-dilutive, were excluded from the calculation of common shares for diluted earnings per share for fiscal 2011. Due to the loss from continuing operations, stock options representing 116,511 shares, which are potentially dilutive and 495,474 shares, which are anti-dilutive, were excluded from the calculation of common shares for diluted earnings (loss) per share for fiscal 2010. Stock options representing 1,520,040 shares, which were anti-dilutive, were excluded from the calculation of common shares for diluted earnings (loss) per share for fiscal 2009.
68
ISLE OF CAPRI CASINOS, INC.
NOTES TO CONSOLIDATED FINANCIAL STATEMENTS (Continued)
(amounts in thousands, except share and per share amounts)
11. Stock Based Compensation
Under our amended and restated Long Term Incentive Plan, we have issued stock options and restricted stock.
Stock Options—We have issued incentive stock options and nonqualified stock options which have a maximum term of 10 years and are, generally, exercisable in yearly installments of 20% commencing one year after the date of grant. As of April 24, 2011, our aggregate forfeiture rate was 19%.
We granted stock options during fiscal 2010 and 2009 and estimated the fair value of each option grant on the date of the grant using the Black-Scholes-Merton option-pricing model with the range of assumptions disclosed in the following table:
| |
Fiscal Year Ended | ||||||
|---|---|---|---|---|---|---|---|
| |
April 25, 2010 | April 26, 2009 | |||||
Weighted average expected volatility |
67.86 | % | 42.29 | % | |||
Expected dividend yield |
0.00 | % | 0.00 | % | |||
Weighted average expected term (in years) |
7 | 6.79 | |||||
Weighted average risk-free interest rate |
3.07 | % | 3.50 | % | |||
Weighted average fair value of options granted |
$ | 7.53 | $ | 2.73 | |||
Weighted average volatility is calculated using the historical volatility of our stock price over a range of dates equal to the expected term of a grant's options. The weighted average expected term is calculated using historical data that is representative of the option for which the fair value is to be determined. The expected term represents the period of time that options granted are expected to be outstanding. The weighted average risk-free rate is based on the U.S. Treasury yield curve in effect at the time of the grant for the approximate period of time equivalent to the grant's expected term.
Tender Offer—On October 7, 2008, we completed a tender offer whereby certain employees and directors exchanged 2,067,201 outstanding stock options for 293,760 shares of restricted common stock and the payment of $155 in cash to eligible participants in accordance with the terms of the tender offer. Restricted shares issued as part of the tender offer vest three years from the date of issuance. At April 24, 2011, our estimated forfeiture rate for these shares was 7.7%.
Restricted Stock—We issue shares of restricted common stock to employees and directors under our Long Term Incentive Plan. Restricted stock awarded to employees vests one-third on each anniversary of the grant date and for directors vests one-half on the grant date and one-half on the first anniversary of the grant date. Our estimate of forfeitures for restricted stock for employees and directors is 10% and 0%, respectively.
Stock Compensation Expense—Total stock compensation expense from continuing operations in the accompanying consolidated statements of operations was $7,595, $7,628, and $7,103 for the fiscal years 2011, 2010, and 2009, respectively. We recognize compensation expense for these awards on a straight-line basis over the requisite service period for each separately vesting portion of the award.
69
ISLE OF CAPRI CASINOS, INC.
NOTES TO CONSOLIDATED FINANCIAL STATEMENTS (Continued)
(amounts in thousands, except share and per share amounts)
11. Stock Based Compensation (Continued)
Activity Under Our Share Based Plans—A summary of restricted stock and option activity for fiscal 2011 is presented below:
| |
Restricted Stock | Weighted Average Grant-Date Fair Value |
Options | Weighted Average Exercise Price |
|||||||||||
|---|---|---|---|---|---|---|---|---|---|---|---|---|---|---|---|
Outstanding at April 25, 2010 |
1,078,717 | $ | 9.35 | 1,435,185 | $ | 11.29 | |||||||||
Granted |
497,373 | 8.26 | — | — | |||||||||||
Exercised |
— | — | (3,575 | ) | 6.50 | ||||||||||
Vested |
(464,073 | ) | 9.60 | — | — | ||||||||||
Forfeited and expired |
(20,418 | ) | 8.59 | (64,500 | ) | 15.98 | |||||||||
Outstanding at April 24, 2011 |
1,091,599 | $ | 8.76 | 1,367,110 | $ | 11.08 | |||||||||
As of April 24, 2011: |
|||||||||||||||
Outstanding exercisable options |
n/a | 898,670 | $ | 12.33 | |||||||||||
Weighted average remaining contractual term |
0.8 years | 5.6 years | |||||||||||||
Aggregate intrinsic value: |
|||||||||||||||
Outstanding exercisable |
n/a | $ | 2.24 | ||||||||||||
Outstanding |
$ | 8.76 | $ | 2.33 | |||||||||||
Nonvested: |
|||||||||||||||
Unrecognized compensation cost |
$ | 3,385 | $ | 670 | |||||||||||
Weighted average remaining vesting period |
0.8 years | 2.2 years | |||||||||||||
Additional information relating to our share based plans is as follows:
| |
April 24, 2011 |
April 25, 2010 |
April 26, 2009 |
||||||||
|---|---|---|---|---|---|---|---|---|---|---|---|
Restricted Stock: |
|||||||||||
Fair value of restricted stock vested during the year |
$ | 4,457 | $ | 2,146 | $ | 512 | |||||
Stock Options: |
|||||||||||
Intrinsic value of stock options exercised |
11 | 30 | 141 | ||||||||
Proceeds from stock option exercises |
23 | 204 | 110 | ||||||||
We have 1,807,841 shares available for future issuance under our equity compensation plan as of April 24, 2011. Upon issuance of restricted shares or exercise of stock options, shares may be issued from available treasury or common shares.
Stock-Based Compensation—Deferred Bonus Plan—Our stockholders have approved the Deferred Bonus Plan which provides for the issuance of non-vested stock to eligible officers and employees who agree to receive a deferred bonus in the form of non-vested stock. The vesting of the stock is dependent upon continued service to the Company for a period of five years and the fair value of the non-vested stock at the grant date is amortized ratably over the vesting period. Compensation expense related to stock-based compensation under the Deferred Bonus Plan for fiscal years 2011, 2010, and 2009 totaled $0, $100, and $175, respectively. We do not plan to award any further compensation under
70
ISLE OF CAPRI CASINOS, INC.
NOTES TO CONSOLIDATED FINANCIAL STATEMENTS (Continued)
(amounts in thousands, except share and per share amounts)
11. Stock Based Compensation (Continued)
the Deferred Bonus Plan, however, any grants that have been awarded prior to the Deferred Bonus Plan's discontinuation will be paid provided the vesting requirements are met.
A summary of activity for fiscal 2011 under the deferred bonus plan is as follows:
| |
Number of Shares |
Weighted Average Grant Date Fair Value |
|||||
|---|---|---|---|---|---|---|---|
Non-vested stock at April 25, 2010 |
10,646 | $ | 27.54 | ||||
Shares vested |
(10,646 | ) | 27.54 | ||||
Non-vested stock at April 24, 2011 |
— | $ | — | ||||
The total weighted average fair value of shares vested related to the Deferred Bonus Plan for fiscal years 2011, 2010, and 2009 was $293, $276, and $515, respectively.
Stock Repurchase—Our Board of Directors has approved a stock repurchase program, as amended, allowing up to 6,000,000 shares of our common stock to be repurchased. As of April 24, 2011, we have repurchased 4,895,792 shares of common stock, and retired 553,800 shares of common stock under this stock repurchase program. No shares were repurchased in fiscal years 2011, 2010 or 2009.
12. Deferred Compensation Plans
2005 Deferred Compensation Plan—Our 2005 Deferred Compensation Plan (the "Plan"), as amended and restated, is an unfunded deferred compensation arrangement for the benefit of key management officers and employees of the Company and its subsidiaries. The terms of the Plan include the ability of the participants to defer, on a pre-tax basis, salary, and bonus payments in excess of the amount permitted under IRS Code Section 401(k). The terms also allow for a discretionary annual matching contribution by the Company. The Plan allows for the aggregation and investment of deferred amounts in notional investment alternatives, including units representing shares of our common stock. The liability related to the Plan as of April 24, 2011 and April 25, 2010 was $3,016 and $3,069, respectively, and is included in long-term other accrued liabilities in the consolidated balance sheets. Expense for our contributions related to the Plan was $54, $83 and $104 in fiscal years 2011, 2010 and 2009, respectively.
13. Supplemental Disclosure of Cash Flow Information
For the fiscal years 2011, 2010 and 2009 we made cash payments for interest, net of capitalized interest of $84,506, $71,623, and $90,706, respectively. We collected an income tax refund net of payments of $5,599, $1,561 and $20,164 for fiscal years 2011, 2010 and 2009, respectively.
For fiscal 2009, we purchased property and equipment financed with a long term obligation of $14,384 as discussed in Note 9.
71
ISLE OF CAPRI CASINOS, INC.
NOTES TO CONSOLIDATED FINANCIAL STATEMENTS (Continued)
(amounts in thousands, except share and per share amounts)
14. Income Taxes
Income tax (benefit) provision from continuing operations consists of the following:
| |
Fiscal Year Ended | |||||||||
|---|---|---|---|---|---|---|---|---|---|---|
| |
April 24, 2011 |
April 25, 2010 |
April 26, 2009 |
|||||||
Current: |
||||||||||
Federal |
$ | (725 | ) | $ | (868 | ) | $ | — | ||
State |
(483 | ) | 718 | 3,010 | ||||||
|
(1,208 | ) | (150 | ) | 3,010 | |||||
Deferred: |
||||||||||
Federal |
2,645 | (2,976 | ) | 35,309 | ||||||
State |
2,163 | (5,248 | ) | 2,720 | ||||||
|
4,808 | (8,224 | ) | 38,029 | ||||||
Income tax (benefit) provision |
$ | 3,600 | $ | (8,374 | ) | $ | 41,039 | |||
A reconciliation of income taxes from continuing operations at the statutory corporate federal tax rate of 35% to the income tax (benefit) provision reported in the accompanying consolidated statements of operations is as follows:
| |
Fiscal Year Ended | |||||||||||
|---|---|---|---|---|---|---|---|---|---|---|---|---|
| |
April 24, 2011 |
April 25, 2010 |
April 26, 2009 |
|||||||||
Statutory tax (benefit) provision |
$ | 1,641 | $ | (3,469 | ) | $ | 35,794 | |||||
Effects of : |
||||||||||||
State taxes |
1,680 | 197 | 5,730 | |||||||||
Reduction of unrecognized tax benefits |
— | (4,727 | ) | — | ||||||||
Other |
||||||||||||
Lobbying |
746 | 397 | 1,192 | |||||||||
Employment tax credits |
(671 | ) | (784 | ) | (1,333 | ) | ||||||
Fines & Penalties |
81 | 58 | 37 | |||||||||
Meals & Entertainment |
78 | 57 | 50 | |||||||||
Qualified stock option expense (benefit) |
44 | (240 | ) | 644 | ||||||||
Various permanent differences |
(13 | ) | 25 | 23 | ||||||||
Interest |
(131 | ) | — | (455 | ) | |||||||
Other |
145 | 112 | (643 | ) | ||||||||
Income tax (benefit) provision |
$ | 3,600 | $ | (8,374 | ) | $ | 41,039 | |||||
72
ISLE OF CAPRI CASINOS, INC.
NOTES TO CONSOLIDATED FINANCIAL STATEMENTS (Continued)
(amounts in thousands, except share and per share amounts)
14. Income Taxes (Continued)
Significant components of our domestic net deferred income tax asset (liability) are as follows:
| |
Fiscal Year Ended | |||||||
|---|---|---|---|---|---|---|---|---|
| |
April 24, 2011 |
April 25, 2010 |
||||||
Deferred tax liabilities: |
||||||||
Property and equipment |
$ | (68,075 | ) | $ | (58,009 | ) | ||
Goodwill and intangibles |
(29,762 | ) | (25,821 | ) | ||||
Gain on early extinguishment of debt |
(21,593 | ) | (22,416 | ) | ||||
Other |
(1,809 | ) | (8,696 | ) | ||||
Total deferred tax liabilities |
(121,239 | ) | (114,942 | ) | ||||
Deferred tax assets: |
||||||||
Net operating losses |
64,042 | 71,723 | ||||||
Employment tax credits |
17,398 | 15,893 | ||||||
Accrued expenses |
10,521 | 11,289 | ||||||
Alternative minimum tax credit |
1,338 | 1,696 | ||||||
Capital loss carryover |
— | 1,576 | ||||||
Other |
13,971 | 9,951 | ||||||
Total deferred tax assets |
107,270 | 112,128 | ||||||
Valuation allowance on deferred tax assets |
(4,696 | ) | (9,553 | ) | ||||
Net deferred tax asset |
102,574 | 102,575 | ||||||
Net deferred tax asset/(liability) |
$ | (18,665 | ) | $ | (12,367 | ) | ||
At April 24, 2011, we have federal net operating loss carryforwards of $153,132 for income tax purposes, with expiration dates from fiscal 2024 to 2031. Approximately $47,189 of these net operating losses are attributable to IC Holdings Colorado, Inc. and its wholly-owned subsidiary CCSC/Blackhawk, Inc. ("IC Holdings, Inc. & Sub") and can only be used to offset income earned by these entities. The remaining federal net operating losses are subject to limitations under the internal revenue code and underlying treasury regulations, which may limit the amount ultimately utilized; however, we believe that all federal net operating losses will be utilized prior to expiration. We also have various state income tax net operating loss carryforwards totaling $236,144 with expiration dates from fiscal 2012 to 2031. We have determined that it is more likely than not that we will not be able to utilize $112,955 of the state income tax net operating losses and have established valuation allowances accordingly. If or when recognized, the tax benefits relating to any reversal of the valuation allowance on deferred tax assets as of April 24, 2011 will be accounted for as a reduction of income tax expense. We also have a federal general business credit carryforward of $17,398 for income tax purposes, with expiration dates from fiscal 2018 to 2031. We believe that these credits will be utilized prior to expiration. Deferred income taxes related to NOL carryforwards have been classified as noncurrent to reflect the expected utilization of the carryforwards.
73
ISLE OF CAPRI CASINOS, INC.
NOTES TO CONSOLIDATED FINANCIAL STATEMENTS (Continued)
(amounts in thousands, except share and per share amounts)
14. Income Taxes (Continued)
We account for unrecognized tax benefits in accordance with ASC 740. A reconciliation of the beginning and ending amounts of unrecognized tax benefits as follows:
| |
April 24, 2011 |
April 25, 2010 |
April 26, 2009 |
|||||||
|---|---|---|---|---|---|---|---|---|---|---|
Beginning Balance |
$ | 12,126 | $ | 19,482 | $ | 21,819 | ||||
Gross increases—tax positions in current period |
— | — | — | |||||||
Gross increases—tax positions in prior periods |
144 | — | 347 | |||||||
Gross decreases—tax positions in prior periods |
(779 | ) | (5,254 | ) | — | |||||
Settlements |
— | (2,102 | ) | (550 | ) | |||||
Lapse of statute of limitations |
— | — | (2,134 | ) | ||||||
Ending Balance |
$ | 11,491 | $ | 12,126 | $ | 19,482 | ||||
Included in the balance of unrecognized tax benefits at April 24, 2011 are $2,955 of tax benefits that, if recognized, would affect the effective tax rate. Also included in the balance of unrecognized tax benefits at April 24, 2011 are $6,704 of tax benefits that, if recognized, would result in adjustments to deferred taxes.
We recognize accrued interest and penalties related to unrecognized tax benefits in income tax expense. Related to the unrecognized tax benefits noted above, we recorded interest expense of ($460) in fiscal 2011 related to prior periods. We accrued no penalties during the fiscal year ended 2011. In total, as of April 24, 2011, we have recognized a liability of $2,154 for interest and no amount for penalties.
We believe that an increase in unrecognized tax benefits related to federal and state exposures in the coming year, though possible, cannot be reasonably estimated and will not be significant. In addition, we believe that it is reasonably possible that an amount between $0 and $2,955 of our currently remaining unrecognized tax positions may be recognized by the end of the fiscal year ending April 29, 2012. These amounts relate to positions taken on Mississippi income tax returns for the fiscal years ending April 2002 through April 2008. The Mississippi Department of Revenue has completed its examination of the income tax returns for these years and has issued its assessment. We plan to file an appeal and expect to resolve this issue during the next twelve months.
On April 30, 2011, the Federal statute of limitation for the fiscal years ending April 30, 2006 and April 29, 2007 lapsed. Consequently, we plan to recognize approximately $6,704 of Federal and $475 of state tax benefits during the fiscal year ending April 29, 2012.
We file income tax returns in the U.S. Federal jurisdiction and various state jurisdictions. During fiscal 2010, the IRS completed its examination of our Federal income tax returns for the 2006 and 2007 tax years which relate to our fiscal years ended April 29, 2007 and April 27, 2008, respectively. We recorded a tax benefit of $168 in fiscal 2010 related to the examination. These income tax examination changes were reviewed by the U.S. Congress Joint Committee on Taxation and agreed to during the fiscal year ending April 24, 2011. In addition, various state jurisdictions are currently examining our state income tax returns for various subsidiaries. The tax returns for subsequent years are also subject to examination.
74
ISLE OF CAPRI CASINOS, INC.
NOTES TO CONSOLIDATED FINANCIAL STATEMENTS (Continued)
(amounts in thousands, except share and per share amounts)
14. Income Taxes (Continued)
We file in numerous state jurisdictions with varying statutes of limitations. Our unrecognized state tax benefits are related to state tax returns open from tax years 2002 through 2011 depending on each state's statute of limitations.
15. Hurricane and Other Insurance Recoveries
During fiscal year 2009, we received insurance recoveries related to various claims. These insurance recoveries are from claims filed pertaining to our property in Biloxi, Mississippi, which was struck in the fall of 2005 by Hurricane Katrina. Additionally, we received insurance recoveries relating to flood claims at our Davenport and Natchez properties during fiscal 2009.
Business interruption insurance proceeds are included as revenues under Hurricane and other insurance recoveries in our consolidated statement of operations. Other insurance proceeds, after collection of insurance receivables are included as a reduction of operating expenses under hurricane and other insurance recoveries in our consolidated statement of operations.
The significant component of our fiscal 2009 insurance recoveries is the final payment of our $225,000 settlement related to Hurricane Katrina which had damaged our Biloxi, Mississippi property. As a result of this settlement, we received an additional $95,000 in insurance proceeds. After first applying the proceeds to our remaining insurance receivable, we recognized $92,179 of pretax income including $60,000 of business interruption proceeds included in net revenues and other insurance recoveries of $32,179 are recorded as a reduction of operating expenses.
16. Employee Benefit Plan
401(k) Plan—We have a 401(k) plan covering substantially all of our employees who have completed 90 days of service. Expense for our contributions for continuing operations related to the 401(k) plan was $1,371, $1,465, and $1,500 in fiscal years 2011, 2010, and 2009, respectively. Our contribution is based on a percentage of employee contributions and may include an additional discretionary amount.
17. Related Party Transactions
Effective February 2010, we amended a lease with an entity owned by certain of our stockholders resulting a payment of $60 annually for a parking area adjacent to one of our casinos. Prior to this lease amendment, we leased on a month to month basis this parking area and a warehouse for $23 per month.
In 2005, one of our wholly owned subsidiaries, Isle of Capri Bettendorf, L.C., entered into a Development Agreement with the City of Bettendorf, Iowa and Green Bridge Company relating to the development of a conference/events center in Bettendorf, Iowa, the expansion of the hotel at Bettendorf and related facilities, including a skywalk between the hotel and conference/events center and a parking facility. Green Bridge Company is indirectly owned by certain of our directors. Isle of Capri Bettendorf, L.C. will hold Green Bridge Company harmless from certain future increases in assessments on adjacent property owned by Green Bridge Company, capped at $4,500.
75
ISLE OF CAPRI CASINOS, INC.
NOTES TO CONSOLIDATED FINANCIAL STATEMENTS (Continued)
(amounts in thousands, except share and per share amounts)
18. Interest Rate Derivatives
We have entered into various interest rate derivative agreements in order to manage market risk on variable rate term loans outstanding. We have interest rate swap agreements with an aggregate notional value of $100,000 with maturity dates in fiscal 2012 and 2014. We have also entered into interest rate cap contracts with an aggregate notional value of $220,000 having maturity dates in fiscal 2012 and 2013 and paid premiums of $203 at inception.
As a result of an amendment to our Credit Facility in the fourth quarter of fiscal 2010, our interest rate swaps no longer meet the criteria for hedge effectiveness, and therefore changes in the fair value of the swaps subsequent to the date of ineffectiveness in February 2010, are recorded in derivative income (expense) in the consolidated statements of operations. Prior to their ineffectiveness, changes in the fair value of these interest rate swaps were adjusted through other comprehensive income (loss) as these derivative instruments qualified for hedge accounting. The cumulative loss recorded in other comprehensive income (loss) through the date of ineffectiveness is being amortized into derivative expense over the remaining term of the individual interest rate swap agreements or when the underlying transaction is no longer expected to occur. As of April 24, 2011, the weighted average fixed LIBOR interest rate of our interest rate swap agreements was 4.25%.
The interest rate cap agreements meet the criteria for hedge accounting for cash flow hedges and have been evaluated, as of April 24, 2011 as being fully effective. As a result, there is no impact on our consolidated statement of operations from changes in fair value of the interest rate cap agreements.
The loss recorded in accumulated other comprehensive income (loss) of our interest rate swap contracts is recorded net of deferred income tax benefits of $1,295 and $4,704, as of April 24, 2011 and April 25, 2010, respectively. The loss recorded in accumulated other comprehensive income (loss) for our interest rate cap contracts is recorded net of deferred income tax benefits of $49 and $30 as of April 24, 2011 and April 25, 2010, respectively.
The fair values of derivatives included in our consolidated balance sheet are as follows:
Type of Derivative Instrument
|
Balance Sheet Location | April 24, 2011 | April 25, 2010 | ||||||
|---|---|---|---|---|---|---|---|---|---|
Interest rate cap contracts |
Prepaid deposits and other | $ | 29 | $ | 24 | ||||
Interest rate swap contracts |
Accrued interest | 1,439 | 6,704 | ||||||
Interest rate swap contracts |
Other long-term liabilities | 3,594 | 6,247 | ||||||
We recorded derivative income of $7,918 and $3,541 in the statement of operations related to the change in fair value of interest rate swap contracts during the years ended April 24, 2011 and April 25, 2010, respectively.
Additionally, during the year ended April 24, 2011, we realized derivative expense of $9,132 associated with the amortization of $5,724, net of taxes of $3,408, in cumulative loss recorded in other comprehensive income (loss) for the interest rate swaps through the date of their ineffectiveness. During the year ended April 25, 2010, we recorded derivative expense of $3,912 associated with the amortization of $2,449, net of taxes of $1,463, in cumulative loss recorded in other comprehensive income (loss) for the interest rate swaps through the date of their ineffectiveness.
The change in unrealized gain (loss) on our derivatives qualifying for hedge accounting was $5 and $7,139 for fiscal years 2011 and 2010, respectively.
76
ISLE OF CAPRI CASINOS, INC.
NOTES TO CONSOLIDATED FINANCIAL STATEMENTS (Continued)
(amounts in thousands, except share and per share amounts)
18. Interest Rate Derivatives (Continued)
The amount of accumulated other comprehensive income (loss) related to interest rate swap contracts and interest rate cap contracts maturing within the next twelve months was $1,398, net of tax of $841, as of April 24, 2011.
19. Fair Value
The fair value of our interest swap and cap contracts are recorded using Level 3 inputs at the present value of all expected future cash flows based on the LIBOR-based yield curve as of the date of the valuation.
The following table presents the changes in Level 3 liabilities measured at fair value on a recurring basis for the fiscal years ended April 24, 2011 and April 25, 2010:
| |
Fiscal Year Ended | |||||||
|---|---|---|---|---|---|---|---|---|
| |
April 24, 2011 | April 25, 2010 | ||||||
Interest Rate Derivatives |
||||||||
Beginning balance |
$ | (12,927 | ) | $ | (23,712 | ) | ||
Realized gains |
7,918 | 3,541 | ||||||
Unrealized gains |
5 | 7,244 | ||||||
Ending balance |
$ | (5,004 | ) | $ | (12,927 | ) | ||
Financial Instruments—The estimated carrying amounts and fair values of our other financial instruments are as follows:
| |
April 24, 2011 | April 25, 2010 | |||||||||||
|---|---|---|---|---|---|---|---|---|---|---|---|---|---|
| |
Carrying Amount |
Fair Value | Carrying Amount |
Fair Value | |||||||||
Financial assets: |
|||||||||||||
Cash and cash equivalents |
$ | 75,178 | $ | 75,178 | $ | 68,069 | $ | 68,069 | |||||
Marketable securities |
22,173 | 22,173 | 22,926 | 22,296 | |||||||||
Restricted cash and investments |
12,810 | 12,810 | 2,774 | 2,774 | |||||||||
Notes receivable |
3,788 | 3,788 | 8,751 | 8,751 | |||||||||
Financial liabilities: |
|||||||||||||
Revolving line of credit |
$ | 33,000 | $ | 31,350 | $ | 21,500 | $ | 20,855 | |||||
Variable rate term loans |
500,000 | 505,000 | 817,256 | 800,911 | |||||||||
7.75% Senior notes |
297,815 | 305,055 | — | — | |||||||||
7% Senior subordinated notes |
357,275 | 358,615 | 357,275 | 326,013 | |||||||||
Other long-term debt |
4,504 | 4,504 | 4,858 | 4,858 | |||||||||
Other long-term obligations |
16,694 | 16,694 | 17,166 | 17,166 | |||||||||
The following methods and assumptions were used to estimate the fair value of each class of financial instruments for which it is practicable to estimate that value:
Cash and cash equivalents and notes receivable are carried at cost, which approximates fair value due to their short-term maturities.
77
ISLE OF CAPRI CASINOS, INC.
NOTES TO CONSOLIDATED FINANCIAL STATEMENTS (Continued)
(amounts in thousands, except share and per share amounts)
19. Fair Value (Continued)
Marketable securities and restricted cash and investments are based upon Level 1 inputs obtained from quoted prices available in active markets and represent the amounts we would expect to receive if we sold these assets.
The fair value of our long-term debt or other long-term obligations is estimated based on the quoted market price of the underlying debt issue or, when a quoted market price is not available, the discounted cash flow of future payments utilizing current rates available to us for debt of similar remaining maturities. Debt obligations with a short remaining maturity have a carrying amount that approximates fair value.
20. Accumulated Other Comprehensive Income (Loss)
A detail of accumulated other comprehensive income (loss) is as follows:
| |
April 24, 2011 | April 25, 2010 | |||||
|---|---|---|---|---|---|---|---|
Interest rate cap contracts |
$ | (82 | ) | $ | (50 | ) | |
Interest rate swap contracts |
(2,153 | ) | (7,877 | ) | |||
Foreign currency translation loss |
— | (133 | ) | ||||
|
$ | (2,235 | ) | $ | (8,060 | ) | |
The amount of change in the gain (loss) recognized in accumulated other comprehensive income (loss) related to derivative instruments is as follows:
| |
Fiscal Year Ended | ||||||
|---|---|---|---|---|---|---|---|
Type of Derivative Instrument
|
April 24, 2011 | April 25, 2010 | |||||
Interest rate cap contracts |
$ | (32 | ) | $ | (50 | ) | |
Interest rate swap contracts |
5,724 | 6,955 | |||||
|
$ | 5,692 | $ | 6,905 | |||
21. Consolidating Condensed Financial Information
Certain of our wholly owned subsidiaries have fully and unconditionally guaranteed on a joint and several basis, the payment of all obligations under our 7.75% Senior Notes and 7% Senior Subordinated Notes.
The following wholly owned subsidiaries of the Company are guarantors, on a joint and several basis, under the 7.75% Senior Notes and 7% Senior Subordinated Notes: Black Hawk Holdings, L.L.C.; Casino America of Colorado, Inc.; CCSC/Blackhawk, Inc.; Grand Palais Riverboat, Inc.; IC Holdings Colorado, Inc.; IOC-Black Hawk Distribution Company, L.L.C.; IOC-Boonville, Inc.; IOC-Caruthersville, L.L.C.; IOC-Kansas City, Inc.; IOC-Lula, Inc.; IOC-Natchez, Inc.; IOC-Black Hawk County, Inc.; IOC-Davenport, Inc.; IOC Holdings, L.L.C.; IOC Services, L.L.C.; IOC-Vicksburg, Inc.; IOC-Vicksburg, LLC; Rainbow Casino Vicksburg Partnership, L.P.; IOC Cape Girardeau, LLC; Isle of Capri Bettendorf Marina Corporation.; Isle of Capri Bettendorf, L.C; Isle of Capri Black Hawk Capital Corp.; Isle of Capri Black Hawk, L.L.C.; Isle of Capri Marquette, Inc.; P.P.I, Inc.; Riverboat
78
ISLE OF CAPRI CASINOS, INC.
NOTES TO CONSOLIDATED FINANCIAL STATEMENTS (Continued)
(amounts in thousands, except share and per share amounts)
21. Consolidating Condensed Financial Information (Continued)
Corporation of Mississippi; Riverboat Services, Inc.; and St. Charles Gaming Company, Inc. Each of the subsidiaries' guarantees is joint and several with the guarantees of the other subsidiaries.
Consolidating condensed balance sheets as of April 24, 2011 and April 25, 2010 are as follows (in thousands):
| |
As of April 24, 2011 | |||||||||||||||
|---|---|---|---|---|---|---|---|---|---|---|---|---|---|---|---|---|
Balance Sheet
|
Isle of Capri Casinos, Inc. (Parent Obligor) |
Guarantor Subsidiaries |
Non- Guarantor Subsidiaries |
Consolidating and Eliminating Entries |
Isle of Capri Casinos, Inc. Consolidated |
|||||||||||
Current assets |
$ | 28,886 | $ | 87,650 | $ | 32,274 | $ | (451 | ) | $ | 148,359 | |||||
Intercompany receivables |
1,020,593 | (226,226 | ) | (56,599 | ) | (737,768 | ) | — | ||||||||
Investments in subsidiaries |
418,767 | (65,229 | ) | (37 | ) | (353,501 | ) | — | ||||||||
Property and equipment, net |
10,215 | 1,071,415 | 31,919 | — | 1,113,549 | |||||||||||
Other assets |
63,889 | 441,794 | 20,002 | (53,705 | ) | 471,980 | ||||||||||
Total assets |
$ | 1,542,350 | $ | 1,309,404 | $ | 27,559 | $ | (1,145,425 | ) | $ | 1,733,888 | |||||
Current liabilities |
$ | 40,714 | $ | 84,565 | $ | 29,050 | $ | (451 | ) | $ | 153,878 | |||||
Intercompany payables |
— | 737,768 | — | (737,768 | ) | — | ||||||||||
Long-term debt, less current maturities |
1,183,091 | 3,517 | 613 | — | 1,187,221 | |||||||||||
Other accrued liabilities |
9,517 | 114,205 | 13,744 | (53,705 | ) | 83,761 | ||||||||||
Stockholders' equity |
309,028 | 369,349 | (15,848 | ) | (353,501 | ) | 309,028 | |||||||||
Total liabilities and stockholders' equity |
$ | 1,542,350 | $ | 1,309,404 | $ | 27,559 | $ | (1,145,425 | ) | $ | 1,733,888 | |||||
| |
As of April 25, 2010 | |||||||||||||||
|---|---|---|---|---|---|---|---|---|---|---|---|---|---|---|---|---|
Balance Sheet
|
Isle of Capri Casinos, Inc. (Parent Obligor) |
Guarantor Subsidiaries |
Non- Guarantor Subsidiaries |
Consolidating and Eliminating Entries |
Isle of Capri Casinos, Inc. Consolidated |
|||||||||||
Current assets |
$ | 35,835 | $ | 71,882 | $ | 43,287 | $ | (1,100 | ) | $ | 149,904 | |||||
Intercompany receivables |
991,404 | (187,215 | ) | (53,421 | ) | (750,768 | ) | — | ||||||||
Investments in subsidiaries |
389,522 | (63,073 | ) | (37 | ) | (326,412 | ) | — | ||||||||
Property and equipment, net |
7,579 | 1,059,146 | 32,217 | — | 1,098,942 | |||||||||||
Other assets |
60,242 | 409,103 | 11,153 | (54,504 | ) | 425,994 | ||||||||||
Total assets |
$ | 1,484,582 | $ | 1,289,843 | $ | 33,199 | $ | (1,132,784 | ) | $ | 1,674,840 | |||||
Current liabilities |
$ | 46,580 | $ | 80,892 | $ | 30,783 | $ | (1,100 | ) | $ | 157,155 | |||||
Intercompany payables |
— | 750,768 | — | (750,768 | ) | — | ||||||||||
Long-term debt, less current maturities |
1,187,632 | 3,760 | 743 | — | 1,192,135 | |||||||||||
Other accrued liabilities |
10,151 | 116,814 | 12,870 | (54,504 | ) | 85,331 | ||||||||||
Stockholders' equity |
240,219 | 337,609 | (11,197 | ) | (326,412 | ) | 240,219 | |||||||||
Total liabilities and stockholders' equity |
$ | 1,484,582 | $ | 1,289,843 | $ | 33,199 | $ | (1,132,784 | ) | $ | 1,674,840 | |||||
79
ISLE OF CAPRI CASINOS, INC.
NOTES TO CONSOLIDATED FINANCIAL STATEMENTS (Continued)
(amounts in thousands, except share and per share amounts)
21. Consolidating Condensed Financial Information (Continued)
Consolidating condensed statements of operations for the fiscal years ended April 24, 2011, April 25, 2010 and April 26, 2009 are as follows:
| |
For the Fiscal Year Ended April 24, 2011 | |||||||||||||||
|---|---|---|---|---|---|---|---|---|---|---|---|---|---|---|---|---|
Statement of Operations
|
Isle of Capri Casinos, Inc. (Parent Obligor) |
Guarantor Subsidiaries |
Non- Guarantor Subsidiaries |
Consolidating and Eliminating Entries |
Isle of Capri Casinos, Inc. Consolidated |
|||||||||||
Revenues: |
||||||||||||||||
Casino |
$ | — | $ | 1,036,538 | $ | — | $ | — | $ | 1,036,538 | ||||||
Rooms, food, beverage, pari-mutuel and other |
1,669 | 173,229 | 9,626 | (9,528 | ) | 174,996 | ||||||||||
Gross revenues |
1,669 | 1,209,767 | 9,626 | (9,528 | ) | 1,211,534 | ||||||||||
Less promotional allowances |
— | (206,539 | ) | — | — | (206,539 | ) | |||||||||
Net revenues |
1,669 | 1,003,228 | 9,626 | (9,528 | ) | 1,004,995 | ||||||||||
Operating expenses: |
||||||||||||||||
Casino |
— | 158,580 | — | — | 158,580 | |||||||||||
Gaming taxes |
— | 250,102 | — | — | 250,102 | |||||||||||
Rooms, food, beverage, pari-mutuel and other |
42,838 | 368,752 | 9,291 | (9,528 | ) | 411,353 | ||||||||||
Management fee expense (revenue) |
(35,438 | ) | 35,438 | — | — | — | ||||||||||
Depreciation and amortization |
1,955 | 86,513 | 572 | — | 89,040 | |||||||||||
Total operating expenses |
9,355 | 899,385 | 9,863 | (9,528 | ) | 909,075 | ||||||||||
Operating income (loss) |
(7,686 | ) | 103,843 | (237 | ) | — | 95,920 | |||||||||
Interest expense, net |
(29,634 | ) | (61,032 | ) | 648 | — | (90,018 | ) | ||||||||
Gain on extinguishment of debt |
— | — | — | — | — | |||||||||||
Other |
(1,214 | ) | — | — | — | (1,214 | ) | |||||||||
Equity in income (loss) of subsidiaries |
31,565 | (2,170 | ) | — | (29,395 | ) | — | |||||||||
Income (loss) from continuing operations before income taxes and noncontolling interest |
(6,969 | ) | 40,641 | 411 | (29,395 | ) | 4,688 | |||||||||
Income tax (provision) benefit |
8,057 | (9,645 | ) | (2,012 | ) | — | (3,600 | ) | ||||||||
Income (loss) from continuining operations |
1,088 | 30,996 | (1,601 | ) | (29,395 | ) | 1,088 | |||||||||
Income (loss) of discontinued operations |
3,452 | — | 1,475 | (1,475 | ) | 3,452 | ||||||||||
Net income (loss) |
$ | 4,540 | $ | 30,996 | $ | (126 | ) | $ | (30,870 | ) | $ | 4,540 | ||||
80
ISLE OF CAPRI CASINOS, INC.
NOTES TO CONSOLIDATED FINANCIAL STATEMENTS (Continued)
(amounts in thousands, except share and per share amounts)
21. Consolidating Condensed Financial Information (Continued)