Attached files
Table of Contents
UNITED STATES
SECURITIES AND EXCHANGE COMMISSION
Washington, D.C. 20549
FORM 10-K
| x | ANNUAL REPORT PURSUANT TO SECTION 13 OR 15(d) OF THE SECURITIES EXCHANGE ACT OF 1934 |
For the fiscal year ended March 31, 2011
OR
| ¨ | TRANSITION REPORT PURSUANT TO SECTION 13 OR 15(d) OF THE SECURITIES EXCHANGE ACT OF 1934 |
Commission File Number 0-16148
MULTI-COLOR CORPORATION
| Incorporated in the State of Ohio |
IRS Employer Identification Number 31-1125853 |
4053 Clough Woods Dr.
Batavia, OH 45103
(Address of principal executive offices)
(513) 381-1480
Securities registered pursuant to Section 12(b) of the Act:
Common Stock, no par value
Securities registered pursuant to Section 12(g) of the Act:
None
Indicate by check mark if the registrant is a well-known seasoned issuer, as defined in Rule 405 of the Securities Act. Yes ¨ No x
Indicate by check mark if the registrant is not required to file reports pursuant to Section 13 or 15(d) of the Act. Yes ¨ No x
Indicate by check mark whether the registrant (1) has filed all reports required to be filed by Section 13 or 15(d) of the Securities Exchange Act of 1934 during the preceding 12 months (or for such shorter period that the registrant was required to file such reports), and (2) has been subject to such filing requirements for the past 90 days. Yes x No ¨
Indicate by check mark whether the registrant has submitted electronically and posted on its corporate Website, if any, every Interactive Data File required to be submitted and posted pursuant to Rule 405 of Regulation S-T during the preceding 12 months (or for such shorter period that the registrant was required to submit and post such files). Yes ¨ No ¨
Indicate by check mark if disclosure of delinquent filers pursuant to Item 405 of Regulation S-K is not contained herein, and will not be contained, to the best of the registrant’s knowledge, in definitive proxy or information statements incorporated by reference in Part III of this Form 10-K or any amendment to this Form 10-K ¨.
Indicate by check mark whether the registrant is a large accelerated filer, an accelerated filer, a non-accelerated filer, or a smaller reporting company. See the definitions of “large accelerated filer,” “accelerated filer” and “smaller reporting company” in Rule 12b-2 of the Exchange Act.
| Large accelerated filer | ¨ | Accelerated filer | x | |||
| Non-accelerated filer | ¨ | Smaller reporting company | ¨ | |||
Indicate by check mark whether the registrant is a shell company (as defined in Rule 12b-2 of the Act). Yes ¨ No x
The aggregate market value of the voting and non-voting common equity held by non-affiliates was approximately $133,237,000 based upon the closing price of $15.40 per share of Common Stock on the NASDAQ Global Select Market as of September 30, 2010, the last business day of the registrant’s most recently completed second fiscal quarter.
As of May 31, 2011, 13,367,927 shares of no par value Common Stock were issued and 13,298,712 shares of no par value Common Stock were outstanding.
DOCUMENTS INCORPORATED BY REFERENCE
Portions of the registrant’s proxy statement to be filed pursuant to Regulation 14A of the Exchange Act for its 2011 Annual Meeting of Shareholders to be held on August 10, 2011 are incorporated by reference into Parts II and III of Form 10-K.
Table of Contents
FORWARD-LOOKING STATEMENTS
The Company believes certain statements contained in this report that are not historical facts constitute forward-looking statements within the meaning of the Private Securities Litigation Reform Act of 1995, and are intended to be covered by the safe harbors created by that Act. Reliance should not be placed on forward-looking statements because they involve known and unknown risks, uncertainties and other factors which may cause actual results, performance or achievements to differ materially from those expressed or implied. Any forward-looking statement speaks only as of the date made. The Company undertakes no obligation to update any forward-looking statements to reflect events or circumstances after the date on which they are made.
Statements concerning expected financial performance, on-going business strategies, and possible future actions which the Company intends to pursue in order to achieve strategic objectives constitute forward-looking information. Implementation of these strategies and the achievement of such financial performance are each subject to numerous conditions, uncertainties and risk factors. Factors which could cause actual performance by the Company to differ materially from these forward-looking statements include, without limitation, factors discussed in conjunction with a forward-looking statement; changes in general economic and business conditions; the ability to consummate and successfully integrate acquisitions; the ability to manage foreign operations; currency exchange rate fluctuations; the success and financial condition of the Company’s significant customers; competition; acceptance of new product offerings; changes in business strategy or plans; quality of management; the Company’s ability to maintain an effective system of internal control; availability, terms and development of capital and credit; cost and price changes; raw material cost pressures; availability of raw materials; ability to pass raw material cost increases to its customers; business abilities and judgment of personnel; changes in, or the failure to comply with, government regulations, legal proceedings and developments; risk associated with significant leverage; increases in general interest rate levels affecting the Company’s interest costs; ability to manage global political uncertainty; and terrorism and political unrest. The Company undertakes no obligation to publicly update or revise any forward-looking statements, whether as a result of new information, future events or otherwise.
2
Table of Contents
| ITEM 1. | BUSINESS |
(In thousands, except for statistical and per share data)
OVERVIEW
Multi-Color Corporation (Multi-Color, MCC, We, Us, Our or the Company), headquartered in Cincinnati, Ohio, is a leader in global label solutions supporting a number of the world’s most prominent brands including leading producers of home and personal care, wine & spirit, food and beverage and specialty consumer products. MCC serves international brand owners in North, Central and South America, Europe, Australia, New Zealand, South Africa and China with a comprehensive range of the latest label technologies in Pressure Sensitive, Glue-Applied (Cut and Stack), In-Mold, Shrink Sleeve and Heat Transfer. MCC is a public company trading on the NASDAQ Global Select Market (company symbol: LABL).
The Company was incorporated in 1985, succeeding the predecessor business. Our corporate offices are located at 4053 Clough Woods Drive, Batavia, Ohio 45103 and our telephone number is (513) 381-1480.
Our common stock, no par value, is listed on the NASDAQ Global Select Market under the symbol “LABL”. See “Item 5 – Market for the Registrant’s Common Stock, Related Stockholder Matters and Issuer Purchases of Equity Securities.” We maintain a website (www.mcclabel.com) which includes additional information about the Company. The website includes corporate governance information for our shareholders and our Code of Ethics can be found under the corporate governance section. Shareholders can also obtain on and through our website, free of charge, our annual report on Form 10-K, quarterly reports on Form 10-Q, current reports on Form 8-K and any amendments to those reports filed or furnished pursuant to Section 13(a) or 15(d) of the Securities Exchange Act of 1934 as soon as reasonably practicable after the Company electronically files such materials with or furnishes such materials to the Securities and Exchange Commission (SEC).
PRODUCTS AND SERVICES
The Company provides a wide range of products for the packaging needs of our customers and is one of the world’s largest producers of high quality pressure sensitive, in-mold and heat transfer labels, and a major manufacturer of glue-applied and shrink sleeve labels. The Company also provides a full complement of print methods including flexographic, lithographic, rotogravure and digital, plus in-house pre-press services.
Pressure Sensitive Labels:
Pressure sensitive labels adhere to a surface with pressure. The label typically consists of four elements – a substrate, which may include paper, foil or plastic; an adhesive, which may be permanent or removable; a release coating; and a backing material to protect the adhesive against premature contact with other surfaces. The release coating and protective backing are removed prior to application to the container, exposing the adhesive, and the label is pressed or rolled into place. Innovative features of this product include promotional neckbands, peel-away coupons, resealable labels, see-through window graphics, and holographic foil enhancements to cold and hot foil stamping.
The pressure sensitive market is the largest category of the overall label market and represents a significant growth opportunity. Our strategy is to be a premier global supplier of pressure sensitive labels that demand high impact graphics or are otherwise technically challenging.
In-Mold Labels:
The in-mold label (IML) process applies a label to a plastic container as the container is being formed in the mold cavity. The finished IML product is a finely detailed label that performs consistently well for plastic container manufacturers and adds marketing value and product security for consumer product companies.
Each component of the IML production process requires a special expertise for success. The components include the substrate (the base material for the label), inks, overcoats, varnishes and adhesives. We are unique in the industry in that we manufacture IMLs on rotogravure, flexographic and lithographic printing presses. There are several critical characteristics of a successful IML: the material needs a proper coefficient of friction so that the finished label is easily and consistently picked up and applied to the blow-molded container, the substrate must be able to hold the label’s inks, including metallics and fluorescents, overlay varnishes and adhesives and the material must be able to lay smoothly, without wrinkle or bulge, when applied to a very hot, just molded plastic container that will quickly shrink, along with the label, as its temperature falls. We continually search for alternate substrates to be used in the IML process in order to improve label performance and capabilities as well as to reduce substrate costs. Technical innovations in this area include the use of peel-away IML coupons, scented and holographic labels.
Glue-Applied Labels (Cut and Stack):
Glue-applied labels are adhered to containers using an adhesive applied during the labeling process. Available in roll-fed and sheeted formats, the labels are an attractive and cost-effective choice for high volume applications. Our facilities in Norway, Michigan, Watertown, Wisconsin, Napa, California, Griffith and Barossa Valley, Australia and Tuscany, Italy supply either offset or rotogravure glue-applied labels printed on paper and film.
3
Table of Contents
Our innovations within glue-applied labels include peel-away promotional labels, thermochromics, holographics and metalized films. We also offer promotional products such as scratch-off coupons, static-clings and tags.
Heat Transfer Labels (HTL):
HTL are reverse printed and transferred from a special release liner onto the container using heat and pressure. The labels are a composition of inks and lacquers tailored to the customer’s specific needs. These labels are printed and then shipped to blow molders and/or contract decorators who transfer the labels to the containers. Once applied, the labels are permanently adhered to the container. The graphics capabilities include fine vignettes, metallic and thermochromatic inks, as well as the patented “frost”, giving an acid-etch appearance.
Therimage™ is our pioneer heat transfer label technology developed primarily for applications involving plastic containers serving consumer markets in personal care, home improvement products, food and beverage, and health and beauty. The addition of the Clear ADvantage™ brand provides premium graphics on both glass and plastic containers enabling this decorating technology to achieve the highly sought after “no label” look for the health and beauty aid, beverage, personal care, household chemical and promotional markets. Most recently, we have added the new “ink only” and flameless HTL technology to our capabilities in this area. Flameless technology enables us to provide a solution to customers who want to remove open flames from their operations, which are normally required to pre-treat and post-treat containers for Therimage™ and Clear ADvantage™ products. Flameless technology has applications in all the aforementioned markets.
Shrink Sleeve Labels:
Shrink sleeve labels are produced in colorful, cutting edge styles and materials. The labels are manufactured as sleeves, slid over glass or plastic bottles and then heated to conform precisely to the contours of the container. The 360-degree label and tamper resistant feature of the label are marketing advantages that many of our customers seek when choosing this label type.
The shrink sleeve market is a growing decorating technology as consumer product companies look for ways to differentiate their products. Several markets, such as the beverage market within the consumer goods industry, have adopted this decorating technology. Demand for this label solution in the food and personal care markets continues to grow and should broaden the sales opportunities for shrink sleeve labels.
Graphic Services:
We provide graphics and pre-press services for our customers at all of our manufacturing locations. These services include the conversion of customer digital files and artwork into proofs, production of print layouts and printing plates, and product mock ups and samples for market research.
As a result of these capabilities, we are able to go from concept to printed label, thus increasing our customers’ speed to market and further enhancing our value proposition.
RESEARCH AND DEVELOPMENT
Our product leadership group focuses on research and development, product commercialization and technical service support. The group includes chemical, packaging and field engineers who are responsible for developing and commercializing innovative label and application solutions. Technical service personnel also assist customers and manufacturers in improving container and label performance. The services provided by this group differentiate us from many of our competitors and drive our selection for the most challenging projects.
Our research and development expenditures totaled approximately $2,628 in 2011, $2,658 in 2010, and $3,426 in 2009.
SALES AND MARKETING
We provide a complete line of label solutions and a variety of technical and graphic services. Our vision is to be the premier global resource of decorating solutions. We sell to a broad range of consumer product, food, beverage and wine & spirit companies located in North, Central and South America, Europe, Australia, New Zealand, South Africa and China. Our sales strategy is a consultative selling approach. Our sales organization reviews the requirements of the container and offers a number of alternative decorating methods. Our customers view us as an expert source of materials, methods and technologies with the ability to offer the most cost effective solution.
We have continued to make progress in expanding our customer base and portfolio of products, services and manufacturing locations in order to address issues related to customer concentration. During 2011, 2010 and 2009, sales to major customers (those exceeding 10% of the Company’s net revenues in one or more of the periods presented) approximated 22%, 28% and 32%, respectively, of the Company’s consolidated net revenues. Approximately 16%, 18% and 19% of sales in 2011, 2010 and 2009, respectively, were to the Procter & Gamble Company; approximately 6%, 10% and 13% of sales in 2011, 2010 and 2009, respectively, were to the Miller Brewing Company. Since 2008, sales concentration with our major customers has been significantly reduced since we have added new customers and products with our acquisition of Collotype, which has manufacturing operations in Australia, South Africa and California and our acquisitions of Guidotti CentroStampa (CentroStampa) and Monroe Etiquette, which have manufacturing operations in Italy and France.
4
Table of Contents
MANUFACTURING
As of March 31, 2011, we had 14 manufacturing facilities across the U.S., Australia, South Africa, Europe and Asia. Due to the acquisitions of La Cromografica in April 2011, and the label operations in Santiago, Chile and Mendoza, Argentina in May 2011, we currently have 17 manufacturing facilities across the U.S., Australia, South Africa, Europe, Asia and South America. Our wide range of capabilities and versatility facilitates our ability to respond quickly and effectively to changing customer needs. Our current printing equipment consists of gravure, offset, flexographic, letterpress and digital presses and label finishing operations. As part of a manufacturing expansion in North America, plants in Troy and Batavia, Ohio were consolidated into a new and larger facility in Batavia, Ohio. The pre-existing Batavia facility was sold in June 2008 and the Troy facility was sold in July 2009. In July 2009, we closed our Framingham manufacturing facility and the business was transitioned into our Batavia, Ohio and Scottsburg, Indiana facilities. In February, 2010, the Company entered into a supply agreement to fulfill gravure cylinder requirements. As a part of the agreement, the Company sold certain assets associated with the manufacturing of gravure cylinders. The Erlanger facility is currently held for sale. The Norway, Michigan, Watertown and Green Bay, Wisconsin, Adelaide, South Australia and Tuscany, Italy plants are ISO 9001 certified.
At March 31, 2011, our backlog was approximately $14,704 ($13,615 at March 31, 2010). The backlog at March 31, 2011 represents one to two weeks of production volume at current staffing levels and is expected to be completed in the next fiscal year.
EMPLOYEES
As of March 31, 2011, we had approximately 1,353 permanent employees and 77 temporary employees, of which 73 are represented by the Graphics Communications Conference of the International Brotherhood of Teamsters Local 77P. The related labor contracts with this union expire in June 2011 and July 2013. We consider our labor relations to be good and have not experienced any work stoppages during the previous decade. Our human resource and compensation systems have been developed to align our objectives with the goals of our shareholders.
RAW MATERIALS
Common to the printing industry, we purchase proprietary products from a number of raw material suppliers. To prevent potential disruptions to our manufacturing facilities, we have developed relationships with more than one supply source for each of our critical raw materials. Our raw material suppliers are major corporations with successful historical performance. Although we intend to prevent any long-term business interruption due to our inability to obtain raw materials, there could be short-term manufacturing disruptions during the customer qualification period for any new raw material source.
ACQUISITIONS
We are continually in pursuit of selective acquisitions that will contribute to our growth. We believe that acquisitions are a method of increasing our presence in existing markets, expanding into new markets, gaining new customers and product offerings and improving operating efficiencies through economies of scale. Through acquisitions, we intend to broaden our revenue stream by expanding our lines of innovative label solutions, offering a variety of technical and graphic services and fulfilling the specific needs and requirements of our customers. The printing and packaging industry is highly fragmented and offers many opportunities for acquisitions.
On July 1, 2010, we acquired Guidotti CentroStampa, a leading European wine & spirit and olive oil label specialist based in Tuscany, Italy. The acquisition expanded MCC’s global presence in the wine & spirit label market and provided an entry into the olive oil label market.
On October 1, 2010, we acquired Monroe Etiquette, a French wine label specialist based in Montagny, France. The acquisition reinforced MCC’s commitment to expanding its global presence in the wine label market.
During the third quarter of fiscal 2011, we announced plans to invest in establishing operations in China. Our operations, which are located in the major southern city of Guangzhou, became fully operational in the first quarter of fiscal 2012.
On April 1, 2011, we acquired La Cromografica, an Italian wine label specialist located in Florence, Italy. La Cromografica specializes in high quality wine labels for Italian premium wines.
On May 2, 2011, we acquired 70% ownership in two label operations, one in Santiago, Chile and the other in Mendoza, Argentina. These label operations will focus on providing premium labels to the expanding Latin American wine & spirit markets.
See Note 17 to our consolidated financial statements for geographic information relating to our net revenues and long-lived assets. See Note 3 to our consolidated financial statements for further information regarding the CentroStampa and Monroe Etiquette acquisitions. See Note 24 to our consolidated financial statements for further information regarding the acquisitions of La Cromografica and the label operations in Chile and Argentina.
COMPETITION
We have a large number of competitors in the pressure sensitive and glue-applied label markets and several competitors in each of the IML, shrink sleeve and HTL markets. Some of these competitors in the pressure sensitive and glue-applied label markets have greater financial and other resources than us. The competitors in IML, shrink sleeve and HTL markets are either private companies or subsidiaries of public companies and we cannot assess the financial resources of these organizations. We could be adversely affected should a competitor develop labels similar or technologically superior to our labels. We believe competition is principally dependent upon product performance, service, pricing, technical support and innovation.
5
Table of Contents
PATENTS AND LICENSES
We own a number of patents and patent applications in the U.S., Australia, South Africa and the European Union that relate to the products and services we offer to our customers. Although these patents are important to us, we are not dependent upon any one patent. We believe that these patents, collectively, along with our ability to be a single source provider of many packaging needs, provide us with a competitive advantage over our competition. The expiration or unenforceability of any one of our patents would not have a material adverse effect on us.
REGULATION
Our operations are subject to regulation by federal, state and foreign (Australia, South Africa, Italy, France, China and South America) environmental protection agencies. To ensure ongoing compliance with these requirements, we have implemented an internal compliance program. Additionally, we continue to make capital investments to maintain compliance with these environmental regulations and to improve our existing equipment. However, there can be no assurances that these regulations will not require expenditures beyond those that are currently anticipated.
In the U.S., the Food and Drug Administration regulates the raw materials used in labels for various products. These regulations apply to the consumer product companies for which we produce labels. We use materials specified by the consumer product companies in producing labels.
| ITEM 1A. | RISK FACTORS |
We rely on several large customers and the loss of one of these customers would have a material adverse impact on our operating results and cash flows.
For the fiscal year ended March 31, 2011, two customers accounted for approximately 22% of our consolidated sales and our top twenty-five customers accounted for 61% of our consolidated sales. While we maintain sales contracts with certain of our largest customers, such contracts do not guarantee sales levels and these contracts require renewal on a regular basis in the ordinary course of business. We cannot guarantee that these contracts will be successfully renewed in the future. The loss or substantial reduction in business of any of our major customers could have a material adverse impact on our operating results and cash flows.
Competition in our business could limit our ability to retain current customers and attract new customers.
We have a large number of competitors in the markets in which we operate. Some of our competitors have greater financial and other resources than us. We could face competitive pressure through (a) new products developed by our competitors that are of superior quality, fit our customers’ needs better or have lower prices; (b) patents obtained or developed by competitors; (c) consolidation of our competitors; (d) pricing pressures; and (e) loss of proprietary supplies of certain materials. The inability to successfully overcome competition in our business could have a material adverse impact on our operating results and cash flows.
Raw material cost increases or shortages could adversely affect our results of operations and cash flows.
As a manufacturer, our sales and profitability are dependent upon the availability and cost of raw materials, which are subject to price fluctuations, and the ability to control or pass on fluctuating costs of raw materials. Inflationary and other increases in the costs of raw materials and energy have occurred in the past and are continuing to recur. Our future performance depends in part on our ability to improve operating efficiencies and pass raw material cost increases to our customers.
We have risks related to continued uncertain global economic and credit conditions.
The Company’s operating cash flows provide funding for debt repayment and various discretionary items such as capital expenditures and dividends. Uncertainty in global economic conditions has negatively impacted the overall economy which has adversely impacted demand for our products and our ability to manage commercial relationships with our customers, suppliers and creditors.
Slower growth or a decline in key markets could adversely affect our profitability.
Our business could be negatively impacted by continued slower growth or a decline in key end use markets or applications for our products and services which could adversely affect our operating results and cash flows.
Changes in the regulatory or administrative environment could adversely affect our financial condition and results of operations.
Laws and regulations at both the state, federal and international levels frequently change and the cost of compliance cannot be precisely estimated. Any changes in regulations, the imposition of additional regulations, or the enactment of any new governmental legislation that impacts employment/labor, trade, health care, tax, environmental or other business issues could have an adverse impact on our financial condition and results of operations.
We are subject to risks associated with our international operations.
We have operations in the United States, Australia, South Africa, Europe and China and we intend to continue expansion of our international operations. As a result, our business is exposed to risks inherent in foreign operations. These risks, which can vary substantially by market, include the difficulties associated with managing an organization with operations in multiple countries,
6
Table of Contents
compliance with differing laws and regulations (including tax laws, regulations and rates), enforcing agreements and collecting receivables through foreign legal systems, restrictive actions by foreign governments, changes in economic conditions in each market, foreign customers who may have longer payment cycles than customers in the United States, political and social conditions (including wars, terrorist acts and political instability) and acts of nature, such as typhoons, tsunamis, or earthquakes. Approximately 37% of our net revenues were derived from our foreign operations (based on the country from which the product was shipped) during fiscal 2011.
We also face the challenges and uncertainties associated with operating in developing markets such as China, which may subject us to a relatively high risk of political instability and economic volatility, all of which are enhanced, in many cases, by uncertainties as to how local law is applied and enforced, including in areas most relevant to commercial transactions and foreign investment.
Currency exchange rate fluctuations could have an adverse effect on our revenue and financial results.
Our revenues and earnings and the value of our foreign net assets are affected by fluctuations in foreign currency exchange rates, which may favorably or adversely affect reported earnings and net assets. Currency exchange rates fluctuate in response to, among other things, changes in local, regional or global economic conditions, the imposition of currency exchange restrictions and unexpected changes in regulatory or taxation environments.
Our ability to develop and market new products is critical for maintaining growth.
Our success depends upon the timely introduction of new products as well as improvements to current products. Research and development relies on innovation and requires anticipation of market trends. Our future results and ability to maintain or improve our competitive position will depend on our ability to successfully identify, develop and sell new or improved products.
We rely primarily on printing presses.
The long-term shutdown of our presses or malfunctions experienced with our presses could negatively impact our ability to fulfill customers’ orders and on-time delivery needs and adversely impact our operating results and cash flows.
Our ability to stay current with our information technology systems could have a material adverse impact on our business.
We are increasingly dependent on the information technology systems we have put into place and any significant breakdown, viruses or destruction could negatively impact our business. We upgrade and install new systems, which if installed or programmed incorrectly, could cause significant disruptions. If a disruption occurs, we could incur losses and costs for interruption of our operations.
If the quality of our products and services does not meet our customer expectations, we may experience decreased sales and earnings.
Occasionally, we ship products with quality issues resulting from defective material, manufacturing, packaging or design. Issues discovered after shipment may cause additional shipping costs, possible discounts or refunds, and potential loss of future sales. Issues discovered before shipping may cause delays in shipping, delays in the manufacturing process and potential cancelled orders. These quality issues could adversely affect our profitability as well as negatively impact our reputation.
Our business growth strategy is partially executed through acquisitions and we may not be successful with acquisitions.
Although we have completed many acquisitions, there can be no assurance that we will find quality businesses at acceptable prices to acquire in the future. With each acquisition that we may complete, we will encounter risks and uncertainties associated with the transaction. We may be unable to retain certain customers and employees and the integration of product lines, procedures, systems and goals may not be successful. Any expected cost synergies from an acquisition may be difficult to obtain. The failure in our ability to successfully integrate an acquisition may negatively impact our operating results and cash flows. Future acquisitions could cause us to incur additional debt, contingent liabilities and increased interest expense, as well as experience dilution in earnings per share.
Our leverage and restrictions contained in our debt agreements could have significant consequences.
As of March 31, 2011, our consolidated indebtedness, including current maturities of long-term indebtedness, was $127,331, which could have important consequences including the following:
| • | Increasing our vulnerability to general economic and industry conditions; |
| • | Requiring a substantial portion of cash flows from operating activities to be dedicated to the payment of principal and interest on our indebtedness and, as a result, reducing our ability to use our cash flows to fund our operations and capital expenditures, pay dividends, capitalize on future business opportunities and expand our business; |
| • | Exposing us to the risk of increased interest expense as certain of our borrowings are at variable rates of interest; |
| • | Limiting our ability to obtain additional financing for working capital, capital expenditures, additional acquisitions and other business purposes; and |
| • | Limiting our flexibility to adjust to changing market conditions and react to competitive pressures. |
7
Table of Contents
We may be able to incur additional indebtedness in the future, subject to the restrictions contained in our debt agreements. If new indebtedness is added to our current debt levels, the related risks that we now face could intensify.
Our debt agreements contain covenants that limit our flexibility in operating our business.
The agreements governing our indebtedness contain various covenants that may adversely affect our ability to operate our business. Among other things, these covenants limit our ability to:
| • | Incur additional indebtedness; |
| • | Make certain investments or loans; |
| • | Transfer or sell certain assets; |
| • | Create or permit liens on assets; and |
| • | Consolidate, merge, sell or otherwise dispose of all or substantially all of our assets. |
The agreements governing our indebtedness also require us to maintain (i) a minimum consolidated net worth, (ii) a maximum consolidated leverage ratio of 3.75 to 1.00, stepping down to 3.25 to 1.00 from September 30, 2011 to March 31, 2012 and stepping down again to 3.00 to 1.00 at June 30, 2012 for each fiscal quarter thereafter; and (iii) a minimum consolidated interest charge coverage ratio of 4.00 to 1.00. A breach of any of these covenants could result in a default under our debt agreements, which could prompt the lenders to declare all amounts outstanding under the debt agreements to be immediately due and payable and terminate commitments to extend further credit. If we were unable to repay these amounts, the lenders could proceed against the collateral that secures the indebtedness.
We need to comply with various environmental, health and safety laws.
We are subject to environmental, health and safety laws and regulations. We routinely incur costs in complying with these regulations and, if we fail to comply, could incur significant penalties. In addition, failure to comply with environmental requirements could require us to shut down or reduce production or create liability exposure. New environmental laws or regulations may be adopted that could constrain our operations or increase our environmental compliance costs.
We must be able to continue to effectively manage our growth.
We have experienced significant and steady growth over the last several years. Our growth, in particular the acquisitions of Monroe Etiquette in October 2010, CentroStampa in July 2010 and Collotype in February 2008, places significant demands on our resources and personnel and we must continue to motivate and guide our growing and evolving workforce. The failure to effectively manage our growth could have a material adverse impact on our operating results and cash flows.
We have a significant amount of goodwill and other intangible assets on our balance sheet; an impairment of our goodwill or other intangible assets may adversely affect our operating results.
As of March 31, 2011, we had $196,573 of goodwill and intangible assets on our balance sheet, the value of which depends on a number of factors, including earnings growth, market capitalization and the overall success of our business. Accounting standards require us to test goodwill annually for impairment, and more frequently when events or circumstances indicate impairment may exist. There can be no assurance that future reviews of our goodwill and other intangible assets will not result in impairment charges. Although it does not affect cash flow, an impairment charge does have the effect of decreasing our earnings, assets and shareholders’ equity.
| ITEM 1B. | UNRESOLVED SECURITIES AND EXCHANGE COMMISSION STAFF COMMENTS |
None.
| ITEM 2. | PROPERTIES |
As of March 31, 2011, the Company owned 5 manufacturing facilities in the U.S and leased 9 manufacturing facilities in the U.S., Australia, South Africa, France, Italy and China.
8
Table of Contents
See below for listing of facilities at March 31, 2011:
| Location |
Approximate Square Feet |
Owned/ Leased |
||||||
| Batavia, Ohio |
247,830 | Owned | ||||||
| Green Bay, Wisconsin |
39,600 | Owned | ||||||
| Norway, Michigan |
133,000 | Owned | ||||||
| Watertown, Wisconsin |
63,300 | Owned | ||||||
| Napa, California |
52,000 | Leased | ||||||
| Scottsburg, Indiana |
120,500 | Owned | ||||||
| Tuscany, Italy |
119,479 | Leased | ||||||
| Montagny, France |
20,000 | Leased | ||||||
| Guangzhou, China |
43,056 | Leased | ||||||
| Adelaide, Australia |
65,246 | Leased | ||||||
| Queensland, Australia |
38,642 | Leased | ||||||
| Barossa, Australia |
25,306 | Leased | ||||||
| Griffith, Australia |
21,775 | Leased | ||||||
| Paarl, South Africa |
25,726 | Leased | ||||||
All of the Company’s properties are in good condition, well maintained and adequate for our intended uses.
| ITEM 3. | LEGAL PROCEEDINGS |
On April 5, 2011, the Company and four MCC employees who were formerly employed by the John Henry Company, as defendants, entered into a Confidential Settlement Agreement and Mutual General Release with the John Henry Company and Multi Packaging Solutions, as plaintiffs. The settlement relates to the complaint for damages and injunctive relief filed by plaintiffs in the Superior Court for Napa County, California on February 26, 2010. The complaint included allegations of improper taking and use of certain confidential and proprietary information by the employee defendants, which were denied by MCC and the employee defendants.
Pursuant to the Agreement and upon MCC’s payment of $2,800 to the John Henry Company, in April 2011, plaintiffs filed a request for dismissal of the complaint, the mutual release of all claims and potential claims arising out of the complaint became effective and the related injunction was deemed dissolved.
The Company is also subject to various legal claims and contingencies that arise out of the normal course of business, including claims related to commercial transactions, product liability, health and safety, taxes, environmental, employee-related matters and other matters. Litigation is subject to numerous uncertainties and the outcome of individual claims and contingencies is not predictable. It is possible that some legal matters for which reserves have not been established could result in an unfavorable outcome for the Company and any such unfavorable outcome could have a material adverse effect on our financial condition, results of operations and cash flows.
| ITEM 4. | SUBMISSION OF MATTERS TO A VOTE OF SECURITY HOLDERS |
[Removed and Reserved]
| ITEM 5. | MARKET FOR THE REGISTRANT’S COMMON STOCK, RELATED STOCKHOLDER MATTERS AND ISSUER PURCHASES OF EQUITY SECURITIES |
Our shares trade in the NASDAQ Global Select Market under the symbol LABL. The following table sets forth the high and low closing sales prices of our common stock (“Common Stock”) as reported in the NASDAQ Stock Market during fiscal years 2011 and 2010. Our stock is thinly traded and accordingly, the prices below may not be indicative of prices at which a large number of shares can be traded or reflective of prices that would prevail in a more active market.
| Quarter Ending: |
High | Low | Dividend Per Share | |||||||||
| March 31, 2011 |
$ | 20.30 | $ | 16.62 | $ | 0.05 | ||||||
| December 31, 2010 |
$ | 20.42 | $ | 15.48 | $ | 0.05 | ||||||
| September 30, 2010 |
$ | 15.45 | $ | 10.26 | $ | 0.05 | ||||||
| June 30, 2010 |
$ | 13.53 | $ | 9.83 | $ | 0.05 | ||||||
| March 31, 2010 |
$ | 13.60 | $ | 11.03 | $ | 0.05 | ||||||
| December 31, 2009 |
$ | 14.73 | $ | 10.92 | $ | 0.05 | ||||||
| September 30, 2009 |
$ | 17.55 | $ | 12.08 | $ | 0.05 | ||||||
| June 30, 2009 |
$ | 14.44 | $ | 10.76 | $ | 0.05 | ||||||
As of May 31, 2011, there were approximately 330 shareholders of record of the Common Stock.
Beginning in and since the fourth quarter of the fiscal year ended March 31, 2005, we have paid a quarterly dividend of $0.05 per common share.
9
Table of Contents
FIVE YEAR PERFORMANCE GRAPH
The following performance graph compares Multi-Color’s cumulative annual total shareholder return from April 1, 2006 through March 31, 2011, to that of the NASDAQ Market Index, a broad market index and the Morningstar Packaging & Containers Index (“Morningstar index”), an index of approximately 40 printing and packaging industry peer companies. The graph assumes that the value of the investment in the common stock and each index was $100 on April 1, 2006, and that all dividends were reinvested. Stock price performances shown in the graph are not indicative of future price performances. This data was furnished by Morningstar, Inc.
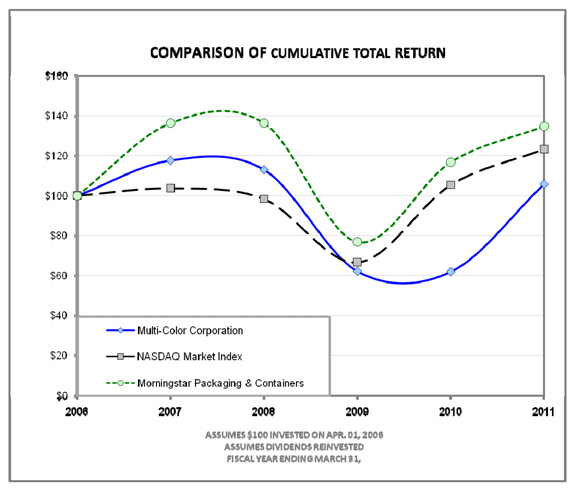
| Company/Market/Peer Group |
2006 | 2007 | 2008 | 2009 | 2010 | 2011 | ||||||||||||||||||
| Multi-Color Corporation |
$ | 100.00 | $ | 117.72 | $ | 113.09 | $ | 62.28 | $ | 62.02 | $ | 105.92 | ||||||||||||
| NASDAQ Market Index |
$ | 100.00 | $ | 103.72 | $ | 98.30 | $ | 66.56 | $ | 105.37 | $ | 123.35 | ||||||||||||
| Morningstar Packaging & Containers |
$ | 100.00 | $ | 136.45 | $ | 136.45 | $ | 76.81 | $ | 116.90 | $ | 134.88 | ||||||||||||
10
Table of Contents
| ITEM 6. | SELECTED FINANCIAL DATA |
(In thousands, except per share data)
| Year Ended March 31, | ||||||||||||||||||||
| 2011(1) | 2010(2)(7) | 2009(3)(7) | 2008(4)(7) | 2007(5)(7) | ||||||||||||||||
| Net revenues |
$ | 338,284 | $ | 276,821 | $ | 289,763 | $ | 210,307 | $ | 192,551 | ||||||||||
| Gross profit |
67,978 | 48,601 | 52,806 | 38,926 | 37,149 | |||||||||||||||
| Operating income |
32,260 | 22,911 | 22,865 | 17,499 | 13,846 | |||||||||||||||
| Income from continuing operations |
18,411 | 14,268 | 11,435 | 16,007 | 8,612 | |||||||||||||||
| Income (loss) from discontinued operations |
— | — | (137 | ) | 6,977 | 2,414 | ||||||||||||||
| Net income |
18,411 | 14,268 | 11,298 | 22,984 | 11,026 | |||||||||||||||
| Basic earnings per share: |
||||||||||||||||||||
| Income from continuing operations (6) |
$ | 1.42 | $ | 1.17 | $ | 0.94 | $ | 1.57 | $ | 0.87 | ||||||||||
| Income (loss) from discontinued operations (6) |
— | — | (0.01 | ) | 0.68 | 0.24 | ||||||||||||||
| Basic earnings per common share (6) |
$ | 1.42 | $ | 1.17 | $ | 0.93 | $ | 2.25 | $ | 1.11 | ||||||||||
| Diluted earnings per common share: |
||||||||||||||||||||
| Income from continuing operations (6) |
$ | 1.40 | $ | 1.16 | $ | 0.93 | $ | 1.52 | $ | 0.84 | ||||||||||
| Income (loss) from discontinued operations (6) |
— | — | (0.01 | ) | 0.66 | 0.24 | ||||||||||||||
| Diluted earnings per common share (6) |
$ | 1.40 | $ | 1.16 | $ | 0.92 | $ | 2.18 | $ | 1.08 | ||||||||||
| Weighted average shares outstanding – basic (6) |
13,005 | 12,209 | 12,156 | 10,212 | 9,904 | |||||||||||||||
| Weighted average shares outstanding – diluted (6) |
13,139 | 12,332 | 12,355 | 10,520 | 10,221 | |||||||||||||||
| Dividends declared per common share (6) |
$ | 0.20 | $ | 0.20 | $ | 0.20 | $ | 0.16 | $ | 0.12 | ||||||||||
| Dividends paid |
2,612 | 2,469 | 2,449 | 1,688 | 1,323 | |||||||||||||||
| Working capital |
30,357 | 19,934 | 13,531 | 18,517 | 15,832 | |||||||||||||||
| Total assets |
411,829 | 285,342 | 258,208 | 314,080 | 107,081 | |||||||||||||||
| Short-term debt |
12,304 | 10,001 | 10,002 | 10,003 | 5,150 | |||||||||||||||
| Long-term debt |
115,027 | 75,642 | 92,317 | 121,748 | — | |||||||||||||||
| Stockholders’ equity |
$ | 191,826 | $ | 146,628 | $ | 103,032 | $ | 119,938 | $ | 64,423 | ||||||||||
| 1) | Fiscal 2011 results include a charge of $2,800 related to the settlement of a legal dispute with the John Henry Company. Results also include a pre-tax reduction of $258 to the initial charge recorded in fiscal 2010, in connection with the relocation of the Company’s corporate headquarters from Sharonville, Ohio to its Batavia, Ohio facility, to incorporate the impact of the additional sublease income on the sublease of the remaining unoccupied space. |
| 2) | Fiscal 2010 results include a pre-tax gain of $3,451 ($2,141 after-tax) related to the sale of certain assets associated with the manufacture of gravure cylinders and a charge of $1,219 ($959 after-tax) for remaining lease obligations and other costs related to the relocation of the Company’s corporate headquarters from Sharonville, Ohio to its Batavia, Ohio facility. |
| 3) | Fiscal 2009 results include a pre-tax charge of $2,553 ($1,634 after-tax) for expenses related to the closure of the Framingham manufacturing facility. |
| 4) | Fiscal 2008 results include a pre-tax gain of $7,659 ($5,001 after-tax) on foreign currency forward contracts (included in income from continuing operations) and a pre-tax gain of $11,278 ($6,922 after-tax) from the sale of Quick Pak (included in income (loss) from discontinued operations). |
| 5) | Fiscal 2007 results include $3,048 in pre-tax charges for expenses related to two potential acquisitions that were terminated during the third quarter 2007. |
| 6) | All share amounts have been adjusted to reflect the 3-for-2 stock split effective September 17, 2007. |
| 7) | Certain prior year amounts have been reclassified to conform to the current year presentation. |
Refer to Item 7, “Management’s Discussion and Analysis of Financial Condition and Results of Operations” for a discussion of the impact of acquisitions completed during recent fiscal years that would impact the comparability of the selected financial data noted above. During fiscal 2011, we acquired Monroe Etiquette and CentroStampa which have manufacturing plants in France and Italy, respectively. On February 29, 2008, we acquired Collotype which included seven label manufacturing plants in Australia, South Africa and the United States.
11
Table of Contents
| ITEM 7. | MANAGEMENT’S DISCUSSION AND ANALYSIS OF FINANCIAL CONDITION AND RESULTS OF OPERATIONS |
(In thousands, except per share data)
The following discussion and analysis should be read in conjunction with Multi-Color’s consolidated financial statements and notes thereto appearing elsewhere herein.
RESULTS OF OPERATIONS
The following table shows for the periods indicated, certain components of Multi-Color’s consolidated statements of income as a percentage of net revenues.
| Percentage of Net Revenues | ||||||||||||
| 2011 | 2010 | 2009 | ||||||||||
| Net revenues |
100.0 | % | 100.0 | % | 100.0 | % | ||||||
| Cost of revenues |
79.9 | % | 82.4 | % | 81.8 | % | ||||||
| Gross profit |
20.1 | % | 17.6 | % | 18.2 | % | ||||||
| Selling, general & administrative expenses |
9.9 | % | 10.0 | % | 9.5 | % | ||||||
| Gain on sale of certain cylinder assets |
— | (1.2 | )% | — | ||||||||
| Loss on legal settlement |
0.8 | % | — | — | ||||||||
| Facility closure expense/(income), net |
(0.1 | )% | 0.5 | % | 0.9 | % | ||||||
| Operating income |
9.5 | % | 8.3 | % | 7.8 | % | ||||||
| Interest expense |
2.1 | % | 1.7 | % | 2.4 | % | ||||||
| Other (income) expense, net |
(0.1 | )% | (0.1 | )% | (0.1 | )% | ||||||
| Income from continuing operations before income tax |
7.5 | % | 6.7 | % | 5.5 | % | ||||||
| Income tax expense |
2.1 | % | 1.5 | % | 1.7 | % | ||||||
| Income from continuing operations |
5.4 | % | 5.2 | % | 3.8 | % | ||||||
| Income from discontinued operations, net of tax |
— | — | — | |||||||||
| Net income |
5.4 | % | 5.2 | % | 3.8 | % | ||||||
EXECUTIVE SUMMARY
We provide a complete line of innovative decorative label solutions and offer a variety of technical and graphic services to our customers based on their specific needs and requirements. Our customers include a wide range of consumer product companies and we supply labels for many of the world’s best known brands and products, including laundry detergent, fabric care, food, beverages and wine & spirit.
During fiscal 2011, the Company had net revenues of $338,284 compared to $276,821 in the prior year. The majority of the increase in revenues was due to the acquisitions of CentroStampa and Monroe Etiquette which contributed $44,323 or 16% of the revenue increases. The remaining increase was due to a 4% increase in sales volume and a 3% favorable foreign exchange impact, partially offset by a 1% unfavorable pricing impact.
Gross profit increased $19,377 or 40% compared to the prior year. The acquisitions of CentroStampa and Monroe Etiquette contributed 21% to the gross profit increase. The remaining increase was due to higher sales volumes, foreign exchange and improved operating efficiencies. Gross margins increased to 20% from 18% of sales revenues compared to the prior year.
Operating income increased $9,349 or 41% compared to the prior year. The CentroStampa and Monroe Etiquette acquisitions contributed 28% to the operating income increase. The remaining increase in operating income was due primarily to higher sales volumes, improved operating efficiencies, other cost decreases and the impact of foreign exchange.
The label markets we serve continue to experience a competitive environment and price pressures. We continually search for ways to reduce our costs through improved production and labor efficiencies, reduced substrate waste, new substrate options and lower substrate pricing.
We have continued to make progress in expanding our customer base and portfolio of products, services and manufacturing locations in order to address issues related to customer concentration. During 2011, 2010 and 2009, sales to major customers (those exceeding 10% of the Company’s net revenues in one or more of the periods presented) approximated 22%, 28% and 32%, respectively, of the Company’s consolidated net revenues. Approximately 16%, 18% and 19% of sales in 2011, 2010 and 2009, respectively, were to the Procter & Gamble Company; approximately 6%, 10% and 13% of sales in 2011, 2010 and 2009, respectively, were to the Miller Brewing Company. Sales concentration with our major customers has been significantly reduced since we have added new customers and products with our acquisitions of Monroe Etiquette, CentroStampa and Collotype which have manufacturing operations in France, Italy, Australia, South Africa and California.
On October 1, 2010, MCC acquired 100% of the shares of Monroe Etiquette for Euro 8,000, less net debt assumed (the Purchase Price). The seller received approximately 89% of the proceeds in the form of cash on October 1, 2010. The remaining 11% of the Purchase Price will be paid in cash, but is deferred for five years after the closing date. The seller has agreed to indemnify MCC with respect to the acquisition, including certain losses arising out of a breach of their warranties or covenants under the Agreement.
On June 28, 2010, the Company entered into a stock purchase agreement to acquire CentroStampa. On July 1, 2010, pursuant to the stock purchase agreement, the Company acquired 100% of the shares of CentroStampa for Euro 50,454 less net debt assumed. The
12
Table of Contents
selling shareholders received approximately 80% of the proceeds in the form of cash and 20% in the form of 934,567 shares of MCC common stock. This stock represented approximately 8% of MCC’s shares outstanding immediately prior to consummation of the acquisition.
On June 28, 2010, the Company entered into an amendment (the First Amendment) to the Company’s Credit Agreement dated as of February 29, 2008 (Credit Agreement) with the lenders thereunder, effective simultaneously with the closing of the acquisition.
The First Amendment amended the Credit Agreement to (i) permit the acquisition of CentroStampa by the Company; (ii) increase the Aggregate U.S. Revolving Commitment (as defined in the First Amendment) by $20,000 thereby increasing the total borrowing capacity from $180,000 to $200,000, with the potential to increase total borrowing capacity by $50,000; (iii) allow up to $40,000 of U.S. revolving loans to be advanced in alternative currencies; (iv) extend the maturity date of the Credit Facilities (as defined in the Credit Agreement) to April 1, 2014; (v) increase the maximum leverage ratio to 3.75 to 1.00 with scheduled step-downs; and (vi) implement a change in interest rate margins over the applicable Eurocurrency or Australian BBSY rate ranging from 1.75% to 3.25% based on the leverage ratio. The Company incurred $1,682 of debt issuance costs related to the debt modification which are being deferred and amortized over the life of the amended Credit Facility.
On February 12, 2010, the Company entered into a supply agreement to fulfill gravure cylinder requirements. As a part of the agreement, the Company sold certain assets associated with the manufacturing of gravure cylinders for $4,250 in cash. The Company recorded an after-tax gain of $2,141 on the sale in its fourth quarter fiscal 2010 financial results. The Erlanger facility is currently held for sale.
During fiscal 2010, the Company relocated its corporate headquarters from Sharonville, Ohio to its Batavia, Ohio facility in order to consolidate certain employees into existing owned office space. The lease for the Sharonville, Ohio location expires in April 2017. In connection with the relocation, the Company recorded a charge of $1,219 for remaining lease obligations and other costs related to its Sharonville facility. During the third quarter of fiscal 2011, the Company entered into a contract to sublease the remaining unoccupied space and recorded an adjustment of $258 to the initial charge to incorporate the impact of the additional sublease income.
In January 2009, the Company announced plans to consolidate its heat transfer label (HTL) manufacturing business located in Framingham, Massachusetts into its other existing facilities. The transition began immediately with final plant closure occurring in the second quarter of fiscal 2010. In connection with the closure of the Framingham facility, the Company recorded a total pre-tax charge of $2,553 during the fourth quarter period ending March 31, 2009, consisting of $1,407 in cash charges for employee severance and other termination benefits related to 62 associates and $1,146 in non-cash charges related to asset impairments.
On February 29, 2008, we acquired Collotype International Holdings Pty. Ltd. (Collotype) which is headquartered in Adelaide, South Australia. Collotype is the world’s leading and highly awarded pressure sensitive wine & spirit label manufacturer and a growing provider of labels in the fast-moving consumer goods marketplace in Australia. Collotype has manufacturing operations in Australia, South Africa and the United States.
Our vision is to be a premier global resource of decorating solutions. We currently serve customers located throughout North, Central and South America, Australia, South Africa, New Zealand, Italy, France and China. We continue to monitor and analyze new trends in the packaging and consumer products industries to ensure that we are providing appropriate services and products to our customers. Certain factors that influence our business include consumer spending, new product introductions, new packaging technologies and demographics.
Our key objectives for fiscal year 2012 include winning new customers, growing with existing customers, providing greater support to our blue chip customer base, improving our low cost manufacturing market position and continuing to develop our global operations foot print through selective acquisitions.
As part of our initiative to develop our global operations, on April 1, 2011, we acquired La Cromografica, an Italian wine label specialist located in Florence, Italy. La Cromografica specializes in high quality wine labels for Italian premium wines. On May 2, 2011, we also acquired 70% ownership in two label operations, one in Santiago, Chile and the other in Mendoza, Argentina. These label operations will focus on providing premium labels to the expanding Latin American wine & spirit markets.
COMPARISON OF FISCAL YEARS ENDED MARCH 31, 2011 AND MARCH 31, 2010
| 2011 | 2010 | $ Change |
% Change |
|||||||||||||
| Net Revenues | $ | 338,284 | $ | 276,821 | $ | 61,463 | 22 | % | ||||||||
Net revenues increased 22% to $338,284 from $276,821. The majority of the increase in revenues was due the acquisitions of CentroStampa and Monroe Etiquette which contributed $44,323 or 16% of the revenue increases. The remaining increase was due to a 4% increase in sales volume and a 3% favorable foreign exchange impact, partially offset by a 1% unfavorable pricing impact.
13
Table of Contents
| 2011 | 2010 | $ Change |
% Change |
|||||||||||||
| Cost of Revenues | $ | 270,306 | $ | 228,220 | $ | 42,086 | 18 | % | ||||||||
| % of Net Revenues |
79.9 | % | 82.4 | % | ||||||||||||
| Gross Profit | $ | 67,978 | $ | 48,601 | $ | 19,377 | 40 | % | ||||||||
| % of Net Revenues |
20.1 | % | 17.6 | % | ||||||||||||
Cost of revenues increased 18% or $42,086 due to the acquisitions of CentroStampa and Monroe Etiquette, which contributed 15% to the cost of revenue increase, higher sales volumes and foreign exchange.
Gross profit increased $19,377 or 40% compared to the prior year. The acquisitions of CentroStampa and Monroe Etiquette contributed 21% to the gross profit increase. The remaining increase was due to higher sales volumes, foreign exchange and improved operating efficiencies. Gross margins increased to 20% from 18% of sales revenues compared to the prior year.
Selling, General & Administrative (SG&A) and Other Operating Items
| 2011 | 2010 | $ Change |
% Change |
|||||||||||||
| Selling, General & Administrative (SG&A) Expense |
$ | 33,176 | $ | 27,662 | $ | 5,514 | 20 | % | ||||||||
| % of Net Revenues |
9.9 | % | 10.0 | % | ||||||||||||
| Gain on Sale of Certain Cylinder Assets |
$ | — | $ | (3,451 | ) | $ | 3,451 | 100 | % | |||||||
| % of Net Revenues |
— | % | (1.2 | %) | ||||||||||||
| Loss on Legal Settlement |
2,800 | $ | — | $ | 2,800 | 100 | % | |||||||||
| % of Net Revenues |
0.8 | % | — | % | ||||||||||||
| Facility Closure Expense |
$ | (258 | ) | $ | 1,479 | $ | (1,737 | ) | (117 | %) | ||||||
| % of Net Revenues |
(0.1 | %) | 0.5 | % | ||||||||||||
SG&A expenses increased 20% compared to the prior year due to $3,936 of SG&A from the acquisitions of CentroStampa and Monroe Etiquette during the year, $1,334 in acquisition and start-up expenses and $1,069 in legal fees partially offset by headcount reductions and other cost decreases.
In the fourth quarter of fiscal 2010, the Company sold certain assets associated with the manufacturing of gravure cylinders for $4,250 in cash and recorded a pre-tax gain of $3,451 during the fourth quarter of fiscal 2010.
In the fourth quarter of fiscal 2011, the Company recorded a charge of $2,800 related to the settlement of a legal dispute with the John Henry Company.
In fiscal 2010, the Company recorded facility closure expenses of $1,219 in connection with the relocation of its corporate headquarters and during the third quarter of fiscal 2011, recorded a pre-tax reduction to the initial charge of $258 to incorporate the impact of the additional sublease income on the sublease of the remaining unoccupied space. In fiscal 2010, the Company also incurred employee retention charges of $260 in connection with the closure of the Framingham facility.
Interest and Other (Income) Expense
| 2011 | 2010 | $ Change |
% Change |
|||||||||||||
| Interest Expense |
$ | 7,021 | $ | 4,753 | $ | 2,268 | 48 | % | ||||||||
| Other (Income) Expense, net |
$ | (210 | ) | $ | (326 | ) | $ | 116 | 36 | % | ||||||
Interest expense increased to $7,021 compared to $4,753 in the prior year due primarily to the increase in debt borrowings to finance the acquisitions of CentroStampa and Monroe Etiquette. Also contributing to the increase was the impact of higher interest rates and higher interest expense related to the present value adjustments of various lease and other liabilities.
Other income decreased $116 due primarily to higher realized losses on foreign exchange in fiscal 2011.
| 2011 | 2010 | $ Change |
% Change |
|||||||||||||
| Income Tax Expense | $ | 7,038 | $ | 4,216 | $ | 2,822 | 67 | % | ||||||||
The Company’s effective tax rate was 28% in fiscal 2011 compared to 23% in the prior year due primarily to an increase in income in higher tax jurisdictions, partially offset by the release of reserves for uncertain tax positions whose statute of limitations expired during fiscal 2011 and the finalization of the new tax structure related to the European operations. The Company recognized a tax benefit related to a foreign exchange loss on intercompany loans and other items resulting in a $1,069 benefit to income tax expense in the fourth quarter of fiscal 2010. The Company expects its annual effective tax rate to be approximately 27% in fiscal year 2012.
14
Table of Contents
COMPARISON OF FISCAL YEARS ENDED MARCH 31, 2010 AND MARCH 31, 2009
| 2010 | 2009 | $ Change |
% Change |
|||||||||||||
| Net Revenues | $ | 276,821 | $ | 289,763 | $ | (12,942 | ) | (4 | %) | |||||||
Net revenues decreased 4% to $276,821 from $289,763. The decrease in revenues was due to a 6% decline in sales volume and pricing partially offset by a 2% favorable foreign exchange impact. The sales decline attributable to volume and pricing was comprised of a $14,215 or 5% decrease in sales volume and mix and $3,952 or 1% of lower pricing. The 5% sales volume decline is primarily related to lower sales volumes to our top two customers.
| 2010 | 2009 | $ Change |
% Change |
|||||||||||||
| Cost of Revenues | $ | 228,220 | $ | 236,957 | $ | (8,737 | ) | (4 | %) | |||||||
| % of Net Revenues |
82.4 | % | 81.8 | % | ||||||||||||
| Gross Profit | $ | 48,601 | $ | 52,806 | $ | (4,205 | ) | (8 | %) | |||||||
| % of Net Revenues |
17.6 | % | 18.2 | % | ||||||||||||
Cost of revenues decreased 4% or $8,737 to $228,220 due to lower North American sales volumes in fiscal year 2010. Gross profit decreased 8% or $4,205 in 2010 compared to 2009 due to a decrease in revenues as a result of lower sales volume to our top two customers and lower pricing. Gross profit margins remained steady at approximately 18% of sales revenues compared to the prior year.
Selling, General & Administrative (SG&A), Gain on Sale of Certain Cylinder Assets and Facility Closure Expense
| 2010 | 2009 | $ Change |
% Change |
|||||||||||||
| Selling, General & Administrative (SG&A) Expense |
$ | 27,662 | $ | 27,388 | $ | 274 | 1 | % | ||||||||
| % of Net Revenues |
10.0 | % | 9.5 | % | ||||||||||||
| Gain on Sale of Certain Cylinder Assets |
$ | (3,451 | ) | $ | — | $ | (3,451 | ) | (100 | %) | ||||||
| % of Net Revenues |
(1.2 | %) | — | % | ||||||||||||
| Facility Closure Expense |
$ | 1,479 | $ | 2,553 | $ | (1,074 | ) | (42 | %) | |||||||
| % of Net Revenues |
0.5 | % | 0.9 | % | ||||||||||||
SG&A expenses increased $274 compared to the prior year due to $1,034 in severance charges and $940 in non-cash fixed asset impairments partially offset by the impact of cost reduction actions implemented in the prior year.
On February 12, 2010, the Company entered into a supply agreement to fulfill gravure cylinder requirements. As a part of the agreement, the Company sold certain assets associated with the manufacturing of gravure cylinders for $4,250 in cash. The Company recorded a pre-tax gain of $3,451 in the fiscal fourth quarter.
In connection with the closure of the Framingham facility, the Company incurred employee retention charges of $260 in fiscal year 2010 and in fiscal year 2009, a charge of $2,553 consisting of $1,407 in cash charges for employee severance and other termination benefits and plant shut down costs and $1,146 in non-cash asset impairments.
In connection with the relocation of the Company’s corporate headquarters from Sharonville, Ohio to Batavia, Ohio, the Company recorded a charge of $1,219 in facility closure expense in fiscal year 2010.
Interest and Other (Income) Expense
| 2010 | 2009 | $ Change |
% Change |
|||||||||||||
| Interest Expense |
$ | 4,753 | $ | 6,841 | $ | (2,088 | ) | (31 | %) | |||||||
| Other (Income) Expense, net |
$ | (326 | ) | $ | (378 | ) | $ | 52 | 14 | % | ||||||
Interest expense decreased $2,088 due to a $17,303 or 16% net repayment of bank debt and lower interest rates. The decrease in other income was due primarily to lower scrap sales in fiscal year 2010.
| 2010 | 2009 | $ Change |
% Change |
|||||||||||||
| Income Tax Expense | $ | 4,216 | $ | 4,967 | $ | (751 | ) | (15 | %) | |||||||
The Company’s effective tax rate was 23% in 2010 compared to 30% in 2009 due to income in lower tax jurisdictions and a recognized tax benefit related to a foreign exchange loss on intercompany loans and other items resulting in a $1,069 benefit to income tax expense in the fourth quarter of fiscal 2010.
15
Table of Contents
| 2010 | 2009 | $ Change |
% Change |
|||||||||||||
| Income (Loss) from Discontinued Operations, Net of Tax | $ | — | $ | (137 | ) | $ | 137 | 100 | % | |||||||
The sale of Quick Pak was completed during fiscal year 2008 and additional income tax expense related to the sale was recorded in fiscal year 2009. There was no discontinued operations activity during fiscal year 2010.
Critical Accounting Policies and Estimates
The preparation of consolidated financial statements requires us to make estimates and judgments that affect the reported amounts of assets, liabilities, revenue and expenses. We continually evaluate our estimates, including, but not limited to, those related to revenue recognition, bad debts, inventories and any related reserves, income taxes, fixed assets, goodwill and intangible assets. We base our estimates on historical experience and on various other assumptions believed to be reasonable under the facts and circumstances. Actual results may differ from these estimates under different assumptions or conditions.
We believe the following critical accounting policies impact the more significant judgments and estimates used in the preparation of our consolidated financial statements. Additionally, our senior management has reviewed the critical accounting policies and estimates with the Board of Directors’ Audit and Finance Committee. For a more detailed discussion of the application of these and other accounting policies, refer to Note 2 of the Consolidated Financial Statements.
Revenue Recognition
The Company recognizes revenue on sales of products when the customer receives title to the goods, which is generally upon shipment or delivery depending on sales terms. Revenues are generally denominated in the currency of the country from which the product is shipped and are net of applicable returns and discounts.
Inventories
Inventories are valued at the lower of cost or market value and are maintained using the FIFO (first-in, first-out) or specific identification method. Excess and obsolete cost reductions are generally established based on inventory age.
Accounts Receivable
Our customers are primarily major consumer product, food, and wine & spirit companies and container manufacturers. Accounts receivable consist of amounts due from customers in connection with our normal business activities and are carried at sales value less allowance for doubtful accounts. The allowance for doubtful accounts is established to reflect the expected losses of accounts receivable based on past collection history, age and specific individual risks identified. Losses may also depend to some degree on current and future economic conditions. Although these conditions are unknown to us and may result in additional credit losses, we do not anticipate significant adverse credit circumstances in fiscal 2012. If we are unable to collect all or part of the outstanding receivable balance, there could be a material impact on the Company’s operating results and cash flows.
Goodwill and Other Acquired Intangible Assets
Goodwill is not amortized and the Company tests goodwill annually, as of the last day of February of each fiscal year, for impairment by comparing the fair value of the reporting unit goodwill to its carrying amount. Impairment is also tested when events or changes in circumstances indicate that the assets’ carrying values may be greater than the fair values. Intangible assets with definite useful lives are amortized using the straight-line method, which estimates the economic benefit, over periods of up to twenty years. Intangible assets are also tested for impairment when events or changes in circumstances indicate that the assets’ carrying values may be greater than the fair values.
The Company’s $158,553 of goodwill at March 31, 2011 relates primarily to the acquisitions of Collotype in 2008 and CentroStampa and Monroe Etiquette in fiscal 2011. The Company completed its annual goodwill impairment test in the fourth quarter of fiscal 2011. The first step of the impairment review compares the fair value of the Company to the carrying value. The fair value was calculated as of February 28, 2011 by calculating the Multi-Color market capitalization and adding a 15% control premium and comparing it to the Company’s shareholders’ equity balance. The result of the first step did not indicate potential impairment as the estimated fair value of its reporting unit exceeded the carrying value by $96,495. As a result, the second step of the impairment test was not required. Reasonably possible fluctuations in the stock price and market capitalization did not indicate impairment.
Impairment of Long-Lived Assets
We review long-lived assets for impairment whenever events or changes in circumstances indicate that assets might be impaired and the related carrying amounts may not be recoverable. The determination of whether impairment exists involves various estimates and assumptions, including the determination of the undiscounted cash flows estimated to be generated by the assets involved in the review. The cash flow estimates are based upon our historical experience, adjusted to reflect estimated future market and operating conditions. Measurement of an impairment loss requires a determination of fair value. We base our estimates of fair values on quoted market prices when available, independent appraisals as appropriate and industry trends or other market knowledge. Changes in the market condition and/or losses of a production line could have a material impact on the consolidated statements of income. The Company did not record any material impairment charges to long-lived assets during fiscal 2011.
16
Table of Contents
Income Taxes
Income taxes are recorded based on the current year amounts payable or refundable, as well as the consequences of events that give rise to deferred tax assets and liabilities. Deferred tax assets and liabilities result from temporary differences between the tax basis and reported book basis of assets and liabilities and result in taxable or deductible amounts in future years. Our accounting for deferred taxes involves certain estimates and assumptions that we believe are appropriate. Future changes in regulatory tax laws and/or different positions held by taxing authorities may affect the amounts recorded for income taxes.
The benefits of tax positions are not recorded unless it is more likely than not the tax position would be sustained upon challenge by the appropriate tax authorities. Tax benefits that are more likely than not to be sustained are measured at the largest amount of benefit that is cumulatively greater than a 50% likelihood of being realized.
Derivative Financial Instruments
The Company accounts for derivative financial instruments by recognizing derivative instruments as either assets or liabilities in the balance sheet at fair value and recognizing the resulting gains or losses as adjustments to earnings or accumulated other comprehensive income. The Company does not hold or issue derivative financial instruments for trading or speculative purposes.
The Company manages interest costs using a mixture of fixed rate and variable rate debt. Additionally, the Company enters into interest rate swaps whereby it agrees to exchange with a counterparty, at specified intervals, the difference between fixed and variable interest amounts calculated by reference to an agreed upon notional principal amount.
The Company’s interest rate swaps have been designated as effective cash flow hedges at inception and on an ongoing quarterly basis and therefore, any changes in fair value are recorded in other comprehensive income. If a hedge or portion thereof is determined to be ineffective, any changes in fair value would be recorded in the consolidated income statement. See Note 10.
The Company manages foreign currency exchange rate risk by entering into forward currency contracts. The forward contracts have been designated as effective fair value hedges at inception and on an ongoing quarterly basis and therefore, any changes in fair value are recorded in earnings. See Note 10.
Fair Value Disclosure
The carrying value of financial instruments approximates fair value.
The Company defines fair value as the price that would be received to sell an asset, or paid to transfer a liability, in an orderly transaction between market participants at the measurement date. To increase consistency and comparability in fair value measurements, the Company uses a fair value estimating three-level hierarchy that prioritizes the use of observable inputs. The three levels are:
Level 1 – Quoted market prices in active markets for identical assets and liabilities
Level 2 – Observable inputs other than quoted market prices in active markets for identical assets and liabilities
Level 3 – Unobservable inputs
The determination of where an asset or liability falls in the hierarchy requires significant judgment.
The Company has two interest rate swaps, a $40,000 non-amortizing swap and a $40,000 amortizing swap, to convert variable interest rates on a portion of outstanding debt to fixed interest rates. The Company adjusts the carrying value of these derivatives to their estimated fair values and records the adjustment in other comprehensive income.
The Company has a forward currency hedge to fix the U.S. dollar value of a press purchased in Euros and delivered to the Batavia, Ohio plant. The forward contract is designated as a fair value hedge. The Company adjusts the carrying value of this derivative to its estimated fair value and records the adjustment in earnings.
Fair value measurements of nonfinancial assets and nonfinancial liabilities are primarily used in goodwill and other intangible asset impairment analyses and in the valuation of assets held for sale. The Company tests goodwill annually, as of the last day of February of each fiscal year, for impairment by comparing the fair value of the reporting unit goodwill to its carrying amount. Impairment is also tested when events or changes in circumstances indicate that the assets’ carrying values may be greater than the fair values.
Liquidity and Capital Resources
Net cash flows provided by operating activities in 2011 were $37,083, an increase of $9,528 compared to the $27,555 provided by operating activities in 2010. The increase was due to cash generated from earnings, lower inventory balances and higher accounts payable balances partially offset by higher income tax payments. Net cash flows from operating activities in 2010 were $27,555, a decrease of $351 compared to the $27,906 provided by operating activities in 2009. The decrease was due to an increase in accounts receivable and inventories, partially offset by lower interest and income tax payments. The consolidated days sales outstanding (DSO) at March 31, 2011 and 2010 was approximately 52 and 41 days, respectively.
Net cash flows used in investing activities were $55,497 in 2011, $1,027 in 2010 and $2,236 in 2009. The investing activities in 2011 include capital expenditures of $13,102, investments in acquisitions of $43,092 and other items of $113, partially offset by proceeds from the sale of property, plant and equipment of $810. The investing activities in 2010 include capital expenditures of $6,317, partially offset
17
Table of Contents
by proceeds from the sale of property, plant and equipment and the gravure cylinder business of $5,055. The investing activities in 2009 include capital expenditures of $9,968, partially offset by refunds from equipment deposits and proceeds from the sale of property, plant and equipment.
Capital expenditures of $13,102 in 2011 and $6,317 in 2010 were funded primarily from cash flow from operations. Capital expenditures in fiscal 2011 were related primarily to the purchase of new presses in Australian, South African and North American operations and the purchase of the Green Bay, Wisconsin facility, which was formerly leased. The projected amount of capital expenditures for 2012 is $19,185.
Cash provided by financing activities in 2011 was $23,875 compared to cash used in financing activities of $21,959 in 2010. During 2011, net debt borrowings were $28,195, debt issue costs were $1,682 and dividends paid were $2,612 compared to net debt payments of $19,335 and dividends paid of $2,469 during 2010.
On February 29, 2008 and in connection with the Collotype acquisition, the Company executed a five-year $200,000 credit agreement with a consortium of bank lenders (Credit Facility) with an original expiration date in 2013. In June 2010, the Company amended the credit facility in conjunction with the acquisition of CentroStampa. The amendment extended the expiration date of the credit facility from February 28, 2013 to April 1, 2014, increased the aggregate U.S. revolving commitment by $20,000, allowed up to $40,000 of U.S. revolving loans to be advanced in alternative currencies, increased the maximum leverage ratio to 3.75 to 1.00 with scheduled step-downs, and implemented a change in interest rate margins over the applicable Eurocurrency or Australian Bank Bill Swap Bid Rate (BBSY) ranging from 1.75% to 3.25% based on the leverage ratio. In March 2011, the Company executed the second amendment to the credit facility. The second amendment increased the alternate currency sublimit from $40,000 to $50,000. The Credit Facility contains an election to increase the facility by up to an additional $50,000. The Company incurred $1,682 of debt issuance costs related to the debt modification which are being deferred and amortized over the life of the amended Credit Facility. At March 31, 2011, the aggregate principal amount of $190,000 under the Credit Facility was comprised of the following: (i) a $130,000 revolving credit facility that allows the Company to borrow in alternative currencies up to the equivalent of $50,000 (“U.S. Revolving Credit Facility”); (ii) the Australian dollar equivalent of a $40,000 revolving credit facility (“Australian Sub-Facility”); and (iii) a $20,000 term loan facility (“Term Loan Facility”), which amortizes $10,000 per year.
The Credit Facility may be used for working capital, capital expenditures and other corporate purposes. Loans under the U.S. Revolving Credit Facility and Term Loan Facility bear interest at either: (i) the greater of (a) Bank of America’s prime rate in effect from time to time; and (b) the federal funds rate in effect from time to time plus 0.5%; or (ii) the applicable London interbank offered rate plus the applicable margin for such loans which ranges from 1.75% to 3.25% based on the Company’s leverage ratio at the time of the borrowing. Loans under the Australian Sub-Facility bear interest at the BBSY rate plus the applicable margin for such loans, which ranges from 1.75% to 3.25% based on Multi-Color’s leverage ratio at the time of the borrowing.
Available borrowings under the Credit Facility at March 31, 2011 consisted of $34,725 under the U.S. Revolving Credit Facility and $31,518 under the Australian Sub-Facility.
The Credit Facility contains customary representations and warranties as well as customary negative and affirmative covenants. The Credit Facility requires MCC to maintain the following financial covenants: (i) a minimum consolidated net worth; (ii) a maximum consolidated leverage ratio of 3.75 to 1.00, stepping down to 3.25 to 1.00 from September 30, 2011 to March 31, 2012 and stepping down again to 3.00 to 1.00 at June 30, 2012 for each fiscal quarter thereafter; and (iii) a minimum consolidated interest charge coverage ratio of 4.00 to 1.00. The Credit Facility contains customary mandatory and optional prepayment provisions, customary events of default, and is secured by capital stock of certain subsidiaries, intercompany debt and the Company’s property and assets, but excluding real property.
In April 2008, the Company entered into two interest rate swap agreements to manage its exposure to interest rate fluctuations on variable debt (See Note 10). The interest rate swaps cover a portion of the debt under the Term Loan Facility and U.S. Revolving Credit Facility. At March 31, 2011, the interest rate swaps resulted in interest payments based on a fixed rate ranging from 5.20% to 4.79% and the balance of the amortizing swap was $16,000.
We believe that we have both sufficient short and long-term liquidity and financing. We had a working capital position of $30,357 at March 31, 2011 and we were in compliance with our loan covenants and current in our principal and interest payments on all debt.
18
Table of Contents
The following table summarizes the Company’s contractual obligations as of March 31, 2011:
| (in thousands) |
Total | Year 1 | Year 2 | Year 3 | Year 4 | Year 5 | More than 5 years |
|||||||||||||||||||||
| Long-term debt |
$ | 123,448 | $ | 10,440 | $ | 10,038 | $ | — | $ | 102,970 | $ | — | $ | — | ||||||||||||||
| Capital leases |
3,883 | 1,864 | 955 | 622 | 442 | — | — | |||||||||||||||||||||
| Interest on long-term debt (1) |
15,550 | 5,354 | 5,137 | 5,056 | 3 | — | — | |||||||||||||||||||||
| Rent due under operating leases |
34,421 | 6,373 | 6,258 | 6,063 | 5,820 | 4,684 | 5,223 | |||||||||||||||||||||
| Unconditional purchase obligations |
1,456 | 1,420 | 9 | 9 | 9 | 9 | — | |||||||||||||||||||||
| Pension and post retirement obligations |
1,024 | 46 | 36 | 25 | 63 | 100 | 754 | |||||||||||||||||||||
| Deferred compensation |
83 | 83 | — | — | — | — | — | |||||||||||||||||||||
| Unrecognized tax benefits (2) |
— | — | — | — | — | — | — | |||||||||||||||||||||
| Deferred purchase price |
12,019 | 10,862 | — | — | — | 1,157 | — | |||||||||||||||||||||
| Total contractual cash obligations |
$ | 191,884 | $ | 36,442 | $ | 22,433 | $ | 11,775 | $ | 109,307 | $ | 5,950 | $ | 5,977 | ||||||||||||||
| 1) | Interest on floating rate debt was estimated using projected forward LIBOR, EURIBOR and BBSY rates as of March 31, 2011. |
| 2) | The table excludes $3,986 in liabilities related to unrecognized tax benefits as the timing and extent of such payments are not determinable. |
Inflation
We do not believe that our operations have been materially affected by inflation. Inflationary price increases for raw materials could adversely impact our sales and profitability in the future.
New Accounting Pronouncements
In December 2010, the Financial Accounting Standards Board (FASB) issued revised accounting guidance to address diversity in practice about the interpretation of the pro forma revenue and earnings disclosure requirements for business combinations. The amendments specify that if a public entity presents comparative financial statements, the entity should disclose revenue and earnings of the combined entity as though the business combination that occurred during the current year had occurred as of the beginning of the comparable prior annual reporting period only. The amendment also expands the supplemental pro forma disclosures to include a description of the nature and amount of material, nonrecurring pro forma adjustments directly attributable to the business combination included in the reported pro forma revenue and earnings. This guidance is effective for fiscal years beginning on or after December 15, 2010, which for the Company is April 1, 2011. This guidance is not expected to have a material impact on the Company.
In December 2010, the FASB issued revised accounting guidance to modify step one of the goodwill impairment test for entities that have recognized goodwill and have one or more reporting units whose carrying amount for purposes of performing step one of the goodwill impairment test is zero or negative. For those entities which have one or more reporting units, the entity is required to perform step two of the goodwill impairment test if it is more likely than not that a goodwill impairment exists. This guidance is effective for fiscal years beginning after December 15, 2010, which for the Company is April 1, 2011. This guidance is not expected to have a material impact on the Company.
In April 2010, the FASB issued revised accounting guidance to address whether an employee stock option should be classified as a liability or as an equity instrument if the exercise price is denominated in the currency in which a substantial portion of the entity’s equity securities trades. That currency may differ from the entity’s functional currency and from the payroll currency of the employee receiving the option. This guidance is effective for fiscal years, and interim periods within those fiscal years, beginning on or after December 15, 2010, which for the Company is April 1, 2011. This guidance is not expected to have an impact on the Company.
In February 2010, the FASB issued revised accounting guidance for the disclosure of the date through which subsequent events have been evaluated. This guidance is effective on the issuance date, which for the Company is March 31, 2010. This guidance did not have a material impact on the Company.
In January 2010, the FASB issued revised accounting guidance for improving disclosures about fair value measurements. Among other provisions, this update enhances the usefulness of existing fair value measurement disclosures by requiring both the disaggregation of certain information as well as the inclusion of more robust disclosures about valuation techniques and inputs to recurring and nonrecurring fair value measurements. This guidance is effective for interim and annual reporting periods beginning after December 15, 2009, which for the Company is April 1, 2010. This guidance did not have a material impact on the Company.
In June 2009, the FASB issued revised accounting guidance for consolidation of variable interest entities which requires an enterprise to determine whether its variable interest or interests give it a controlling financial interest in a variable interest entity. The new guidance also requires ongoing assessments of whether an enterprise is the primary beneficiary of a variable interest entity. This guidance is effective for an entity’s first annual reporting period that begins after November 15, 2009, which for the Company is April 1, 2010. This guidance did not have a material impact on the Company.
19
Table of Contents
| ITEM 7A. | QUANTITATIVE AND QUALITATIVE DISCLOSURES ABOUT MARKET RISK |
Multi-Color does not enter into derivatives or other financial instruments for trading or speculative purposes, but we may utilize them to manage our fixed to variable-rate debt ratio or to manage foreign currency exchange rate volatility.
Multi-Color is exposed to market risks from changes in interest rates on certain of its outstanding debt. The outstanding loan balance under our bank credit facility bears interest at a variable rate based on prevailing short-term interest rates in the United States and Australia. In April 2008, the Company entered into two interest rate swaps (Swaps), a $40,000 non-amortizing Swap and a $40,000 amortizing Swap, to convert variable interest rates on a portion of outstanding debt to fixed interest rates. The Swaps expire in 2013 and result in interest payments based on fixed rates of 3.45% for the non-amortizing Swap and 3.04% for the amortizing Swap, plus the applicable margin per the requirements in the Credit Facility ranging from 1.75% to 3.25% based on the Company’s leverage ratio (see Note 10 to the Company’s Consolidated Financial Statements). Based on the outstanding debt at March 31, 2011, a 100 basis point change in the interest rate would change interest expense by approximately $679 annually.
Foreign currency exchange risk arises from our international operations in Australia, South Africa, Europe, China and South America as well as from transactions with customers or suppliers denominated in foreign currencies. The functional currency of each of the Company’s subsidiaries is the currency of the country in which the subsidiary operates. The Company did not have a significant foreign exchange risk prior to the Collotype acquisition. The results of operations of our foreign subsidiaries are translated into U.S. dollars at the average exchange rate for each monthly period. As foreign exchange rates change, there are changes to the U.S. dollar equivalent of sales and expenses denominated in foreign currencies. During fiscal 2011, approximately 37% of our net sales were made by our Australian, South African, Italian, French and Chinese subsidiaries and their combined net income was 57% of the Company’s net income.
The balance sheets of our foreign subsidiaries are translated into U.S. dollars at the closing exchange rates of each monthly balance sheet date. During fiscal 2011, the Company recorded an unrealized foreign currency translation gain of $19,378 in other comprehensive income as a result of movements in foreign currency exchange rates related to the Australian Dollar, South African Rand, and Euro. See Notes 2 and 20 to the Company’s Consolidated Financial Statements.
20
Table of Contents
| ITEM 8. | FINANCIAL STATEMENTS AND SUPPLEMENTARY DATA |
Index to Consolidated Financial Statements and Financial Statement Schedules
CONSOLIDATED FINANCIAL STATEMENTS
All financial statement schedules have been omitted because they are either not required or the information is included in the financial statements and notes thereto.
21
Table of Contents
MANAGEMENT’S REPORT ON INTERNAL CONTROL OVER FINANCIAL REPORTING
The management of Multi-Color Corporation (the Company) is responsible for the preparation and accuracy of the financial statements and other information included in this report. The Company’s management is also responsible for establishing and maintaining adequate internal control over financial reporting, as such term is defined in Securities Exchange Act Rules 13a-15(f). Under the supervision and with the participation of management, including Multi-Color’s principal executive officer and principal financial officer, the Company conducted an evaluation of the effectiveness of internal control over financial reporting as of March 31, 2011, based on the criteria set forth in “Internal Control – Integrated Framework” issued by the Committee of Sponsoring Organizations of the Treadway Commission.
There are inherent limitations on the effectiveness of any system of internal controls and procedures, including the possibility of human error and the circumvention or overriding of the controls and procedures. Accordingly, even effective internal controls and procedures can only provide reasonable assurance of achieving their control objectives.
In meeting its responsibility for the reliability of the financial statements, the Company depends upon its system of internal accounting controls. The system is designed to provide reasonable assurance that assets are safeguarded and that transactions are properly authorized and recorded. The system is supported by policies and guidelines, and by careful selection and training of financial management personnel. The Company also has a Disclosure Committee, whose responsibility is to ensure appropriate disclosures and presentation of the financial statements and notes thereto. Additionally, the Company has an Internal Audit Department to assist in monitoring internal controls and compliance with financial policies and procedures.
The Board of Directors meets its responsibility for overview of the Company’s financial statements through its Audit and Finance Committee which is composed entirely of independent Directors who are not employees of the Company. The Audit and Finance Committee meets periodically with management and Internal Audit to review and assess the activities of each in meeting their respective responsibilities. Grant Thornton LLP, the Company’s independent registered public accounting firm, has full access to the Audit and Finance Committee to discuss the results of their audit work, the adequacy of internal accounting controls and the quality of financial reporting.
The Company’s assessment of and conclusion on the effectiveness of its internal control over financial reporting did not include the internal controls of Guidotti CentroStampa SpA or Monroe Etiquette SAS, which were acquired on July 1 and October 1, 2010, respectively, and are included in the 2011 consolidated financial statements. The acquired companies constituted 26% of the Company’s assets as of March 31, 2011, and 13% and 24% of revenues and net income, respectively, for the year end March 31, 2011.
Based on the Company’s evaluation, management concluded that internal control over financial reporting was effective as of March 31, 2011. The Company’s internal control over financial reporting as of March 31, 2011 has been audited by Grant Thornton LLP, an independent registered public accounting firm, as stated in their report which is presented in these financial statements on page 24.
June 14, 2011
| /s/ Nigel A. Vinecombe |
| Nigel A. Vinecombe President and Chief Executive Officer (Principal Executive Officer) |
| /s/ Sharon E. Birkett |
| Sharon E. Birkett Vice President, Chief Financial And Accounting Officer, Secretary (Principal Financial Officer) |
22
Table of Contents
REPORT OF INDEPENDENT REGISTERED PUBLIC ACCOUNTING FIRM
Board of Directors and Stockholders
Multi-Color Corporation
We have audited the accompanying consolidated balance sheets of Multi-Color Corporation (an Ohio corporation) and subsidiaries (the “Company”) as of March 31, 2011 and 2010, and the related consolidated statements of income, stockholders’ equity, and cash flows for each of the three years in the period ended March 31, 2011. These financial statements are the responsibility of the Company’s management. Our responsibility is to express an opinion on these financial statements based on our audits.
We conducted our audits in accordance with the standards of the Public Company Accounting Oversight Board (United States). Those standards require that we plan and perform the audit to obtain reasonable assurance about whether the financial statements are free of material misstatement. An audit includes examining, on a test basis, evidence supporting the amounts and disclosures in the financial statements. An audit also includes assessing the accounting principles used and significant estimates made by management, as well as evaluating the overall financial statement presentation. We believe that our audits provide a reasonable basis for our opinion.
In our opinion, the consolidated financial statements referred to above present fairly, in all material respects, the financial position of Multi-Color Corporation and subsidiaries as of March 31, 2011 and 2010, and the results of their operations and their cash flows for each of the three years in the period ended March 31, 2011 in conformity with accounting principles generally accepted in the United States of America.
We also have audited, in accordance with the standards of the Public Company Accounting Oversight Board (United States), the Company’s internal control over financial reporting as of March 31, 2011, based on criteria established in Internal Control – Integrated Framework issued by the Committee of Sponsoring Organizations of the Treadway Commission (COSO) and our report dated June 14, 2011 expressed an unqualified opinion on the effectiveness of the Company’s internal control over financial reporting.
/s/ GRANT THORNTON LLP
Cincinnati, Ohio
June 14, 2011
23
Table of Contents
REPORT OF INDEPENDENT REGISTERED PUBLIC ACCOUNTING FIRM
Board of Directors and Stockholders
Multi-Color Corporation
We have audited Multi-Color Corporation’s (an Ohio Corporation) and subsidiaries internal control over financial reporting as of March 31, 2011, based on criteria established in Internal Control – Integrated Framework issued by the Committee of Sponsoring Organizations of the Treadway Commission (COSO). Multi-Color Corporation’s management is responsible for maintaining effective internal control over financial reporting and for its assessment of the effectiveness of internal control over financial reporting, included in the accompanying Management’s Report on Internal Control over Financial Reporting (Management’s Report). Our responsibility is to express an opinion on Multi-Color Corporation’s internal control over financial reporting based on our audit. Our audit of, and opinion on, Multi-Color Corporation’s internal control over financial reporting does not include internal control over financial reporting of Guidotti CentroStampa SpA and Monroe Etiquette SAS, both wholly owned subsidiaries, whose financial statements reflect total assets and revenues constituting 26 and 13 percent, respectively, of the related consolidated financial statement amounts as of and for the year ended March 31, 2011. As indicated in Management’s Report, Guidotti CentroStampa SpA and Monroe Etiquette SAS were acquired during 2011 and therefore, management’s assertion on the effectiveness of Multi-Color Corporation’s internal control over financial reporting excluded internal control over financial reporting of Guidotti CentroStampa SpA and Monroe Etiquette SAS.
We conducted our audit in accordance with the standards of the Public Company Accounting Oversight Board (United States). Those standards require that we plan and perform the audit to obtain reasonable assurance about whether effective internal control over financial reporting was maintained in all material respects. Our audit included obtaining an understanding of internal control over financial reporting, assessing the risk that a material weakness exists, testing and evaluating the design and operating effectiveness of internal control based on the assessed risk, and performing such other procedures as we considered necessary in the circumstances. We believe that our audit provides a reasonable basis for our opinion.
A company’s internal control over financial reporting is a process designed to provide reasonable assurance regarding the reliability of financial reporting and the preparation of financial statements for external purposes in accordance with generally accepted accounting principles. A company’s internal control over financial reporting includes those policies and procedures that (1) pertain to the maintenance of records that, in reasonable detail, accurately and fairly reflect the transactions and dispositions of the assets of the company; (2) provide reasonable assurance that transactions are recorded as necessary to permit preparation of financial statements in accordance with generally accepted accounting principles, and that receipts and expenditures of the company are being made only in accordance with authorizations of management and directors of the company; and (3) provide reasonable assurance regarding prevention or timely detection of unauthorized acquisition, use, or disposition of the company’s assets that could have a material effect on the financial statements.
Because of its inherent limitations, internal control over financial reporting may not prevent or detect misstatements. Also, projections of any evaluation of effectiveness to future periods are subject to the risk that controls may become inadequate because of changes in conditions, or that the degree of compliance with the policies or procedures may deteriorate.
In our opinion, Multi-Color Corporation maintained, in all material respects, effective internal control over financial reporting as of March 31, 2011, based on criteria established in Internal Control – Integrated Framework issued by COSO.
We also have audited, in accordance with the standards of the Public Company Accounting Oversight Board (United States), the consolidated balance sheets of Multi-Color Corporation and subsidiaries as of March 31, 2011 and 2010, and the related consolidated statements of income, stockholders’ equity and cash flows for each of the three years in the period ended March 31, 2011 and our report dated June 14, 2011 expressed an unqualified opinion on those financial statements.
/s/ GRANT THORNTON LLP
Cincinnati, Ohio
June 14, 2011
24
Table of Contents
CONSOLIDATED STATEMENTS OF INCOME
For the Years Ended March 31
(In thousands, except per share data)
| 2011 | 2010 | 2009 | ||||||||||
| Net revenues |
$ | 338,284 | $ | 276,821 | $ | 289,763 | ||||||
| Cost of revenues |
270,306 | 228,220 | 236,957 | |||||||||
| Gross profit |
67,978 | 48,601 | 52,806 | |||||||||
| Selling, general and administrative expenses |
33,176 | 27,662 | 27,388 | |||||||||
| Gain on sale of certain cylinder assets |
— | (3,451 | ) | — | ||||||||
| Loss on legal settlement |
2,800 | — | — | |||||||||
| Facility closure expense/(income), net |
(258 | ) | 1,479 | 2,553 | ||||||||
| Operating income |
32,260 | 22,911 | 22,865 | |||||||||
| Interest expense |
7,021 | 4,753 | 6,841 | |||||||||
| Other (income) expense, net |
(210 | ) | (326 | ) | (378 | ) | ||||||
| Income from continuing operations before income taxes |
25,449 | 18,484 | 16,402 | |||||||||
| Income tax expense |
7,038 | 4,216 | 4,967 | |||||||||
| Income from continuing operations |
18,411 | 14,268 | 11,435 | |||||||||
| Loss from discontinued operations, net of tax |
— | — | (137 | ) | ||||||||
| Net income |
$ | 18,411 | $ | 14,268 | $ | 11,298 | ||||||
| Weighted average shares and equivalents outstanding: |
||||||||||||
| Basic |
13,005 | 12,209 | 12,156 | |||||||||
| Diluted |
13,139 | 12,332 | 12,355 | |||||||||
| Basic earnings per common share: |
||||||||||||
| Income from continuing operations |
$ | 1.42 | $ | 1.17 | $ | 0.94 | ||||||
| Loss from discontinued operations |
$ | — | $ | — | $ | (0.01 | ) | |||||
| Basic earnings per common share |
$ | 1.42 | $ | 1.17 | $ | 0.93 | ||||||
| Diluted earnings per common share: |
||||||||||||
| Income from continuing operations |
$ | 1.40 | $ | 1.16 | $ | 0.93 | ||||||
| Loss from discontinued operations |
$ | — | $ | — | $ | (0.01 | ) | |||||
| Diluted earnings per common share |
$ | 1.40 | $ | 1.16 | $ | 0.92 | ||||||
The accompanying notes are an integral part of the consolidated financial statements.
25
Table of Contents
As of March 31
(In thousands, except per share data)
| 2011 | 2010 | |||||||
| ASSETS |
||||||||
| Current Assets: |
||||||||
| Cash and cash equivalents |
$ | 15,152 | $ | 8,149 | ||||
| Accounts receivable, net |
54,564 | 32,546 | ||||||
| Inventories |
26,275 | 19,528 | ||||||
| Deferred tax asset |
3,598 | 2,418 | ||||||
| Prepaid expenses and other |
3,039 | 1,240 | ||||||
| Total current assets |
102,628 | 63,881 | ||||||
| Assets held for sale |
500 | 531 | ||||||
| Property, plant and equipment, net |
108,173 | 84,349 | ||||||
| Goodwill |
158,553 | 117,120 | ||||||
| Intangible assets, net |
38,020 | 16,829 | ||||||
| Deferred financing fees and other |
1,549 | 531 | ||||||
| Deferred tax asset |
2,406 | 2,101 | ||||||
| Total assets |
$ | 411,829 | $ | 285,342 | ||||
| LIABILITIES AND STOCKHOLDERS’ EQUITY |
||||||||
| Current liabilities: |
||||||||
| Current portion of long-term debt |
$ | 12,304 | $ | 10,001 | ||||
| Accounts payable |
31,717 | 22,125 | ||||||
| Accrued and other liabilities |
28,250 | 11,821 | ||||||
| Total current liabilities |
72,271 | 43,947 | ||||||
| Long-term debt |
115,027 | 75,642 | ||||||
| Deferred tax liability |
21,408 | 9,053 | ||||||
| Other liabilities |
11,297 | 10,072 | ||||||
| Total liabilities |
$ | 220,003 | $ | 138,714 | ||||
| Commitments and contingencies |
||||||||
| Stockholders’ equity: |
||||||||
| Preferred stock, no par value, 1,000 shares authorized, no shares outstanding |
— | — | ||||||
| Common stock, no par value, stated value of $0.10 per share; 25,000 shares authorized, 13,325 and 12,361 shares issued and outstanding at March 31, 2011 and 2010, respectively |
677 | 577 | ||||||
| Paid-in capital |
73,374 | 64,606 | ||||||
| Treasury stock, 69 and 36 shares at cost at March 31, 2011 and 2010, respectively |
(647 | ) | (239 | ) | ||||
| Restricted stock |
(400 | ) | (1,780 | ) | ||||
| Retained earnings |
103,278 | 87,479 | ||||||
| Accumulated other comprehensive income/(loss) |
15,544 | (4,015 | ) | |||||
| Total stockholders’ equity |
191,826 | 146,628 | ||||||
| Total liabilities and stockholders’ equity |
$ | 411,829 | $ | 285,342 | ||||
The accompanying notes are an integral part of the consolidated financial statements.
26
Table of Contents
CONSOLIDATED STATEMENTS OF STOCKHOLDERS’ EQUITY
(In thousands, except per share data)
| Common Stock | ||||||||||||||||||||||||||||||||
| Number of Shares Issued |
Amount | Paid-In Capital |
Treasury Stock |
Restricted Stock |
Retained Earnings |
Accumulated Other Comprehensive Income (Loss) |
Total | |||||||||||||||||||||||||
| March 31, 2008 |
12,194 | $ | 557 | $ | 58,967 | $ | (119 | ) | $ | (1,301 | ) | $ | 66,835 | $ | (5,001 | ) | $ | 119,938 | ||||||||||||||
| Adoption of SFAS 158 on April 1, 2008 |
(4 | ) | (4 | ) | ||||||||||||||||||||||||||||
| Balance at April 1, 2008 |
12,194 | $ | 557 | $ | 58,967 | $ | (119 | ) | $ | (1,301 | ) | $ | 66,831 | $ | (5,001 | ) | $ | 119,934 | ||||||||||||||
| Net income |
11,298 | 11,298 | ||||||||||||||||||||||||||||||
| Issuance of common stock |
180 | 8 | 1,037 | 1,045 | ||||||||||||||||||||||||||||
| Excess tax benefit from stock based compensation |
216 | 216 | ||||||||||||||||||||||||||||||
| Restricted stock grant |
10 | 2,490 | (2,500 | ) | — | |||||||||||||||||||||||||||
| Share-based compensation |
924 | 897 | 1,821 | |||||||||||||||||||||||||||||
| Additional minimum pension liability adjustment, net of tax of $108 |
(184 | ) | (184 | ) | ||||||||||||||||||||||||||||
| Shares acquired under employee plans |
(61 | ) | (61 | ) | ||||||||||||||||||||||||||||
| Common stock dividends |
(2,449 | ) | (2,449 | ) | ||||||||||||||||||||||||||||
| Unrealized loss on interest rate swaps, net of tax of $1,312 |
(2,025 | ) | (2,025 | ) | ||||||||||||||||||||||||||||
| Unrealized foreign currency translation loss |
(26,563 | ) | (26,563 | ) | ||||||||||||||||||||||||||||
| March 31, 2009 |
12,374 | $ | 575 | $ | 63,634 | $ | (180 | ) | $ | (2,904 | ) | $ | 75,680 | $ | (33,773 | ) | $ | 103,032 | ||||||||||||||
| Net income |
14,268 | 14,268 | ||||||||||||||||||||||||||||||
| Issuance of common stock |
23 | 1 | 37 | 38 | ||||||||||||||||||||||||||||
| Excess tax deficiency from stock based compensation |
(193 | ) | (193 | ) | ||||||||||||||||||||||||||||
| Restricted stock grant |
1 | 249 | (250 | ) | — | |||||||||||||||||||||||||||
| Share-based compensation |
879 | 1,374 | 2,253 | |||||||||||||||||||||||||||||
| Additional minimum pension liability adjustment, net of tax of $86 |
130 | 130 | ||||||||||||||||||||||||||||||
| Shares acquired under employee plans |
(59 | ) | (59 | ) | ||||||||||||||||||||||||||||
| Common stock dividends |
(2,469 | ) | (2,469 | ) | ||||||||||||||||||||||||||||
| Unrealized gain on interest rate swaps, net of tax of $231 |
346 | 346 | ||||||||||||||||||||||||||||||
| Unrealized foreign currency translation gain |
29,282 | 29,282 | ||||||||||||||||||||||||||||||
| March 31, 2010 |
12,397 | $ | 577 | $ | 64,606 | $ | (239 | ) | $ | (1,780 | ) | $ | 87,479 | $ | (4,015 | ) | $ | 146,628 | ||||||||||||||
| Net income |
18,411 | 18,411 | ||||||||||||||||||||||||||||||
| Issuance of common stock |
997 | 99 | 8,172 | 8,271 | ||||||||||||||||||||||||||||
| Excess tax deficiency from stock based compensation |
(368 | ) | (368 | ) | ||||||||||||||||||||||||||||
| Restricted stock grant |
1 | 249 | (250 | ) | — | |||||||||||||||||||||||||||
| Restricted stock forfeiture |
(51 | ) | 51 | — | ||||||||||||||||||||||||||||
| Share-based compensation |
766 | 1,579 | 2,345 | |||||||||||||||||||||||||||||
| Additional minimum pension liability adjustment, net of tax of $18 |
(28 | ) | (28 | ) | ||||||||||||||||||||||||||||
| Shares acquired under employee plans |
(408 | ) | (408 | ) | ||||||||||||||||||||||||||||
| Common stock dividends |
(2,612 | ) | (2,612 | ) | ||||||||||||||||||||||||||||
| Unrealized gain on interest rate swaps, net of tax of $133 |
209 | 209 | ||||||||||||||||||||||||||||||
| Unrealized foreign currency translation gain |
19,378 | 19,378 | ||||||||||||||||||||||||||||||
| March 31, 2011 |
13,394 | $ | 677 | $ | 73,374 | $ | (647 | ) | $ | (400 | ) | $ | 103,278 | $ | 15,544 | $ | 191,826 | |||||||||||||||
The accompanying notes are an integral part of the consolidated financial statements.
27
Table of Contents
CONSOLIDATED STATEMENTS OF CASH FLOWS
For the Years Ended March 31
(In thousands)
| 2011 | 2010 | 2009 | ||||||||||
| CASH FLOWS FROM OPERATING ACTIVITIES: |
||||||||||||
| Net income |
$ | 18,411 | $ | 14,268 | $ | 11,298 | ||||||
| Less loss from discontinued operations |
— | — | (137 | ) | ||||||||
| Income from continuing operations |
18,411 | 14,268 | 11,435 | |||||||||
| Adjustments to reconcile net income to net cash provided by operating activities, net of effects of acquisitions: |
||||||||||||
| Depreciation |
13,173 | 11,266 | 11,216 | |||||||||
| Amortization |
3,321 | 1,832 | 1,831 | |||||||||
| Gain on facility closure |
(258 | ) | — | — | ||||||||
| Net (gain) loss on disposal of equipment |
280 | 251 | (261 | ) | ||||||||
| Net gain on sale of certain cylinder assets |
— | (3,451 | ) | — | ||||||||
| Increase in non-current deferred compensation |
14 | 183 | 105 | |||||||||
| Stock based compensation expense |
2,345 | 2,253 | 1,821 | |||||||||
| Excess tax (benefit)/deficiency from stock based compensation |
368 | 193 | (216 | ) | ||||||||
| Impairment loss on long-lived assets |
31 | 1,035 | 1,372 | |||||||||
| Leasehold impairments included in facility closure expenses |
— | 711 | — | |||||||||
| Deferred taxes, net |
1,503 | (716 | ) | 7 | ||||||||
| Net (increase) decrease in accounts receivable |
(789 | ) | 713 | 5,954 | ||||||||
| Net (increase) decrease in inventories |
1,059 | (863 | ) | 2,495 | ||||||||
| Net (increase) decrease in prepaid expenses and other |
385 | 2,401 | (2,272 | ) | ||||||||
| Net (increase) decrease in accounts payable |
523 | (2,347 | ) | (2,328 | ) | |||||||
| Net (increase) decrease in accrued and other liabilities |
(3,814 | ) | (533 | ) | (3,126 | ) | ||||||
| Other |
531 | 359 | (127 | ) | ||||||||
| Net cash provided by operating activities |
37,083 | 27,555 | 27,906 | |||||||||
| CASH FLOWS FROM INVESTING ACTIVITIES: |
||||||||||||
| Capital expenditures |
(13,102 | ) | (6,317 | ) | (9,968 | ) | ||||||
| Investment in CentroStampa, net of cash acquired |
(34,895 | ) | — | — | ||||||||
| Investment in Monroe Etiquette, net of cash acquired |
(8,197 | ) | — | — | ||||||||
| Short-term refunds on equipment |
— | — | 6,003 | |||||||||
| Proceeds from sale of plant and equipment |
810 | 805 | 1,729 | |||||||||
| Proceeds from sale of certain assets associated with the manufacturing of gravure cylinders |
— | 4,250 | — | |||||||||
| Net refund/(payment) of escrow on acquisition of business |
(88 | ) | 235 | — | ||||||||
| Other |
(25 | ) | — | — | ||||||||
| Net cash used in investing activities |
(55,497 | ) | (1,027 | ) | (2,236 | ) | ||||||
| CASH FLOWS FROM FINANCING ACTIVITIES: |
||||||||||||
| Borrowings under revolving line of credit |
116,228 | 64,113 | 55,100 | |||||||||
| Payments under revolving line of credit |
(78,033 | ) | (73,448 | ) | (70,117 | ) | ||||||
| Repayment of long term debt |
(10,000 | ) | (10,000 | ) | (10,000 | ) | ||||||
| Proceeds from issuance of common stock |
342 | 38 | 1,045 | |||||||||
| Excess tax benefit/(deficiency) from stock based compensation |
(368 | ) | (193 | ) | 216 | |||||||
| Dividends paid |
(2,612 | ) | (2,469 | ) | (2,449 | ) | ||||||
| Debt issuance costs |
(1,682 | ) | — | (36 | ) | |||||||
| Net cash provided by (used in) financing activities |
23,875 | (21,959 | ) | (26,241 | ) | |||||||
| Effect of exchange rate changes on cash |
1,542 | 386 | (499 | ) | ||||||||
| Net increase (decrease) in cash |
7,003 | 4,955 | (1,070 | ) | ||||||||
| Cash and cash equivalents, beginning of the year |
8,149 | 3,194 | 4,264 | |||||||||
| Cash and cash equivalents, end of year |
$ | 15,152 | $ | 8,149 | $ | 3,194 | ||||||
The accompanying notes are an integral part of the consolidated financial statements.
28
Table of Contents
NOTES TO CONSOLIDATED FINANCIAL STATEMENTS
(In thousands, except per share data)
| (1) | THE COMPANY |
Multi-Color Corporation (the Company or MCC), headquartered in Cincinnati, Ohio, is a leader in global label solutions supporting a number of the world’s most prominent brands including leading producers of home and personal care, wine & spirit, food and beverage and specialty consumer products. MCC serves national and international brand owners in North, Central and South America, Europe, Australia, New Zealand, South Africa and China with a comprehensive range of the latest label technologies in Pressure Sensitive, Cut and Stack, In-Mold, Shrink Sleeve and Heat Transfer labels.
| (2) | SUMMARY OF SIGNIFICANT ACCOUNTING POLICIES |
Basis of Presentation
References to 2011, 2010 and 2009 are for the fiscal years ended March 31, 2011, 2010 and 2009, respectively. The consolidated financial statements included herein have been prepared in conformity with accounting principles generally accepted in the United States of America (U.S. GAAP) and include the accounts of the Company and its wholly-owned subsidiaries. All significant intercompany accounts and transactions have been eliminated. Certain prior year balances have been reclassified to conform to current year classifications.
Prior to June 2007, the Company was organized into two segments: Decorating Solutions and Packaging Services. The Decorating Solutions segment’s primary operations involved the design and printing of labels, while the Packaging Services segment provided promotional packaging, assembling and fulfillment services. On July 2, 2007, the Company completed the sale of Quick Pak, whose operating results were reported as the Packaging Services segment (see Note 4 to the Company’s Consolidated Financial Statements). Accordingly, the results of Quick Pak are now presented as discontinued operations for all periods in the consolidated financial statements and the Company no longer reports any segment results as it now only has one business segment.
On October 1, 2010, the Company acquired 100% of the capital shares of Monroe Etiquette, a French wine label specialist. The acquisition reinforced MCC’s commitment to expanding its global presence in the wine label market.
On July 1, 2010, the Company acquired 100% of Guidotti CentroStampa (CentroStampa) a leading European wine & spirit and olive oil label specialist based in Tuscany, Italy. The acquisition expanded MCC’s global presence in the wine & spirit label market and provided an entry into the olive oil label market.
On February 29, 2008, we acquired Collotype International Holdings Pty. Ltd. (Collotype) which is headquartered in Adelaide, South Australia. Collotype is the world’s leading and highly awarded pressure sensitive wine & spirit label manufacturer and a growing provider of labels in the fast-moving consumer goods marketplace in Australia. Collotype has manufacturing operations in Australia, South Africa and the United States.
For further information regarding acquisitions see Note 3 to the Company’s Consolidated Financial Statements.
Revenue Recognition
The Company recognizes revenue on sales of products when the customer receives title to the goods, which is generally upon shipment or delivery depending on sales terms. Revenues are generally denominated in the currency of the country from which the product is shipped. All revenues are net of applicable returns and discounts.
Cash and Cash Equivalents
The Company records all highly liquid short-term investments with maturities of three months or less as cash equivalents. At March 31, 2011 and 2010, the Company had cash in foreign bank accounts of $14,949 and $4,780, respectively.
Accounts Receivable
Our customers are primarily major consumer product, food, and wine & spirit companies and container manufacturers. Accounts receivable consist of amounts due from customers in connection with our normal business activities and are carried at sales value less allowance for doubtful accounts. The allowance for doubtful accounts is established to reflect the expected losses of accounts receivable based on past collection history, age and specific individual risks identified. Losses may also depend to some degree on current and future economic conditions. Although future conditions are unknown to us and may result in additional credit losses, we do not anticipate significant adverse credit circumstances in fiscal 2012. If we are unable to collect all or part of the outstanding receivable balance, there could be a material impact on the Company’s operating results and cash flows.
Inventories
Inventories are valued at the lower of cost or market value and are maintained using the FIFO (first-in, first-out) or specific identification method. Excess and obsolete cost reductions are generally established based on inventory age.
Property, Plant and Equipment
Property, plant and equipment are stated at cost.
29
Table of Contents
Depreciation is calculated using the straight-line method over the estimated useful lives of the assets, as follows:
| Buildings |
20-39 years | |||
| Machinery and equipment |
3-15 years | |||
| Computers |
3-5 years | |||
| Furniture and fixtures |
5-10 years |
Goodwill and Intangible Assets
Goodwill is not amortized and the Company tests goodwill annually, as of the last day of February of each fiscal year, for impairment by comparing the fair value of the reporting unit goodwill to its carrying amount. Impairment is also tested when events or changes in circumstances indicate that the assets’ carrying values may be greater than the fair values. Intangible assets with definite useful lives are amortized using the straight-line method, which estimates the economic benefit, over periods of up to twenty years. Intangible assets are also tested for impairment when events or changes in circumstances indicate that the assets’ carrying values may be greater than the fair values.
Impairment of Long-Lived Assets
We review long-lived assets for impairment whenever events or changes in circumstances indicate that assets might be impaired and the related carrying amounts may not be recoverable. The determination of whether impairment exists involves various estimates and assumptions, including the determination of the undiscounted cash flows estimated to be generated by the assets involved in the review. The cash flow estimates are based upon our historical experience, adjusted to reflect estimated future market and operating conditions. Measurement of an impairment loss requires a determination of fair value. We base our estimates of fair values on quoted market prices when available, independent appraisals as appropriate and industry trends or other market knowledge. Changes in the market condition and/or losses of a production line could have a material impact on the consolidated statements of income.
Income Taxes
Income taxes are recorded based on the current year amounts payable or refundable, as well as the consequences of events that give rise to deferred tax assets and liabilities. Deferred tax assets and liabilities result from temporary differences between the tax basis and reported book basis of assets and liabilities and result in taxable or deductible amounts in future years. Our accounting for deferred taxes involves certain estimates and assumptions that we believe are appropriate. Future changes in regulatory tax laws and/or different positions held by taxing authorities may affect the amounts recorded for income taxes.
The benefits of tax positions are not recorded unless it is more likely than not the tax position would be sustained upon challenge by the appropriate tax authorities. Tax benefits that are more likely than not to be sustained are measured at the largest amount of benefit that is cumulatively greater than a 50% likelihood of being realized.
Earnings per Common Share
The computation of basic earnings per common share (EPS) is based upon the weighted average number of common shares outstanding during the period. Diluted EPS is computed using the weighted average number of shares, and if dilutive, potential common shares outstanding during the period. Potential common shares outstanding during the period consist of restricted shares and the incremental common shares issuable upon the exercise of stock options and are reflected in diluted EPS by application of the treasury stock method. The Company excluded 515, 560 and 628 shares in the twelve months ended March 31, 2011, 2010 and 2009, respectively, from the computation of diluted EPS because these shares would have an anti-dilutive effect.
The following is a reconciliation of the number of shares used in the basic EPS and diluted EPS computations (shares in thousands):
| 2011 | 2010 | 2009 | ||||||||||||||||||||||
| Shares | Per Share Amount |
Shares | Per Share Amount |
Shares | Per Share Amount |
|||||||||||||||||||
| Basic EPS |
13,005 | $ | 1.42 | 12,209 | $ | 1.17 | 12,156 | $ | 0.93 | |||||||||||||||
| Effect of dilutive stock options and restricted shares |
134 | (0.02 | ) | 123 | (0.01 | ) | 199 | (0.01 | ) | |||||||||||||||
| Diluted EPS |
13,139 | $ | 1.40 | 12,332 | $ | 1.16 | 12,355 | $ | 0.92 | |||||||||||||||
Advertising Costs
Advertising costs are charged to expense as incurred and were minimal in 2011, 2010 and 2009.
Research and Development Costs
Research and development costs are charged to expense as incurred and were $2,628, $2,658 and $3,426 in 2011, 2010 and 2009, respectively.
Use of Estimates in Financial Statements
In preparing financial statements in conformity with U.S. GAAP, management makes estimates and assumptions that affect the reported amounts of assets and liabilities and disclosures of contingent assets and liabilities at the date of the financial statements, as well as the reported amounts of revenues and expenses during the reporting period. Actual results could differ from those estimates.
Fair Value Disclosure
The carrying value of financial instruments approximates fair value.
30
Table of Contents
The Company defines fair value as the price that would be received to sell an asset, or paid to transfer a liability, in an orderly transaction between market participants at the measurement date. To increase consistency and comparability in fair value measurements, the Company uses a fair value estimating three-level hierarchy that prioritizes the use of observable inputs. The three levels are:
Level 1 - Quoted market prices in active markets for identical assets and liabilities
Level 2 - Observable inputs other than quoted market prices in active markets for identical assets and liabilities
Level 3 - Unobservable inputs
The determination of where an asset or liability falls in the hierarchy requires significant judgment.
The Company has two interest rate swaps, a $40,000 non-amortizing swap and a $40,000 amortizing swap, to convert variable interest rates on a portion of outstanding debt to fixed interest rates. The Company adjusts the carrying value of these derivatives to their estimated fair values and records the adjustment in accumulated other comprehensive income.
The Company has a forward currency hedge to fix the U.S. dollar value of a press purchased in Euros and delivered to the Batavia, Ohio plant. The forward contract is designated as a fair value hedge. The Company adjusts the carrying value of this derivative to its estimated fair value and records the adjustment in earnings.
Fair value measurements of nonfinancial assets and nonfinancial liabilities are primarily used in goodwill and other intangible asset impairment analyses and in the valuation of assets held for sale. The Company tests goodwill annually, as of the last day of February of each fiscal year, for impairment by comparing the fair value of the reporting unit goodwill to its carrying amount. Impairment is also tested when events or changes in circumstances indicate that the assets’ carrying values may be greater than the fair values.
Foreign Exchange
The functional currency of each of the Company’s subsidiaries is the currency of the country in which the subsidiary operates. Assets and liabilities of foreign operations are translated using period end exchange rates, and revenues and expenses are translated using average exchange rates during each period. Translation gains and losses are reported in accumulated other comprehensive income as a component of stockholders’ equity and were a gain of $19,378 during fiscal 2011 and a gain of $29,282 during fiscal 2010 (See Note 20).
Derivative Financial Instruments – Interest Rate Swaps
The Company accounts for derivative financial instruments by recognizing derivative instruments as either assets or liabilities in the balance sheet at fair value and recognizing the resulting gains or losses as adjustments to earnings or accumulated other comprehensive income. The Company does not hold or issue derivative financial instruments for trading or speculative purposes.
The Company manages interest costs using a mixture of fixed rate and variable rate debt. Additionally, the Company enters into interest rate swaps whereby it agrees to exchange with a counterparty, at specified intervals, the difference between fixed and variable interest amounts calculated by reference to an agreed upon notional principal amount.
The Company’s interest rate swaps have been designated as effective cash flow hedges at inception and on an ongoing quarterly basis and therefore, any changes in fair value are recorded in accumulated other comprehensive income. If a hedge or portion thereof is determined to be ineffective, any changes in fair value would be recorded in the consolidated income statement.
The Company manages foreign currency exchange rate risk by entering into forward currency contracts. The forward contracts have been designated as effective fair value hedges at inception and on an ongoing quarterly basis and therefore, any changes in fair value are recorded in earnings.
Subsequent Events
The Company evaluated subsequent events through the date the financial statements were issued, and noted no material subsequent events had occurred other than the La Cromografica acquisition, effective April 1, 2011, and the acquisition of 70% ownership in two label operations, one in Santiago, Chile and the other in Mendoza, Argentina, effective May 2, 2011. See Note 24.
New Accounting Pronouncements
In December 2010, the Financial Accounting Standards Board (FASB) issued revised accounting guidance to address diversity in practice about the interpretation of the pro forma revenue and earnings disclosure requirements for business combinations. The amendments specify that if a public entity presents comparative financial statements, the entity should disclose revenue and earnings of the combined entity as though the business combination that occurred during the current year had occurred as of the beginning of the comparable prior annual reporting period only. The amendment also expands the supplemental pro forma disclosures to include a description of the nature and amount of material, nonrecurring pro forma adjustments directly attributable to the business combination included in the reported pro forma revenue and earnings. This guidance is effective for fiscal years beginning on or after December 15, 2010, which for the Company is April 1, 2011. This guidance is not expected to have a material impact on the Company.
In December 2010, the FASB issued revised accounting guidance to modify step one of the goodwill impairment test for entities that have recognized goodwill and have one or more reporting units whose carrying amount for purposes of performing step one of the goodwill impairment test is zero or negative. For those entities which have one or more reporting units, the entity is required to perform step two of the goodwill impairment test if it is more likely than not that a goodwill impairment exists. This guidance is effective for fiscal years beginning after December 15, 2010, which for the Company is April 1, 2011. This guidance is not expected to have a material impact on the Company.
31
Table of Contents
In April 2010, the FASB issued revised accounting guidance to address whether an employee stock option should be classified as a liability or as an equity instrument if the exercise price is denominated in the currency in which a substantial portion of the entity’s equity securities trades. That currency may differ from the entity’s functional currency and from the payroll currency of the employee receiving the option. This guidance is effective for fiscal years, and interim periods within those fiscal years, beginning on or after December 15, 2010, which for the Company is April 1, 2011. This guidance is not expected to have an impact on the Company.
In February 2010, the FASB issued revised accounting guidance for the disclosure of the date through which subsequent events have been evaluated. This guidance is effective on the issuance date, which for the Company is March 31, 2010. This guidance did not have a material impact on the Company.
In January 2010, the FASB issued revised accounting guidance for improving disclosures about fair value measurements. Among other provisions, this update enhances the usefulness of existing fair value measurement disclosures by requiring both the disaggregation of certain information as well as the inclusion of more robust disclosures about valuation techniques and inputs to recurring and nonrecurring fair value measurements. This guidance is effective for interim and annual reporting periods beginning after December 15, 2009, which for the Company is April 1, 2010. This guidance did not have a material impact on the Company.
In June 2009, the FASB issued revised accounting guidance for consolidation of variable interest entities which requires an enterprise to determine whether its variable interest or interests give it a controlling financial interest in a variable interest entity. The new guidance also requires ongoing assessments of whether an enterprise is the primary beneficiary of a variable interest entity. This guidance is effective for an entity’s first annual reporting period that begins after November 15, 2009, which for the Company is April 1, 2010. This guidance did not have a material impact on the Company.
| (3) | ACQUISITIONS |
On October 1, 2010, the Company acquired 100% of the capital shares of Monroe Etiquette, a French wine label specialist. The acquisition reinforced MCC’s commitment to expanding its global presence in the wine label market. The results of Monroe Etiquette’s operations were included in the Company’s consolidated financial statements beginning October 1, 2010.
The purchase price for Monroe Etiquette consisted of the following:
| Cash from proceeds of borrowings |
$ | 8,984 | ||
| Deferred payment |
912 | |||
| $ | 9,896 | |||
The cash portion of the purchase price was funded through $8,984 of borrowings under the credit facility (see Note 9 for details of the credit facility). Assumed net debt included $1,293 of bank debt and capital leases less $787 of cash acquired. The seller received approximately 89% of the proceeds in the form of cash on October 1, 2010. The remaining 11% of the purchase price will be paid in cash, but is deferred for five years after the closing date. The Company spent $58 in acquisition expenditures during the year ended March 31, 2011 related to the Monroe Etiquette acquisition.
On July 1, 2010, the Company acquired 100% of Guidotti CentroStampa (CentroStampa) a leading European wine & spirit and olive oil label specialist based in Tuscany, Italy. The acquisition expanded MCC’s global presence in the wine & spirit label market and provided an entry into the olive oil label market. The results of CentroStampa’s operations were included in the Company’s consolidated financial statements beginning July 1, 2010.
The purchase price for CentroStampa consisted of the following:
| Cash from proceeds of borrowings |
$ | 41,004 | ||
| MCC common stock (934,567 shares issued) |
7,928 | |||
| Contingent consideration |
9,267 | |||
| $ | 58,199 | |||
The Company issued 934,567 shares of its common stock to CentroStampa equity holders with a restriction on sale or transfer within one year of the closing date. The value of this stock was determined based on the estimated fair value. The Company used the closing market price on July 1, 2010 to determine the estimated fair market value. The stock value was then reduced by 17.6% to reflect the estimated fair value of the discount for the one-year sale restriction as determined by an independent valuation.
The cash portion of the purchase price was funded through $41,004 of borrowings under the amended credit facility. See Note 9 for details of the credit facility amendment in conjunction with the acquisition of CentroStampa. Assumed net debt included $4,368 of bank debt and capital leases less $6,109 of cash acquired. The Company spent $912 in acquisition expenditures during the year ended March 31, 2011 related to the CentroStampa acquisition.
The selling shareholders have agreed to indemnify MCC with respect to the acquisition, including certain losses arising out of a breach of their warranties or covenants under the acquisition agreement (Agreement). The Agreement provides that 5% of the Purchase Price is subject to achieving certain financial targets and subject to certain quantitative measures. During the third quarter ended December 31, 2010, we adjusted the fair value of the contingent consideration related to the acquisition. The adjustment was based on information obtained during the third quarter relating to conditions that existed at the acquisition date. As a result, we treated this as a purchase price adjustment as of the acquisition date. On December 31, 2010, certain financial targets subject to certain quantitative measures required
32
Table of Contents
to realize the contingent payment were satisfied in full and the entire liability will be paid in July 2011. An additional 10% is held in escrow for up to five years to fund certain potential indemnification obligations of the selling shareholders.
At March 31, 2011, 10% of the purchase price ($7,322) is in an escrow account for the CentroStampa acquisition and will be released from the first to the fifth anniversary of the date of closing in the amount of 2% of the purchase price per year in accordance with the provisions of the escrow agreement.
The determination of the final purchase price and its allocation to specific assets acquired and liabilities assumed for CentroStampa and Monroe Etiquette was finalized during the fourth quarter of fiscal 2011 after fair value appraisals of assets and valuation of tax liabilities were finalized. There were no material changes to the preliminary purchase price or related allocation.
Based on fair value estimates, the purchase price for CentroStampa and Monroe Etiquette has been allocated to individual assets acquired and liabilities assumed as follows:
| CentroStampa | Monroe Etiquette |
|||||||
| Assets Acquired: |
||||||||
| Cash, less debt assumed |
$ | 1,741 | $ | — | ||||
| Accounts receivable |
15,110 | 2,153 | ||||||
| Inventories |
6,024 | 313 | ||||||
| Property, plant and equipment |
16,327 | 3,072 | ||||||
| Intangible assets |
16,383 | 4,159 | ||||||
| Goodwill |
23,405 | 3,742 | ||||||
| Other assets |
1,218 | 104 | ||||||
| Total assets |
$ | 80,208 | $ | 13,543 | ||||
| Liabilities Assumed: |
||||||||
| Accounts payable |
7,020 | 302 | ||||||
| Accrued income taxes payable |
365 | 173 | ||||||
| Accrued and other liabilities |
6,037 | 883 | ||||||
| Net debt assumed |
— | 506 | ||||||
| Deferred tax liabilities |
8,587 | 1,783 | ||||||
| Total liabilities |
22,009 | 3,647 | ||||||
| Net assets acquired |
$ | 58,199 | $ | 9,896 | ||||
The estimated fair value of identifiable intangible assets and their estimated useful lives are as follows:
| CentroStampa | Monroe Etiquette | |||||||||||||||
| Customer relationships |
$ | 13,697 | 18 years | $ | 4,084 | 20 years | ||||||||||
| Trademarks |
440 | 1.5 years | 75 | 1.25 years | ||||||||||||
| Licensing intangible |
2,246 | 5 years | — | |||||||||||||
| Total identifiable intangibles |
$ | 16,383 | $ | 4,159 | ||||||||||||
Identifiable intangible assets are amortized over their useful lives based on a number of assumptions including the estimated period of economic benefit and utilization.
None of the goodwill arising from the CentroStampa or Monroe Etiquette acquisition is deductible for income tax purposes. Below is a roll forward of the acquisition goodwill from acquisition date to March 31, 2011:
| CentroStampa | Monroe Etiquette |
|||||||
| Balance at acquisition date |
$ | 23,405 | $ | 3,742 | ||||
| Foreign exchange impact |
$ | 3,713 | 154 | |||||
| Balance at March 31, 2011 |
$ | 27,118 | $ | 3,896 | ||||
The goodwill for CentroStampa is attributable to the workforce of the acquired business, and the access to two significant markets, the olive oil label market and the Italian wine label market. Italy represents approximately 20% of the world’s wine production and is also a leading producer of olive oils.
The goodwill for Monroe Etiquette is attributable to access to the French wine label market and the workforce of the acquired business.
The accounts receivable acquired as part of the CentroStampa acquisition had a fair value of $15,110 at the acquisition date. The gross contractual value of the receivables prior to any adjustments was $15,197 and the estimated contractual cash flows that are not expected to be collected are $87. The accounts receivable acquired as part of the Monroe Etiquette acquisition had a fair value of $2,153 at the acquisition date. The gross contractual value of the receivables prior to any adjustments was $2,176 and the estimated contractual cash flows that are not expected to be collected are $23.
CentroStampa had net revenues of $38,578 and net income of $3,605, for the period from July 1, 2010 to March 31, 2011. Monroe Etiquette had net revenues of $5,744 and net income of $765, for the period from October 1, 2010 to March 31, 2011. The net revenues and net income of CentroStampa and Monroe Etiquette are included in the consolidated income statement for the period ending March 31, 2011.
33
Table of Contents
The following table provides the unaudited pro forma results of operations for the year ended March 31, 2011 and 2010 as if CentroStampa and Monroe Etiquette had been acquired as of the beginning of each period presented. The pro forma results include certain purchase accounting adjustments, such as capital lease adjustments, the estimated changes in depreciation, intangible asset amortization and interest expense. However, pro forma results do not include any anticipated synergies from the combination of the two companies, and accordingly, are not necessarily indicative of the results that would have occurred if the acquisition had occurred on the dates indicated or that may result in the future.
| Year Ended March 31, | ||||||||
| 2011 | 2010 | |||||||
| Net revenues |
$ | 355,066 | $ | 336,213 | ||||
| Net income |
$ | 19,831 | $ | 17,669 | ||||
| Diluted earnings per share |
$ | 1.48 | $ | 1.33 | ||||
During the third quarter of fiscal 2011, MCC announced plans to invest in establishing label operations in China. MCC is located in the major southern city of Guangzhou, near many national and international consumer product brand owners. The new business is managed by MCC’s Asia Pacific President of Consumer Products. The business became fully operational in the first quarter of fiscal 2012.
On February 29, 2008, the Company acquired 100% of Collotype which provided the Company with a broader international operating footprint to better serve its existing and acquired customers and an expanded ability to attract new international customers.
At March 31, 2011, $783 was in an escrow account pending resolution of various contingencies primarily related to income taxes for pre-acquisition activities of Collotype. Any change in escrow amounts would represent an offset to additional assumed liabilities with no change in the purchase price.
On April 1, 2011, we acquired La Cromografica, an Italian wine label specialist located in Florence, Italy. La Cromografica specializes in high quality wine labels for Italian premium wines. On May 2, 2011, we acquired 70% ownership in two label operations, one in Santiago, Chile and the other in Mendoza, Argentina. These label operations will focus on providing premium labels to the expanding Latin American wine & spirit markets. The initial accounting for these acquisitions was not complete as of June 14, 2011, due to the timing of the acquisitions. The Company is gathering appropriate information and necessary valuations for disclosure in the first quarter fiscal 2012 Form 10-Q.
| (4) | DISCONTINUED OPERATIONS |
In June 2007, the Company entered into a definitive agreement to sell its Packaging Services division, Quick Pak, for $19,200 in cash. The transaction closed on July 2, 2007, and accordingly, the Company recorded an after-tax gain on the sale of $6,922 in the quarter ended September 30, 2007. The results of Quick Pak are presented as discontinued operations for all periods in the consolidated financial statements and the Company no longer reports any segment results. The Company did not have any activity in discontinued operations in fiscal years ending March 31, 2011 and 2010.
Operating results of discontinued operations are as follows:
| Year Ended March 31, 2009 |
||||
| Revenues |
$ | — | ||
| Loss from discontinued operations: |
||||
| Loss from discontinued operations, before taxes |
$ | (212 | ) | |
| Total loss from discontinued operations, before taxes |
(212 | ) | ||
| Income tax benefit |
(75 | ) | ||
| Loss from discontinued operations |
$ | (137 | ) | |
| (5) | ACCOUNTS RECEIVABLE ALLOWANCE |
The Company’s customers are primarily major consumer product, food, and wine & spirit companies and container manufacturers. Accounts receivable consist of amounts due from customers in connection with our normal business activities and are carried at sales value less allowance for doubtful accounts. The allowance for doubtful accounts is established to reflect the expected losses of accounts receivable based on past collection history, age and specific individual risks identified. The following table summarizes the activity in the allowance for doubtful accounts for 2011, 2010 and 2009:
| 2011 | 2010 | 2009 | ||||||||||
| Balance at beginning of year |
$ | 533 | $ | 634 | $ | 479 | ||||||
| Provision |
112 | 101 | 368 | |||||||||
| Accounts written-off |
(94 | ) | (249 | ) | (183 | ) | ||||||
| Foreign exchange |
33 | 47 | (30 | ) | ||||||||
| $ | 584 | $ | 533 | $ | 634 | |||||||
34
Table of Contents
| (6) | INVENTORIES |
Inventories as of March 31 consisted of the following:
| 2011 | 2010 | |||||||
| Finished goods |
$ | 12,045 | $ | 12,267 | ||||
| Work-in-process |
5,102 | 2,390 | ||||||
| Raw materials |
9,675 | 5,730 | ||||||
| 26,822 | 20,387 | |||||||
| Inventory reserves |
(547 | ) | (859 | ) | ||||
| $ | 26,275 | $ | 19,528 | |||||
| (7) | PROPERTY, PLANT AND EQUIPMENT |
Property, plant and equipment consisted of the following as of March 31:
| 2011 | 2010 | |||||||
| Land and buildings |
$ | 22,384 | $ | 20,448 | ||||
| Machinery and equipment |
135,467 | 105,188 | ||||||
| Furniture, fixtures, computer equipment and software |
12,327 | 12,957 | ||||||
| Construction in progress |
4,587 | 618 | ||||||
| 174,765 | 139,211 | |||||||
| Accumulated depreciation |
(66,592 | ) | (54,862 | ) | ||||
| $ | 108,173 | $ | 84,349 | |||||
Total depreciation expense for 2011, 2010 and 2009 was $13,173, $11,266 and $11,216, respectively.
| (8) | GOODWILL AND INTANGIBLE ASSETS |
Goodwill is not amortized and the Company tests goodwill annually, as of the last day of February of each fiscal year, for impairment by comparing the fair value of the reporting unit goodwill to its carrying amount. Impairment is also tested when events or changes in circumstances indicate that the assets’ carrying values may be greater than the fair values. Intangible assets with definite useful lives are amortized using the straight-line method, which estimates the economic benefit, over periods of up to twenty years. Intangible assets are also tested for impairment when events or changes in circumstances indicate that the assets’ carrying values may be greater than the fair values.
The Company completed its annual goodwill impairment test in the fourth quarter of fiscal 2011. The first step of the impairment review compares the fair value of the Company to the carrying value. The fair value was calculated as of February 28, 2011 by calculating the Multi-Color market capitalization and adding a 15% control premium and comparing it to the Company’s shareholders’ equity balance. The result of the first step did not indicate potential impairment as the estimated fair value of its reporting unit exceeded the carrying value by $96,495. As a result, the second step of the impairment test was not required. Reasonably possible fluctuations in the stock price and market capitalization did not indicate impairment.
Goodwill movements consisted of:
| Balance at March 31, 2009 |
$ | 96,729 | ||
| Escrow receipts from indemnification claims related to the Collotype acquisition |
(235 | ) | ||
| Currency translation and other |
20,626 | |||
| Balance at March 31, 2010 |
$ | 117,120 | ||
| Acquisition of CentroStampa |
23,405 | |||
| Acquisition of Monroe Etiquette |
3,742 | |||
| Currency translation and other |
14,286 | |||
| Balance at March 31, 2011 |
$ | 158,553 | ||
See Note 3 to our consolidated financial statements for further information regarding the acquisitions of CentroStampa and Monroe Etiquette.
Intangible assets as of March 2011 consisted of the following:
| Balance at cost at March 31, 2010 |
CentroStampa/ Monroe Etiquette Acquisitions |
Foreign Exchange |
Intangibles at Cost |
Accumulated Amortization |
Net Intangibles at March 31, 2011 |
|||||||||||||||||||
| Customer relationships |
$ | 20,790 | $ | 17,781 | $ | 3,493 | $ | 42,064 | $ | (7,517 | ) | $ | 34,547 | |||||||||||
| Technology |
1,537 | — | 83 | 1,620 | (661 | ) | 959 | |||||||||||||||||
| Trademarks |
— | 515 | 58 | 573 | (271 | ) | 302 | |||||||||||||||||
| Licensing intangible |
— | 2,246 | 336 | 2,582 | (370 | ) | 2,212 | |||||||||||||||||
| $ | 22,327 | $ | 20,542 | $ | 3,970 | $ | 46,839 | $ | (8,819 | ) | $ | 38,020 | ||||||||||||
35
Table of Contents
Intangible assets as of March 2010 consisted of the following:
| Balance at cost at March 31, 2009 |
Foreign Exchange |
Intangibles at Cost |
Accumulated Amortization |
Net Intangibles at March 31, 2010 |
||||||||||||||||
| Customer relationships |
$ | 18,065 | $ | 2,725 | 20,790 | $ | (5,066 | ) | $ | 15,724 | ||||||||||
| Technology |
1,311 | 226 | 1,537 | (432 | ) | 1,105 | ||||||||||||||
| $ | 19,376 | $ | 2,951 | $ | 22,327 | $ | (5,498 | ) | $ | 16,829 | ||||||||||
The intangible assets were established in connection with completed acquisitions. They are amortized, using the straight-line method, over their estimated useful lives based on a number of assumptions including customer attrition rates, percentage of revenue attributable to technologies, royalty rates and projected future revenue growth. The weighted average amortization period for these assets is 14 years. Total amortization expense for 2011, 2010 and 2009 was $3,321, $1,832 and $1,831, respectively.
The estimated useful lives for each intangible asset class are as follows:
| Customer relationships |
7 to 20 years | |||
| Technologies |
7 to 8 years | |||
| Trademarks |
1 to 2 years | |||
| Licensing Intangible |
5 years |
The annual estimated amortization expense for future years is as follows:
| Fiscal 2012 |
$ | 3,984 | ||
| Fiscal 2013 |
3,642 | |||
| Fiscal 2014 |
3,457 | |||
| Fiscal 2015 |
3,437 | |||
| Fiscal 2016 |
2,822 | |||
| Thereafter |
20,678 | |||
| Total |
$ | 38,020 | ||
| (9) | DEBT |
The components of the Company’s debt consisted of the following as of March 31:
| 2011 | 2010 | |||||||
| U.S. Revolving Credit Facility, 2.25% and 1.66% weighted variable interest rate at March 31, 2011 and 2010, respectively, due in 2014 |
$ | 54,800 | $ | 45,000 | ||||
| Australian Sub-Facility, 7.16% and 5.63% variable interest rate at March 31, 2011 and 2010, respectively, due in 2014 |
8,482 | 10,642 | ||||||
| Term Loan Facility, 2.06% and 1.67% variable interest rate at March 31, 2011 and 2010, respectively, due in quarterly installments of $2,500 from 2009 to 2013 |
20,000 | 30,000 | ||||||
| Euro Sub-Facility, 2.92% variable interest rate at March 31, 2011, due in 2014 |
39,688 | — | ||||||
| Capital Leases |
3,883 | 1 | ||||||
| Other Subsidiary Debt |
478 | — | ||||||
| 127,331 | 85,643 | |||||||
| Less current portion of debt |
(12,304 | ) | (10,001 | ) | ||||
| $ | 115,027 | $ | 75,642 | |||||
The following is a schedule of future annual principal payments as of March 31, 2011:
| Debt | Capital Leases | Total | ||||||||||
| Fiscal 2012 |
$ | 10,440 | $ | 1,864 | $ | 12,304 | ||||||
| Fiscal 2013 |
10,038 | 955 | 10,993 | |||||||||
| Fiscal 2014 |
— | 622 | 622 | |||||||||
| Fiscal 2015 |
102,970 | 442 | 103,412 | |||||||||
| Total |
$ | 123,448 | $ | 3,883 | $ | 127,331 | ||||||
On February 29, 2008 and in connection with the Collotype acquisition (see Note 3 to the Company’s Consolidated Financial Statements), the Company executed a five-year $200,000 credit agreement with a consortium of bank lenders (Credit Facility) with an original expiration date in 2013. In June 2010, the Company amended the credit facility in conjunction with the acquisition of Guidotti CentroStampa. The amendment extended the expiration date of the credit facility from February 28, 2013 to April 1, 2014, increased the aggregate U.S. revolving commitment by $20,000, allowed up to $40,000 of U.S. revolving loans to be advanced in alternative currencies, increased the maximum leverage ratio to 3.75 to 1.00 with scheduled step-downs, and implemented a change in interest rate margins over the applicable Eurocurrency or Australian Bank Bill Swap Rate (BBSY) ranging from 1.75% to 3.25% based on the leverage ratio. In March 2011, the Company executed the second amendment to the credit facility. The second amendment increased the alternate currency sublimit from $40,000 to $50,000. The Credit Facility contains an election to increase the facility by up to an additional $50,000. At March 31, 2011, the aggregate principal amount of $190,000 under the Credit Facility is comprised of the
36
Table of Contents
following: (i) a $130,000 revolving credit facility that allows the Company to borrow in alternative currencies up to the equivalent of $50,000 (U.S. Revolving Credit Facility): (ii) the Australian dollar equivalent of a $40,000 revolving credit facility (Australian Sub-Facility); and (iii) a $20,000 term loan facility (Term Loan Facility), which amortizes $10,000 per year.
The Company incurred $1,682 of debt issuance costs related to the debt modification which are being deferred and amortized over the life of the amended Credit Facility. The Company recorded $555 in interest expense in the consolidated statement of income to amortize deferred financing costs in fiscal 2011.
The Credit Facility may be used for working capital, capital expenditures and other corporate purposes. Loans under the U.S. Revolving Credit Facility and Term Loan Facility bear interest either at: (i) the greater of (a) Bank of America’s prime rate in effect from time to time; and (b) the federal funds rate in effect from time to time plus 0.5%; or (ii) the applicable London interbank offered rate plus the applicable margin for such loans which ranges from 1.75% to 3.25% based on the Company’s leverage ratio at the time of the borrowing. Loans under the Australian Sub-Facility bear interest at the BBSY rate plus the applicable margin for such loans, which ranges from 1.75% to 3.25% based on the Company’s leverage ratio at the time of the borrowing.
Available borrowings under the Credit Facility at March 31, 2011 consisted of $34,725 under the U.S. Revolving Credit Facility and $31,518 under the Australian Sub-Facility.
The Credit Facility contains customary representations and warranties as well as customary negative and affirmative covenants which requires the Company to maintain the following financial covenants: (i) a minimum consolidated net worth; (ii) a maximum consolidated leverage ratio of 3.75 to 1.00, stepping down to 3.25 to 1.00 from September 30, 2011 to March 31, 2012 and stepping down again to 3.00 to 1.00 at June 30, 2012 for each fiscal quarter thereafter; and (iii) a minimum consolidated interest charge coverage ratio of 4.00 to 1.00. The Credit Facility contains customary mandatory and optional prepayment provisions, customary events of default, and is secured by the capital stock of certain subsidiaries, intercompany debt and all of the Company’s property and assets, but excluding real property. The Company is in compliance with all covenants under the Credit Facility as of March 31, 2011.
Capital Leases
With the acquisitions of CentroStampa and Monroe Etiquette, the Company assumed capital leases related to machinery and equipment.
The present value of the net minimum payments on capitalized leases as of March 31, 2011 is as follows:
| March 31, 2011 | ||||
| Total minimum lease payments |
$ | 3,883 | ||
| Less amount representing interest |
(89 | ) | ||
| Present value of net minimum lease payments |
3,794 | |||
| Current portion |
(1,864 | ) | ||
| Capitalized lease obligations, less current portion |
$ | 1,930 | ||
Included in the consolidated balance sheet as of March 31, 2011 under property, plant and equipment are cost and accumulated depreciation related to capitalized leases of $4,727 and $334, respectively. The capitalized leases carry interest rates from 0.4% to 7.00% and mature from 2011 to 2014.
| (10) | FINANCIAL INSTRUMENTS |
Historically, the Company has used interest rate swap agreements (Swaps) in order to manage its exposure to interest rate fluctuations under variable rate borrowings. Swaps involve the exchange of fixed and variable rate interest payments and do not represent an actual exchange of the underlying notional amounts between the two parties. The Swaps have been designated as cash flow hedges, with the effective portion of the gains and losses, net of tax, recorded in accumulated other comprehensive income.
In April 2008, the Company entered into two Swaps, a $40,000 non-amortizing Swap and a $40,000 amortizing Swap, to convert variable interest rates on a portion of outstanding debt to fixed interest rates. The Swaps expire in 2013 and result in interest payments based on fixed rates of 3.45% for the non-amortizing Swap and 3.04% for the amortizing Swap, plus the applicable margin per the requirements in the Credit Facility ranging from 1.75% to 3.25% based on the Company’s leverage ratio. The fixed interest rates at March 31, 2011 were 5.20% and 4.79% on the non-amortizing and amortizing Swaps, respectively. At March 31, 2011 and 2010, the balance of the amortizing Swap was $16,000 and $24,000, respectively.
The Swaps were designated as highly effective cash flow hedges, with the effective portion of gains and losses, net of tax, recorded in accumulated other comprehensive income and are measured on an ongoing basis. At March 31, 2011 and 2010, the fair value of the Swaps was a net liability of $2,418 and $2,760, respectively, and was included in other liabilities on the consolidated balance sheets.
Foreign currency exchange risk arises from our international operations in Australia, South Africa, Europe and China as well as from transactions with customers or suppliers denominated in foreign currencies. The functional currency of each of the Company’s subsidiaries is the currency of the country in which the subsidiary operates. At times, the Company uses forward currency contracts to manage the impact of fluctuations in currency exchange rates.
In March 2010, the Company entered into a forward currency contract to fix the South African Rand value of a press purchased in USD and delivered in South Africa in April 2010. This forward contract was not designated for hedge accounting treatment and therefore, the
37
Table of Contents
change in fair value of the contract was recorded in earnings. The forward contract was settled in the first quarter of fiscal year 2011 and did not have a material impact on earnings.
In June 2010, the Company entered into two forward currency contracts to fix the U.S. dollar value of a press to be purchased in Euros in two installments due September 2010 and September 2011. The press was delivered in September 2010 to the Batavia, Ohio plant and the first forward contract was settled. The forward contracts are designated as fair value hedges and changes in the fair value of the contracts are recorded in earnings. The fair value of the remaining contract at March 31, 2011 is $113.
On July 1, 2010, the Company entered into a Euro 32,000 revolving loan that is designated under hedge accounting as a non-derivative economic hedge of the net investment in foreign operations. Gains and losses on the effective portions of non-derivatives designated under net investment hedge accounting are recognized in accumulated other comprehensive income to offset the change in the value of the net investment being hedged. The balance in equity is recognized in the profit and loss account when the related foreign subsidiary is disposed. The gains and losses on de-designated loans are recognized immediately in the profit and loss account. In the second quarter of fiscal 2011, the Company de-designated a portion of the hedge by paying down Euro 4,000 of the loan and recognized an after-tax loss of $262. As of March 31, 2011, the Company had recognized $6,008 of exchange on the revolving loan that hedged the net investment in foreign operations.
| (11) | ACCRUED AND OTHER LIABILITIES |
Accrued and other liabilities consist of the following:
| March 31, | ||||||||
| 2011 | 2010 | |||||||
| Deferred payment (1) |
$ | 10,805 | $ | — | ||||
| Accrued payroll and benefits |
7,973 | 6,355 | ||||||
| Accrual for legal settlement |
2,800 | — | ||||||
| Unrecognized tax benefits |
1,390 | — | ||||||
| Accrued income taxes |
1,306 | 1,353 | ||||||
| Professional fees |
537 | 387 | ||||||
| Accrued real estate and other taxes |
499 | 476 | ||||||
| Other |
2,940 | 3,250 | ||||||
| Total Accrued and Other Liabilities |
$ | 28,250 | $ | 11,821 | ||||
| 1) | As part of the Guidotti CentroStampa acquisition, 5% of the Purchase Price was withheld subject to achieving certain financial targets and subject to certain quantitative measures. During the third quarter certain financial targets subject to certain quantitative measures required to realize the contingent payment were satisfied in full and the entire liability will be paid in July of 2011. |
| (12) | DEFERRED COMPENSATION AGREEMENTS |
In the past, the Company has entered into deferred compensation agreements with certain officers and employees under its 1999 Executive Deferred Compensation Plan, whereby participants could elect to defer a portion of their annual income and also receive an annual Company contribution credit based on a percentage (8% for 2010 and 2009) of such participant’s base compensation. In August 2010, the Company terminated the Executive Deferred Compensation Plan with an effective date of April 1, 2010. As a result, the Company made payments of $753 in January 2011 to certain employees and will make additional payments of $83 in fiscal 2012.
At March 31, 2011, $83 was classified as a short-term liability. At March 31, 2010, $533 was classified as short-term and $334 was classified as long-term. Interest on the deferred amounts, which is included in the balances due, was accrued at 5.25%, 5.25% and 7.25% in 2011, 2010 and 2009, respectively. The expense recognized under the Plan in 2011, 2010 and 2009 was $15, $183 and $105, respectively.
| (13) | EMPLOYEE BENEFIT PLANS |
The Company maintains a 401K retirement savings plan (Plan) for U.S. employees who meet certain service requirements. The Plan provides for voluntary contributions by eligible U.S. employees up to a specified maximum percentage of gross pay. At the discretion of the Company’s Board of Directors, the Company may contribute a specified matching percentage of the employee contributions. The Company also makes contributions to various retirement savings plans for Australian employees as required by law equal to 9% of gross pay, and for South African employees under a voluntary plan equal to 8% of gross pay. Company contributions to all retirement savings plans were $2,671, $2,403 and $2,183 in 2011, 2010 and 2009, respectively.
The Company also makes contributions to a retirement savings plan for Italian employees as required by labor collective national agreements equal to 4% of gross pay for those employees who qualify for such savings plan and who elect voluntarily to adhere to such plan by paying an additional 4% out of their gross pay. Company contributions to such retirement savings plan were $25 in 2011.
The Company has a single employer defined benefit pension plan (Pension Plan) which covers eligible union employees at its Norway, Michigan plant who were hired prior to July 14, 1998. The Pension Plan provides benefits based on a flat payment formula and years of credited service at a normal retirement age of 65. The benefits are actuarially reduced for early retirement. An active participant may annually elect to irrevocably freeze their benefits to participate in the Company 401K retirement savings plan.
The Company also has a post retirement health and welfare plan (Health Plan) that upon retirement provides health benefits to certain active Norway plant employees hired on or before July 31, 1998. The Health Plan allows participants to retire as early as age 62 and
38
Table of Contents
remain in the active medical plan until reaching Medicare eligibility at age 65. The Health Plan has no assets and the Company pays benefits as incurred.
The Company used a March 31 measurement date (the fiscal year end) for the Pension Plan and Health Plan in 2011, 2010 and 2009. Reconciliation of the Plans’ funded status and obligations as of March 31, 2011 and 2010 consisted of the following:
| Pension Plan | ||||||||||||
| 2011 | 2010 | 2009 | ||||||||||
| Net periodic cost components |
||||||||||||
| Service cost |
$ | 27 | $ | 25 | $ | 25 | ||||||
| Interest cost |
87 | 80 | 73 | |||||||||
| Actual (return) or loss on plan assets |
(102 | ) | (214 | ) | 332 | |||||||
| Recognized net actuarial gain or (loss) |
24 | 154 | (419 | ) | ||||||||
| Amortization of net actuarial loss |
15 | 36 | 4 | |||||||||
| Net periodic pension cost |
$ | 51 | $ | 81 | $ | 15 | ||||||
| Health Plan | ||||||||||||
| 2011 | 2010 | 2009 | ||||||||||
| Net periodic cost components |
||||||||||||
| Service cost |
$ | 26 | $ | 25 | $ | 33 | ||||||
| Interest cost |
33 | 32 | 39 | |||||||||
| Actual (return) or loss on plan assets |
— | — | — | |||||||||
| Recognized net actuarial gain or (loss) |
— | — | — | |||||||||
| Amortization of net actuarial loss |
— | — | 1 | |||||||||
| Net periodic pension cost |
$ | 59 | $ | 57 | $ | 73 | ||||||
| Pension Plan | Health Plan | |||||||||||||||
| 2011 | 2010 | 2011 | 2010 | |||||||||||||
| Change in benefit obligation |
||||||||||||||||
| Projected benefit obligation at beginning of year |
$ | 1,404 | $ | 1,342 | $ | 602 | $ | 529 | ||||||||
| Service cost |
27 | 25 | 26 | 25 | ||||||||||||
| Interest cost |
87 | 80 | 33 | 32 | ||||||||||||
| Actuarial loss/(gain) |
116 | (43 | ) | (30 | ) | 16 | ||||||||||
| Benefits paid |
(142 | ) | — | — | — | |||||||||||
| Plan expenses paid |
(2 | ) | — | — | — | |||||||||||
| Projected benefit obligation at end of year |
$ | 1,490 | $ | 1,404 | $ | 631 | $ | 602 | ||||||||
| Change in plan assets |
||||||||||||||||
| Fair value of plan assets at beginning of year |
$ | 975 | $ | 761 | $ | — | $ | — | ||||||||
| Actual return on plan assets |
102 | 214 | — | — | ||||||||||||
| Employer contributions |
217 | — | — | — | ||||||||||||
| Benefits paid |
(142 | ) | — | — | — | |||||||||||
| Plan expenses paid |
(2 | ) | — | — | — | |||||||||||
| Fair value of plan assets at end of year |
$ | 1,150 | $ | 975 | $ | — | $ | — | ||||||||
| Reconciliation of funded status |
||||||||||||||||
| Funded status |
$ | (340 | ) | $ | (429 | ) | $ | (631 | ) | $ | (602 | ) | ||||
| Unrecognized net actuarial loss/(gain) |
— | — | (19 | ) | 11 | |||||||||||
| Accrued cost at end of year |
$ | (340 | ) | $ | (429 | ) | $ | (650 | ) | $ | (591 | ) | ||||
| Weighted average assumptions |
||||||||||||||||
| Discount rate – net periodic cost |
6.20 | % | 6.00 | % | 5.60 | % | 6.00 | % | ||||||||
| Discount rate – projected benefit obligation |
5.75 | % | 6.20 | % | 5.00 | % | 5.60 | % | ||||||||
| Expected long-term rate of return on plan assets |
8.00 | % | 8.00 | % | — | — | ||||||||||
Rate of compensation increases are not applicable as a result of flat benefit formulas. The discount rate and rate of return were selected based upon current market conditions, Company experience and future expectations. The amount expected to be amortized from accumulated other comprehensive income and expected to be included in net periodic pension cost during the next twelve months is less than $50. The liability for the unfunded status of the Pension Plan and Health Plan was classified as long-term in other liabilities on the Company’s consolidated balance sheets.
Pension Plan assets consist primarily of listed equity and debt securities. Below are the weighted average asset allocations by category at March 31, 2011 and 2010, and the target allocations for 2012:
39
Table of Contents
| Asset category |
2011 | 2010 | Target % 2012 |
|||||||||
| Equity securities |
59 | % | 61 | % | 50-60 | % | ||||||
| Debt securities |
15 | % | 16 | % | 10-20 | % | ||||||
| Real estate |
0 | % | 0 | % | 0-10 | % | ||||||
| Other |
26 | % | 23 | % | 20-30 | % | ||||||
| Total |
100 | % | 100 | % | 100 | % | ||||||
At March 31, 2011, the fair value of the company’s pension plan assets were as follows:
| (in thousands) |
Total | Quoted Prices in Active Markets for Identical Assets (Level 1) |
Significant Observable Inputs (Level 2) |
Significant Unobservable Inputs (Level 3) |
||||||||||||
| Guaranteed: |
||||||||||||||||
| Stable Fund |
$ | 304 | $ | — | $ | 304 | $ | — | ||||||||
| Balanced |
437 | — | 437 | — | ||||||||||||
| U.S. Common Stock: |
||||||||||||||||
| Equity Growth |
61 | — | 61 | — | ||||||||||||
| Value & Income |
142 | — | 142 | — | ||||||||||||
| Growth & Income |
104 | — | 104 | — | ||||||||||||
| Special Equity |
63 | — | 63 | — | ||||||||||||
| International |
39 | — | 39 | — | ||||||||||||
| Total |
$ | 1,150 | $ | — | $ | 1,150 | $ | — | ||||||||
At March 31, 2010, the fair value of the company’s pension plan assets were as follows:
| (in thousands) |
Total | Quoted Prices in Active Markets for Identical Assets (Level 1) |
Significant Observable Inputs (Level 2) |
Significant Unobservable Inputs (Level 3) |
||||||||||||
| Guaranteed: |
||||||||||||||||
| Stable Fund |
$ | 225 | $ | — | $ | 225 | $ | — | ||||||||
| Balanced |
398 | — | 398 | — | ||||||||||||
| U.S. Common Stock: |
||||||||||||||||
| Equity Growth |
53 | — | 53 | — | ||||||||||||
| Value & Income |
126 | — | 126 | — | ||||||||||||
| Growth & Income |
88 | — | 88 | — | ||||||||||||
| Special Equity |
50 | — | 50 | — | ||||||||||||
| International |
35 | — | 35 | — | ||||||||||||
| Total |
$ | 975 | $ | — | $ | 975 | $ | — | ||||||||
The fair value of the guaranteed fund, balanced fund, domestic common stocks and international fund represents the reported net asset value of shares or underlying assets of the investment. The stable fund’s book value approximates fair value. The methods described above may produce a fair value calculation that may not be indicative of net realizable value or reflective of future fair values. Furthermore, while the Company believes its valuation methods are appropriate and consistent with other market participants, the use of different methodologies or assumptions to determine the fair value of certain financial instruments could result in a different fair value measurement at the reporting date.
Assumed health care cost trend rates have a significant effect on the amounts reported for the Health Plan. The health care cost trend rate assumed in measuring the Health Plan benefit obligation is 9% gradually decreasing to 4% in 2016 and thereafter. A one percentage point change in these assumed rates would increase the post retirement obligation by $63 or decrease the post retirement obligation by $56.
The Health Plan has no assets and the Company pays the benefits as incurred. The Company expects to pay $13 to the Pension Plan and expects to pay $33 to the Health Plan in 2012. Benefits expected to be paid from these plans in the future are as follows:
| Pension Plan |
Health Plan |
|||||||
| 2012 |
$ | 13 | $ | 33 | ||||
| 2013 |
13 | 23 | ||||||
| 2014 |
13 | 12 | ||||||
| 2015 |
36 | 27 | ||||||
| 2016 |
44 | 56 | ||||||
| 2017-2021 |
$ | 345 | $ | 409 | ||||
40
Table of Contents
| (14) | INCOME TAXES |
The provision (benefit) for income taxes includes the following components:
| 2011 | 2010 | 2009 | ||||||||||
| Currently payable |
||||||||||||
| Federal |
$ | 2,481 | $ | 4,608 | $ | 2,226 | ||||||
| State and local |
51 | 913 | 1,015 | |||||||||
| Foreign |
3,053 | (18 | ) | 1,338 | ||||||||
| $ | 5,585 | $ | 5,503 | $ | 4,579 | |||||||
| Deferred |
||||||||||||
| Federal |
2,037 | (1,330 | ) | 947 | ||||||||
| State and local |
176 | (256 | ) | 110 | ||||||||
| Foreign |
(760 | ) | 299 | (669 | ) | |||||||
| 1,453 | (1,287 | ) | 388 | |||||||||
| $ | 7,038 | $ | 4,216 | $ | 4,967 | |||||||
The following is a reconciliation between the U.S. statutory federal income tax rate and the effective tax rate:
| 2011 | 2010 | 2009 | ||||||||||
| Federal statutory rate |
35.0 | % | 35.0 | % | 35.0 | % | ||||||
| State and local income taxes, net of federal income tax benefit |
1.7 | % | 0.9 | % | 1.5 | % | ||||||
| Section 199 deduction |
(0.8 | )% | (0.9 | )% | (0.8 | )% | ||||||
| International rate differential |
(2.4 | )% | (2.3 | )% | (2.1 | )% | ||||||
| Unrecognized tax benefits |
(1.7 | )% | (1.6 | )% | 3.5 | % | ||||||
| Foreign permanent differences |
(5.4 | )% | (6.2 | )% | (8.8 | )% | ||||||
| Foreign exchange impact on repayment of intercompany loans |
— | (3.1 | )% | — | ||||||||
| Other |
1.3 | % | 1.0 | % | 2.0 | % | ||||||
| Effective tax rate |
27.7 | % | 22.8 | % | 30.3 | % | ||||||
The net deferred tax components consisted of the following at March 31:
| 2011 | 2010 | |||||||
| Deferred tax liabilities: |
||||||||
| Tax depreciation over book depreciation |
$ | (16,022 | ) | $ | (10,718 | ) | ||
| Tax intangible amortization over book intangible amortization |
(8,324 | ) | (2,155 | ) | ||||
| Lease obligations |
(1,552 | ) | — | |||||
| (25,898 | ) | (12,873 | ) | |||||
| Deferred tax assets: |
||||||||
| Deferred compensation |
— | 347 | ||||||
| Inventory reserves |
441 | 344 | ||||||
| Inventory capitalization |
330 | 359 | ||||||
| Allowance for doubtful accounts |
65 | 182 | ||||||
| Stock based compensation expense |
1,288 | 1,646 | ||||||
| Pension liability |
140 | 125 | ||||||
| Loss carry-forward amounts |
2,491 | 1,728 | ||||||
| Interest rate swaps |
940 | 1,104 | ||||||
| Lease obligations |
— | 279 | ||||||
| State basis over tax basis of fixed assets |
213 | 284 | ||||||
| Non-deductible accruals and other |
5,999 | 2,679 | ||||||
| Gross deferred tax asset |
11,907 | 9,077 | ||||||
| Valuation allowance |
(1,413 | ) | (723 | ) | ||||
| Net deferred tax asset |
10,494 | 8,354 | ||||||
| Net deferred tax liability |
$ | (15,404 | ) | $ | (4,519 | ) | ||
As of March 31, 2011 and 2010, the Company had net operating loss carry-forwards in foreign jurisdictions of $8,473 and $5,662, respectively, which will be available to offset future taxable income and income tax liabilities, respectively. Of these carry-forwards, $6,661 have no expiration and will be carried forward indefinitely, the rest will expire between fiscal 2016 and fiscal 2020. Additionally, as of March 31, 2011 and 2010, the Company had net operating loss carry-forwards in state jurisdictions of approximately $99 and $324, respectively. The current year carry-forwards will be available to offset future taxable income and tax liabilities, respectively. The carry-forwards have various expirations and will be carried forward between 3 to 20 years.
At March 31, 2011 and 2010 respectively, Multi-Color had valuation allowances of $1,413 and $723 related to certain deferred tax assets in foreign jurisdictions due to the uncertainty of the realization of future tax benefits from those assets. The Company recorded a $690 increase in valuation allowances in fiscal 2011 related to an increase in deferred tax assets in foreign jurisdictions for which the Company believes an income tax benefit will not be realized.
41
Table of Contents
The benefits of tax positions are not recorded unless it is more likely than not the tax position would be sustained upon challenge by the appropriate tax authorities. Tax benefits that are more likely than not to be sustained are measured at the largest amount of benefit that is cumulatively greater than a 50% likelihood of being realized.
As of March 31, 2011 and 2010, the Company had a liability of $3,986 and $3,531 respectively, recorded for unrecognized tax benefits for U.S., federal, state and foreign tax jurisdictions. As of March 31, 2011 and 2010, the Company recognized $(115) and $128 respectively for interest and penalties to income tax expense/(benefit) in the consolidated statements of income. The gross amount of interest and penalties included in the liability for March 31, 2011 and 2010 respectively was $1,883 and $1,074. In addition, the unrecognized tax benefits that, if recognized, would favorably impact the effective tax rate are $3,986. The Company believes it is reasonably possible that approximately $1,390 of unrecognized tax benefits as of March 31, 2011 will decrease within the next 12 months due to the lapse of statute of limitations and settlements of certain foreign and state income tax matters.
A summary of the activity for the Company’s unrecognized tax benefits follows:
| 2011 | 2010 | |||||||
| Balance as of the beginning of the year |
$ | 3,531 | $ | 3,821 | ||||
| Additions of tax positions of the current year |
145 | 109 | ||||||
| Additions of tax positions of prior years |
771 | — | ||||||
| Settlements |
(83 | ) | — | |||||
| Reductions of tax positions of prior years |
(106 | ) | — | |||||
| Lapses of applicable statutes of limitations |
(272 | ) | (399 | ) | ||||
| Balance as of end of year |
$ | 3,986 | $ | 3,531 | ||||
The Company files income tax returns in the U.S. federal jurisdiction, various foreign jurisdictions and various state and local jurisdictions where the statutes of limitations generally range from three to five years. At March 31, 2011, the Company is no longer subject to U.S. federal examinations by tax authorities for years before fiscal 2008. The Company is no longer subject to state and local examinations by tax authorities for years before fiscal 2006. In foreign jurisdictions, the Company is no longer subject to examinations by tax authorities for years before fiscal 1999.
The Company did not provide for U.S. federal income taxes or foreign withholding taxes in fiscal 2011 on approximately $2,129 of undistributed earnings of its foreign subsidiaries as such earnings are intended to be reinvested indefinitely. Quantification of the deferred tax liability, if any, associated with these undistributed earnings is not practicable.
| (15) | MAJOR CUSTOMERS |
During 2011, 2010 and 2009, sales to major customers (those exceeding 10% of the Company’s net revenues in one or more of the periods presented) approximated 22%, 28% and 32%, respectively of the Company’s consolidated net revenues. Approximately 16%, 18% and 19% of revenues in 2011, 2010 and 2009, respectively, were to the Procter & Gamble Company; approximately 6%, 10% and 13% of revenues in 2011, 2010 and 2009, respectively, were to the Miller Brewing Company.
In addition, accounts receivable balances of such major customers approximated 2% and 4% of the Company’s total accounts receivable balance at March 31, 2011 and 2010, respectively. The loss or substantial reduction of the business of any of the major customers could have a material adverse impact on the Company’s results of operations and cash flows.
| (16) | STOCK BASED COMPENSATION |
The Company measures compensation costs related to share-based transactions at the grant date, based on the fair value of the award, and recognizes them as expense over the requisite service period.
For the year ended March 31, 2011, the Company recorded pre-tax compensation expense for stock-based incentive awards of $2,345 which increased selling, general and administrative expenses by $2,144 and cost of revenues by $201 and had an associated tax benefit of $656. The impact on basic and diluted net income per share for the year ended March 31, 2011 was $0.13.
For the year ended March 31, 2010, the Company recorded pre-tax compensation expense for stock-based incentive awards of $2,253 which increased selling, general and administrative expenses by $2,104 and cost of revenues by $149 and had an associated tax benefit of $518. The impact on basic and diluted net income per share for the year ended March 31, 2010 was $0.14.
For the year ended March 31, 2009, the Company recorded pre-tax compensation expense for stock-based incentive awards of $1,821 which increased selling, general and administrative expenses by $1,679 and cost of revenues by $142 and had an associated tax benefit of $546. The impact on basic and diluted net income per share for the year ended March 31, 2009 was $0.10.
The Company calculates the value of each employee stock option, estimated on the grant date, using the Black-Scholes model and the following weighted average assumptions:
| 2011 | 2010 | 2009 | ||||||||||
| Expected life (years) |
5 | 5 | 5 | |||||||||
| Risk-free interest rate |
2.3 | % | 2.1 | % | 2.6 | % | ||||||
| Expected volatility |
52.2 | % | 49.3 | % | 37.5 | % | ||||||
| Dividend yield |
2.0 | % | 1.9 | % | 0.87 | % | ||||||
42
Table of Contents
The Company estimated volatility based on the historical volatility of its common stock. The risk-free interest rate is based on the U.S. Treasury yield for a term consistent with the expected life of the options in effect at the time of the grant. The dividend yield assumption is based on the Company’s history and expectation of dividend payouts. The expected life of the options represents the weighted-average period the stock options are expected to remain outstanding and is based on review of historical exercise behavior of option grants with similar vesting periods. The Company uses an estimated forfeiture rate based on historical data. The forfeitures are estimated at the time of grant and revised, if necessary, in subsequent periods if actual forfeitures differ from those estimates.
Stock Options
As of March 31, 2011, the Company reserved 568 shares for future issuance to key employees and directors under the Company’s stock option plans. Stock options granted under the plans enable the holder to purchase common stock at an exercise price not less than the market value on the date of grant and will expire not more than ten years after the date of grant. The applicable options vest ratably over a three to five year period. A summary of the changes in the options outstanding for years ended March 31, 2011, 2010 and 2009 is shown below:
| Options | Weighted Average Exercise Price |
Weighted Average Remaining Life (Years) |
Aggregate Intrinsic Value |
|||||||||||||
| Outstanding at March 31, 2008 |
754 | $ | 15.41 | |||||||||||||
| Granted |
153 | $ | 22.98 | |||||||||||||
| Exercised |
(81 | ) | $ | 12.86 | $ | 415 | ||||||||||
| Forfeited |
(108 | ) | $ | 19.65 | ||||||||||||
| Outstanding at March 31, 2009 |
718 | $ | 16.67 | |||||||||||||
| Granted |
170 | $ | 12.23 | |||||||||||||
| Exercised |
(7 | ) | $ | 5.59 | $ | 18 | ||||||||||
| Forfeited |
(34 | ) | $ | 21.31 | ||||||||||||
| Outstanding at March 31, 2010 |
847 | $ | 15.68 | |||||||||||||
| Granted |
157 | $ | 12.37 | |||||||||||||
| Exercised |
(49 | ) | $ | 7.02 | $ | 159 | ||||||||||
| Forfeited |
(60 | ) | $ | 18.60 | ||||||||||||
| Outstanding at March 31, 2011 |
895 | $ | 15.37 | 5.9 | $ | 5,252 | ||||||||||
| Exercisable at March 31, 2011 |
536 | $ | 15.73 | 4.5 | $ | 3,178 | ||||||||||
| Exercisable at March 31, 2010 |
468 | $ | 14.41 | 4.8 | $ | 2,568 | ||||||||||
As of March 31, 2011, the total compensation cost related to nonvested options not yet recognized and the weighted-average period over which it is expected to be recognized is $1,395 and 1.7 years, respectively.
The weighted average grant-date fair value of options granted during the year ended March 31, 2011, 2010 and 2009 was $4.87, $5.47 and $7.64, respectively. Cash received from options exercised during the year ended March 31, 2011 was $474, with a tax benefit of $133.
Restricted Stock
The Company’s stock option plans also provide for the issuance of restricted stock to certain employees and directors. The Company has reserved 241 restricted shares of common stock for future issuance to non-employee directors under the 2006 Director Equity Compensation Plan (the 2006 Director Plan). Restricted stock grants under these plans typically vest over a three to five year period. The cost of these awards is determined using the fair value of the Company’s common stock on the date of the grant and is recognized on a straight-line basis over the period the restrictions lapse. A summary of the changes in restricted shares for the year ended March 31, 2011, 2010 and 2009 is shown below:
| Restricted Shares |
Weighted Average Grant Date Fair Value |
|||||||
| Non-vested restricted shares at March 31, 2008 |
69 | $ | 23.38 | |||||
| Granted |
104 | $ | 25.41 | |||||
| Vested |
(18 | ) | $ | 20.70 | ||||
| Forfeited |
(6 | ) | $ | 23.91 | ||||
| Non-vested restricted shares at March 31, 2009 |
149 | $ | 24.84 | |||||
| Granted |
17 | $ | 14.48 | |||||
| Vested |
(26 | ) | $ | 23.43 | ||||
| Non-vested restricted shares at March 31, 2010 |
140 | $ | 23.83 | |||||
| Granted |
16 | $ | 15.50 | |||||
| Vested |
(122 | ) | $ | 24.73 | ||||
| Non-vested restricted shares at March 31, 2011 |
34 | $ | 16.49 | |||||
As of March 31, 2011, the total compensation cost related to nonvested restricted shares not yet recognized and the weighted-average period over which it is expected to be recognized was $400 and 1.07 years. During fiscal 2011, the Company accelerated the vesting of 100 restricted shares for certain executives who left the Company. The Company recorded a pre-tax charge of $1,065 related to the accelerated vesting of these restricted shares.
43
Table of Contents
| (17) | GEOGRAPHIC INFORMATION |
During fiscal 2011, the Company acquired Monroe Etiquette and Guidotti CentroStampa and established operations in China, which expanded the Company’s geographic presence. On February 29, 2008, the Company acquired Collotype which also expanded the Company’s geographic presence. For further information regarding these acquisitions see Note 3 to the Company’s Consolidated Financial Statements. The Company now manufactures labels in the United States, Australia, South Africa, France, Italy and China. The Company’s operations in China became fully operational in the first quarter of fiscal 2012. Net revenues, based on the country from which the product is shipped, and long-lived assets by country are as follows:
| 2011 | 2010 | 2009 | ||||||||||
| Net revenues: |
||||||||||||
| United States |
$ | 212,555 | $ | 200,715 | $ | 218,731 | ||||||
| Australia |
66,973 | 61,917 | 59,499 | |||||||||
| South Africa |
14,434 | 14,189 | 11,533 | |||||||||
| Italy |
38,578 | — | — | |||||||||
| France |
5,744 | — | — | |||||||||
| $ | 338,284 | $ | 276,821 | $ | 289,763 | |||||||
| March 31, | ||||||||||||
| 2011 | 2010 | |||||||||||
| Long-lived assets: |
||||||||||||
| United States |
$ | 99,252 | $ | 100,411 | ||||||||
| Australia |
117,975 | 105,460 | ||||||||||
| South Africa |
14,925 | 13,489 | ||||||||||
| Italy |
62,076 | — | ||||||||||
| France |
11,090 | — | ||||||||||
| China |
1,477 | — | ||||||||||
| $ | 306,795 | $ | 219,360 | |||||||||
| (18) | COMMITMENTS AND CONTINGENCIES |
Operating Lease Agreements
The Company has various equipment, office and facility operating leases. Leases expire on various dates through January 2019. Rent expense during 2011, 2010 and 2009 was approximately $4,616, $3,948 and $3,619, respectively.
The annual future minimum rental obligations as of March 31, 2011 are as follows:
| Fiscal 2012 |
$ | 6,373 | ||
| Fiscal 2013 |
6,258 | |||
| Fiscal 2014 |
6,063 | |||
| Fiscal 2015 |
5,820 | |||
| Fiscal 2016 |
4,684 | |||
| Thereafter |
5,223 | |||
| Total |
$ | 34,421 | ||
During fiscal 2010, the Company relocated its corporate headquarters from Sharonville, Ohio to its Batavia, Ohio facility in order to consolidate certain employees into existing owned office space. The lease for the Sharonville, Ohio location expires in April 2017. In connection with the relocation, the Company recorded a charge of $1,219 for remaining lease obligations and other costs related to its Sharonville facility. During fiscal 2011, the Company entered into a contract to sublease the remaining unoccupied space and recorded an adjustment of $258 to the initial charge to incorporate the impact of the additional sublease income. The interest income related to the sublease of the Sharonville facility is included in the net total charge that has been recorded for the relocation of the Sharonville facility and therefore no future interest income will be recorded to the Company’s statement of income.
The annual future sublease cash receipts as of March 31, 2011 are as follows:
| Fiscal 2012 |
$ | 405 | ||
| Fiscal 2013 |
417 | |||
| Fiscal 2014 |
430 | |||
| Fiscal 2015 |
442 | |||
| Fiscal 2016 |
455 | |||
| Thereafter |
507 | |||
| Total |
$ | 2,656 | ||
Purchase Obligations
The Company has entered into long-term purchase agreements (one to three years) for various uniforms, supplies, utilities and other services. The Company has a consigned inventory agreement with a key supplier in which the Company is required to purchase all consigned inventory not consumed within three months of order. Total inventories on consignment under this arrangement were $0 at March 31, 2011. The total estimated purchase obligations are $1,420 for 2012.
44
Table of Contents
Litigation
On April 5, 2011, the Company and four MCC employees who were formerly employed by the John Henry Company, as defendants, entered into a Confidential Settlement Agreement and Mutual General Release with the John Henry Company and Multi Packaging Solutions, as plaintiffs. The settlement relates to the complaint for damages and injunctive relief filed by plaintiffs in the Superior Court for Napa County, California on February 26, 2010. The complaint included allegations of improper taking and use of certain confidential and proprietary information by the employee defendants, which were denied by MCC and the employee defendants.
Pursuant to the Agreement and upon MCC’s payment of $2,800 to the John Henry Company, in April 2011, plaintiffs filed a request for dismissal of the complaint, the mutual release of all claims and potential claims arising out of the complaint became effective and the related injunction was deemed dissolved. The Company accrued for the $2,800 charge in March 2011. The liability is recorded in accrued and other liabilities in the consolidated balance sheet.
The Company is also subject to various legal claims and contingencies that arise out of the normal course of business, including claims related to commercial transactions, product liability, health and safety, taxes, environmental, employee-related matters and other matters. Litigation is subject to numerous uncertainties and the outcome of individual claims and contingencies is not predictable. It is possible that some legal matters for which reserves have not been established could result in an unfavorable outcome for the Company and any such unfavorable outcome could have a material adverse effect on our financial condition, results of operations and cash flows.
| (19) | SUPPLEMENTAL CASH FLOW DISCLOSURES |
Supplemental disclosures with respect to cash flow information and non-cash investing and financing activities are as follows:
| 2011 | 2010 | 2009 | ||||||||||
| Supplemental Disclosures of Cash Flow Information: |
||||||||||||
| Interest paid |
$ | 5,964 | $ | 4,273 | $ | 6,287 | ||||||
| Income taxes paid |
7,640 | 3,150 | 8,727 | |||||||||
| Supplemental Disclosures of Non-Cash Activities: |
||||||||||||
| Additional minimum pension liability |
(46 | ) | (216 | ) | 292 | |||||||
| Change in interest rate swap fair value |
342 | 577 | (3,337 | ) | ||||||||
| Business combinations accounted for as a purchase: |
||||||||||||
| Assets acquired (excluding cash) |
92,010 | — | (3,150 | ) | ||||||||
| Liabilities assumed |
(30,811 | ) | — | 2,845 | ||||||||
| Common stock issued |
(7,928 | ) | — | — | ||||||||
| Payable for acquisition costs |
— | — | 305 | |||||||||
| Liability for deferred payments |
(10,179 | ) | — | — | ||||||||
| Cash acquired |
6,896 | — | — | |||||||||
| Net cash paid (received) |
$ | 49,988 | $ | — | $ | — | ||||||
| (20) | COMPREHENSIVE INCOME |
The components of comprehensive income consist of:
| 2011 | 2010 | 2009 | ||||||||||
| Net income |
$ | 18,411 | $ | 14,268 | $ | 11,298 | ||||||
| Additional minimum pension liability, net of tax |
(28 | ) | 130 | (184 | ) | |||||||
| Unrealized foreign currency translation gain (loss) (1) |
19,378 | 29,282 | (26,563 | ) | ||||||||
| Unrealized gain (loss) on interest rate swaps, net of tax |
209 | 346 | (2,025 | ) | ||||||||
| Total |
$ | 37,970 | $ | 44,026 | $ | (17,474 | ) | |||||
| 1) | The unrealized foreign currency translation gain (loss) is not net of tax as the earnings are reinvested within foreign jurisdictions. |
| (21) | FAIR VALUE MEASUREMENTS |
The Company defines fair value as the price that would be received to sell an asset, or paid to transfer a liability, in an orderly transaction between market participants at the measurement date. To increase consistency and comparability in fair value measurements, the Company uses a fair value estimating three-level hierarchy that prioritizes the use of observable inputs. The three levels are:
Level 1 – Quoted market prices in active markets for identical assets and liabilities
Level 2 – Observable inputs other than quoted market prices in active markets for identical assets and liabilities
Level 3 – Unobservable inputs
The determination of where an asset or liability falls in the hierarchy requires significant judgment.
45
Table of Contents
Interest Rate Swaps
The Company has two interest rate swaps, a $40,000 non-amortizing swap and a $40,000 amortizing swap, to convert variable interest rates on a portion of outstanding debt to fixed interest rates. The Company adjusts the carrying value of these derivatives to their estimated fair values and records the adjustment in other comprehensive income. The fair value of the swaps ($2,418) was classified in other liabilities on the consolidated balance sheet at March 31, 2011.
Foreign Currency Forward Contract
In March 2010, the Company entered into a forward currency contract to fix the South African Rand value of a press purchased in USD and delivered in South Africa in April 2010. This forward contract was not designated for hedge accounting treatment and therefore, the change in fair value of the contract was recorded in earnings. The forward contract was settled in the first quarter of fiscal year 2011 and did not have a material impact on earnings.
In June 2010, the Company entered into two forward currency contracts to fix the U.S. dollar value of a press to be purchased in Euros in two installments due September 2010 and September 2011. The press was delivered in September 2010 to the Batavia, Ohio plant and the first forward contract was settled. The forward contracts are designated as fair value hedges and changes in the fair value of the contracts are recorded in earnings. The fair value of the remaining contract at March 31, 2011 is $113. The fair value of the remaining contract was classified in accrued and other liabilities at March 31, 2011.
At or during the year ended March 31, 2011, the Company carried the following financial assets and liabilities at fair value:
| Fair Value Measurement Using | ||||||||
| Fair Value at March 31, 2011 |
Quoted Prices in Active Markets for Identical Assets (Level 1) |
Significant Other Observable Inputs (Level 2) |
Significant Unobservable Inputs (Level 3) | |||||
| Interest rate swaps |
$(2,418) | — | $(2,418) | — | ||||
| Foreign currency forward contract |
$113 | — | $113 | — | ||||
At March 31, 2010, the Company carried the following financial assets and liabilities at fair value:
| Fair Value Measurement Using | ||||||||
| Fair Value at March 31, 2010 |
Quoted Prices in Active Markets for Identical Assets (Level 1) |
Significant Other Observable Inputs (Level 2) |
Significant Unobservable Inputs (Level 3) | |||||
| Interest rate swaps |
$(2,760) | — | $(2,760) | — | ||||
| Foreign currency forward contract |
$ (696) | — | $ (696) | — | ||||
Fair value measurements of nonfinancial assets and nonfinancial liabilities are primarily used in goodwill and other intangible asset impairment analyses and in the valuation of assets held for sale. The Company tests goodwill annually, as of the last day of February of each fiscal year, for impairment by comparing the fair value of the reporting unit goodwill to its carrying amount. Impairment is also tested when events or changes in circumstances indicate that the assets’ carrying values may be greater than the fair values. In 2011 and 2010, the Company did not adjust goodwill or intangible assets to their fair values on a nonrecurring basis. Goodwill and intangible assets are valued using level 3 inputs.
As part of the Guidotti CentroStampa and Monroe Etiquette acquisitions, the Company acquired presses that were appraised and adjusted to their fair value as part of the purchase price accounting. See Note 3 for further information regarding the acquisitions of CentroStampa and Monroe Etiquette. The carrying value of cash and equivalents, accounts receivable, accounts payable and debt approximate fair value.
In 2010, the Company recorded $940 in fixed asset impairments to the income statement. The carrying value of these assets was adjusted to $120, the estimated fair value of the assets.
| (22) | FACILITY CLOSURES |
During fiscal 2010, the Company relocated its corporate headquarters from Sharonville, Ohio to its Batavia, Ohio facility in order to consolidate certain employees into existing owned office space. The lease for the Sharonville, Ohio location expires in April 2017. In connection with the relocation, the Company recorded a charge of $1,219 for remaining lease obligations and other costs related to its Sharonville facility. In the three months ending December 31, 2010, the Company entered into a contract to sublease the remaining unoccupied space and recorded an adjustment of $258 to the initial charge to incorporate the impact of the additional sublease income.
On February 12, 2010, the Company entered into a supply agreement to fulfill gravure cylinder requirements. As a part of the agreement, the Company sold certain assets associated with the manufacturing of gravure cylinders for $4,250 in cash. The Company recorded a net after-tax gain of $2,141 on the sale in its fourth quarter fiscal 2010 financial results, including a charge of $262 for severance and other termination benefits and for plant clean-up costs. This liability is included in accrued and other liabilities in the Company’s consolidated balance sheets. The Erlanger facility is currently held for sale. All liabilities for employee benefits and plant clean up costs were paid as of March 2011. Below is a roll-forward of the reserves for employee severance and other termination benefits and other plant clean-up costs for fiscal year 2011:
46
Table of Contents
| Balance March 31, 2010 |
Amounts Expensed |
Amounts Paid |
Other | Balance March 31, 2011 |
||||||||||||||||
| Employee Benefits |
$ | 62 | $ | — | $ | (62 | ) | $ | — | $ | — | |||||||||
| Plant Clean-up Costs and Other Accruals |
172 | — | (93 | ) | (31 | ) | 48 | |||||||||||||
| Total |
$ | 234 | $ | — | $ | (155 | ) | $ | (31 | ) | $ | 48 | ||||||||
Below is a roll-forward of the reserves for employee severance and other termination benefits and other plant clean-up costs for fiscal year 2010:
| Balance March 31, 2009 |
Amounts Expensed |
Amounts Paid |
Balance March 31, 2010 |
|||||||||||||
| Employee Benefits |
$ | — | $ | 90 | $ | (28 | ) | $ | 62 | |||||||
| Plant Clean-up Costs |
— | 172 | — | 172 | ||||||||||||
| Total |
$ | — | $ | 262 | $ | (28 | ) | $ | 234 | |||||||
In January 2009, the Company announced plans to consolidate its heat transfer label (HTL) manufacturing business located in Framingham, Massachusetts into its other existing facilities. The transition began immediately with final plant closure occurring in the second quarter of fiscal 2010. In connection with the closure of the Framingham facility, the Company recorded a total pre-tax charge of $2,553 during its fourth quarter period ending March 31, 2009, consisting of $1,407 in cash charges for employee severance and other termination benefits related to 62 associates and other shut-down costs and $1,146 in non-cash charges related to asset impairments. This pre-tax charge was included in plant closure costs in the Company’s consolidated statements of income and the $1,407 liability for severance and other termination benefits and other shut-down costs was included in accrued and other liabilities in the Company’s consolidated balance sheets. Below is a roll-forward of the reserves for employee severance and other termination benefits and other plant shut-down costs for fiscal year 2011:
| Balance March 31, 2010 |
Amounts Expensed |
Amounts Paid |
Balance March 31, 2011 |
|||||||||||||
| Employee Benefits and Other Accruals |
$ | 91 | $ | — | $ | (91) | $ | — | ||||||||
Below is a roll-forward of the reserves for employee severance and other termination benefits and other plant shut-down costs for fiscal year 2010:
| Balance March 31, 2009 |
Amounts Expensed |
Amounts Paid |
Balance March 31, 2010 |
|||||||||||||
| Employee Benefits and Other Accruals |
$ | 1,407 | $ | 261 | $ | (1,577 | ) | $ | 91 | |||||||
| (23) | QUARTERLY DATA (UNAUDITED) |
(In thousands, except per share data)
Earnings per share amounts are computed independently each quarter. As a result, the sum of each quarter’s per-share amount may not equal the total per-share amount for the respective year due to rounding.
Fiscal 2011:
| Quarter | ||||||||||||||||||||
| First | Second | Third | Fourth | Total | ||||||||||||||||
| Net revenues |
$ | 74,146 | $ | 90,624 | $ | 83,379 | $ | 90,135 | $ | 338,284 | ||||||||||
| Gross profit |
14,988 | 18,403 | 16,181 | 18,406 | 67,978 | |||||||||||||||
| Net income |
$ | 3,745 | $ | 5,752 | $ | 4,786 | $ | 4,128 | $ | 18,411 | ||||||||||
| Basic earnings (loss) per share: |
$ | 0.31 | $ | 0.44 | $ | 0.36 | $ | 0.31 | $ | 1.42 | ||||||||||
| Diluted earnings (loss) per share: |
$ | 0.30 | $ | 0.43 | $ | 0.36 | $ | 0.31 | $ | 1.40 | ||||||||||
Fiscal 2011 results include a charge of $2,800 related to the settlement of a legal dispute with the John Henry Company and a pre-tax reduction of $258 to the initial charge recorded in fiscal 2010 in connection with the relocation of the Company’s corporate headquarters from Sharonville, Ohio to its Batavia, Ohio facility.
47
Table of Contents
Fiscal 2010:
| Quarter | ||||||||||||||||||||
| First | Second | Third | Fourth | Total | ||||||||||||||||
| Net revenues |
$ | 69,658 | $ | 71,963 | $ | 65,981 | $ | 69,219 | $ | 276,821 | ||||||||||
| Gross profit |
12,955 | 12,821 | 11,359 | 11,466 | 48,601 | |||||||||||||||
| Net income |
$ | 3,985 | $ | 3,432 | $ | 2,199 | $ | 4,652 | $ | 14,268 | ||||||||||
| Basic earnings (loss) per share: |
$ | 0.33 | $ | 0.28 | $ | 0.18 | $ | 0.38 | $ | 1.17 | ||||||||||
| Diluted earnings (loss) per share: |
$ | 0.32 | $ | 0.28 | $ | 0.18 | $ | 0.38 | $ | 1.16 | ||||||||||
In the fourth quarter of 2010, the Company recorded a pre-tax gain of $3,451 ($2,141 after-tax) related to the sale of certain assets associated with the manufacture of gravure cylinders. During fiscal 2010, the Company recorded a charge of $1,219 ($959 after-tax) for remaining lease obligations and other costs related to the relocation of the Company’s corporate headquarters from Sharonville, Ohio to its Batavia, Ohio facility.
| (24) | SUBSEQUENT EVENTS |
On March 29, 2011, the Company entered into a Stock Purchase Agreement (Agreement) to acquire La Cromografica S.R.L. (Acquisition). On April 1, 2011, pursuant to the Agreement, the Company acquired all issued capital shares of La Cromografica for Euro 8,300 including debt assumed. The selling shareholder received 100% of the proceeds in the form of cash as of June 1, 2011. The selling shareholder has agreed to indemnify the Company with respect to the Acquisition, including certain losses arising out of a breach of their warranties or covenants under the Agreement.
On May 2, 2011, the Company acquired a 70% ownership in two label operations, one in Santiago, Chile and the other in Mendoza, Argentina with a regional partner for an initial investment of $3,700.
| ITEM 9. | CHANGES IN AND DISAGREEMENTS WITH ACCOUNTANTS ON ACCOUNTING AND FINANCIAL DISCLOSURE |
None.
| ITEM 9A. | CONTROLS AND PROCEDURES |
(a) Evaluation of disclosure controls and procedures
The term “disclosure controls and procedures” (defined in SEC Rule 13A-15(e)) refers to the controls and other procedures of a company that are designed to ensure that information required to be disclosed by a company in the reports that it files under the Securities and Exchange Act of 1934 (the “Exchange Act”) is recorded, processed, summarized and reported within required time periods. Disclosure controls and procedures include, without limitation, controls and procedures designed to ensure that information required to be disclosed is accumulated and communicated to management, including the Chief Executive Officer and Chief Financial Officer, as appropriate to allow timely decisions regarding required disclosure. Multi-Color’s management, with the participation of the Chief Executive Officer and Chief Financial Officer, have evaluated the effectiveness of the Company’s disclosure controls and procedures as of March 31, 2011. Based on that evaluation, Multi-Color’s Chief Executive Officer and Chief Financial Officer have concluded that, such controls and procedures were effective to ensure that information the Company is required to disclose in reports that are filed or submitted under the Exchange act is recorded, processed, summarized, and reported within the time periods specified in the SEC’s rules and forms, and that such information is accumulated and communicated to our management, including our Chief Executive Officer and Chief Financial Officer, as appropriate, to allow timely decisions regarding required disclosure.
(b) Management’s report on internal control over financial reporting
Management’s Report on Internal Control over Financial Reporting and the Report of Independent Registered Public Accounting Firm thereon are set forth in Part II, Item 8 of this Annual Report on Form 10-K.
(c) Changes in internal control over financial reporting
During the quarter ended March 31, 2011, there were no changes in the Company’s internal control over financial reporting that have materially affected, or are reasonably likely to materially affect, Multi-Color’s internal control over financial reporting.
| ITEM 9B. | OTHER INFORMATION |
Not Applicable
| ITEM 10. | DIRECTORS, EXECUTIVE OFFICERS AND CORPORATE GOVERNANCE |
DIRECTORS
The information required by this item concerning directors is set forth in the sections entitled “Election of Directors” and “Corporate Governance and Board Matters” contained in the Company’s definitive proxy statement to be filed with the Securities and Exchange Commission and is hereby incorporated by reference into this Form 10-K.
48
Table of Contents
EXECUTIVE OFFICERS
The Executive Officers of the Company are as follows:
Nigel A. Vinecombe, 48, became a director of Multi-Color in February 2008. He was appointed President and Chief Executive Officer of the Company effective June 16, 2010. Mr. Vinecombe served as Chief Operating Officer of Multi-Color from May 2009 to June 16, 2010, and as President of the International Business Unit of Multi-Color from February 2008 until May 2009. From 2000 to February 2008, he served as Group Managing Director of Collotype International Holdings Pty Ltd., a privately-held Australian wine label manufacturer.
Sharon E. Birkett, 45, was promoted to Vice President and Chief Financial and Accounting Officer in July 2010. Ms. Birkett served as Vice President Corporate Controller of Multi-Color from February 2010 to July 2010, and as Vice President Finance of the International Business Unit of Multi-Color from February 2008 until February 2010. From 2003 to 2008, she served as Chief Financial Officer of Collotype International Holdings Pty Ltd, a privately-held Australian wine label manufacturer.
SECTION 16(a) BENEFICIAL OWNERSHIP REPORTING COMPLIANCE
Information on compliance with Section 16(a) of the Exchange Act is set forth in the section entitled “Section 16(a) Beneficial Ownership Reporting Compliance” contained in the Company’s definitive proxy statement to be filed with the Securities and Exchange Commission and is hereby incorporated by reference into this Form 10-K.
| ITEM 11. | EXECUTIVE COMPENSATION |
The information required by this item set forth in the sections entitled “Compensation Discussion and Analysis” and “Executive Compensation Information” contained in the Company’s definitive proxy statement to be filed with the Securities and Exchange Commission and is hereby incorporated by reference into this Form 10-K.
| ITEM 12. | SECURITY OWNERSHIP OF CERTAIN BENEFICIAL OWNERS AND MANAGEMENT AND RELATED STOCKHOLDER MATTERS (THOUSANDS, EXCEPT PER SHARE DATA) |
The following table provides information regarding shares outstanding and available for issuance under the Company’s existing stock option plans:
| (A) | (B) | (C) | ||||
| Plan Category |
Number of securities to be issued upon exercise of outstanding options, warrants and rights |
Weighted-average exercise price of outstanding options, warrants and rights |
Number of securities remaining available for future issuance under equity compensation plans (excluding securities reflected in Column A) | |||
| Equity compensation plans approved by security holders |
895 | $15.37 | 568 | |||
| Equity compensation plans not approved by security holders |
N/A | N/A | N/A |
Of the total securities remaining available for issuance, 122 shares are reserved for issuance to the Company’s Board of Directors and 446 shares are reserved for issuance to the Company’s employees.
The remainder of the information required by this item is set forth in the tabulation of the amount and nature of Beneficial Ownership of the Company’s securities in the Company’s definitive proxy statement to be filed with the Securities and Exchange Commission and is hereby incorporated by reference into this Form 10-K.
| ITEM 13. | CERTAIN RELATIONSHIPS AND RELATED TRANSACTIONS AND DIRECTOR INDEPENDENCE |
The information required by this item is set forth in the section entitled “Corporate Governance and Board Matters” contained in the Company’s definitive proxy statement to be filed with the Securities and Exchange Commission and is hereby incorporated by reference into this Form 10-K.
| ITEM 14. | PRINCIPAL ACCOUNTANT FEES AND SERVICES |
The information required by this item is set forth in the section entitled “Ratification of the Appointment of Grant Thornton LLP as Independent Registered Public Accountants” contained in our proxy statement to be filed with the SEC in connection with the 2011 Annual Meeting of Shareholders and is hereby incorporated by reference into this Form 10-K.
49
Table of Contents
| ITEM 15. | EXHIBITS AND FINANCIAL STATEMENT SCHEDULES |
| (a)(1) |
Financial Statements: | |
| The following Consolidated Financial Statements of Multi-Color Corporation and subsidiaries, Management’s Report and the Reports of the Independent Registered Public Accounting Firm are included in Part II, Item 8. | ||
| Management’s Report on Internal Control over Financial Reporting | ||
| Reports of Independent Registered Public Accounting Firm | ||
| Consolidated Statements of Income for the years ended March 31, 2011, 2010 and 2009 | ||
| Consolidated Balance Sheets as of March 31, 2011 and 2010 | ||
| Consolidated Statements of Stockholders’ Equity for the years ended March 31, 2011, 2010 and 2009 | ||
| Consolidated Statements of Cash Flows for the years ended March 31, 2011, 2010 and 2009 | ||
| Notes to Consolidated Financial Statements | ||
| (a)(2) |
Financial Statement Schedules: | |
| All schedules have been omitted because they are either not required or the information is included in the financial statements and notes thereto. | ||
| (a)(3) |
List of Exhibits | |
| Numbers |
Description |
Filing Status | ||
| 3.1 | Amended and Restated Articles of Incorporation | A | ||
| 3.2 | Amendment to Amended and Restated Articles of Incorporation (1987) | A | ||
| 3.3 | Amendment to Amended and Restated Articles of Incorporation (1999) | B | ||
| 3.4 | Amendment to Amended and Restated Articles of Incorporation (2007) | C | ||
| 3.5 | Amended and Restated Code of Regulations | D | ||
| 10.1 | First Refusal Agreement among certain Company shareholders | E | ||
| 10.2 | Waiver, Consent and Amendment Agreement dated May 7, 2002 (Amendment to First Refusal Agreement) | F | ||
| 10.3 | Asset Purchase Agreement dated January 25, 2005 between Multi-Color Corporation, MCC-Norway, Inc., MCC-Wisconsin, LLC, NorthStar Print Group, Inc. and Journal Communications, Inc. | G | ||
| 10.4 | Share Sale and Purchase Agreement dated January 21, 2008 among Multi-Color Corporation, Collotype International Holdings Pty Limited, Collotype Labels International Pty Limited and certain other parties | H | ||
| 10.5 | Credit Agreement dated as of February 29, 2008 among Multi-Color Corporation, Collotype International Holdings Pty Limited, Bank of America as Administrative Agent and Westpac Banking Corporation as Australian Administrative Agent | I | ||
| 10.6 | Guaranty and Collateral Agreement dated as of February 29, 2008 among Multi-Color Corporation, other parties thereto and Bank of America, N.A., as the Administrative Agent | I | ||
| 10.7 | Pledge and Security Agreement dated as of February 29, 2008 made by Multi-Color Corporation Australian Acquisition Pty Limited in favor of Westpac Banking Corporation, as Australian Administrative Agent | I | ||
| 10.8 | Stock Purchase Agreement dated June 28, 2010 between the Company and the shareholders of Guidotti CentroStampa SpA | J | ||
50
Table of Contents
| 10.9 | First Amendment to Credit Agreement dated June 28, 2010, by and among the Company, Collotype International Holdings Pty Limited, Bank of America as Administrative Agent, and Westpac Banking Corporation as Australian Administrative Agent | J | ||
| 10.10 | Stock Purchase Agreement dated September 8, 2010 between the Company and the shareholders of SAS Monroe Etiquette | K | ||
| 10.11 | Stock Purchase Agreement dated March 29, 2011, between the Company and the shareholder of La Cromografica S.R.L. | L | ||
| 10.12 | Confidential Settlement Agreement and Mutual General Release dated April 5, 2011 | Filed herewith | ||
| 10.13 | Shareholder Agreement of Collotype Labels (Chile) S.A. and Collotype Labels (Argentina) S.A., between MCC investments Chile Limitada, Etikolor S.A. and Fernando Aravena Escobar dated May 2, 2011 | M | ||
| MANAGEMENT CONTRACTS AND COMPENSATION PLANS (Exhibits 10.14 to 10.27) |
||||
| 10.14 | 401(k) Retirement Savings Plan and Trust | E | ||
| 10.15 | 1998 Non-Employee Director Stock Option Plan | N | ||
| 10.16 | Employment Agreement dated September 19, 2008 by and between Multi-Color Corporation and Francis D. Gerace | O | ||
| 10.17 | Employment Agreement dated September 19, 2008 by and between Multi-Color Corporation and Dawn H. Bertsche | O | ||
| 10.18 | 1999 Long-Term Incentive Plan of Multi-Color Corporation dated as of January 19, 1999 | P | ||
| 10.19 | 2003 Stock Incentive Plan | Q | ||
| 10.20 | Amendment to 2003 Stock Incentive Plan dated August 16, 2007 | C | ||
| 10.21 | 2006 Director Equity Incentive Plan | R | ||
| 10.22 | Employment Agreement between Collotype Labels Pty Ltd and Nigel A. Vinecombe dated February 29, 2008 | I | ||
| 10.23 | 1999 Executive Deferred Compensation Plan as amended | S | ||
| 10.24 | First Amendment to Employment Agreement dated September 21, 2009 between Multi-Color and Nigel A. Vinecombe | T | ||
| 10.25 | Retirement Amendment dated May 7, 2010 between Multi-Color and Francis D. Gerace | U | ||
| 10.26 | Employment Letter dated August 11, 2010 regarding compensation of Sharon Birkett | V | ||
| 10.27 | Amendment to 2003 Stock Incentive Plan dated September 16, 2010 | W | ||
| 21 | Subsidiaries with the Company | Filed herewith | ||
| 23 | Consent of Grant Thornton LLP | Filed herewith | ||
| 31.1 | Section 302 Certification – Chief Executive Officer | Filed herewith | ||
| 31.2 | Section 302 Certification – Chief Financial Officer | Filed herewith | ||
51
Table of Contents
| 32.1 | Section 906 Certification – Chief Executive Officer | Filed herewith | ||
| 32.2 | Section 906 Certification – Chief Financial Officer | Filed herewith | ||
Certain exhibits (as specified above) are hereby incorporated by reference to exhibits and appendices to the following documents previously filed by Multi-Color Corporation with the Securities and Exchange Commission.
| A | The Form 10-K for the 1996 fiscal year. | |
| B | The Form 10-K for the 2000 fiscal year. | |
| C | The Form 8-K filed August 17, 2007. | |
| D | The Proxy Statement for the Annual Meeting of Shareholders held on August 19, 1999. | |
| E | Registration Statement No. 33-51772, filed September 10, 1992. | |
| F | The Form 10-K for the 2003 fiscal year. | |
| G | The Form 8-K filed January 25, 2005. | |
| H | The Form 8-K filed January 25, 2008. | |
| I | The Form 8-K filed March 6, 2008. | |
| J | The Form 8-K filed July 2, 2010 | |
| K | The Form 8-K filed September 13, 2010 | |
| L | The Form 8-K filed March 31, 2011 | |
| M | The Form 8-K filed May 4, 2011 | |
| N | The Proxy Statement for the Annual Meeting of Shareholders held on October 15, 1998. | |
| O | The Form 8-K filed September 25, 2008. | |
| P | The Proxy Statement for the Annual Meeting of Shareholders held on August 19, 1999 | |
| Q | The Proxy Statement for the Annual Meeting of Shareholders held on August 21, 2003 | |
| R | The Proxy Statement for the Annual Meeting of Shareholders held on August 17, 2006 | |
| S | The Form 8-K filed January 8, 2009 | |
| T | The Form 8-K filed September 22, 2009 | |
| U | The Form 8-K filed May 11, 2010 | |
| V | The Form 8-K filed August 16, 2010 | |
| W | The Form 8-K filed September 16, 2010 |
52
Table of Contents
Pursuant to the requirements of Section 13 or 15(d) of the Securities Exchange Act of 1934, the Registrant has duly caused this report to be signed on its behalf by the undersigned thereunto duly authorized.
| MULTI-COLOR CORPORATION | ||||||
| Dated: June 14, 2011 | By: | /s/ Nigel A. Vinecombe | ||||
| Nigel A. Vinecombe President and Chief Executive Officer (Principal Executive Officer) | ||||||
Pursuant to the requirements of the Securities Exchange Act of 1934, this report has been signed below by the following persons on behalf of the Registrant in the capacities and on the date indicated.
| Name |
Capacity |
Date | ||
| /s/ Nigel A. Vinecombe Nigel A. Vinecombe |
President and Chief Executive Officer (Principal Executive Officer) |
June 14, 2011 | ||
| /s/ Sharon E. Birkett Sharon E. Birkett |
Vice President, Chief Financial and Accounting Officer, Secretary (Principal Financial Officer) |
June 14, 2011 | ||
| /s/ Lorrence T. Kellar Lorrence T. Kellar |
Chairman of the Board of Directors | June 14, 2011 | ||
| /s/ Robert R. Buck Robert R. Buck |
Director | June 14, 2011 | ||
| /s/ Charles B. Connolly Charles B. Connolly |
Director | June 14, 2011 | ||
| /s/ Roger A. Keller Roger A. Keller |
Director | June 14, 2011 | ||
| /s/ Thomas M. Mohr Thomas M. Mohr |
Director | June 14, 2011 | ||
53