Attached files
| file | filename |
|---|---|
| EX-23 - EXHIBIT 23 - MODINE MANUFACTURING CO | ex23.htm |
| EX-21 - EXHIBIT 21 - MODINE MANUFACTURING CO | ex21.htm |
| EX-32.1 - EXHIBIT 32.1 - MODINE MANUFACTURING CO | ex32_1.htm |
| EX-31.1 - EXHIBIT 31.1 - MODINE MANUFACTURING CO | ex31_1.htm |
| EX-32.2 - EXHIBIT 32.2 - MODINE MANUFACTURING CO | ex32_2.htm |
| EX-31.2 - EXHIBIT 31.2 - MODINE MANUFACTURING CO | ex31_2.htm |
| EX-18.1 - EXHIBIT 18.1 - MODINE MANUFACTURING CO | ex18_1.htm |
| EX-10.17 - EXHIBIT 10.17 - MODINE MANUFACTURING CO | ex10_17.htm |
UNITED STATES
SECURITIES AND EXCHANGE COMMISSION
Washington, D. C. 20549
FORM 10-K
(Mark One)
þ ANNUAL REPORT PURSUANT TO SECTION 13 or 15(d) OF THE SECURITIES EXCHANGE ACT OF 1934
For the fiscal year ended March 31, 2011
or
o TRANSITION REPORT PURSUANT TO SECTION 13 or 15(d) OF THE SECURITIES EXCHANGE ACT OF 1934
For the transition period from ____________ to ____________
Commission file number 1-1373
MODINE MANUFACTURING COMPANY
(Exact name of registrant as specified in its charter)
|
WISCONSIN
(State or other jurisdiction of incorporation or organization)
|
39-0482000
(I.R.S. Employer Identification No.)
|
|
|
1500 DeKoven Avenue, Racine, Wisconsin
(Address of principal executive offices)
|
53403
(Zip Code)
|
Registrant's telephone number, including area code (262) 636-1200
Securities registered pursuant to Section 12(b) of the Act:
| Title of each class | Name of each exchange on which registered | |
| Common Stock, $0.625 par value | New York Stock Exchange |
Securities Registered pursuant to Section 12(g) of the Act: None
Indicate by check mark if the registrant is a well-known seasoned issuer, as defined in Rule 405 of the Securities Act.
Yes o No þ
Indicate by check mark if the registrant is not required to file reports pursuant to Section 13 or Section 15(d) of the Act.
Yes o No þ
Indicate by check mark whether the registrant (1) has filed all reports required to be filed by Section 13 or 15(d) of the Securities Exchange Act of 1934 during the preceding 12 months (or such shorter period that the registrant was required to file such reports), and (2) has been subject to such filing requirements for the past 90 days.
Yes þ No o
Indicate by check mark whether the registrant has submitted electronically and posted on its corporate Web site, if any, every Interactive Data File required to be submitted and posted pursuant to Rule 405 of Regulation S-T during the preceding 12 months (or for such shorter period that the registrant was required to submit and post such files).
Yes o No o
Indicate by check mark if disclosure of delinquent filers pursuant to Item 405 of Regulation S-K is not contained herein, and will not be contained, to the best of registrant's knowledge, in definitive proxy or information statements incorporated by reference in Part III of this Form 10-K or any amendment to this Form 10-K. þ
Indicate by check mark whether the registrant is a large accelerated filer, an accelerated filer, a non-accelerated filer, or a smaller reporting company. See definitions of “large accelerated filer,” “accelerated filer” and “smaller reporting company” in Rule 12b-2 of the Exchange Act. (Check one):
| Large Accelerated Filer o | Accelerated Filer þ |
| Non-accelerated Filer o (Do not check if a smaller reporting company) | Smaller reporting company o |
Indicate by check mark whether the registrant is a shell company (as defined in Rule 12b-2 of the Act). Yes o No þ
Approximately 64 percent of the outstanding shares are held by non-affiliates. The aggregate market value of these shares was approximately $604 million based on the market price of $12.97 per share on September 30, 2010, the last day of our most recently completed second fiscal quarter. Shares of common stock held by each executive officer and director and by each person known to beneficially own more than 5 percent of the outstanding common stock have been excluded in that such persons may be deemed to be affiliates. The determination of affiliate status is not necessarily a conclusive determination for other purposes.
The number of shares outstanding of the registrant's common stock, $0.625 par value, was 46,553,651 at June 3, 2011.
An Exhibit Index appears at pages 95-97 herein.
DOCUMENTS INCORPORATED BY REFERENCE
Portions of the following documents are incorporated by reference into the parts of this Form 10-K designated to the right of the document listed.
|
Incorporated Document
|
Location in Form 10-K
|
|
|
Proxy Statement for the 2011 Annual
Meeting of Shareholders
|
Part III of Form 10-K
(Items 10, 11, 12, 13, 14)
|
MODINE MANUFACTURING COMPANY - FORM 10-K
FOR THE YEAR ENDED MARCH 31, 2011
|
1
|
||||
|
ITEM 1.
|
1
|
|||
|
ITEM 1A.
|
9
|
|||
|
ITEM 1B.
|
13
|
|||
|
ITEM 2.
|
13
|
|||
|
ITEM 3.
|
14
|
|||
|
ITEM 4.
|
14
|
|||
|
14
|
||||
|
15
|
||||
|
ITEM 5.
|
15
|
|||
|
ITEM 6.
|
17
|
|||
|
ITEM 7.
|
18
|
|||
|
ITEM 7A.
|
39
|
|||
|
ITEM 8.
|
44
|
|||
|
ITEM 9.
|
89
|
|||
|
ITEM 9A.
|
89
|
|||
|
ITEM 9B.
|
91
|
|||
|
91
|
||||
|
ITEM 10.
|
91
|
|||
|
ITEM 11.
|
91
|
|||
|
ITEM 12.
|
91
|
|||
|
ITEM 13.
|
92
|
|||
|
ITEM 14.
|
92
|
|||
|
92
|
||||
|
ITEM 15.
|
92
|
|||
|
93
|
||||
|
94
|
||||
|
95
|
||||
(This page intentionally left blank.)
PART I
|
ITEM 1.
|
Modine Manufacturing Company (Modine or the Company) specializes in thermal management systems and components, bringing heating and cooling technology and solutions to diversified global markets. We are a leading global developer, manufacturer and marketer of heat exchangers and systems for use in on-highway and off-highway original equipment manufacturer (OEM) vehicular applications, and to a wide array of building, industrial, refrigeration and fuel cell markets. Product lines include radiators and radiator cores, vehicular air conditioning, oil coolers, charge air coolers, heat-transfer packages and modules, building heating, ventilating and air conditioning (HVAC) equipment and exhaust gas recirculation (EGR) coolers. Our primary customers across the globe are:
|
-
|
Truck, automobile, bus, and specialty vehicle OEMs;
|
|
-
|
Agricultural and construction OEMs;
|
|
-
|
Heating and cooling OEMs;
|
|
-
|
Construction contractors;
|
|
-
|
Wholesalers of plumbing and heating equipment; and
|
|
-
|
Fuel cell manufacturers.
|
We focus our development efforts on solutions that meet the pressing heat transfer needs of OEMs and other customers within the commercial vehicle, construction, agricultural and commercial HVAC industries and, more selectively, within the automotive industry. Our products and systems typically are aimed at solving complex heat transfer challenges requiring effective thermal management. The typical demands are for products and systems that are lighter weight, more compact, more efficient and more durable to meet ever increasing customer standards as they work to ensure compliance with increasingly stringent global emissions, fuel economy and energy efficiency requirements. Our Company’s heritage provides a depth and breadth of expertise in thermal management which combined with our global manufacturing presence, standardized processes, and state-of-the-art technical centers and wind tunnels, enables us to rapidly bring customized solutions to customers at the best value.
History
Modine was incorporated under the laws of the State of Wisconsin on June 23, 1916 by its founder, Arthur B. Modine. Mr. Modine’s “Spirex” radiators became standard equipment on the famous Ford Motor Company Model T. When he died at the age of 95, A.B. Modine had been granted a total of 120 U.S. patents for heat transfer innovations. The standard of innovation exemplified by A.B. Modine remains the cornerstone of Modine today.
Terms; Year References
When we use the terms “Modine,” “we,” “us,” the “Company,” or “our” in this report, unless the context requires otherwise, we are referring to Modine Manufacturing Company and its subsidiaries. Our fiscal year ends on March 31. All references to a particular year mean the fiscal year ended March 31 of that year, unless indicated otherwise.
Business Strategy and Results
Modine focuses on thermal management leadership and highly engineered product and service innovations for diversified, global markets and customers. We are committed to enhancing our presence around the world and serving our customers where they are located. We create value by focusing on customer partnerships and providing innovative solutions for our customers' thermal problems.
Modine’s strategy for improved profitability is grounded in diversifying our markets and customer base, differentiating our products and services, technically and commercially, and partnering with customers on global OEM platforms. Modine’s top five customers are in three different markets – automotive, truck and off-highway – and its ten largest customers accounted for approximately 58 percent of the Company’s fiscal 2011 sales, compared to 57 percent in fiscal 2010. In fiscal 2011, 61 percent of total revenues were generated from sales to customers outside of the U.S., 56 percent of which were generated by Modine’s international operations and 5 percent of which were generated by exports from the U.S. In fiscal 2010, 60 percent of total revenues were generated from sales to customers outside of the U.S., with 56 percent generated by Modine’s international operations and 4 percent generated by exports from the U.S.
During fiscal 2011, the Company reported revenues from continuing operations of $1.45 billion, a 25 percent increase from $1.16 billion in fiscal 2010. The Company’s end markets are showing strong improvement from the deep recession experienced during 2009 and 2010. This improvement is seen across most of Modine’s end markets, including the commercial vehicle, off-highway and automotive markets. The commercial HVAC markets are showing early signs of modest improvement, as these markets generally trend with commercial construction build rates, which have not yet recovered in 2011 from the recent recession. While the Company’s business volumes improved significantly in fiscal 2011, the volumes remained approximately 10 percent below pre-recessionary annual sales of $1.6 billion. Over the last several years, the Company has implemented a number of cost and operational efficiency measures designed to improve our longer-term competitiveness, including the realignment of our manufacturing facilities, portfolio rationalization, capital allocation and selling, general and administrative (SG&A) cost containment. As volumes begin to recover, the benefits of these actions can be seen in the Company’s gross margin, which improved from 14.8 percent in fiscal 2010 to 16.0 percent in fiscal 2011. In addition, SG&A as a percentage of sales has declined from 13.7 percent in fiscal 2010 to 12.8 percent in fiscal 2011. With these improvements, the Company reported $42.8 million of earnings from operations in fiscal 2011, which significantly exceeds the earnings from operations of $7.0 million reported in fiscal 2010.
During the second quarter of fiscal 2011, we entered into a four-year, $145.0 million Amended and Restated Credit Agreement, which amended and restated the Company’s then existing revolving credit facility. On the same date, the Company issued $125.0 million of 6.83 percent Secured Series A Senior Notes maturing on August 12, 2020 (the “2020 Notes”). The proceeds from the 2020 Notes were used to repay our then outstanding senior notes. These actions extended the maturity of our outstanding debt obligations, providing the Company a long-term source of financing at reduced interest rates. The Company recognized a loss of $19.9 million on early extinguishment of the debt and write-off of unamortized costs as a component of interest expense during the fiscal year.
The improved sales volumes and lower cost structure of the Company, partially offset by the loss on debt extinguishment, resulted in earnings from continuing operations of $9.2 million, or $0.20 per fully diluted share during fiscal 2011. This represents a significant improvement from the loss from continuing operations of $19.7 million, or $0.50 per fully diluted share reported during fiscal 2010, and also represents the first time the Company has reported earnings since fiscal 2007.
As the Company looks forward into fiscal 2012, it anticipates a continued recovery in sales volumes, and expects the trend of improving profitability to continue.
Discontinued Operations
During fiscal 2009, the Company announced the intended divestiture of its South Korean-based HVAC business and presented it as held for sale and as a discontinued operation in the consolidated financial statements for all periods presented. The South Korean-based HVAC business was sold on December 23, 2009 for net cash proceeds of $10.5 million, resulting in a loss on sale of $0.6 million.
Reported net earnings (loss) for fiscal 2011, 2010 and 2009 was $6.2 million, ($28.7) million and ($109.1) million, respectively, or earnings (loss) per fully diluted share of $0.13, ($0.73) and ($3.40), respectively.
Revision to Prior Period Financial Statements
The Company revised its fiscal 2009 and fiscal 2010 results in this report for errors identified relating to prior periods. See Note 1 of the Notes to Consolidated Financial Statements for further discussion of the revision.
Products
The Company offers a broad line of products that can be categorized generally as a percentage of net sales as follows:
|
Fiscal 2011
|
Fiscal 2010
|
|||||||
|
Modules/Packages*
|
28 | % | 32 | % | ||||
|
Oil Coolers
|
16 | % | 14 | % | ||||
|
Radiators
|
13 | % | 13 | % | ||||
|
Building HVAC
|
10 | % | 12 | % | ||||
|
Charge-Air Coolers
|
10 | % | 8 | % | ||||
|
Miscellaneous
|
10 | % | 10 | % | ||||
|
Exhaust Gas Recirculation ("EGR") Coolers
|
9 | % | 7 | % | ||||
|
Vehicular Air Conditioning Parts
|
4 | % | 4 | % | ||||
*Typically include components such as radiators, oil coolers, charge air coolers, condensers and other purchased components.
Competitive Position
We compete with several manufacturers of heat transfer specific HVAC products, some of which are divisions of larger companies. The markets for the Company's products are increasingly competitive and have changed significantly in the past few years. The Company's traditional OEM customers in the U.S. and Europe are faced with dramatically increased international competition and have expanded their worldwide sourcing of parts to compete more effectively with lower cost imports and to expand their global footprint to complete in local markets. Some of these market changes have caused the Company to experience competition from suppliers in other parts of the world that enjoy economic advantages such as lower labor costs, lower healthcare costs, and lower tax rates. In addition, the Company has expanded its own geographic footprint in part to allow us to serve our original equipment customers more flexibly across the globe. Our customers also continue to ask the Company, as well as their other primary suppliers, to participate in research and development (R&D), design, and validation responsibilities. We expect this combined work effort to result in stronger customer relationships and more partnership opportunities for the Company.
Business Segments
The Company has assigned specific businesses to a segment based principally on defined markets and geographic locations. Each Modine segment is managed at the regional vice president or managing director level and has separate financial results reviewed by its chief operating decision makers. These results are used by management in evaluating the performance of each business segment, and in making decisions on the allocation of resources among our various businesses. Our chief operating decision makers evaluate segment performance with an emphasis on gross margin, and secondarily based on operating income of each segment, which includes certain allocations of Corporate SG&A expenses. Financial information related to the Company’s segments is included in Note 24 of the Notes to Consolidated Financial Statements.
Original Equipment – Asia, Europe and North America Segments and South America Segment
The continuing globalization of the Company's OEM customer base has led to the necessity of viewing Modine’s strategic approach, product offerings and competitors on a global basis. This trend offers significant opportunities for Modine with its market positioning, including presence in key global markets (U.S., Europe, China, India and Brazil) and a global product-based organization with expertise to solve technical challenges. Modine is recognized as having strong technical support, product breadth and the ability to support global standard designs for its customers.
The Company's main competitors, Behr GmbH & Co. K.G., Dana Corporation, Visteon Corporation, Denso Corporation, Delphi Corporation, T.Rad Co. Ltd., Honeywell Thermal Div., Valeo SA and TitanX (former Valeo Heavy Duty group now owned by EQT), have a worldwide presence. Increasingly, the Company faces competition as these competitors expand their product offerings and manufacturing footprints through expansion into low cost countries and low cost country sourcing initiatives.
Specifically, the Original Equipment – Asia, Europe and North America segments and South America segment serve the following markets:
Commercial Vehicle
Products – Powertrain cooling (“PTC”) (engine cooling modules, radiators, charge-air-coolers, condensers, fan shrouds, and surge tanks); on-engine cooling (exhaust gas recirculation (“EGR”) coolers, engine oil coolers, fuel coolers, charge-air-coolers and intake air coolers); oil coolers (transmission oil coolers and power steering coolers); and fuel coolers
Customers – Commercial, medium and heavy duty truck and engine manufacturers; bus and specialty vehicle manufacturers
Market Overview – We continued to see a strengthening market for commercial vehicles, especially within Europe and the U.S., as these markets are recovering from the recession experienced during fiscal 2009 and 2010. Heavy-duty trucks are recovering at the fastest pace, while medium-duty trucks are recovering more modestly.
Other trends influencing the market include the consolidation of major customers into global entities emphasizing the development of global vehicle platforms in order to leverage and reduce development costs and distribution methods. OEMs expect greater supplier support at lower prices and seek high technology/low cost solutions for their thermal management needs. In general, this drives a deflationary price environment.
Emissions regulations and timelines are driving the advancement of product development worldwide and creating demand for incremental thermal transfer products. Future emission law changes are scheduled for January 1, 2012 in Brazil and January 1, 2013 in Europe (“Euro 6”). Proposed fuel economy standards in the U.S. are driving the development of new products and product platforms, such as those relating to waste heat recovery.
Primary Competitors – Behr GmbH & Co. K.G.; TitanX, Bergstrom, Inc.; T.Rad Co. Ltd.; Honeywell Thermal Div.; Dayco Ensa SA
Off-Highway
Products – Powertrain cooling (engine cooling modules, radiators, condensers, charge-air-coolers, fuel coolers); auxiliary coolers (power steering coolers and transmission oil coolers); and on-engine cooling (EGR coolers, engine oil coolers, fuel coolers, charge-air-coolers and intake air coolers)
Customers – Construction and agricultural equipment, engine manufacturers and industrial manufacturers of material handling equipment, generator sets and compressors
Market overview – The agricultural market is strengthening with rising crop prices, especially corn and wheat. Mining equipment markets are showing growth as commodity prices continue to remain strong. Construction markets are showing modest improvement consistent with the global economic recovery from the recessionary environment experienced over the past several years.
Overall market trends include a migration toward global machine platforms, driving the multi-region assembly of a common design platform with low cost country sourcing for certain components. Additionally, fixed emissions regulations and timelines are driving the advancement of product development, including the current adoption of Tier IV emissions requirements in the U.S. construction markets. OEMs are rapidly expanding into Asia and prefer suppliers with local production capabilities. Modine is recognized as having strong technical support, product breadth, and the ability to support global standard designs of its customers.
Primary Competitors – Adams Thermal Systems Inc.; AKG; Delphi Corporation; Denso Corporation; Honeywell Inc.; Zhejiang Yinlun Machinery Co., Ltd.; ThermaSys Corp.; Doowon; Valeo SA and Donghwan
Automotive
Products – Powertrain cooling (engine cooling modules, radiators, condensers, charge-air-coolers, auxiliary cooling (power steering coolers and transmission oil coolers), component assemblies, radiators for special applications) and on-engine cooling (EGR coolers, engine oil coolers, fuel coolers, charge-air-coolers and intake air coolers)
Customers – Automobile, light truck and engine manufacturers
Market Overview – Modine supports the automotive marketplace with components where complementary Modine technology can be applied to an automotive environment at reasonable returns. Modine is in the process of deemphasizing our focus on automotive modules due to the cost and risk of enormous capital outlays to maintain a scale cost position, the inherent over-capacity in this market segment, and the anticipation of better returns in other markets.
Primary Competitors – Behr GmbH & Co. K.G.; Dana Corporation; Delphi Corporation; Denso Corporation; T.Rad Co. Ltd.; and Visteon Corporation
Commercial Products
Products – Unit heaters (gas-fired, hydronic, electric and oil-fired); duct furnaces (indoor and outdoor); infrared units (high intensity and low intensity); hydronic products (commercial fin-tube radiation, cabinet unit heaters, and convectors); roof mounted direct- and indirect-fired makeup air units; unit ventilators; close control units for precise temperature and humidity control applications; chillers; ceiling cassettes; condensing units and coils for heating, refrigeration, air conditioning and vehicular applications
Customers – Heating and cooling equipment manufacturers; construction contractors; wholesalers of plumbing and heating equipment; installers; and end users in a variety of commercial and industrial applications, including banking and finance, education, transportation, telecommunications, entertainment arenas, pharmaceuticals, electronics, hospitals, defense, petrochemicals, and food and beverage processing; commercial and residential HVAC equipment manufacturers; refrigeration products manufacturers.
Market Overview – Commercial Products has strong sales in gas unit heaters, data center air conditioning products, coil products and room heating and cooling units. Efficiency legislation, lower noise requirements, growth in data centers, and higher energy costs are driving opportunities in these market areas.
Primary Competitors – Lennox International Inc. (ADP); Luvata (Heatcraft / ECO); Thomas & Betts Corp. (Reznor); Mestek Inc. (Sterling); Emerson Electric Company (Liebert Hiross); United Technologies Corporation (Carrier); Johnson Controls, Inc. (York); and Daikin (McQuay International)
Geographical Areas
We maintain administrative organizations in three regions - North America, Europe and Asia - to facilitate financial and statutory reporting and tax compliance on a worldwide basis and to support the business units. Our products are manufactured in the following countries:
|
North America
|
Europe
|
South America
|
Africa
|
Asia/Pacific
|
|
Mexico
United States
|
Austria
Germany
Hungary
Italy
The Netherlands
United Kingdom
|
Brazil
|
South Africa
|
China
India
Japan
South Korea
|
Our non-U.S. subsidiaries and affiliates manufacture and sell a number of vehicular and industrial products similar to those produced in the U.S. In addition to normal business risks, operations outside the U.S. are subject to other risks such as changing political, economic and social environments, changing governmental laws and regulations, currency revaluations and volatility, and market fluctuations.
Exports
The Company exports from North America to foreign countries and receives royalties from foreign licensees. Export sales as a percentage of net sales were 5 percent for fiscal 2011, 4 percent for fiscal 2010 and 5 percent for fiscal 2009. Royalties from foreign licenses were $1.6 million, $3.3 million and $4.1 million for fiscal 2011, 2010 and 2009, respectively.
Modine believes its international presence has positioned the Company to share profitably in the anticipated long-term growth of the global vehicular, commercial and industrial markets. Modine is committed to increasing its involvement and investment in international markets in the years ahead.
Foreign and Domestic Operations
Financial information relating to the Company's foreign and domestic operations is included in Note 24 of the Notes to Consolidated Financial Statements.
Customer Dependence
Ten customers accounted for approximately 58 percent of the Company's sales in fiscal 2011. These customers, listed alphabetically, were: BMW; Caterpillar Inc.; Daimler AG; Deere & Company; Denso Corporation; Fiat; MAN Truck & Bus; Navistar; Volkswagen AG and Volvo Group. In fiscal 2011, 2010 and 2009, BMW was the only customer that accounted for ten percent or more of the Company’s sales. Generally, goods are supplied to these customers on the basis of individual purchase orders received from them. When it is in the customer's and the Company's best interests, the Company utilizes long-term sales agreements with customers to minimize investment risks and also to provide the customer with a proven source of competitively priced products. These contracts are on average three years in duration and may include built-in pricing adjustments. In certain cases, our customers have requested additional pricing adjustments beyond those included in these long-term contracts.
Backlog of Orders
The Company's operating units maintain their own inventories and production schedules. Current production capacity is capable of handling the sales volumes expected in fiscal 2012.
Raw Materials
Aluminum, nickel, brass and steel, all essential to the business, are purchased from several domestic and foreign producers. In general, the Company does not rely on any one supplier for these materials which are, for the most part, available from numerous sources in quantities required by the Company. The supply of fabricated copper products is highly concentrated between two global suppliers. All purchases of fabricated copper are currently from one of these suppliers. The Company normally does not experience material shortages and believes that our suppliers’ production of these materials will be adequate throughout the next fiscal year. In addition, when possible, Modine has made material pass-through arrangements with its key customers. Under these arrangements, the Company can pass material cost increases and decreases to its customers. However, where these pass-through arrangements are utilized, there is a time lag between the time of the material increase or decrease and the time of the pass-through. This time lag can range between three months and one year. To further mitigate the Company’s exposure to fluctuating material prices, the Company enters into forward contracts from time to time to hedge a portion of our forecasted aluminum and copper purchases. At March 31, 2011, the Company had forward contracts outstanding that hedge less than 50 percent of North American aluminum requirements anticipated to be purchased over the next 24 months.
Patents
The Company owns outright or has a number of licenses to produce products under patents. These patents and licenses obtained over a period of years expire at various times. Because the Company has many product lines, it believes that its business as a whole is not materially dependent upon any particular patent or license, or any particular group of patents or licenses. Modine considers each of its patents, trademarks and licenses to be of value and aggressively defends its rights throughout the world against infringement. Modine has been granted and/or acquired more than 2,000 patents worldwide over the life of the Company.
Research and Development
The Company remains committed to its vision of creating value through technology. Company-sponsored R&D activities support the development of new products, processes and services, and the improvement of existing products, processes, and services. R&D expenditures were $67.0 million, $56.9 million and $73.2 million in fiscal 2011, 2010 and 2009, respectively. Over the last three years, R&D expenditures have averaged 5 percent of sales. This level of investment reflects the Company’s continued commitment to R&D in an ever-changing market. Our current R&D is focused primarily on company-sponsored development in the areas of powertrain cooling, engine products and commercial HVAC products. The Company is involved with several industry-, university- and government-sponsored research organizations that conduct research and provide data on technical topics deemed to be of interest to the Company for practical applications in the markets the Company serves. The research developed as a result is generally shared among the member organizations.
To achieve efficiencies and lower developmental costs, Modine's research and engineering groups work closely with our customers on special projects and systems designs. In addition, the Company is participating in U.S. government-funded projects, including dual purpose programs in which the Company retains commercial intellectual property rights in technology it develops for the government, such as the design and demonstration of waste heat recovery systems and research and testing directed at the enhancement of EGR cooler performance.
Quality Improvement
Through Modine’s global Quality Management System (“QMS”), the manufacturing facilities in our Original Equipment – Asia, Europe and North America segments and our South America segment are registered to ISO 9001:2008 or ISO/TS 16949:2009 standards, helping to ensure that our customers receive high quality products and services from every Modine facility. While customer expectations for performance, quality and service have risen continuously over the past years, our QMS has enabled Modine to drive improvements in quality performance and enabled the ongoing delivery of products and services that meet or exceed customer expectations.
The global QMS operates in the context of the Modine Operating System (“MOS”), which focuses on leadership and rapid continuous improvement. Sustainable continuous improvement is driven throughout all functional areas and operating regions of the organization by the principles, processes and behaviors that are core to these systems.
Environmental, Health and Safety Matters
Modine is committed to preventing pollution, eliminating waste and reducing environmental risks. The Company’s facilities maintained Environmental Management System (“EMS”) certification to the international ISO14001 standard through independent third-party audits. All Modine locations have established specific environmental improvement targets and objectives for the coming fiscal year.
In fiscal 2011, Modine recorded a moderate year-over-year increase in greenhouse gas emissions resulting from its on-site use of natural gas and propane, and from its use of electricity generated by off-site sources. This unadjusted (non-normalized) increase can be attributed to increased manufacturing volumes coinciding with the improvement of the global economy. In fiscal 2012, Modine will be establishing a global carbon reduction objective that will target greenhouse gas emissions. This objective will not only benefit the environment, but will also optimize energy use and lower operating costs.
Air emissions, hazardous wastes, and solid wastes increased moderately in fiscal 2011, as did water consumption. A significant portion of these increases, which are being reported as non-normalized values, are associated with increased manufacturing volumes. As in previous years, Modine continues to systematically identify opportunities and implement measures to reduce waste and conserve natural resources through its EMS.
Modine's commitment to environmental stewardship is reflected in its reporting of chemical releases as monitored by the United States Environmental Protection Agency's Toxic Chemical Release Inventory program. The Company's U.S. locations decreased their reported chemical releases by 15 percent from calendar year 2008 to 2009, with a 92 percent decline from 1999 to 2009.
Modine’s product portfolio reflects its sense of environmental responsibility. The Company continues its development and refinement of environmentally friendly product lines including oil, fuel, and EGR coolers for diesel applications, diesel truck idle-off technologies, and OrigamiTM ultra-thin heat exchangers. These products provide increased fuel economies and reduce harmful gas emissions. Modine’s Commercial Products segment offerings, including the Airedale Schoolmate HVAC products, the Effinity93, the most efficient gas-fired unit heater in North America, and the new Commercial Packaged Ventilation System with Conservicore technology providing up to 93% efficiency, are helping commercial, industrial and residential users achieve high energy efficiencies and reduced utility costs.
An obligation for remedial activities may arise at Modine-owned facilities due to past practices or as a result of a property purchase or sale. These expenditures most often relate to sites where past operations followed practices that were considered acceptable under then-existing regulations, but now require investigative and/or remedial work to ensure appropriate environmental protection or where the Company is a successor to the obligations of prior owners and current laws and regulations require investigative and/or remedial work to ensure sufficient environmental compliance. Two of the Company's currently owned manufacturing facilities and one formerly owned property have been identified as requiring soil and/or groundwater remediation. Environmental liabilities recorded as of March 31, 2011, 2010, and 2009 to cover the investigative work and remediation for sites in the United States, Brazil, and The Netherlands were $7.4 million, $3.0 million, and $2.0 million, respectively.
Modine continued its strong safety performance in fiscal 2011 with a global Recordable Incident Rate (“RIR”) of 2.04 which was just slightly above the 1.99 rate recorded in fiscal 2010 (for facilities with continuing operations). Over the past several years, Modine has consistently out-performed private industry RIR average, which by comparison was 3.60 in 2009.
Modine will focus on the human element of safety by introducing a global behavior-based safety program in fiscal 2012. Since nearly all injuries within the company are related to at-risk actions, and not equipment guarding or other physical issues, Modine will be placing an increased focus on removing those at-risk behaviors from the workplace. Behavior-based safety will be introduced globally as a long-term component of the company’s safety culture. It will compliment numerous preexisting safety policies and practices, and is expected to be a significant factor in driving continuous improvement in this area.
Employees
The Company employed 6,497 persons as of March 31, 2011.
Seasonal Nature of Business
The Company’s operating performance generally is not subject to a significant degree of seasonality as sales to OEMs are dependent upon the demand for new vehicles. Our Commercial Products segment does experience a degree of seasonality since the demand for HVAC products can be affected by heating and cooling seasons, weather patterns, construction, and other factors. Generally, sales volume within the Commercial Products segment is stronger in the second and third fiscal quarters corresponding with demand for heating products.
Working Capital Items
The Company manufactures products for the original equipment segments on an as-ordered basis, which makes large inventories of such products unnecessary. In addition, the Company does not experience a significant amount of returned products. In the Commercial Products segment, the Company maintains varying levels of finished goods inventory due to certain sales programs. In these areas, the industry and the Company generally make use of extended terms of payment for customers on a limited basis.
Available Information
We make available free of charge through our website, www.modine.com (Investor Relations link), our annual reports on Form 10-K, quarterly reports on Form 10-Q, current reports on Form 8-K, proxy statements, other Securities Exchange Act reports and all amendments to those reports as soon as reasonably practicable after such material is electronically filed with, or furnished to, the Securities and Exchange Commission (“SEC”). Our reports are also available free of charge on the SEC’s website, www.sec.gov. Also available free of charge on our website (Investor Relations link) are the following corporate governance documents:
|
-
|
Code of Ethics and Business Conduct, which is applicable to all Modine employees, including the principal executive officer, the principal financial officer, the principal accounting officer and directors;
|
|
-
|
Corporate Governance Guidelines; |
|
-
|
Audit Committee Charter;
|
|
-
|
Officer Nomination and Compensation Committee Charter;
|
|
-
|
Corporate Governance and Nominating Committee Charter; and
|
|
-
|
Technology Committee Charter.
|
All of the reports and corporate governance documents referred to above and other materials relating to corporate governance may also be obtained without charge by contacting Investor Relations, Modine Manufacturing Company, 1500 DeKoven Avenue, Racine, Wisconsin 53403-2552. We do not intend to incorporate our internet website and the information contained therein or incorporated therein into this annual report on Form 10-K.
|
ITEM 1A.
|
Our business involves risks. The following information about these risks should be considered carefully together with the other information contained in this report. The risks described below are not the only risks we face. Additional risks not currently known or deemed immaterial as of the date of this report may also result in adverse results for our business.
Operational Risks
Compliance with Governmental Regulations
We are not in compliance with specific trade laws and regulations relating to shipments to and from our facilities in Nuevo Laredo, Mexico and Laredo, Texas and, as a result, are likely to be subject to duties and fines.
As discussed in Note 25 of the Notes to Consolidated Financial Statements, the Company has not complied with trade laws and regulations over the past several years. Based upon our investigation, we currently estimate that the unpaid duties and fines resulting from the failure to comply with applicable trade laws and regulations at our facilities in Nuevo Laredo, Mexico and Laredo, Texas to be approximately $4.5 million. We cannot determine, with certainty, whether we will be subject to duties and fines in excess of our current, good faith estimate. Significantly higher liabilities in connection with these compliance issues than we currently estimate may have a material adverse effect on our results of operations and financial condition.
Internal Control Deficiencies
Management has identified two material weaknesses in the Company’s internal control over financial reporting that, if not remediated, could result in additional financial reporting errors.
Management identified two material weaknesses in our internal control over financial reporting during fiscal 2011. Effective internal control is necessary for appropriate financial reporting. As disclosed in Item 9A. “Control and Procedures,” in this Annual Report on Form 10-K, management identified a material weakness in interim inventory management in the Original Equipment – North America segment and the Nuevo Laredo, Mexico facility in the Commercial Products segment as well as a material weakness relating to trade compliance deficiencies at the Nuevo Laredo, Mexico and Laredo, Texas facilities. Such material weaknesses resulted in the revision of prior period financial statements as disclosed in Note 1 of the Notes to Consolidated Financial Statements. However, a risk exists that additional financial reporting errors could occur if we fail to remediate these material weaknesses or if we experience other internal control deficiencies. If that were to happen it could have a material adverse effect on the Company’s business, financial condition and results of operations.
Challenges of Product Launches
We are in the midst of launching a significant number of new programs at our facilities across the world and the success of these launches is critical to our business.
We design technologically advanced products and the processes required to bring these products into production can be difficult and complex. The Company commits significant time and financial resources to ensure the successful launch of new products and programs. The difficulty of managing the product launch process is significantly higher when we are launching so many new products and programs in each segment of the Company. Due to this launch activity, we need to appropriately deploy our operational and administrative resources to take advantage of this increase in our business. If we do not successfully launch the products and programs, we may lose market share and damage relationships with our customers, which could negatively affect our business.
Environmental
The Company may incur significant costs in the remediation of environmental contamination at its facility in Brazil.
We are working with our environmental consultants to determine the appropriate means of remediating groundwater contamination at our facility in Brazil that has, over a period of years, migrated to neighboring properties. Remediation of this contamination could result in potentially significant expenditures. See Note 25 of the Notes to Consolidated Financial Statements for further discussion.
Our business is subject to costs associated with environmental, health and safety regulations.
Our operations are subject to various federal, state, local and foreign laws and regulations governing, among other things, emissions to air, discharge to waters and the generation, handling, storage, transportation, treatment and disposal of waste and other materials. The operation of our manufacturing facilities entails risks in these areas, however, and there can be no assurance that we will not incur material costs or liabilities relating to such matters. In addition, potentially significant expenditures could be required in order to comply with evolving environmental, health and safety laws, regulations or other pertinent requirements that may be adopted or imposed in the future.
We are also expanding our business in China and India where environmental, health and safety regulations are in their infancy. As a result, we cannot determine how these laws will be implemented and the impact of such regulation on the Company.
Market Risks
Customer and Supplier Matters
Our OEM business, which accounts for approximately 85 percent of our business currently, is dependent upon the health of the markets we serve.
While we are experiencing increased demand for our products, we continue to be highly susceptible to downward trends in the markets we serve because our customers’ sales and production levels are affected by general economic conditions, including access to credit, the price of fuel, employment levels and trends, interest rates, labor relations issues, regulatory requirements, trade agreements and other factors. Any significant decline in production levels for current and future customers could result in long-lived asset impairment charges and would reduce our sales and adversely impact our results of operations and financial condition.
If we were to lose business with a major OEM customer, our revenue and profitability could be adversely affected.
Deterioration of a business relationship with a major OEM customer could cause the Company’s revenue and profitability to suffer. We principally compete for new business both at the beginning of the development of new models and upon the redesign of existing models by our major customers. New model development generally begins two to five years prior to the marketing of such models to the public. The failure to obtain new business on new models or to retain or increase business on redesigned existing models could adversely affect our business and financial results. In addition, as a result of the relatively long lead times required for many of our complex components, it may be difficult in the short-term for us to obtain new sales to replace any unexpected decline in the sales of existing products. We may incur significant expense in preparing to meet anticipated customer requirements that may not be recovered. The loss of a major OEM customer, the loss of business with respect to one or more of the vehicle models that use our products, or a significant decline in the production levels of such vehicles could have an adverse effect on our business, results of operations and financial condition.
Our OEM customers continually seek price reductions from us. These price reductions adversely affect our results of operations and financial condition.
A challenge that we and other suppliers to vehicular OEMs face is continued price reduction pressure from our customers. Downward pricing pressure has been a characteristic of the automotive industry and is migrating to all of our vehicular OEM markets. Virtually all such OEMs impose aggressive price reduction initiatives upon their suppliers, and we expect such actions to continue in the future. In the face of lower prices to customers, the Company must reduce its operating costs in order to maintain profitability. The Company has taken and continues to take steps to reduce its operating costs to offset customer price reductions; however, price reductions are adversely affecting our profit margins and are expected to do so in the future. If the Company is unable to offset customer price reductions through improved operating efficiencies, new manufacturing processes, sourcing alternatives, technology enhancements and other cost reduction initiatives, or if we are unable to avoid price reductions from our customers, our results of operations and financial condition could be adversely affected.
Rising costs of materials (including steel, copper, aluminum, nickel, other raw materials and energy) puts significant pressure on our results of operations.
The rising cost of materials has a significant effect on our results of operations, and on those of others in our industry. We have sought to alleviate the impact of increasing costs by including materials pass-through provisions in our contracts with our customers. Under these arrangements, the Company can pass material cost increases and decreases to its customers. However, where these pass-through arrangements are utilized, there is a time lag between the time of the material increase or decrease and the time of the pass-through. This time lag can range between three months and one year. To further mitigate the Company’s exposure to fluctuating material prices, we enter into forward contracts from time to time to hedge a portion of our forecasted aluminum and copper purchases. However, the hedges may only partially offset increases in material costs, and significant increases could have an adverse effect on our results of operations.
The continual pressure to absorb costs adversely affects our profitability.
We continue to be pressured to absorb costs related to product design, engineering and tooling, as well as other items previously paid for directly by OEMs. OEM customers request that we pay for design, engineering and tooling costs that are incurred prior to the start of production and recover these costs through amortization in the piece price of the applicable component. Some of these costs cannot be capitalized, which adversely affects our profitability until the programs for which they have been incurred are launched. If a given program is not launched or is launched with significantly lower volumes than planned, we may not be able to recover the design, engineering and tooling costs from our customers, further adversely affecting our profitability.
The Company could be adversely affected if we experience shortages of components or materials from our suppliers.
In an effort to manage and reduce the cost of purchased goods and services, the Company, like many suppliers and customers, has been consolidating its supply base. As a result, the Company is dependent upon limited sources of supply for certain components used in the manufacture of our products. The Company selects its suppliers based on total value (including price, delivery and quality), taking into consideration their production capacities, financial condition and ability to meet demand. In some cases, it can take several months or longer to find a supplier due to qualification requirements. However, there can be no assurance that strong demand, capacity limitations or other problems experienced by the Company’s suppliers will not result in occasional shortages or delays in their supply of product to us. If we were to experience a significant or prolonged shortage of critical components or materials from any of our suppliers and could not procure the components or materials from other sources, the Company would be unable to meet its production schedules for some of its key products and would miss product delivery dates, which would adversely affect our sales, margins and customer relations.
Multiple suppliers in the vehicular industry have filed for bankruptcy. The bankruptcy or insolvency of other vehicular suppliers or work stoppages or slowdowns due to labor unrest that may affect these suppliers or our OEM customers could lead to supply disruptions that could have an adverse effect on our business. Even if such suppliers are not in bankruptcy, many are facing severe financial challenges. As a result, they could impose restrictive payment terms or cease to supply us, which would have a negative impact on our ability to finance our operations. Because of the expense of dual sourcing, many of our suppliers are single sourced and hold the tooling for the products we purchase from them. The process to qualify a new supplier and produce tooling is expensive, time consuming and dependent upon customer approval and qualification.
Global Nature of the Business
As a global company, we are subject to currency fluctuations, and any significant movement between the U.S. dollar, the euro, and Brazilian real, in particular, could have an adverse effect on our profitability.
Although our financial results are reported in U.S. dollars, a significant portion of our sales and operating costs are realized in euros, the Brazilian real and other currencies. Our profitability is affected by movements of the U.S. dollar against the euro, the real and other currencies in which we generate revenues and incur expenses. To the extent that we are unable to match revenues received in foreign currencies with costs paid in the same currency, exchange rate fluctuations in any such currency could have an adverse effect on our financial results. During times of a strengthening U.S. dollar, our reported sales and earnings from our international operations will be reduced because the applicable local currency will be translated into fewer U.S. dollars. Significant long-term fluctuations in relative currency values, in particular a significant change in the relative values of the U.S. dollar, euro or real, could have an adverse effect on our profitability and financial condition.
Reliance Upon Technology Advantage
If we cannot differentiate ourselves from our competitors with our technology, our products may become commodities and our sales and earnings would be adversely affected.
If we were to compete only on cost, our sales would decline substantially. If we cannot differentiate ourselves from our competitors with our technology, our products may become commodities and our sales and earnings would be adversely affected.
Developments or assertions by or against the Company relating to intellectual property rights could adversely affect our business.
The Company owns significant intellectual property, including a large number of patents, trademarks, copyrights and trade secrets, and is involved in numerous licensing arrangements. The Company’s intellectual property plays an important role in maintaining our competitive position in a number of the markets we serve. Developments or assertions by or against the Company relating to intellectual property rights could adversely affect the business. Significant technological developments by others also could adversely affect our business and results of operations.
We may incur material losses and costs as a result of product liability and warranty claims and litigation.
We are exposed to warranty and product liability claims in the event that our products fail to perform as expected, and we may be required to participate in a recall of such products. Many of our OEM customers have extended warranty protection for their vehicles putting pressure on the supply base to improve quality systems. Historically, we have experienced relatively low warranty charges from our customers due to our contractual arrangements and improvements in the quality, reliability and durability performance of our products. If our customers demand higher warranty-related cost recoveries, or if our products fail to perform as expected, it could have a material adverse impact on our results of operations or financial condition. We are also involved in various legal proceedings from time to time incidental to our business and, if any such proceeding has a negative result, it could have a material adverse effect on our business and results of operations.
Financial Risks
Liquidity and Access to Cash
Recent market trends may require additional funding for our pension plans.
The Company has several non-contributory defined benefit pension plans that cover most of its domestic employees hired on or before December 31, 2003. The funding policy for these plans is to contribute annually, at a minimum, the amount necessary on an actuarial basis to provide for benefits in accordance with applicable laws and regulations. The domestic plans have an unfunded balance of $45.1 million. During fiscal 2012, we anticipate making a funding contribution of $10.7 million related to these domestic plans. If significant additional funding contributions are necessary, this could have an adverse impact on the Company’s liquidity position.
|
ITEM 1B.
|
None.
|
ITEM 2.
|
We operate manufacturing facilities in the United States and certain foreign countries. The Company's world headquarters, including general offices, and laboratory, experimental and tooling facilities are maintained in Racine, Wisconsin. Additional technical support functions are located in Bonlanden, Germany.
The following table sets forth information regarding our principal properties by business segment as of March 31, 2011. Properties with less than 20,000 square feet of building space have been omitted from this table.
|
Location of Facility
|
Building Space and Primary Use
|
Owned or Leased
|
|
South America Segment
|
||
|
Sao Paulo, Brazil
|
341,100 sq. ft./manufacturing
|
Owned
|
|
Original Equipment – North America Segment
|
||
|
Lawrenceburg, TN
|
353,800 sq. ft./manufacturing
|
143,800 Owned;
210,000 Leased
|
|
Harrodsburg, KY
|
253,000 sq. ft./manufacturing (Held for Sale)
|
Owned
|
|
Jefferson City, MO
|
238,000 sq. ft./manufacturing
|
162,000 Owned;
76,000 Leased
|
|
Washington, IA
|
166,800 sq. ft./manufacturing
|
148,800 Owned;
18,000 Leased
|
|
McHenry, IL
|
164,700 sq. ft./manufacturing
|
Owned
|
|
Trenton, MO
|
159,900 sq. ft./manufacturing
|
Owned
|
|
Logansport, IN
|
141,600 sq. ft./manufacturing (Held for Sale)
|
Owned
|
|
Joplin, MO
|
139,500 sq. ft./manufacturing
|
Owned
|
|
Camdenton, MO
|
128,000 sq. ft./manufacturing
|
Leased
|
|
|
||
|
Original Equipment - Asia Segment
|
||
|
Chennai, India
|
118,100 sq. ft./manufacturing
|
Owned
|
|
Changzhou, China
|
107,600 sq. ft./manufacturing
|
Owned
|
|
Shanghai, China
|
64,600 sq. ft./manufacturing
|
Leased
|
|
Original Equipment - Europe Segment
|
||
|
Wackersdorf, Germany
|
115,300 sq. ft./assembly
|
Owned
|
|
Bonlanden, Germany
|
262,200 sq. ft./administrative & technology center
|
Owned
|
|
Kottingbrunn, Austria
|
220,600 sq. ft./manufacturing
|
Owned
|
|
Pontevico, Italy
|
153,000 sq. ft./manufacturing
|
Owned
|
|
Pliezhausen, Germany
|
122,400 sq. ft./manufacturing
|
49,800 Owned;
72,600 Leased
|
|
Kirchentellinsfurt, Germany
|
107,600 sq. ft./manufacturing
|
Owned
|
|
Mezökövesd, Hungary
|
59,600 sq. ft./manufacturing
|
Owned
|
|
Neuenkirchen, Germany
|
76,400 sq. ft./manufacturing
|
Owned
|
|
Uden, Netherlands
|
61,900 sq. ft./manufacturing
|
Owned
|
|
Gyöngyös, Hungary
|
74,000 sq. ft./ manufacturing
|
Leased
|
|
Commercial Products Segment
|
||
|
Nuevo Laredo, Mexico
|
288,500 sq. ft./manufacturing
|
Owned
|
|
Leeds, United Kingdom
|
269,100 sq. ft./administrative & manufacturing
|
Leased
|
|
Buena Vista, VA
|
197,000 sq. ft./manufacturing
|
Owned
|
|
Lexington, VA
|
104,000 sq. ft./warehouse
|
Owned
|
|
West Kingston, RI
|
92,800 sq. ft./manufacturing
|
Owned
|
|
Laredo, TX
|
45,000 sq. ft./warehouse
|
Leased
|
|
Corporate Headquarters
|
||
|
Racine, WI
|
458,000 sq. ft./headquarters & technical center
|
Owned
|
We consider our plants and equipment to be well maintained and suitable for their purposes. We review our manufacturing capacity periodically and make the determination as to our need to expand or, conversely, rationalize our facilities as necessary to meet changing market conditions and Company needs.
|
ITEM 3.
|
The information required hereunder is incorporated by reference from Note 25 of the Notes to Consolidated Financial Statements.
|
ITEM 4.
|
EXECUTIVE OFFICERS OF THE REGISTRANT.
The following sets forth the name, age, recent business experience and certain other information relative to each executive officer of the Company.
|
Name
|
Age, as of March 31, 2011
|
Position
|
||
|
Thomas A. Burke
|
54
|
President and Chief Executive Officer (April 2008 – Present); Executive Vice President and Chief Operating Officer (July 2006 – March 2008); and Executive Vice President (May 2005 – July 2006) of the Company. Prior to joining Modine in May 2005, Mr. Burke worked over a period of nine years in various management positions with Visteon Corporation in Detroit, MI, a leading supplier of parts and systems to automotive manufacturers, including as Vice President of North American Operations (2002 – May 2005) and Vice President, European and South American Operations (2001 – 2002). Prior to working at Visteon, Mr. Burke worked in positions of increasing responsibility at Ford Motor Company.
|
||
|
Michael B. Lucareli
|
42
|
Vice President, Finance, Chief Financial Officer and Treasurer (July 2010 – Present); Vice President, Finance and Corporate Treasurer (May 2008 – July 2010); Managing Director Financial Operations (November 2006 – May 2008); Director, Financial Operations and Analysis (May 2004 – October 2006); Director, Business Development and Strategic Planning (November 2002 – May 2004); and Business Development and Investor Relations Manager (1999 – October 2002). Prior to joining Modine, Mr. Lucareli was a securities analyst and portfolio manager for Associated Bank’s investment management group in Green Bay, WI. He also served as Director of Investment Research for Alpha Investment Group in Milwaukee, WI and as international research analyst for SEI Corporation in Chicago, IL. Mr. Lucareli holds a Bachelor’s degree in Economics from the University of Wisconsin (Madison) and an MBA from Loyola University (Chicago). He is also a Chartered Financial Analyst (CFA).
|
||
|
Scott L. Bowser
|
47
|
Regional Vice President – Americas (March 2009 - Present); Managing Director – Modine Brazil (April 2006 - March 2009); General Sales Manager – Truck Division (January 2002 – March 2006); Plant Manager at the Company’s Pemberville, OH plant (1998 - 2001).
|
||
|
Thomas F. Marry
|
50
|
Executive Vice President – Europe, Asia and Commercial Products Group (May 2011 – Present); Regional Vice President – Asia and Commercial Products Group (November 2007 – May 2011); Managing Director – Powertrain Cooling Products (October 2006 - October 2007); General Manager – Truck Division (2003 - 2006); Director – Engine Products Group (2001 – 2003); Manager – Sales, Marketing and Product Development (1999 - 2001); Marketing Manager (1998 - 1999).
|
||
|
Margaret C. Kelsey
|
46
|
Vice President, Corporate Development, General Counsel and Secretary (November 2008 – Present); Vice President Corporate Strategy and Business Development (May 2008 – October 2008); Vice President - Finance, Corporate Treasury and Business Development (January 2007 – April 2008); Corporate Treasurer & Assistant Secretary (January 2006 – December 2006); Senior Counsel & Assistant Secretary (April 2002 - December 2005); Senior Counsel (2001 – March 2002). Prior to joining the Company in 2001, Ms. Kelsey was a partner with the law firm of Quarles & Brady LLP.
|
Officer positions are designated in Modine's Bylaws and the persons holding these positions are elected annually by the Board generally at its first meeting after the annual meeting of shareholders in July of each year. The Officer Nomination and Compensation Committee of the Board may recommend and the Board of Directors approve promotions and other actions with regard to officers at any time during the fiscal year.
There are no family relationships among the executive officers and directors. All of the executive officers of Modine have been employed by Modine in various capacities during the last five years.
There are no arrangements or understandings between any of the above officers and any other person pursuant to which he or she was elected an officer of Modine.
PART II
The Company's common stock is listed on the New York Stock Exchange. The Company's trading symbol is "MOD." The table below shows the range of high and low sales prices for the Company's common stock for fiscal 2011 and 2010. As of March 31, 2011, shareholders of record numbered 3,075.
|
2011
|
2010
|
|||||||||||||||||||||||
|
Quarter
|
High
|
Low
|
Dividends
|
High
|
Low
|
Dividends
|
||||||||||||||||||
|
First
|
$ | 14.91 | $ | 7.62 | $ | - | $ | 5.40 | $ | 2.30 | $ | - | ||||||||||||
|
Second
|
13.22 | 7.10 | - | 9.85 | 4.60 | - | ||||||||||||||||||
|
Third
|
16.28 | 12.10 | - | 12.69 | 8.74 | - | ||||||||||||||||||
|
Fourth
|
17.89 | 13.00 | - | 12.70 | 8.76 | - | ||||||||||||||||||
|
TOTAL
|
$ | - | $ | - | ||||||||||||||||||||
The Company is permitted under its debt agreements to pay dividends on its common stock subject to an aggregate amount based on the calculation of debt covenants, as further described under “Liquidity and Capital Resources” under Item 7. Management’s Discussion and Analysis of Financial Condition and Results of Operations. The Company currently does not intend to pay dividends in fiscal 2012.
ISSUER PURCHASES OF EQUITY SECURITIES
The following describes the Company’s purchases of Common Stock during the fourth quarter of fiscal 2011:
|
Period
|
(a)
Total Number of Shares (or Units) Purchased
|
(b)
Average Price Paid Per Share (or Unit)
|
(c)
Total Number of Shares (or Units) Purchased as Part of Publicly Announced Plans or Programs
|
(d)
Maximum Number (or Approximate Dollar Value) of Shares (or Units) that May Yet Be Purchased Under the Plans or Programs
|
|
January 1 – January 31, 2011
|
________
|
_______
|
_______
|
_______
|
|
February 1 – February 28, 2011
|
1,423 (1)
|
$17.09
|
_______
|
_______
|
|
March 1 – March 31, 2011
|
3,499 (1)
|
$15.40
|
_______
|
_______
|
|
Total
|
4,922 (1)
|
$15.89
|
_______
|
_______
|
|
(1)
|
Consists of shares delivered back to the Company by employees and/or directors to satisfy tax withholding obligations that arise upon the vesting of the stock awards. These shares are held as treasury shares.
|
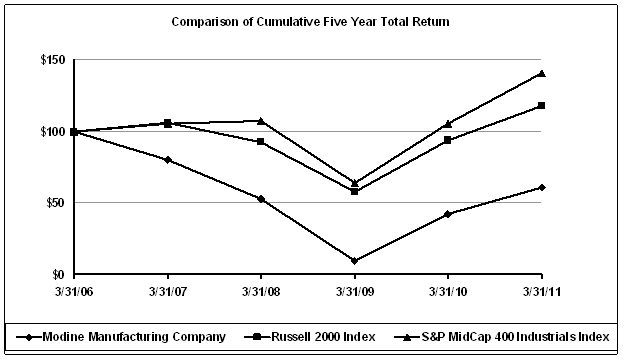
PERFORMANCE GRAPH
The following graph compares the cumulative five-year total return on the Company’s common stock with similar returns on the Russell 2000 Index and the Standard & Poor’s (S&P) MidCap 400 Industrials Index. The graph assumes a $100 investment and reinvestment of dividends.
|
March 31,
|
Initial Investment
|
Indexed Returns
|
||||||||||||||||||||||
|
2006
|
2007
|
2008
|
2009
|
2010
|
2011
|
|||||||||||||||||||
|
Company / Index
|
||||||||||||||||||||||||
|
Modine Manufacturing Company
|
$ | 100 | $ | 79.92 | $ | 52.43 | $ | 9.37 | $ | 42.11 | $ | 60.47 | ||||||||||||
|
Russell 2000 Index
|
100 | 105.91 | 92.14 | 57.58 | 93.73 | 117.90 | ||||||||||||||||||
|
S&P MidCap 400 Industrials Index
|
100 | 105.53 | 107.21 | 63.88 | 105.07 | 140.92 | ||||||||||||||||||
|
ITEM 6.
|
The following selected financial data has been presented on a continuing operations basis, and excludes the discontinued operating results of the South Korean-based HVAC business, which was sold during fiscal 2010 and the Electronics Cooling business, which was sold during fiscal 2009. Fiscal 2010 and prior were revised for errors identified relating to prior periods. See Note 1 of the Notes to Consolidated Financial Statements for further discussion on the revisions, and the impact of those revisions on fiscal 2010 and 2009 results.
|
(in thousands, except per share amounts)
|
Fiscal Year ended March 31
|
|||||||||||||||||||
|
2011
|
2010
|
2009
|
2008
|
2007
|
||||||||||||||||
|
Net sales
|
$ | 1,448,235 | $ | 1,162,576 | $ | 1,406,944 | $ | 1,603,527 | $ | 1,525,492 | ||||||||||
|
Earnings (loss) from continuing operations
|
9,227 | (19,695 | ) | (104,054 | ) | (55,105 | ) | 38,845 | ||||||||||||
|
Total assets
|
916,939 | 840,895 | 852,506 | 1,168,283 | 1,101,573 | |||||||||||||||
|
Long-term debt - excluding current portion
|
138,582 | 135,952 | 243,982 | 224,525 | 173,074 | |||||||||||||||
|
Dividends per share
|
- | - | 0.30 | 0.70 | 0.70 | |||||||||||||||
|
Net earnings (loss) from continuing operations per share of common stock - basic
|
0.20 | (0.50 | ) | (3.25 | ) | (1.73 | ) | 1.20 | ||||||||||||
|
Net earnings (loss) from continuing operations per share of common stock - diluted
|
0.20 | (0.50 | ) | (3.25 | ) | (1.73 | ) | 1.19 | ||||||||||||
The following factors impact the comparability of the selected financial data presented above:
|
·
|
During fiscal 2011, the Company recognized a loss of $19.9 million on early extinguishment of debt and write-off of unamortized costs as components of interest expense. During fiscal 2010, the Company recognized a prepayment penalty of $3.5 million related to a partial paydown of debt as a component of interest expense.
|
|
·
|
During fiscal 2009, the Company recorded a goodwill impairment charge of $9.0 million within the Original Equipment – Europe segment. During fiscal 2008, the Company recorded a goodwill impairment charge of $23.8 million within the Original Equipment – North America segment. Refer to Note 14 of the Notes to Consolidated Financial Statements for additional discussion of these charges.
|
|
·
|
During fiscal 2011, 2010, 2009 and 2008, the Company recorded long-lived asset impairment charges of $3.5 million, $6.5 million, $26.8 million and $11.6 million, respectively. Refer to Note 10 of the Notes to Consolidated Financial Statements for additional discussion of these charges.
|
|
·
|
During fiscal 2009, the Company recognized an impairment charge of $7.6 million recorded in other expense (income) – net on an equity investment. Refer to Note 11 of the Notes to Consolidated Financial Statements for additional discussion of this charge.
|
|
·
|
During fiscal 2011, the Company’s effective tax rate was 27.3 percent, as the Company continues to pay taxes in foreign jurisdictions that earn profits, but does not recognize any tax benefits on losses generated in the U.S., Germany and Austria based on full tax valuation allowances recorded in these jurisdictions. The fiscal 2011 provision for income taxes also included a Hungary tax credit of $7.8 million. During fiscal 2010, the Company’s effective tax rate was negative 91.9 percent. During fiscal 2009, the Company’s effective tax rate was negative 0.7 percent. During fiscal 2008, the Company’s effective tax rate was negative 227.5 percent due to a valuation allowance of $59.4 million recorded primarily against the net U.S. deferred tax assets. During fiscal 2007, the Company’s effective tax rate was 15.8 percent. Refer to Note 6 of the Notes to Consolidated Financial Statements for additional discussion on the effective tax rate.
|
|
·
|
During fiscal 2010, 2009, 2008 and 2007, the Company incurred $6.0 million, $39.5 million, $10.2 million and $10.7 million, respectively, of restructuring and other repositioning costs. Refer to Note 13 of the Notes to Consolidated Financial Statements for additional discussion of the events which comprised these costs.
|
|
·
|
Fiscal 2008 and 2007 results have been revised for errors identified in prior periods, the nature of which are disclosed in Note 1 of the Notes to Consolidated Financial Statements. The impact of these revisions on fiscal 2008 and 2007 financial information are as follows:
|
|
|
2008:
Net sales increased by $1.9 million, loss from continuing operations increased by $0.7 million, and basic and diluted net loss from continuing operations per share increased $0.03.
|
|
|
2007:
Earnings from continuing operations decreased $0.4 million and basic and diluted earnings from continuing operations per share decreased $0.01 and $0.02, respectively.
|
Overview and Strategic Plan
Founded in 1916, Modine Manufacturing Company is a worldwide leader in thermal management systems and components, bringing heating and cooling technology and solutions to diversified global markets. We operate on five continents, in 14 countries, and with approximately 6,500 employees worldwide.
Our products are in light-, medium- and heavy-duty vehicles, commercial heating, ventilation and air conditioning (HVAC) equipment, refrigeration systems, off-highway and industrial equipment and fuel-cell applications. Our broad product offerings include heat transfer modules and packages, radiators, oil coolers, charge-air-coolers, vehicular air conditioning, building HVAC equipment, and EGR coolers.
Consolidated Strategy
Our goal is to grow profitably as a leading global provider of thermal management technology to a broad range of niche on-highway, off-highway and industrial end markets. We expect to achieve this goal over the long-term through both organic growth and selective acquisitions. We focus on:
|
·
|
Development of new products and technologies for diverse geographic and end markets;
|
|
·
|
A rigorous strategic planning and corporate development process; and
|
|
·
|
Operational and financial discipline to ensure improved profitability and long-term stability.
|
Development of New Products and Technologies
Our ability to develop new products and technologies for current and potential customers and for new and emerging markets is one of our competitive strengths. We own two global, state-of-the-art technology centers, dedicated to the development and testing of products and technologies. The centers are located in Racine, Wisconsin in the U.S., and in Bonlanden, Germany. Our reputation for providing high quality products and technologies has been a company strength valued by customers, and has led to a history with relatively few product warranty issues. In fiscal 2011, we spent $67.0 million (representing approximately 36 percent of selling, general and administrative (SG&A) expenses) on our product and technology research and development efforts.
We continue to benefit from relationships with customers that recognize the value of having us participate directly in product design, development and validation. This has resulted and should continue to result in strong, longer-term customer relationships with companies that value partnerships with their suppliers. In the past several years, our product lines have been under price pressure from increased global competition, primarily from Asia and other low cost areas. At the same time, many of our products containing higher technology have helped us better manage demands from customers for lower prices. Many of our technologies are proprietary, difficult to replicate and patent protected. We have been granted and/or acquired more than 2,000 patents on our technologies over the life of the Company and work diligently to protect our intellectual property.
Strategic Planning and Corporate Development
We employ both short-term (one-to-three year) and longer-term (five-to-seven year) strategic planning processes, enabling us to continually assess our opportunities, competitive threats, and economic market challenges.
We focus on strengthening our competitive position through strategic, global business development activities. We continuously look for and take advantage of opportunities to advance our position as a global leader, by expanding our geographic footprint and by expanding into new end markets and product areas – all with a focus on thermal management technologies. This process allows us to identify product gaps in the marketplace, develop new products and make additional investments to fill those gaps. An example of our recent success from this process has been our organic expansion activities into niche HVAC and refrigeration markets in our Commercial Products segment.
Operational and Financial Discipline
We operate in an increasingly competitive global marketplace; therefore, we must manage our business with a disciplined focus on increasing productivity and reducing waste. The competitiveness of the global market place requires us to move toward a greater manufacturing scale in order to create a more competitive cost base. As costs for materials and purchased parts rise from time to time due to global increases in the commodity markets, we seek low-cost country sourcing when appropriate and enter into contracts with some of our customers that provide for these rising costs to be passed through to them on a lag basis.
We follow a rigorous financial process for investment and returns, intended to enable increased profitability and cash flows over the long-term with particular emphasis on working capital improvement and prioritization of capital for investment and disposals – driving past and current improvement in global cash and debt management and access to sufficient credit.
During fiscal 2011 significant progress was made in improving the Company’s liquidity and financial position. On August 12, 2010, we entered into a four-year, $145.0 million Amended and Restated Credit Agreement, which amended and restated the Company’s existing revolving credit facility. In addition, the Company issued $125.0 million of 6.83 percent Series A Senior Notes maturing on August 12, 2020. The proceeds from the 2020 Notes were used to repay our existing senior notes. These actions extended the maturity of our outstanding debt obligations, providing the Company a long-term source of financing at reduced interest rates. During fiscal 2010, we completed a public offering of 13.8 million shares of our common stock with cash proceeds of $92.9 million after deducting underwriting discounts and other associated fees.
Our executive management incentive compensation (cash bonus) plan for fiscal 2011 was based on operating margin and asset turnover, driving our singular focus on alignment of management interests with shareholders’ interests in our capital allocation and asset management decisions. In addition, we maintain a long-term incentive compensation plan for officers and certain key employees that is used to attract, retain and motivate key employees who directly impact the long-term performance of the Company. This plan is comprised of stock options, retention restricted stock awards and performance stock awards, which are based on a mix of an annual growth rate in adjusted earnings before interest, taxes, depreciation and amortization and a target return on average capital employed at the end of a three year period (Fiscal 2013).
Consolidated Market Conditions and Trends
During fiscal 2011, the Company reported revenues from continuing operations of $1.45 billion, a 25 percent increase from $1.16 billion in fiscal 2010. The Company’s end markets are showing strong improvement from the deep recession experienced during 2009 and 2010. This improvement is seen across most of Modine’s end markets, including the commercial vehicle, off-highway and automotive markets. The commercial HVAC markets are showing early signs of modest improvement, as these markets generally trend with commercial construction build rates, which have not yet recovered from the recent recession. While the Company’s business volumes improved in fiscal 2011, the volumes remain approximately 10 percent below pre-recessionary annual sales of $1.6 billion.
The original equipment manufacturer (OEM) marketplace is extremely competitive and our customers demand that we continue to provide high quality products as well as annual price decreases. From time to time, we also experience volatility in foreign currency exchange rates and in the costs of our purchased parts and raw materials – particularly aluminum, copper, steel, and stainless steel (nickel). The combination of these factors impacts our profitability.
Our Response to Recent Market Conditions
The Company has implemented a number of cost and operational efficiency measures designed to improve our longer-term competitiveness:
|
o
|
Manufacturing realignment. Over the last four years, the Company has announced and closed three manufacturing facilities in the U.S. (Pemberville, Ohio; Logansport, Indiana and Harrodsburg, Kentucky), and one manufacturing facility in Europe (Tübingen, Germany). In addition, the Company announced the closure of the Camdenton, Missouri manufacturing facility which we expect to complete in fiscal 2012. We have also implemented a significant reduction of direct costs in our manufacturing facilities and 20 percent reduction of indirect costs in our manufacturing facilities. As volumes begin to recover, the benefits of these actions can be seen in the Company’s gross margin, which improved from 14.8 percent in fiscal 2010 to 16.0 percent in fiscal 2011. We also have invested in four new plants in low cost countries: Changzhou, China; Nuevo Laredo, Mexico; Gyöngyös, Hungary; and Chennai, India. These facilities are engaged in numerous product launches and will continue significant launch activity over the next fiscal year.
|
|
o
|
Portfolio rationalization. The Company’s business structure is organized around three global product lines, Engine Products, Powertrain Cooling Products and Commercial Products, which support our reporting segments. The Company evaluated product lines within and across its segments to assess them relative to Modine’s competitive position and the overall business attractiveness in order to identify those product lines that should be divested or exited. The Company has implemented an action plan to deemphasize its automotive module business, which most significantly impacts our Original Equipment – Europe segment. We anticipate that certain legacy automotive module programs will be winding down over the next several fiscal years. This will significantly change the revenue mix in our Original Equipment – Europe segment. In addition, during fiscal 2010 the Company significantly decreased its exposure to the vehicular heating, ventilation and air conditioning (HVAC) business with the sale of its South Korean wholly-owned subsidiary.
|
|
o
|
Capital allocation. Our business is capital intensive, requiring a significant amount of investment in the new technologies and products that the Company supports. We employ an enhanced capital allocation discipline designed to allocate capital spending to the segments and programs that will provide the highest return on our investment. All business units are measured using specific performance standards and they must earn the right to obtain capital to fund growth through their performance.
|
|
o
|
SG&A cost containment. The Company is committed to controlling its overall SG&A, and continues to focus on streamlining key business processes in order to assist with this effort. We plan to invest in growth where it is deemed to be necessary, particularly with the Original Equipment – Asia segment and the Commercial Products segment. SG&A as a percentage of sales has declined from 13.7 percent in fiscal 2010 to 12.8 percent in fiscal 2011. We remain focused on a long-term target of 11 to 12 percent for SG&A as a percentage of sales.
|
In addition to the actions described above, the Company also focuses on mitigating material price changes for our products. When possible, the Company enters into material pass-through arrangements with its key customers where material price changes are subject to pass-through to these customers on a lag basis. This lag period can extend up to a year, based on the agreements we have with individual customers. From time to time we enter into futures contracts related to forecasted purchases of commodities, largely aluminum and copper, to mitigate price changes during the lag period before we can pass-through the material price changes. We also mitigate growing cost pressures by accelerating new product development and expanding into new and existing niche markets. We continue to focus on developing new and expanded proprietary technology that is of more value in the marketplace – such as EGR coolers and our Origami™ radiators and condensers – in order to secure favorable price terms.
Segment Information – Strategy, Market Conditions and Trends
Each of our business segments is managed at the vice president level with separate financial results reviewed by our chief operating decision makers. These results are used to evaluate the performance of each business segment, and make decisions on the allocation of resources among our various businesses. Our chief operating decision makers evaluate segment performance with an emphasis on gross margin, and secondarily on operating income of each segment, which includes certain allocations of Corporate SG&A expenses.
Original Equipment – Europe (38 percent of fiscal 2011 revenues)
Our European operation is primarily engaged in providing powertrain and engine cooling systems as well as vehicular climate control components to various end markets, including automotive, heavy duty and industrial, commercial vehicle, bus and off-highway OEMs. These systems include cooling modules, radiators, charge air coolers, oil cooling products, EGR products, retarder and transmission cooling components, and HVAC condensers.
Fiscal 2011 sales have increased primarily in the premium automotive and commercial vehicle markets. Gross margin improved during fiscal 2011 due to improved operating leverage on higher sales volumes as a result of several measures management previously enacted to reduce operating costs and improve cash generation.
We continue our focus on various lean manufacturing initiatives, low-cost country sourcing and the adjustment of our manufacturing footprint to low cost locations, when appropriate. Production volumes are increasing in our new Gyöngyös, Hungary facility. We expect our European business to benefit from our various technology initiatives, which allow us to distinguish ourselves from competitors in the eyes of our customers. We also expect this segment to continue to gain market share in the commercial vehicle segment as we focus on this strategically important market and de-emphasize our focus on automotive modules.
This business is negatively impacted by rising material prices, at least until these rising prices are offset by material pass-through agreements on a time lag. We also expect to continue to see price reduction demands from our customers along with continuous and ongoing increased customer service expectations and competition from low-cost country competitors. At the same time, the business has performed well through the global economic recession, is strongly positioned with a solid customer reputation for technology, service and project management, and has been successful in winning additional program awards, particularly in the commercial vehicle market, that are scheduled to begin production in the 2012 time frame.
Original Equipment – North America (36 percent of fiscal 2011 revenues)
Our Original Equipment – North America segment includes products and technologies that are found on vehicles made for the on-highway markets, commercial vehicle OEMs and automotive components, including Class 3-8 trucks, school buses, transit buses, motor homes, motor coaches and light trucks. It also serves the off-highway markets including agricultural, construction and industrial products (e.g. lift trucks, compressors and power generation).
The sales volume recovery in 2011, specifically in the commercial vehicle, agriculture and construction markets, resulted in strong revenue and operational results. The manufacturing footprint realignment and fixed cost reduction efforts from the last few years provided significant operating leverage as the volumes recovered. The North American business will continue to focus on growing in the markets where its products and manufacturing footprint create a competitive advantage.
The overall strategy for this business segment includes the following:
|
·
|
First, our strategy of repositioning the segment, including reassessing our manufacturing footprint, improving sourcing of raw materials and purchased parts, and other programs intended to increase efficiency and right-size capacity has put us in a cost competitive and flexible position. Going forward, we will continue to assess and adjust as necessary in order to maintain and improve our position and value to our customers.
|
|
·
|
Second, we are focused on reducing lead times to bring new products to market and offering a wider product breadth, while at the same time rationalizing the existing product lines to meet required financial metrics or fit within our overall strategy.
|
|
·
|
Third, we are focused on pursuing only selected new business opportunities that meet our minimum targeted rates of return, thus enabling profitable growth to the Company.
|
Commercial Products (12 percent of fiscal 2011 revenues)
Our Commercial Products business manufactures and distributes a variety of HVAC products, primarily for commercial building and related applications in North America, Europe, Asia and South Africa. We sell our heating and cooling products through various channels to consulting contractors, engineers, and building owners for applications such as warehouses, repair garages, greenhouses, residential garages, schools, computer rooms, manufacturing facilities, banks, pharmaceutical companies, stadiums and retail stores.
Our heating products include gas, electric, oil and hydronic unit heaters, low intensity infrared, and large roof-mounted direct and indirect fired makeup air units. Our cooling products include single packaged vertical units and unit ventilators used in school room applications, computer room air conditioning units, air- and water-cooled chillers, ceiling cassettes, and roof top packaged ventilation units used in a variety of commercial building applications.
We also manufacture coils (copper tube aluminum fin coils, stainless steel tube aluminum fin coils and all-aluminum microchannel coils) for heating, refrigeration, air conditioning and vehicular applications. These are sold to original equipment manufacturers and used in residential (e.g., high-efficiency furnaces), commercial (e.g., chillers, ice machines, dehumidifiers) and vehicular products (e.g., air conditioning).
Revenues improved slightly from the prior year due to modest market demand recovery from the global recession and increased market share in certain segments. Gross margins remained relatively flat from prior year as a percentage of sales despite significant commodity material cost increases. We offset these cost increases with price increases and through improved manufacturing productivity. Economic conditions, such as demand for new commercial construction, growth in data centers, and school renovations, as well as higher efficiency demands are growth drivers for the heating and cooling products.
South America (11 percent of fiscal 2011 revenues)
Our South America segment provides heat exchange products to a variety of markets in the domestic Brazilian market as well as for export to North America and Europe. This business provides products to the on-highway commercial vehicle markets, off-highway markets, including construction and agricultural applications, automotive OEMs and industrial applications, primarily for power generation systems. This business also provides products to the Brazilian, North American and European aftermarkets for both automotive and commercial applications. We manufacture radiators, charge-air-coolers, oil coolers, auxiliary coolers (transmission, hydraulic, and power steering), engine cooling modules and HVAC system modules. Growth drivers in this region include the development of additional agricultural land and infrastructure improvements in Brazil.
Original Equipment – Asia (3 percent of fiscal 2011 revenues)
Our Asian operation is primarily engaged in providing powertrain cooling systems and engine products to customers in commercial vehicle and off-highway markets. Modine technology, performance, quality and reputation have enabled us to win new engine products business. Emissions standards in China and India lag behind Europe and North America. As a result, some local on and off-highway powertrain cooling customers focus on price versus technology. However, we are seeing a shift towards more higher performing, durable products, which may provide us additional powertrain cooling opportunities in the future.
Many components that we supply in this region become part of a module, which increases the amount of our content on an engine. Our strategy in this business segment is to control and reduce costs, secure new business, further diversify our product offering and customer base, and continue to focus on building manufacturing capabilities in China and India to serve the region in a cost competitive manner. Our new manufacturing facility in Chennai, India is currently producing low volumes of products and our manufacturing facility in Changzhou, China is continuing to ramp up production. We are scheduled to begin production of several new products from both of these facilities during the next fiscal year.
Outlook
Our net sales improved sequentially throughout fiscal 2011 as our markets continue to recover from the recession experienced in 2009 and 2010. Our expectations for fiscal 2012 include a 12 to 16 percent increase in net sales compared with our fiscal 2011 results. Specifically, we expect continued recovery in the commercial vehicle markets in North America and slight improvement in agriculture and construction markets, growth in the off-highway markets in Asia as we launch new programs, improvement in the commercial vehicle and off-highway markets in Europe, modest improvements in our commercial products markets and improvements in commercial vehicles and construction in South America. We expect that the positive impact of the sales volume improvements on our results from operations will result in operating income in a range of 4.1 to 4.7 percent of sales. Further, we expect diluted earnings per share to be in the range of $0.95 to $1.05 and capital spending in the range of $70 to $75 million. This outlook represents a significant improvement in diluted earnings per share over the $0.13 reported in fiscal 2011.
Consolidated Results of Operations - Continuing Operations
Fiscal 2011 sales volumes and profitability improved significantly as our end markets have shown strong recovery from the recent economic recession. Fiscal 2010 sales volumes declined significantly as a result of the weakened global economy. The instability in the global financial and economic markets created a significant downturn in the vehicular markets in which the Company competes. In fiscal 2009, the Company recorded significant goodwill and long-lived asset impairment charges, along with restructuring charges primarily related to workforce reductions. The fiscal 2010 and fiscal 2009 results have been revised to reflect the correction of errors relating to these periods. See Note 1 of the Notes to Consolidated Financial Statements for further discussion.
The following table presents consolidated results from continuing operations on a comparative basis for the years ended March 31, 2011, 2010 and 2009:
|
Years ended March 31
|
2011
|
2010
|
2009
|
|||||||||||||||||||||
|
(dollars in millions)
|
$'s
|
% of sales
|
$'s
|
% of sales
|
$'s
|
% of sales
|
||||||||||||||||||
|
Net sales
|
$ | 1,448 | 100.0 | % | $ | 1,163 | 100.0 | % | $ | 1,407 | 100.0 | % | ||||||||||||
|
Cost of sales
|
1,217 | 84.0 | % | 991 | 85.2 | % | 1,221 | 86.8 | % | |||||||||||||||
|
Gross profit
|
231 | 16.0 | % | 172 | 14.8 | % | 186 | 13.2 | % | |||||||||||||||
|
Selling, general and administrative expenses
|
185 | 12.8 | % | 159 | 13.7 | % | 199 | 14.1 | % | |||||||||||||||
|
Restructuring (income) charges
|
- | 0.0 | % | (1 | ) | -0.1 | % | 30 | 2.1 | % | ||||||||||||||
|
Impairment of goodwill and long-lived assets
|
4 | 0.3 | % | 7 | 0.6 | % | 36 | 2.6 | % | |||||||||||||||
|
Earnings (loss) from operations
|
43 | 3.0 | % | 7 | 0.6 | % | (80 | ) | -5.7 | % | ||||||||||||||
|
Interest expense
|
34 | 2.3 | % | 23 | 2.0 | % | 14 | 1.0 | % | |||||||||||||||
|
Other (income) expense - net
|
(4 | ) | -0.3 | % | (6 | ) | -0.5 | % | 10 | 0.7 | % | |||||||||||||
|
Loss from continuing operations before income taxes
|
13 | 0.9 | % | (10 | ) | -0.9 | % | (103 | ) | -7.3 | % | |||||||||||||
|
Provision for income taxes
|
3 | 0.2 | % | 9 | 0.8 | % | 1 | 0.1 | % | |||||||||||||||
|
Earnings (loss) from continuing operations
|
$ | 9 | 0.6 | % | $ | (20 | ) | -1.7 | % | $ | (104 | ) | -7.4 | % | ||||||||||
Year Ended March 31, 2011 Compared to Year Ended March 31, 2010:
Net sales increased $285 million, or 24.5 percent, to $1.45 billion in fiscal 2011 from $1.16 billion in fiscal 2010 driven by overall sales volume improvements as the global economy recovers. In fiscal 2011 medium/heavy duty truck sales were up approximately 24 percent for all markets, agriculture and construction sales volumes up over 55 percent for all markets, and light vehicle sales were up 17 percent. During fiscal 2011, the U.S. dollar strengthened in comparison to other foreign currencies, resulting in unfavorable foreign currency exchange rates which impacted net sales by $23 million.
Gross profit increased $59 million, or 34.3 percent, to $231 million in fiscal 2011 from $172 million in fiscal 2010, due primarily to the improved sales volumes and improved gross margin when compared with fiscal 2010. Gross margin improved from 14.8 percent in fiscal 2010 to 16.0 percent in fiscal 2011. The gross margin improvement is primarily attributable to better fixed cost absorption on the improved sales volumes, offset partially by higher commodity metals prices.
SG&A expenses increased $26 million, or 16.4 percent, to $185 million in fiscal 2011 from $159 million in fiscal 2010, but decreased 90 basis points as a percentage of sales from 13.7 percent to 12.8 percent. The overall increase in SG&A expenses is a reflection of our reinvestment in the business to support future growth, including higher employee benefits such as salary increases and increased headcount and higher engineering and development costs.
Long-lived asset impairment charges of $4 million were recorded in fiscal 2011 primarily related to a program cancellation in our Original Equipment – Europe and Original Equipment – Asia segments, assets no longer in use in the Original Equipment – Europe segment and on facilities held for sale due to a continued decline in the real estate market for commercial property in the Original Equipment – North America segment.
Interest expense increased $11 million from fiscal 2010 to fiscal 2011 largely due to $20 million of costs related to the debt refinancing completed during the second quarter of fiscal 2011, including $16.6 million of prepayment penalties and $3.3 million of write-offs of unamortized financing costs. These costs significantly exceeded approximately $4 million of costs incurred in fiscal 2010 related to the prepayment of debt.
Other income of $4 million for fiscal 2011 represents a $2 million decline from other income of $6 million in fiscal 2010 due to the sale of our 50 percent ownership of Anhui Jianghaui Mando Climate Control Co. Ltd during fiscal 2010. Fiscal 2011 other income consists primarily of foreign currency transaction gains on inter-company loans denominated in foreign currencies and to a lesser extent interest income and equity in affiliate’s earnings.
The provision for income taxes decreased to $3 million in fiscal 2011 from $9 million in fiscal 2010. The decrease in the provision for income taxes was primarily due to an $8 million development tax incentive credit related to our operations in Hungary which we were able to recognize during the current year with the attainment of a minimum employment requirement. Partially offsetting this tax incentive is a provision for income taxes resulting from continued pre-tax earnings growth in certain of our foreign jurisdictions.
Year Ended March 31, 2010 Compared to Year Ended March 31, 2009:
Net sales decreased $244 million, or 17.3 percent, to $1.16 billion in fiscal 2010 from $1.41 billion in fiscal 2009 driven by sales volume deterioration as a result of the weakened global economy in the second half of fiscal 2009 and continuing into fiscal 2010. Medium/heavy duty truck sales were down approximately 20 percent for all markets and agriculture and construction sales volumes were down over 35 percent for all markets.
Gross profit decreased $14 million, or 7.5 percent, to $172 million in fiscal 2010 from $186 million in fiscal 2009, due primarily to the reduction in sales volumes from fiscal 2009 to fiscal 2010. Gross margin improved from 13.2 percent in fiscal 2009 to 14.8 percent in fiscal 2010. This increase was primarily related to our focus on cost reduction activities in the manufacturing facilities and the impact of favorable materials pricing.
SG&A expenses decreased $40 million, or 20.1 percent, to $159 million in fiscal 2010 from $199 million in fiscal 2009, and decreased as a percentage of sales from 14.1 percent to 13.7 percent. The overall reduction of SG&A reflected our intense focus on lowering our administrative cost structure and executing on our portfolio rationalization strategy.
Restructuring income was recorded during fiscal 2010 related to the reversal of severance liabilities within our European business as a result of favorable benefits negotiations partially offset by restructuring charges related to the announced closure of our Harrodsburg, Kentucky facility. Restructuring charges of $30 million in fiscal 2009 related to workforce reductions at our corporate headquarters in Racine, Wisconsin and European headquarters in Bonlanden, Germany.
Long-lived asset impairment charges of $7 million were recorded in fiscal 2010 primarily related to long-lived assets in our North American business for certain assets that were not able to support their asset bases and for the Harrodsburg, Kentucky manufacturing facility based on our planned closure of this facility. Long-lived asset impairment charges of $36 million in fiscal 2009 included a goodwill impairment charge of $9 million in our Original Equipment – Europe segment and long-lived asset impairment charges of $27 million against certain assets in our European, North American and Commercial Products businesses.
Interest expense increased $9 million from fiscal 2009 to fiscal 2010 based on increased borrowings early in fiscal 2010 at higher interest rates along with the $3.4 million penalty to the holders of our senior notes in connection with the mandatory prepayments of debt with a portion of the cash proceeds from the common stock offering on September 30, 2009. Also included in interest expense was the amortization of $0.8 million of capitalized debt issuance costs and interest rate derivatives in proportion with the mandatory prepayment of the senior notes.
Other income of $6 million for fiscal 2010 represented a $16 million improvement from other expense of $10 million in fiscal 2009. Fiscal 2010 other income consists primarily of foreign currency transaction gains on inter-company loans denominated in foreign currencies and a $1.5 million gain on the sale of our 50 percent ownership of Anhui Jianghaui Mando Climate Control Co. Ltd. while fiscal 2009 consisted primarily of foreign currency transaction losses on inter-company loans denominated in foreign currencies and an impairment charge related to an equity investment with a decline in its value that was “other than temporary.”
The provision for income taxes increased $8 million in fiscal 2010 from $1 million in fiscal 2009. The increase in the provision for income taxes was due to an increase in pre-tax earnings from certain foreign tax jurisdictions, primarily Brazil, Germany and Austria, as compared to the prior year.
Discontinued Operations
During fiscal 2009, the Company announced the intended divestiture of its South Korean-based vehicular HVAC business and presented it as held for sale and as a discontinued operation in the consolidated financial statements for all periods presented. This business was sold on December 23, 2009 for $10.5 million, resulting in a loss on sale of $0.6 million incurred during fiscal 2010.
Segment Results of Operations
|
Original Equipment – Europe
|
||||||||||||||||||||||||
|
Years ended March 31
|
2011
|
2010
|
2009
|
|||||||||||||||||||||
|
(dollars in millions)
|
$'s
|
% of sales
|
$'s
|
% of sales
|
$'s
|
% of sales
|
||||||||||||||||||
|
Net sales
|
$ | 547 | 100.0 | % | $ | 469 | 100.0 | % | $ | 597 | 100.0 | % | ||||||||||||
|
Cost of sales
|
472 | 86.3 | % | 410 | 87.4 | % | 520 | 87.1 | % | |||||||||||||||
|
Gross profit
|
75 | 13.7 | % | 59 | 12.6 | % | 77 | 12.9 | % | |||||||||||||||
|
Selling, general and administrative expenses
|
45 | 8.2 | % | 38 | 8.1 | % | 49 | 8.2 | % | |||||||||||||||
|
Restructuring (income) charges
|
- | 0.0 | % | (3 | ) | -0.6 | % | 22 | 3.7 | % | ||||||||||||||
|
Impairment of goodwill and long-lived assets
|
2 | 0.4 | % | 1 | 0.2 | % | 19 | 3.2 | % | |||||||||||||||
|
Income (loss) from continuing operations
|
$ | 28 | 5.1 | % | $ | 23 | 4.9 | % | $ | (13 | ) | -2.2 | % | |||||||||||
Net sales within the Original Equipment – Europe segment decreased $128 million, or 21.4 percent from fiscal 2009 to fiscal 2010 based primarily on a 47 percent decline in medium/heavy duty truck sales and a 46 percent decline in agriculture and construction sales volumes. The $78 million improvement or 16.6 percent increase in net sales from fiscal 2010 to fiscal 2011 was based primarily on increased sales to the premium automotive and commercial vehicle markets as the markets began to recover, partially offset by a $36 million unfavorable impact due to foreign currency exchange rate changes.
Gross margin remained relatively consistent from fiscal 2009 to fiscal 2010. The underabsorption of fixed manufacturing costs as a result of the decrease in sales volumes was partially offset by the reduction of direct and indirect costs in the manufacturing facilities and the favorable impact of materials pricing. Repositioning costs of $2 million were included in cost of sales in fiscal 2009 related to the closure of the Tübingen, Germany facility. Gross margin improved to 13.7 percent or 110 basis points from fiscal 2010 to fiscal 2011 due to improved operating leverage on higher sales volumes, partially offset by the incremental costs of program launches.
SG&A expenses decreased $11 million from fiscal 2009 to fiscal 2010 largely due to the positive impact of SG&A cost reduction efforts. SG&A expense increased in fiscal 2011 compared to fiscal 2010 by $7 million, yet remained relatively consistent as a percent of sales. Europe experienced higher engineering and development costs in fiscal 2011 largely due to the timing of reimbursements from customers and also the absence of employee furloughs that were in place during fiscal 2010. Restructuring charges of $22 million were recorded in fiscal 2009 as the result of a reduction in workforce throughout the European facilities including at the European headquarters in Bonlanden, Germany. Restructuring income of $3 million was recorded during fiscal 2010 related to the reversal of severance liabilities as the result of favorable benefits negotiations. A goodwill impairment charge of $9 million was recorded in fiscal 2009, which represents an impairment of the full amount of goodwill recorded within the segment. This impairment was based on a declining outlook for the segment with sales volumes and lower gross margin related to the under absorption of fixed manufacturing costs and the change in product mix. In addition, long-lived asset impairment charges of $10 million were recorded in fiscal 2009 related to certain manufacturing facilities with projected cash flows unable to support their asset bases. In fiscal 2011 a long-lived asset impairment charge of $2 million was recorded related to a program cancellation and for assets no longer in use.
Income from continuing operations of $23 million in fiscal 2010 was an improvement of $36 million from fiscal 2009 primarily due to the reduced SG&A expenses and absence of significant restructuring and impairment charges recorded during fiscal 2009. Income from continuing operations improved further to $28 million in fiscal 2011 due primarily to improved sales volumes driving higher gross profit, partially offset by the increase in SG&A expenses.
|
Original Equipment – North America
|
||||||||||||||||||||||||
|
Years ended March 31
|
2011
|
2010
|
2009
|
|||||||||||||||||||||
|
(dollars in millions)
|
$'s
|
% of sales
|
$'s
|
% of sales
|
$'s
|
% of sales
|
||||||||||||||||||
|
Net sales
|
$ | 527 | 100.0 | % | $ | 412 | 100.0 | % | $ | 498 | 100.0 | % | ||||||||||||
|
Cost of sales
|
456 | 86.5 | % | 366 | 88.8 | % | 456 | 91.6 | % | |||||||||||||||
|
Gross profit
|
71 | 13.5 | % | 46 | 11.2 | % | 42 | 8.4 | % | |||||||||||||||
|
Selling, general and administrative expenses
|
43 | 8.2 | % | 36 | 8.7 | % | 60 | 12.0 | % | |||||||||||||||
|
Restructuring charges
|
- | 0.0 | % | 1 | 0.2 | % | 3 | 0.6 | % | |||||||||||||||
|
Impairment of goodwill and long-lived assets
|
1 | 0.2 | % | 5 | 1.2 | % | 16 | 3.2 | % | |||||||||||||||
|
Income (loss) from continuing operations
|
$ | 27 | 5.1 | % | $ | 4 | 1.0 | % | $ | (37 | ) | -7.4 | % | |||||||||||
Net sales within the Original Equipment – North America segment decreased $86 million, or 17.3 percent, from fiscal 2009 to fiscal 2010, and increased $115 million, or 27.9 percent, from fiscal 2010 to fiscal 2011. The fiscal 2010 decrease was primarily due to the impact of the global recession while the sales increase in fiscal 2011 is largely due to the improvement of the North American truck, agriculture and construction markets.
Gross margin increased from 8.4 percent in fiscal 2009 to 11.2 percent in fiscal 2010, and further improved to 13.5 percent in fiscal 2011. The improved gross margin from fiscal 2009 to fiscal 2010 was primarily attributable to a significant reduction in direct and indirect costs in the North American manufacturing facilities and the positive impact of materials pricing. In fiscal 2009, we entered into a license agreement with Bloom Energy, a leading developer of fuel cell-based distributed energy systems. The total up-front compensation received of $12.7 million was recognized as revenue over the 15-month term of the agreement, of which $10.0 million of revenue was recognized during fiscal 2009 and $2.7 million was recognized during fiscal 2010. The improved gross margin from fiscal 2010 to fiscal 2011 was primarily driven by the increase in sales and the resulting operating leverage achieved through prior year restructuring and consolidation efforts, partially off-set by negative impacts from materials pricing and pension costs.
SG&A expenses decreased $24 million from fiscal 2009 to fiscal 2010, and increased $7 million in fiscal 2011. The fiscal 2010 decrease is due to cost reduction actions and the absence of significant consulting fees incurred in fiscal 2009 in connection with our manufacturing realignment. The fiscal 2011 increase was due to increased pension costs of $3 million as a result of plan asset performance and a change in the discount rate and reduced customer reimbursement on engineering and development costs, partially offset by reductions in warranty and depreciation. Restructuring charges recorded in fiscal 2010 relate to the announced closure of our Harrodsburg, Kentucky manufacturing facility. The majority of the restructuring charges recorded during fiscal 2009 related to a workforce reduction at the Racine, Wisconsin headquarters. Long-lived asset impairment charges of $16 million were recorded in fiscal 2009 for a facility with projected cash flows unable to support its asset base, for assets related to a cancelled program, a program that was not able to support its asset base and assets no longer in use. Asset impairment charges of $5 million recorded during fiscal 2010 related to a program that was not able to support its asset base and the pending closure of the Harrodsburg, Kentucky manufacturing facility, which had a net book value that exceeded its fair value. Asset impairment charges of $1 million in fiscal 2011 relate to a decline in the market value of a facility held for sale.
Income from continuing operations improved $41 million in fiscal 2010 to earnings of $4 million primarily due to improved gross margin, reduction in SG&A expenses and reduced impairment charges. In fiscal 2011 income from continuing operations improved $23 million to $27 million primarily based on the strengthening of the North America segment’s core markets, gross margin improvements and reduced impairment charges partially offset by increased SG&A expenses.
During the fourth quarter of fiscal 2011, the North America segment identified $3 million of inventory write-downs as a result of annual physical inventory counts, of which $1 million related to the second and third quarters of fiscal 2011. The previously reported quarterly results were revised to record the $1 million adjustment. See Note 1 to the Notes to Consolidated Financial Statements for further discussion of the revisions to prior period financial statements. We determined that the North America segment did not have effective controls to ensure the existence and accuracy of inventory balances at interim periods during fiscal 2011. The North America segment is implementing a number of remediation plans to address the deficiency in interim inventory management, including detailed reviews of inventory adjustments and fluctuations in balances by inventory type, as well as improved interim count procedures and organizational changes.
|
Commercial Products
|
||||||||||||||||||||||||
|
Years ended March 31
|
2011
|
2010
|
2009
|
|||||||||||||||||||||
|
(dollars in millions)
|
$'s
|
% of sales
|
$'s
|
% of sales
|
$'s
|
% of sales
|
||||||||||||||||||
|
Net sales
|
$ | 177 | 100.0 | % | $ | 170 | 100.0 | % | $ | 188 | 100.0 | % | ||||||||||||
|
Cost of sales
|
129 | 72.9 | % | 123 | 72.4 | % | 145 | 77.1 | % | |||||||||||||||
|
Gross profit
|
48 | 27.1 | % | 47 | 27.6 | % | 43 | 22.9 | % | |||||||||||||||
|
Selling, general and administrative expenses
|
31 | 17.5 | % | 28 | 16.5 | % | 28 | 14.9 | % | |||||||||||||||
|
Restructuring charges
|
- | 0.0 | % | - | 0.0 | % | 1 | 0.3 | % | |||||||||||||||
|
Impairment of goodwill and long-lived assets
|
- | 0.0 | % | - | 0.0 | % | 1 | 0.3 | % | |||||||||||||||
|
Income from continuing operations
|
$ | 17 | 9.6 | % | $ | 19 | 11.2 | % | $ | 14 | 7.4 | % | ||||||||||||
Net sales within the Commercial Products segment decreased $18 million, or 9.6 percent, from fiscal 2009 to fiscal 2010, and increased $7 million, or 4.1 percent in fiscal 2011. The fiscal 2010 decrease was caused by reduced demand due to the global recession (while concurrently making slight improvements in market share), as well as a $5.0 million unfavorable impact from foreign currency exchange rate changes. The sales improvement in 2011 reflected a slight improvement in the construction markets, which our products serve, as well as continued market share gains from increased product offerings and improved distribution.
Gross margin increased from 22.9 percent in fiscal 2009 to 27.6 percent in fiscal 2010, and declined slightly to 27.1 percent in fiscal 2011. The improvement from fiscal 2009 to fiscal 2010 was due to lower material costs, manufacturing cost improvements and productivity initiatives. In fiscal 2011, commodity cost increases, particularly copper, were mostly offset by pricing and productivity improvements. Additionally, higher pension costs were incurred in fiscal 2011 due to changes in actuarial assumptions.
SG&A expenses as a percent of sales increased from fiscal 2009 through fiscal 2011. This was the result of planned spending increases for new product development and expanded marketing efforts, as well as higher pension expense as a result of plan asset performance and a change in the discount rate.
Income from continuing operations increased $5 million in fiscal 2010, despite the volume decline, but declined $2 million in fiscal 2011 on slightly increased volumes. The slight deterioration in fiscal 2011 operating income was planned, with increased spending on product expansion, increased marketing efforts and pension expenses. We anticipate that the additional development and marketing costs incurred will result in incremental opportunities over the next several years.
During fiscal 2011, the Company determined that it was not in compliance with certain trade regulations at its Nuevo Laredo, Mexico plant and Laredo, Texas warehouse, which are part of the Commercial Products segment. A liability of $4.5 million was recorded for estimated duties, interest and penalties related to these trade regulation issues. We estimate that $1.8 million of this exposure relates to fiscal 2011, of which $1.1 million was recorded as a component of cost of sales and $0.7 million was recorded as a component of SG&A. The remaining exposure of $2.7 million was incurred over the previous four fiscal years, with $1.4 million related to fiscal 2010 and $0.5 million related to fiscal 2009, and those prior period financial statements have been revised to record this portion of the liability. See Note 1 of the Notes to the Consolidated Financial Statements for further discussion of the revision to prior period financial statements. See Note 25 for further discussion of this trade compliance matter. We determined that there were not effective controls to ensure compliance with certain regulatory obligations related to import and export activity between our Nuevo Laredo, Mexico facility and our Laredo, Texas warehouse. We are implementing a number of remediation plans to address the deficiency in trade compliance, including the creation of compliance manuals, employee training on customs valuation and the hiring of individuals with trade compliance knowledge.
|
South America
|
||||||||||||||||||||||||
|
Years ended March 31
|
2011
|
2010
|
2009
|
|||||||||||||||||||||
|
(dollars in millions)
|
$'s
|
% of sales
|
$'s
|
% of sales
|
$'s
|
% of sales
|
||||||||||||||||||
|
Net sales
|
$ | 159 | 100.0 | % | $ | 118 | 100.0 | % | $ | 136 | 100.0 | % | ||||||||||||
|
Cost of sales
|
128 | 80.5 | % | 94 | 79.7 | % | 108 | 79.4 | % | |||||||||||||||
|
Gross profit
|
31 | 19.5 | % | 24 | 20.3 | % | 28 | 20.6 | % | |||||||||||||||
|
Selling, general and administrative expenses
|
18 | 11.3 | % | 15 | 12.7 | % | 16 | 11.8 | % | |||||||||||||||
|
Restructuring charges
|
- | 0.0 | % | 1 | 0.8 | % | - | 0.0 | % | |||||||||||||||
|
Income from continuing operations
|
$ | 13 | 8.2 | % | $ | 8 | 6.8 | % | $ | 12 | 8.8 | % | ||||||||||||
Net sales decreased $18 million in fiscal 2010 based on reduced sales volumes in all market segments due to the global economic downturn, partially offset by the favorable impact of foreign currency exchange rates of $6 million. However, exports sales volumes suffered higher losses than domestic volumes as the North America and European markets were more heavily impacted. Net sales improved $41 million in fiscal 2011, as sales volumes recovered from the economic downturn in the Brazilian commercial vehicle and agriculture markets as well as within the Brazilian aftermarket business. In addition, net sales was positively impacted by $12 million of foreign currency exchange rate changes.
Gross margin decreased slightly from 20.6 percent in fiscal 2009 to 20.3 percent in fiscal 2010 due to the under absorption of fixed costs related to the reduced sales volumes. Gross margin decreased from 20.3 percent in fiscal 2010 to 19.5 percent in fiscal 2011 primarily due to the timing lag in recovery of increased commodity prices.
SG&A expenses decreased $1 million in fiscal 2010 due to the positive impact of SG&A expense reduction efforts within the region as a response to the economic downturn. In fiscal 2011 SG&A expenses increased $3 million primarily as a result of reinvestment in the business, including higher employee benefits with increased headcount and salary increases, and a $1.7 million environmental cleanup and remediation charge as a result of work performed with environmental consultants. Restructuring charges of $1 million recorded during fiscal 2010 related to a workforce reduction within the Brazilian operations. Income from continuing operations decreased $4 million from fiscal 2009 to fiscal 2010 based on the reduced sales volumes and gross margin decline and increased $5 million to $13 million in fiscal 2011 primarily due to the increased volumes, slightly offset by higher SG&A expenses.
|
Original Equipment – Asia
|
||||||||||||||||||||||||
|
Years ended March 31
|
2011
|
2010
|
2009
|
|||||||||||||||||||||
|
(dollars in millions)
|
$'s
|
% of sales
|
$'s
|
% of sales
|
$'s
|
% of sales
|
||||||||||||||||||
|
Net sales
|
$ | 64 | 100.0 | % | $ | 32 | 100.0 | % | $ | 17 | 100.0 | % | ||||||||||||
|
Cost of sales
|
59 | 92.2 | % | 32 | 100.0 | % | 18 | 105.9 | % | |||||||||||||||
|
Gross profit
|
5 | 7.8 | % | - | 0.0 | % | (1 | ) | -5.9 | % | ||||||||||||||
|
Selling, general and administrative expenses
|
8 | 12.5 | % | 5 | 15.6 | % | 8 | 47.1 | % | |||||||||||||||
|
Loss from continuing operations
|
$ | (3 | ) | -4.7 | % | $ | (5 | ) | -15.6 | % | $ | (9 | ) | -52.9 | % | |||||||||
The Original Equipment – Asia segment is still in the expansion phase and is currently executing on numerous program launches. Net sales within this segment increased $15 million in fiscal 2010 compared with fiscal 2009 and increased another $32 million in fiscal 2011. The increase in sales is attributed to a growing presence in the region and the continued launch activities and ramp-up of production in our new facilities. The new manufacturing facility in Changzhou, China began production in the third quarter of fiscal 2008, and the Chennai, India facility began production in the second quarter of fiscal 2009. These facilities are still running at less than full capacity as launch activities continue. The negative to neutral gross margin in fiscal 2009 and fiscal 2010 is due to inefficiencies at these start-up facilities and lack of fully absorbed fixed overhead. In fiscal 2011 gross margin improved to 7.8 percent as volumes continue to improve and fixed cost absorption improves. SG&A expenses decreased $3 million in fiscal 2010 and increased $3 million in fiscal 2011 as the Company is investing for continued growth in this region. The decrease in SG&A expense in fiscal 2010 resulted from positive cost reduction efforts within the region. Loss from continuing operations improved to $3 million in fiscal 2011 as volumes and gross margin improve and volumes approach breakeven levels.
Liquidity and Capital Resources
Our primary sources of liquidity are cash flows from operating activities and borrowings under lines of credit provided by banks in the United States and abroad. See Note 16 of the Notes to Consolidated Financial Statements for further information regarding our debt agreements.
Debt Covenants
Our debt agreements require us to maintain compliance with various covenants. The Company is subject to an adjusted earnings before interest, taxes, depreciation and amortization (EBITDA) to interest (interest expense coverage ratio) covenant and a debt to adjusted EBITDA (leverage ratio) covenant. Adjusted EBITDA is defined as earnings (loss) from continuing operations before interest expense and provision for income taxes, adjusted to exclude unusual, non-recurring or extraordinary non-cash charges and up to $40.0 million of cash restructuring and repositioning charges for the duration of the credit agreement, not to exceed $20.0 million in any fiscal year, and further adjusted to add back depreciation and amortization expense. Adjusted EBITDA does not represent, and should not be considered, an alternative to earnings (loss) from continuing operations as determined by generally accepted accounting principles (GAAP), and our calculation may not be comparable to similarly titled measures reported by other companies.
The Company is required to maintain the interest expense coverage ratio and leverage ratio covenants based on the following ratios:
|
Interest Expense Coverage Ratio Covenant (Not Permitted to Be Less Than):
|
Leverage Ratio Covenant (Not Permitted to Be Greater Than):
|
||
|
Fiscal quarter ending on or before August 12, 2014
|
3.00 to 1.0
|
3.25 to 1.0
|
|
|
All fiscal quarters ending thereafter
|
3.00 to 1.0
|
3.00 to 1.0
|
Our adjusted EBITDA for the four consecutive quarters ended March 31, 2011 was $108.8 million. The following table presents a calculation of adjusted EBITDA:
(dollars in thousands)
|
Quarter Ended
June 30, 2010
|
Quarter Ended
September 30, 2010
|
Quarter Ended
December 31, 2010
|
Quarter Ended
March 31, 2011
|
Total
|
||||||||||||||||
|
Earnings (loss) from continuing operations
|
$ | 5,026 | $ | (13,690 | ) | $ | 5,585 | $ | 12,306 | $ | 9,227 | |||||||||
|
Consolidated interest expense
|
4,108 | 23,529 | 2,602 | 3,484 | 33,723 | |||||||||||||||
|
Provision for (benefit from) income taxes
|
4,044 | 4,822 | 1,134 | (6,532 | ) | 3,468 | ||||||||||||||
|
Depreciation and amortization expense (a)
|
14,467 | 13,628 | 14,032 | 14,365 | 56,492 | |||||||||||||||
|
Non-cash charges (income) (b)
|
3,460 | (4,062 | ) | 1,819 | 1,051 | 2,268 | ||||||||||||||
|
Restructuring and repositioning charges (c)
|
1,715 | 1,319 | 537 | 82 | 3,653 | |||||||||||||||
|
Adjusted EBITDA
|
$ | 32,820 | $ | 25,546 | $ | 25,709 | $ | 24,756 | $ | 108,831 | ||||||||||
|
(a)
|
Depreciation and amortization expense represents total depreciation and amortization from continuing operations less accelerated depreciation that has been included in non-cash charges described in footnote (b) below.
|
|
(b)
|
Non-cash charges (income) are comprised of long-lived asset impairments, non-cash restructuring and repositioning charges, exchange gains or losses on inter-company loans and non-cash charges that are unusual, non-recurring or extraordinary, as follows:
|
(dollars in thousands)
|
Quarter Ended
June 30, 2010
|
Quarter Ended
September 30, 2010
|
Quarter Ended
December 31, 2010
|
Quarter Ended
March 31, 2011
|
Total
|
||||||||||||||||
|
Long-lived asset impairments
|
$ | - | $ | 1,226 | $ | 1,274 | $ | 1,048 | $ | 3,548 | ||||||||||
|
Non-cash restructuring and repositioning (income) charges
|
(1,727 | ) | (348 | ) | - | 1,616 | (459 | ) | ||||||||||||
|
Exchange losses (gains) on intercompany loans
|
5,187 | (4,940 | ) | 545 | (1,613 | ) | (821 | ) | ||||||||||||
|
Non-cash charges
|
$ | 3,460 | $ | (4,062 | ) | $ | 1,819 | $ | 1,051 | $ | 2,268 | |||||||||
|
(c)
|
Restructuring and repositioning charges represent cash restructuring and repositioning costs incurred in conjunction with the restructuring activities announced on or after January 31, 2008. See Note 13 of the Notes to Consolidated Financial Statements for further discussion on these activities.
|
Adjusted EBITDA for the quarters ended June 30, 2010, September 30, 2010 and December 31, 2010 were revised to reflect prior period financial statement errors. See Note 1 and Note 26 of the Notes to Consolidated Financial Statements for further discussion on the revisions.
Our interest expense coverage ratio for the four fiscal quarters ended March 31, 2011 was 6.29, which exceeded the minimum requirement of 3.00. The following table presents a calculation of our interest expense coverage ratio:
|
Four Quarters Ended
March 31, 2011
|
||||
|
Consolidated interest expense
|
$ | 33,723 | ||
|
Less: Prepayment penalty classified as interest
|
(16,570 | ) | ||
|
Plus: Other items (a)
|
145 | |||
|
Total consolidated interest expense
|
$ | 17,298 | ||
|
Adjusted EBITDA
|
$ | 108,831 | ||
|
Interest expense coverage ratio
|
6.29 | |||
|
(a)
|
Other items include line of credit fees and costs associated with the sale of receivables.
|
Our leverage ratio for the four fiscal quarters ended March 31, 2011 was 1.54, which was below the maximum allowed ratio of 3.25. The following table presents a calculation of our leverage ratio:
|
Four Quarters Ended
March 31, 2011
|
||||
|
Debt per balance sheet
|
$ | 147,669 | ||
|
Less: Net commodity derivative assets
|
(279 | ) | ||
|
Plus: Indebtedness attributed to sales of accounts receivable
|
17,934 | |||
|
Standby letters of credit
|
2,275 | |||
|
Total consolidated debt
|
$ | 167,599 | ||
|
Adjusted EBITDA
|
$ | 108,831 | ||
|
Leverage ratio
|
1.54 | |||
We expect to remain in compliance with the interest expense coverage ratio covenant and leverage ratio covenant during fiscal 2012 and beyond.
At March 31, 2011, we had capital expenditure commitments of $21.1 million. Significant commitments include tooling and equipment expenditures for new and renewal platforms with new and current customers in Europe and North America as well as new program launches in Asia.
Outstanding indebtedness increased $8.5 million to $147.7 million at March 31, 2011 from the March 31, 2010 balance of $139.2 million, primarily as a result of the costs associated with the debt refinancing. Our cash balance of $32.9 million at March 31, 2011 is $10.8 million lower than the $43.7 million balance at March 31, 2010.
We believe that our internally generated operating cash flows, working capital management efforts and existing cash balances, together with access to available external borrowings, will be sufficient to satisfy future operating costs and capital expenditures.
Off-Balance Sheet Arrangements
None.
Contractual Obligations
|
(in thousands)
|
March 31, 2011
|
|||||||||||||||||||
|
Total
|
Less than 1 year
|
1 - 3 years
|
4 - 5 years
|
More than 5 years
|
||||||||||||||||
|
Long-term debt
|
$ | 131,500 | $ | - | $ | - | $ | 6,500 | $ | 125,000 | ||||||||||
|
Interest associated with long-term debt
|
73,597 | 8,749 | 17,498 | 17,128 | 30,222 | |||||||||||||||
|
Capital lease obligations
|
7,344 | 262 | 622 | 632 | 5,828 | |||||||||||||||
|
Operating lease obligations
|
17,810 | 4,198 | 5,073 | 2,828 | 5,711 | |||||||||||||||
|
Capital expenditure commitments
|
21,080 | 18,124 | 2,952 | 4 | - | |||||||||||||||
|
Other long-term obligations
|
11,084 | 1,183 | 2,365 | 2,365 | 5,171 | |||||||||||||||
|
Total contractual obligations
|
$ | 262,415 | $ | 32,516 | $ | 28,510 | $ | 29,457 | $ | 171,932 | ||||||||||
Interest for the revolving credit facility is calculated using a weighted average interest rate of 3.25 percent. Interest for the 2020 Notes was calculated using the contractual interest rate of 6.83 percent.
The capital expenditure commitments consist primarily of tooling and equipment expenditures for new and renewal platforms with new and current customers on a global basis.
Our gross liability for uncertain tax positions and pension obligations were $5.3 million and $63.9 million, respectively, as of March 31, 2011. We are unable to determine the ultimate timing of these liabilities and have therefore excluded these amounts from the contractual obligations table above.
Net Cash Provided by Operating Activities
Net cash provided by operating activities in fiscal 2011 was $20.8 million which decreased $41.1 million from the prior year of $61.9 million, driven by a $17.9 million contribution to our U.S. pension plans, the $16.6 million prepayment penalty related to the pay-off of our then outstanding senior notes in the second quarter of fiscal 2011 and the investment in working capital balances. The most significant change in operating assets and liabilities was a $43.0 million increase in accounts receivable based on an increase in net sales of $72.0 million for the fourth quarter of fiscal 2011 as compared to the same quarter of fiscal 2010. This was partially offset by a $30.0 million increase in accounts payable.
Net cash provided by operating activities in fiscal 2010 was $61.9 million which decreased $31.6 million from the prior year of $93.5 million, driven by an increase in working capital consistent with the modest growth in volumes throughout fiscal 2010. The most significant change in operating assets and liabilities contributing to the overall decrease in cash provided by operating activities in fiscal 2010 was a $51.8 million increase in accounts receivable based on an increase in net sales of $70.1 million for the fourth quarter of fiscal 2010 as compared to the same quarter for fiscal 2009.
Capital Expenditures
Capital expenditures were $55.1 million for fiscal 2011, which was $5.2 million lower than the prior year. The primary spending occurred in the Original Equipment – Europe segment, which totaled $25.0 million, the Original Equipment – North America segment, which totaled $11.3 million and the Original Equipment – Asia segment, which totaled $10.8 million. Capital spending in fiscal 2011 included tooling and equipment purchases in conjunction with new global program launches with new and current customers in Europe, Asia and North America.
Capital expenditures were $60.3 million for fiscal 2010, which was $43.0 million lower than the prior year. The primary spending occurred in the Original Equipment – Europe segment, which totaled $36.6 million, the Original Equipment – North America segment, which totaled $12.9 million and the Original Equipment – Asia segment, which accounted for $8.0 million in capital spending. Capital spending in fiscal 2010 included tooling and equipment purchases in conjunction with new global program launches with new and current customers in Europe, Asia and North America, along with completion of construction of new facilities in Asia and Europe.
Capital expenditures were $103.3 million for fiscal 2009, which was $13.9 million higher than the prior year. The primary spending occurred in the Original Equipment – North America segment, which totaled $25.9 million, the Original Equipment – Europe segment, which totaled $54.5 million and the Original Equipment – Asia segment, which accounted for $16.0 million in capital spending. The increase in capital expenditures primarily related to tooling and equipment purchases in conjunction with new global program launches with new and current customers in Europe, Asia and North America, along with the construction of new facilities in Asia and Europe.
Proceeds from the Sale of Assets Held for Sale and Discontinued Operations
Modine received net cash proceeds of $8.8 million for the sale of three held for sale facilities in the Original Equipment – Europe and Original Equipment – North America segments during fiscal 2011. Modine received net cash proceeds of $10.5 million for the sale of the shares of its South Korea-based HVAC business during fiscal 2010. Modine received cash of $10.6 million and subordinated promissory notes totaling $2.5 million for the sale of the assets of its Electronics Cooling business during fiscal 2009. Refer to Note 10 and Note 12 of the Notes to Consolidated Financial Statements for further discussion of these divestitures.
Proceeds from the Disposition of Assets
In fiscal 2011, the Company received proceeds from disposition of assets of $3.7 million.
In fiscal 2010, the Company sold its 50 percent ownership of Anhui Jianghaui Mando Climate Control Co. Ltd. for $4.9 million, and the Company received $3.8 million from the disposition of other assets.
In fiscal 2009, the Company received proceeds from disposition of assets of $7.1 million, including approximately $3.7 million from the sale of a corporate aircraft and $3.4 million from the sale of other assets.
Changes in Total Debt
In fiscal 2011, total debt increased $8.5 million driven primarily by the costs related to the refinancing of long-term notes. Domestically, debt increased $2.5 million while international debt increased $6.0 million primarily in support of Asian growth.
In fiscal 2010, total debt decreased $110.0 million, primarily from the proceeds from the common stock offering and the sale of our South Korea-based HVAC business. Domestically, debt decreased by $107.6 million. International debt decreased by $2.4 million during fiscal 2010 through reductions in short-term borrowings at the foreign subsidiaries.
In fiscal 2009, total debt increased $24.7 million primarily from new borrowings in North America. Domestically, debt grew by $18.0 million with borrowings on the revolving credit facility used primarily to fund capital expenditures. International debt increased $6.7 million during fiscal 2009 through short-term borrowings at the foreign subsidiaries.
Common Stock and Treasury Stock
On September 30, 2009, the Company completed a public offering of 13.8 million shares of its common stock at a price of $7.15 per share. Cash proceeds were $92.9 million after deducting underwriting discounts, commissions, legal, accounting and printing fees of $5.8 million.
The Company repurchased approximately 5,000 common shares of treasury at a cost of $0.08 million and $0.03 million in fiscal 2011 and 2010, respectively. The Company repurchased approximately 54,000 common shares for treasury at a cost of $0.6 million in fiscal 2009. Common stock and treasury stock activity is further detailed in Note 21 of the Notes to Consolidated Financial Statements.
Dividends
The Company paid no dividends in fiscal 2011 and 2010. Prior debt agreements prohibited the payment of dividends. The amended credit agreements allow for an aggregate amount of restricted payments, including cash dividends, based on the leverage ratio being less than 3.0 to 1.0. Based on the leverage ratio for the four fiscal quarters ending March 31, 2011, the Company was allowed to make restricted payments up to $15.0 million. If the leverage ratio remains less than 3.0 to 1.0 for fiscal 2012, the Company would be allowed to make restricted payments to $25.0 million. Dividends paid on our common stock were $9.7 million for fiscal 2009. The effective dividend rates paid was 30 cents per share for fiscal 2009.
Settlement of Derivative Contracts
The Company entered into future contracts related to forecasted purchases of aluminum, copper and natural gas that are treated as cash flow hedges. Unrealized gains and losses on these contracts are deferred as a component of accumulated other comprehensive (loss) income, and recognized as a component of earnings at the same time that the underlying purchases of aluminum, copper and natural gas impact earnings. During fiscal 2011, the amount of expense recorded in cost of sales related to the settlement of certain futures contracts was negligible. During fiscal 2010 and 2009, $5.9 million and $4.5 million of expense, respectively, was recorded in cost of sales related to the settlement of certain futures contracts. At March 31, 2011, $0.3 million of unrealized gains remain deferred in other comprehensive (loss) income, and will be realized as a component of cost of sales over the next 51 months. The Company previously entered into future contracts related to forecasted purchases of copper and nickel which are not designated as cash flow hedges. Therefore, gains and losses on these contracts are recorded directly in the consolidated statement of operations. There was no income or expense recorded in fiscal 2011 or fiscal 2010 related to future contracts for copper or nickel. During fiscal 2009, $4.4 million of expense was recorded in cost of sales related to these future contracts. In fiscal 2009, the Company also entered into zero cost collars to offset the foreign exchange exposure on inter-company loans. These contracts were not designated as hedges; accordingly transaction gains and losses on the derivatives are recorded in other income – net in the consolidated statement of operations. During fiscal 2009, $1.4 million of income was recorded to other income – net in the consolidated statement of operations related to these zero cost collars. The Company did not enter into zero cost collars to offset foreign exchange exposure on inter-company loans during fiscal 2010 or fiscal 2011.
In fiscal 2007, the Company entered into two forward-starting swaps in anticipation of a $75.0 million private placement debt offering that occurred on December 7, 2006. These swaps were settled during fiscal 2007 with a loss of $1.8 million being recorded. This loss was reflected as a component of accumulated other comprehensive (loss) income and is being amortized to interest expense over the respective lives of the debt offerings. During fiscal 2011, 2010 and 2009, $1.8 million, $0.9 million and $0.3 million of this loss, respectively, was recognized as interest expense. The expense for fiscal 2011 includes a $1.6 million amortization of the remaining unamortized balance for these interest rate derivatives in conjunction with the repayment of the 2015 and 2017 notes on August 12, 2010. The expense for fiscal 2010 includes $0.5 million of amortization in proportion with the mandatory prepayment of the senior notes on September 30, 2009.
Research and Development
We focus our R&D efforts on solutions that meet the most current and pressing heat transfer needs, as well as the anticipated future heat transfer needs, of OEMs and other customers within the commercial vehicle, construction, agricultural and commercial HVAC industries and, more selectively, within the automotive industry. Our products and systems typically are aimed at solving difficult and complex heat transfer challenges requiring advanced thermal management. The typical demands are for products and systems that are lighter weight, more compact, more efficient and more durable in nature to meet ever increasing customer standards as customers work to ensure compliance with increasingly stringent global emissions and energy efficiency requirements. Our Company’s heritage includes depth and breadth of expertise in thermal management that, combined with our global manufacturing presence, standardized processes, and state-of-the-art technical centers and wind tunnels, enables us to rapidly bring customized solutions to customers at the best value.
Our investment in R&D in fiscal 2011 was $67.0 million, or 4.6 percent of sales, compared to $56.9 million, or 4.9 percent of sales, in fiscal 2010. This level of investment reflects the Company’s continued commitment to R&D in an ever-changing market, balanced with a near-term focus on more selective capital investment. Consistent with the streamlining of the Company’s product portfolio, our current research is focused primarily on company-sponsored development in the areas of powertrain cooling, engine products and residential and commercial HVAC products.
Recent R&D projects have included development of waste heat recovery systems for major U.S.-based engine and truck manufacturers in conjunction with the U.S. Department of Energy to help these manufacturers meet ever increasing demands for emissions reduction, while simultaneously improving powertrain efficiency and, thus, fuel economy; next generation aluminum radiators for the commercial vehicle, agricultural and constructions markets; and EGR technology, which enables our customers to efficiently meet tighter regulatory emissions standards.
Through our proactive R&D, we are developing new technologies designed to keep our customers within federal and international guidelines and regulations well into the future. We continue to identify, evaluate and engage in external research projects that complement strategic internal research initiatives, some of which are government-sponsored, in order to further leverage the Company’s significant thermal technology expertise and capability.
Modine has been granted more than 2,000 worldwide patents over the life of the Company. Modine is focused on the long-term commercialization of our intellectual property and research, and believes that these investments will result in new and next generation products and technologies.
Critical Accounting Policies
The following critical accounting policies reflect the more significant judgments and estimates used in preparing the financial statements. Application of these policies results in accounting estimates that have the greatest potential for a significant impact on Modine's financial statements. The following discussion of these judgments and estimates is intended to supplement the Significant Accounting Policies presented in Note 1 of the Notes to Consolidated Financial Statements.
Revenue Recognition
The Company recognizes revenue, including agreed upon commodity price increases, as products are shipped to customers and the risks and rewards of ownership are transferred to our customers. The revenue is recorded net of applicable provisions for sales rebates, volume incentives, and returns and allowances. At the time of revenue recognition, the Company also provides an estimate of potential bad debts and warranty expense. The Company bases these estimates on historical experience, current business trends and current economic conditions. The Company recognizes revenue from various licensing agreements when earned except in those cases where collection is uncertain, or the amount cannot reasonably be estimated until formal accounting reports are received from the licensee.
Contractual commodity price increases may also be included in revenue. Price increases agreed upon in advance are recognized as revenue when the products are shipped to our customers. In certain situations, the price increases are recognized as revenue at the time products are shipped in accordance with the contractual arrangements with our customers, but are offset by appropriate provisions for estimated commodity price increases which may ultimately not be collected. These provisions are established based on historical experience, current business trends and current economic conditions. There was no provision for estimated commodity price increases at March 31, 2011 and 2010.
Impairment of Long-Lived and Amortized Intangible Assets
The Company performs impairment evaluations of its long-lived assets, including property, plant and equipment, intangible assets with finite lives and equity investments, whenever business conditions or events indicate that those assets may be impaired. The Company considers factors such as operating losses, declining outlooks and market capitalization when evaluating the necessity for an impairment analysis. When the estimated future undiscounted cash flows to be generated by the assets are less than the carrying value of the long-lived assets, or the decline in value is considered to be “other than temporary”, the assets are written down to fair market value and a charge is recorded to current operations. Fair market value is estimated in various ways depending on the nature of the assets under review. This value can be based on appraised value, estimated salvage value, sales price under negotiation or estimated cancellation charges, as applicable. The Company recorded long-lived asset and equity investment impairment charges of $3.5 million, $6.5 million and $34.7 million during fiscal 2011, 2010 and 2009, respectively.
The most significant long-lived assets that have been subject to impairment evaluations are the Company’s net property, plant and equipment, which totaled $430.3 million at March 31, 2011. Within property, plant and equipment, the most significant assets evaluated are buildings and improvements, and machinery and equipment. The Company evaluates impairment at the lowest level of separately identifiable cash flows, which is generally at the manufacturing plant level. The Company monitors its manufacturing plant performance to determine whether indicators exist that would require an impairment evaluation for the facility. This includes significant adverse changes in plant profitability metrics; substantial changes in the mix of customer programs manufactured in the plant, consisting of new program launches, reductions, and phase-outs; and shifting of programs to other facilities under the Company’s manufacturing realignment strategy. When such indicators are present, the Company performs an impairment evaluation by comparing the estimated future undiscounted cash flows expected to be generated in the manufacturing facility to the net book value of the long-lived assets within that facility. The undiscounted cash flows are estimated based on the expected future cash flows to be generated by the manufacturing facility over the remaining useful life of the machinery and equipment within that facility. When the estimated future undiscounted cash flows are less than the net book value of the long-lived assets, such assets are written down to fair market value, which is generally estimated based on appraisals or estimated salvage value.
The majority of the long-lived asset impairment charges during fiscal 2011, 2010 and 2009 have been recorded within the Company’s Original Equipment – Europe and Original Equipment – North America segments. These segments have experienced the most significant adverse impact of sales volume declines and changing mix of programs within the manufacturing facilities. In addition, these segments had program phase-outs and cancellations, many of which were in the automotive markets. Further unanticipated adverse changes in these segments could result in the need to perform additional impairment evaluations in the future.
The Company’s cost and operational efficiency measures are designed to attain a more competitive cost base and improve the Company’s longer term competitiveness reduces the risk of potential long-lived asset impairment charges in the future. The manufacturing realignment strategy of this plan was designed to improve the utilization of the Company’s facilities, with fewer facilities, but operating at higher capacities. The portfolio rationalization strategy of this plan was designed to identify products where the Company can earn a sufficient return on its investment, and divest or exit products that do not meet required metrics. Recent portfolio rationalization actions include de-emphasis on automotive module business, primarily within Europe. These strategies create better facility utilization and greater profitability in product mix, which allow the manufacturing facilities to withstand more significant adverse changes before an impairment charge is necessary.
Impairment of Goodwill and Indefinite-Lived Intangible Assets
Impairment tests are conducted at least annually unless business events or other conditions exist that would require a more frequent evaluation. The Company considers factors such as operating losses, declining outlooks and market capitalization when evaluating the necessity for an impairment analysis. In fiscal 2011, the annual review of goodwill and other intangible assets with indefinite lives for impairment was conducted in the third quarter resulting in no impairment charge. Subsequently, the Company changed the date of its annual goodwill impairment test to the fourth quarter to better align with its annual and long-term planning process. As a result, the Company performed the impairment test as of March 31, 2011, which resulted in no impairment charge. The recoverability of goodwill and other intangible assets with indefinite lives is determined by estimating the future discounted cash flows of the reporting unit to which the goodwill and other intangible assets with indefinite lives relates. The rate used in determining discounted cash flows is a rate corresponding to our cost of capital, adjusted for risk where appropriate. In determining the estimated future cash flows, current and future levels of income are considered as well as business trends and market conditions. To the extent that book value exceeds the fair value, an impairment is recognized. During fiscal 2009 it was determined that the Original Equipment – Europe segment goodwill was fully impaired, necessitating a charge of $9.0 million
At March 31, 2011 the Company had goodwill of $31.6 million recorded which was primarily comprised of $15.1 million within the South America segment and $15.9 million within the Commercial Products segment. The South America and Commercial Products segments reported operating income of $13.0 million and $17.5 million for fiscal 2011 compared to $7.6 million and $19.2 million for fiscal 2010, respectively. The future discounted cash flows of these segments continue to substantially exceed their carrying value indicating that the goodwill recorded in these segments is fully realizable at March 31, 2011. If, in future periods, these segments experience a significant unanticipated economic downturn in the markets in which they operate, this would require an impairment review.
Warranty
Estimated costs related to product warranties are accrued at the time of the sale and recorded in cost of sales. Estimated costs are based on the best information available, which includes using statistical and analytical analysis of both historical and current claim data. Original estimates, accrued at the time of sale, are adjusted when it becomes probable that expected claims will differ materially from these initial estimates.
Tooling Costs
Pre-production tooling costs incurred by the Company in manufacturing products under various customer programs are capitalized as a component of property, plant and equipment, net of any customer reimbursements, when the Company retains title to the tooling. These costs are amortized over the program life and are recorded in cost of sales in the consolidated statements of operations. For customer-owned tooling costs incurred by the Company, a receivable is recorded when the customer has guaranteed reimbursement to the Company. The reimbursement period may vary by program and customer. No significant arrangements existed during the years ended March 31, 2011 and 2010 where customer-owned tooling costs were not accompanied by guaranteed reimbursements.
Assets Held for Sale
Assets or businesses are considered to be held for sale when management approves and commits to a formal plan to actively market the assets or business for sale at a price reasonable in relation to its fair value, the asset or business is available for immediate sale in its present condition, the sale of the asset or business is probable and expected to be completed within one year and it is unlikely that significant changes will be made to the plan. Upon designation as held for sale, the carrying value of the assets of the business are recorded at the lower of their carrying value or their estimated fair value, less costs to sell. The Company ceases to record depreciation expense at the time of designation as held for sale. Certain facilities which the Company has closed or intends to close and are currently marketing for sale were classified as held for sale at March 31, 2011 and 2010.
Pensions and Postretirement Benefits Plans
The calculation of the expense and liabilities of Modine's pension and postretirement plans is dependent upon various assumptions. The most significant assumptions include the discount rate, long-term expected return on plan assets, and future trends in healthcare costs. The selection of assumptions is based on historical trends and known economic and market conditions at the time of valuation. In accordance with generally accepted accounting principles, actual results that differ from these assumptions are accumulated and amortized over future periods. These differences may impact future pension or postretirement benefit expenses and liabilities. The Company replaced the existing domestic defined benefit pension plan with a defined contribution plan for salaried-paid employees hired on or after January 1, 2004. The Modine Manufacturing Company Pension Plan for Non-Hourly Factory and Salaried Employees was modified so that no service performed for salaried employees after March 31, 2006 would be counted when calculating an employee’s years of credited service under the pension plan formula and no increases in annual earnings for salaried employees after December 31, 2007 would be included in calculating the average annual portion under the pension plan formula. The plan was further modified so that no increases in annual earnings and no service performed for non-union hourly factory employees after December 31, 2011 will be included in calculating the average annual earnings and years of credit service under the pension plan formula. We believe the current defined contribution plan for domestic employees will, in general, allow the Company a greater degree of flexibility in managing retirement benefit costs on a long-term basis.
For the following discussion regarding sensitivity of assumptions, all amounts presented are in reference to the domestic pension plans since the domestic plans comprise 100 percent of the Company’s total benefit plan assets and the large majority of the Company’s pension plan expense.
To determine the expected rate of return, Modine considers such factors as (a) the actual return earned on plan assets, (b) historical rates of returns on the various asset classes in the plan portfolio, (c) projections of returns on those asset classes, (d) the amount of active management of the assets, (e) capital market conditions and economic forecasts, and (f) administrative expenses covered by the plan assets. The long-term rate of return utilized in fiscal 2011 and fiscal 2010 was 8.10 percent and 7.90 percent, respectively. For fiscal 2012, the Company has assumed a rate of 8.00 percent. The impact of a 25 basis point decrease in the expected rate of return on assets would result in a $0.5 million increase in fiscal 2012 pension expense.
The discount rate reflects rates available on long-term, high quality fixed-income corporate bonds, reset annually on the measurement date of March 31. For fiscal 2011, the Company used a discount rate of 5.83 percent, reflecting a slight decrease from 5.93 percent in fiscal 2010. The Company based this decision on a yield curve that was created following an analysis of the projected cash flows from the affected plans. See Note 3 of the Notes to Consolidated Financial Statements for additional information. Changing Modine’s discount rate by 25 basis points would impact the fiscal 2012 domestic pension expense by approximately $0.5 million.
A key determinant in the amount of the postretirement benefit obligation and expense is the healthcare cost trend rate. The healthcare trend rate for fiscal year 2011 was 8.0 percent, and the Company expects this to be 8.0 percent for fiscal 2012. This rate is projected to decline gradually to 5 percent in fiscal year 2017 and remain at that level thereafter. An annual "cap" that was established for most retiree healthcare and life insurance plans between fiscal 1994 and 1996 limits Modine’s liability. Beginning in February 2002, the Company discontinued providing postretirement benefits for salaried and non-union employees hired on or after that date. Furthermore, effective January 1, 2009, the plan was modified to eliminate coverage for retired participants that are Medicare eligible. A one percent increase in the healthcare trend rate would result in no substantial increase in postretirement expense and an increase in postretirement benefit obligations of approximately $0.2 million.
Other Loss Reserves
The Company has a number of other loss exposures, such as environmental and product liability claims, trade compliance, litigation, self-insurance reserves, recoverability of deferred income tax benefits, and accounts receivable loss reserves. Establishing loss reserves for these matters requires the use of estimates and judgment to determine the risk exposure and ultimate potential liability. The Company estimates these reserve requirements by using consistent and suitable methodologies for the particular type of loss reserve being calculated. See Note 25 of the Notes to Consolidated Financial Statements for additional details of certain contingencies and litigation.
Forward-Looking Statements
This report, including, but not limited to, the discussion under “Outlook” under Item 7. Management’s Discussion and Analysis of Financial Condition and Results of Operations, contains statements, including information about future financial performance, accompanied by phrases such as “believes,” “estimates,” “expects,” “plans,” “anticipates,” “intends,” and other similar “forward-looking” statements, as defined in the Private Securities Litigation Reform Act of 1995. Modine’s actual results, performance or achievements may differ materially from those expressed or implied in these statements, because of certain risks and uncertainties, including, but not limited to, those described under “Risk Factors” in Item 1A. in Part I. in this report. Other risks and uncertainties include, but are not limited to, the following:
Operational Risks:
|
·
|
The efficient deployment of resources to meet increasing demand for the Company’s products;
|
|
·
|
The impact of operational inefficiencies as a result of program launches and product transfers;
|
|
·
|
Modine’s ability to maintain current programs and compete effectively for new business, including its ability to offset or otherwise address increasing pricing pressures from its competitors and price reduction pressures from its customers;
|
|
·
|
Costs and other effects of the remediation of environmental contamination;
|
|
·
|
Modine’s ability to obtain profitable business at its facilities in the low cost countries of China, Hungary, Mexico and India and to meet quality standards with products produced at these facilities;
|
|
·
|
Unanticipated problems with suppliers meeting Modine’s time, quality and price demands;
|
|
·
|
Modine’s ability to successfully implement restructuring plans and drive cost reductions and increased gross margins as a result;
|
|
·
|
Unanticipated delays or modifications initiated by major customers with respect to product applications or requirements;
|
|
·
|
Unanticipated product or manufacturing difficulties, including unanticipated launch challenges and warranty claims;
|
|
·
|
Work stoppages or interference at Modine’s facilities or those of its major customers and/or suppliers;
|
|
·
|
The possibility that other or more significant issues may be identified in connection with reviews by government agencies related to trade compliance matters at the Company’s Laredo, Texas warehouse and Nuevo Laredo Mexico facility; and
|
|
·
|
Costs and other effects of unanticipated litigation or claims, and the increasing pressures associated with rising healthcare and insurance costs.
|
Market Risks:
|
·
|
Economic, social and political conditions, changes and challenges in the markets where Modine operates and competes (including currency exchange rate fluctuations (particularly the value of the euro relative to the U.S. dollar), tariffs, inflation, changes in interest rates, recession, and restrictions associated with importing and exporting and foreign ownership);
|
|
·
|
The impact on Modine of increases in commodity prices, particularly Modine’s exposure to the changing prices of aluminum, copper, steel and stainless steel (nickel);
|
|
·
|
Modine’s ability or inability to pass increasing commodity prices on to customers as well as the inherent lag in timing of such pass-through pricing; and
|
|
·
|
The impact of environmental laws and regulations on Modine’s business and the business of Modine’s customers, including Modine’s ability to take advantage of opportunities to supply alternative new technologies to meet environmental emissions standards.
|
|
Financial Risks:
|
|
·
|
Modine’s ability to fund its liquidity requirements and meet its long-term commitments in the event of any renewed disruption in the credit markets; and
|
|
·
|
Modine’s ability to realize future tax benefits.
|
In addition to the risks set forth above, Modine is subject to other risks and uncertainties identified by the Company in public filings with the U.S. Securities and Exchange Commission. Modine does not assume any obligation to update any forward-looking statements.
In the normal course of business, Modine is subject to market exposure from changes in foreign exchange rates, interest rates, credit risk, economic risk and commodity price risk.
Foreign Currency Risk
Modine is subject to the risk of changes in foreign currency exchange rates due to its operations in foreign countries. Modine has manufacturing facilities in Brazil, China, Mexico, South Africa, India and throughout Europe. It also has an equity investment in a Japanese company. Modine sells and distributes its products throughout the world. As a result, the Company's financial results could be significantly affected by factors such as changes in foreign currency exchange rates or weak economic conditions in the foreign markets in which the Company manufactures, distributes and sells its products. The Company attempts to mitigate foreign currency risks on transactions with customers and suppliers in foreign countries by entering into contracts that are denominated in the functional currency of the Modine entity engaging in the contract. The Company's operating results are principally exposed to changes in exchange rates between the U.S. dollar and the European currencies, primarily the euro, and changes between the U.S. dollar and the Brazilian real. Changes in foreign currency exchange rates for the Company's foreign subsidiaries reporting in local currencies are generally reported as a component of shareholders' equity. Weakening of the U.S. dollar to other foreign currencies during fiscal 2011, especially the euro and real, has led to improvement of the Company’s foreign results. This improvement is evident in the Company’s favorable currency translation adjustments of $17.0 million recorded in fiscal 2011. In fiscal 2010, the Company also experienced a general weakening of the U.S. dollar to these foreign currencies, which resulted in a favorable currency translation adjustment of $22.9 million. As of March 31, 2011 and 2010, the Company's foreign subsidiaries had net current assets (defined as current assets less current liabilities) subject to foreign currency translation risk of $91.2 million and $88.5 million, respectively. The potential decrease in the net current assets from a hypothetical 10 percent adverse change in quoted foreign currency exchange rates would be approximately $9.1 million. This sensitivity analysis presented assumes a parallel shift in foreign currency exchange rates. Exchange rates rarely all move in the same direction relative to the U.S. dollar. This assumption may overstate the impact of changing exchange rates on individual assets and liabilities denominated in a foreign currency.
The Company has, from time to time, certain foreign-denominated, long-term debt obligations and long-term inter-company loans that are sensitive to foreign currency exchange rates. As of March 31, 2011 there were no third-party foreign-denominated, long-term debt obligations. The Company has inter-company loans outstanding at March 31, 2011 as follows:
|
·
|
$15.6 million among three loans to its wholly owned subsidiary, Modine Thermal Systems India, with various maturity dates on or after April 30, 2013;
|
|
·
|
$12.0 million between two loans to its wholly owned subsidiary, Modine Thermal Systems Co (Changzhou, China), with various maturity dates through June 2012;
|
|
·
|
$15.6 million to its wholly owned subsidiary, Modine Holding GmbH, that matures on January 31, 2020;
|
|
·
|
$0.3 million to its wholly owned subsidiary, Modine Thermal Systems Korea, that matures on April 19, 2012.
|
These inter-company loans are sensitive to movement in foreign exchange rates, and the Company did not have any derivative instruments that hedge this exposure at March 31, 2011. The Company has, from time to time, entered into currency rate derivatives to manage the fluctuation in foreign exchange rate exposure on these loans. These derivative instruments have typically not been treated as hedges, and accordingly, gains or losses on the derivatives are recorded in other (income) expense – net in the consolidated statement of operations and act to offset any currency movement on the outstanding loan receivable.
Interest Rate Risk
Modine's interest rate risk policies are designed to reduce the potential volatility of earnings that could arise from changes in interest rates. The Company generally utilizes a mixture of debt maturities together with both fixed-rate and floating-rate debt to manage its exposure to interest rate variations related to its borrowings. The domestic revolving credit facility is based on a variable interest rate of London Interbank Offered Rate (“LIBOR”) plus 250 to 375 basis points depending upon the Company’s Consolidated Total Debt to Consolidated Adjusted Earnings before Interest, Taxes, Depreciation and Amortization ratio (leverage ratio) for the four preceding fiscal quarters. As of March 31, 2011, the Company’s variable interest rate was LIBOR plus 300 basis points or 3.25 percent. The Company is subject to future fluctuations in LIBOR and changes in its leverage ratio, which would affect the variable interest rate on the revolving credit facility and create variability in interest expense. The Company has, from time to time, entered into interest rate derivatives to manage variability in interest rates. These interest rate derivatives were treated as cash flow hedges of forecasted transactions. Accordingly, the losses were reflected as a component of accumulated other comprehensive (loss) income, and were being amortized to interest expense over the respective lives of the borrowings. During the fiscal year ended March 31, 2011, $1.8 million of expense was recorded in the consolidated statements of operations related to the amortization of interest rate derivative losses, which includes the remaining unamortized balance of these interest rate derivatives of $1.6 million in conjunction with the repayment of the Company’s then outstanding senior notes on August 12, 2010. In fiscal year 2010 $0.9 million of expense was recorded in the consolidated statements of operations related to the amortization of interest rate derivative losses, which includes $0.5 million of amortization in proportion with the mandatory prepayment of the senior notes on September 30, 2009 related to the Company’s common stock offering. There were no remaining net unrealized losses deferred in accumulated other comprehensive (loss) income at March 31, 2011. The following table presents the future principal cash flows and weighted average interest rates by expected maturity dates for our long-term debt. The fair value of the long-term debt is estimated by discounting the future cash flows at rates offered to the Company for similar debt instruments of comparable maturities. The book value of the debt approximates fair value, with the exception of the $125.0 million fixed rate notes, which have a fair value of approximately $121.5 million at March 31, 2011.
As of March 31, 2011, long-term debt matures as follows:
|
Years ending March 31
|
||||||||||||||||||||||||||||
|
Expected Maturity Date
|
||||||||||||||||||||||||||||
|
(dollars in thousands)
|
2012
|
2013
|
2014
|
2015
|
2016
|
Thereafter
|
Total
|
|||||||||||||||||||||
|
Fixed rate (U.S. dollars)
|
- | - | - | - | - | $ | 125,000 | $ | 125,000 | |||||||||||||||||||
|
Average interest rate
|
- | - | - | - | - | 6.83 | % | |||||||||||||||||||||
|
Variable rate (U.S. dollars)
|
- | - | - | $ | 6,500 | - | - | $ | 6,500 | |||||||||||||||||||
|
Average interest rate
|
- | - | - | 3.25 | % | - | - | |||||||||||||||||||||
Credit Risk
Credit risk is the possibility of loss from a customer's failure to make payment according to contract terms. The Company's principal credit risk consists of outstanding trade receivables. Prior to granting credit, the Company evaluates each customer, taking into consideration the customer's financial condition, payment experience and credit information. After credit is granted, the Company actively monitors the customer's financial condition and developing business news. Approximately 48 percent of the trade receivables balance at March 31, 2011 was concentrated with the Company's top ten customers. Modine's history of incurring credit losses from customers has not been material, and the Company does not expect that trend to change. However, the current economic uncertainty, especially within the global automotive and commercial vehicle markets, makes it difficult to predict future financial conditions of significant customers within these markets. Deterioration in the financial condition of a significant customer could have a material adverse effect on the Company’s results of operations and liquidity.
The adverse events in the global financial markets in recent years also increased credit risks on investments to which Modine is exposed or where Modine has an interest. The Company manages these credit risks through its focus on the following:
|
·
|
Cash and investments – Cash deposits and short-term investments are reviewed to ensure banks have credit ratings acceptable to the Company and that all short-term investments are maintained in secured or guaranteed instruments. The Company’s holdings in cash and investments were considered stable and secure at March 31, 2011;
|
|
·
|
Pension assets – The Company has retained outside advisors to assist in the management of the assets in the Company’s defined benefit plans. In making investment decisions, the Company has been guided by an established risk management protocol that focuses on protection of the plan assets against downside risk. The Company monitors investments in its pension plans to ensure that these plans provide appropriate diversification, investment teams and portfolio managers are adhering to the Company’s investment policies and directives, and exposure to high risk securities and other similar assets is limited. The Company believes it has appropriate investment policies and controls and proactive investment advisors; and
|
|
·
|
Insurance – The Company monitors its insurance providers to ensure that they have acceptable financial ratings. The Company has not identified any concerns in this regard through its review.
|
Economic Risk
Economic risk is the possibility of loss resulting from economic instability in certain areas of the world or significant downturns in markets that the Company supplies. The Company sells a broad range of products that provide thermal solutions to a diverse group of customers operating primarily in the truck, heavy equipment, automotive and commercial heating and air conditioning markets. The adverse events in the global economy over the last two years created a significant downturn in the Company’s vehicular markets and to a lesser extent in its commercial heating and air conditioning markets. The current economic uncertainty makes it difficult to predict future conditions within these markets. A sustained economic downturn in any of these markets could have a material adverse effect on the future results of operations or the Company’s liquidity and potentially result in the impairment of related assets. The Company is responding to these market conditions through the implementation of cost and operational efficiency measures, including manufacturing realignment, portfolio rationalization, SG&A expense reduction and capital allocation discipline.
The Company monitors economic conditions in the U.S. and elsewhere. As Modine expands its global presence, it also encounters risks imposed by potential trade restrictions, including tariffs, embargoes and the like. The Company continues to pursue non-speculative opportunities to mitigate these economic risks, and capitalize, when possible, on changing market conditions.
The Company pursues new market opportunities after careful consideration of the potential associated risks and benefits. Successes in new markets are dependent upon the Company's ability to commercialize its investments. Current examples of new and emerging markets for Modine include those related to exhaust gas recirculation and waste heat recovery. Modine's investment in these areas is subject to the risks associated with business integration, technological success, customers' and market acceptance, and Modine's ability to meet the demands of its customers as these markets emerge.
The Company anticipates that continued recovery from the global recession and continued economic growth in China may put production pressure on certain of the Company's suppliers of raw materials. In particular, there are a limited number of suppliers of copper, steel and aluminum fin stock. The Company is exposed to the risk of supply of certain raw materials not being able to meet customer demand as suppliers may not increase their output capacity as quickly as customers increased their orders and of increased prices being charged by raw material suppliers.
In addition, the Company purchases parts from suppliers that use the Company's tooling to create the part. In most instances, and for financial reasons, the Company does not have duplicate tooling for the manufacture of its purchased parts. As a result, the Company is exposed to the risk of a supplier of such parts being unable to provide the quantity or quality of parts that the Company requires. Even in situations where suppliers are manufacturing parts without the use of Company tooling, the Company faces the challenge of obtaining high-quality parts from suppliers. The Company has implemented a supplier risk management program that utilizes inside and third-party tools to identify and mitigate high risk supplier situations.
In addition to the above risks on the supply side, the Company is also exposed to risks associated with demands by its customers for decreases in the price of the Company's products. The Company attempts to offset this risk with firm agreements with its customers whenever possible, but these agreements often carry price-down provisions.
The Company operates in diversified markets as a strategy for offsetting the risk associated with a downturn in any one or more of the markets it serves. However, the risks associated with any market downturn, including the recent global recession, are still present.
Commodity Price Risk
The Company is dependent upon the supply of certain raw materials and supplies in the production process and has, from time to time, entered into firm purchase commitments for copper, aluminum, nickel, and natural gas. The Company utilizes aluminum and copper hedging strategies from time to time by entering into fixed price contracts to help offset changing commodity prices. The Company also enters into forward contracts from time to time for certain forecasted nickel purchases. The Company does maintain agreements with certain customers to pass through certain material price fluctuations in order to mitigate the commodity price risk. The majority of these agreements contain provisions in which the pass-through of the price fluctuations can lag behind the actual fluctuations by a quarter or longer.
Hedging and Foreign Currency Exchange Contracts
The Company uses derivative financial instruments in a limited way as a tool to manage certain financial risks. Their use is restricted primarily to hedging assets and obligations already held by Modine, and they are used to protect cash flows rather than generate income or engage in speculative activity. Leveraged derivatives are prohibited by Company policy.
Commodity Derivatives: The Company enters into futures contracts from time to time related to certain of the Company’s forecasted purchases of aluminum, copper and natural gas. The Company’s strategy in entering into these contracts is to reduce its exposure to changing purchase prices for future purchase of these commodities. These contracts have been designated as cash flow hedges by the Company. Accordingly, unrealized gains and losses on these contracts are deferred as a component of accumulated other comprehensive (loss) income, and recognized as a component of earnings at the same time that the underlying purchases of aluminum and natural gas impact earnings. During the year ended March 31, 2011, the amount of income recorded n the consolidated statement of operations related to the settlement of certain futures contracts was negligible. During the year ended March 31, 2010, $5.9 million of expense was recorded in the consolidated statement of operations related to the settlement of certain futures contracts. At March 31, 2011, $0.3 million of unrealized gain remain deferred in accumulated other comprehensive (loss) income, and will be realized as a component of cost of sales over the next 51 months.
The Company has entered into futures contracts from time to time related to certain of the Company’s forecasted purchases of nickel. The Company’s strategy in entering into these contracts was to reduce its exposure to changing purchase prices for future purchases of this commodity, a component of stainless steel. The Company has not designated these contracts as hedges; therefore gains and losses on these contracts were recorded directly in the consolidated statement of operations.
Foreign exchange contracts: Modine has used derivative financial instruments, from time to time, in a limited way to mitigate foreign currency exchange risk. Modine periodically enters into foreign currency exchange contracts to hedge specific foreign currency-denominated transactions. Generally, these contracts have terms of 90 or fewer days. The effect of this practice is to minimize the impact of foreign exchange rate movements on Modine’s earnings. Modine’s foreign currency exchange contracts do not subject it to significant risk due to exchange rate movements because gains and losses on these contracts offset gains and losses on the assets and liabilities being hedged.
As of March 31, 2011, the Company had no outstanding forward foreign exchange contracts. Non-U.S. dollar financing transactions through inter-company loans or local borrowings in the corresponding currency generally are effective as hedges of long-term investments.
As of March 31, 2011, the Company has a number of investments in wholly owned foreign subsidiaries and a non-consolidated foreign joint venture. The net assets of these subsidiaries are exposed to currency exchange rate volatility. From time to time, the Company uses non-derivative financial instruments to hedge, or offset, this exposure.
Interest rate derivatives: As further noted above under the section entitled “Interest Rate Risk,” the Company has, from time to time, entered into interest rate derivatives to manage the variability in interest rates. These interest rate derivatives have been treated as cash flow hedges of forecasted transactions and, accordingly, derivative gains or losses are reflected as a component of accumulated other comprehensive (loss) income and are amortized to interest expense over the respective lives of the borrowings.
Counterparty risks: The Company manages counterparty risks by ensuring that counterparties to derivative instruments have credit ratings acceptable to the Company. At March 31, 2011, all counterparties had a sufficient long-term credit rating.
MODINE MANUFACTURING COMPANY
CONSOLIDATED STATEMENTS OF OPERATIONS
For the years ended March 31, 2011, 2010 and 2009
(In thousands, except per share amounts)
|
2011
|
2010
|
2009
|
||||||||||
|
Net sales
|
$ | 1,448,235 | $ | 1,162,576 | $ | 1,406,944 | ||||||
|
Cost of sales
|
1,216,868 | 990,844 | 1,220,766 | |||||||||
|
Gross profit
|
231,367 | 171,732 | 186,178 | |||||||||
|
Selling, general and administrative expenses
|
185,300 | 158,826 | 199,254 | |||||||||
|
Restructuring (income) charges
|
(275 | ) | (679 | ) | 30,404 | |||||||
|
Impairment of goodwill and long-lived assets
|
3,548 | 6,548 | 36,139 | |||||||||
|
Earnings (loss) from operations
|
42,794 | 7,037 | (79,619 | ) | ||||||||
|
Interest expense
|
33,723 | 22,888 | 13,775 | |||||||||
|
Other (income) expense – net
|
(3,624 | ) | (5,586 | ) | 9,946 | |||||||
|
Earnings (loss) from continuing operations before income taxes
|
12,695 | (10,265 | ) | (103,340 | ) | |||||||
|
Provision for income taxes
|
3,468 | 9,430 | 714 | |||||||||
|
Earnings (loss) from continuing operations
|
9,227 | (19,695 | ) | (104,054 | ) | |||||||
|
Loss from discontinued operations (net of income taxes)
|
(2,932 | ) | (8,370 | ) | (7,481 | ) | ||||||
|
(Loss) gain on sale of discontinued operations (net of income taxes)
|
(115 | ) | (611 | ) | 2,466 | |||||||
|
Net earnings (loss)
|
$ | 6,180 | $ | (28,676 | ) | $ | (109,069 | ) | ||||
|
Earnings (loss) from continuing operations per common share:
|
||||||||||||
|
Basic
|
$ | 0.20 | $ | (0.50 | ) | $ | (3.25 | ) | ||||
|
Diluted
|
$ | 0.20 | $ | (0.50 | ) | $ | (3.25 | ) | ||||
|
Net earnings (loss) per common share:
|
||||||||||||
|
Basic
|
$ | 0.13 | $ | (0.73 | ) | $ | (3.40 | ) | ||||
|
Diluted
|
$ | 0.13 | $ | (0.73 | ) | $ | (3.40 | ) | ||||
The notes to consolidated financial statements are an integral part of these statements.
|
MODINE MANUFACTURING COMPANY
|
|
CONSOLIDATED BALANCE SHEETS
|
|
March 31, 2011 and 2010
|
|
(In thousands, except per share amounts)
|
|
2011
|
2010
|
|||||||
|
ASSETS
|
||||||||
|
Current assets:
|
||||||||
|
Cash and cash equivalents
|
$ | 32,930 | $ | 43,657 | ||||
|
Short-term investments
|
2,720 | 1,239 | ||||||
|
Trade receivables, less allowance for doubtful accounts of $754 and $2,420
|
219,189 | 167,382 | ||||||
|
Inventories
|
122,629 | 99,559 | ||||||
|
Deferred income taxes and other current assets
|
50,157 | 43,571 | ||||||
|
Total current assets
|
427,625 | 355,408 | ||||||
|
Noncurrent assets:
|
||||||||
|
Property, plant and equipment – net
|
430,295 | 419,293 | ||||||
|
Investment in non-consolidated affiliates
|
3,863 | 3,079 | ||||||
|
Goodwill
|
31,572 | 29,552 | ||||||
|
Intangible assets – net
|
6,533 | 6,888 | ||||||
|
Assets held for sale
|
2,450 | 9,870 | ||||||
|
Other noncurrent assets
|
14,601 | 16,805 | ||||||
|
Total noncurrent assets
|
489,314 | 485,487 | ||||||
|
Total assets
|
$ | 916,939 | $ | 840,895 | ||||
|
LIABILITIES AND SHAREHOLDERS' EQUITY
|
||||||||
|
Current liabilities:
|
||||||||
|
Short-term debt
|
$ | 8,825 | $ | 3,011 | ||||
|
Long-term debt – current portion
|
262 | 234 | ||||||
|
Accounts payable
|
177,549 | 142,310 | ||||||
|
Accrued compensation and employee benefits
|
63,163 | 55,380 | ||||||
|
Income taxes
|
3,739 | 7,527 | ||||||
|
Accrued expenses and other current liabilities
|
63,003 | 54,819 | ||||||
|
Total current liabilities
|
316,541 | 263,281 | ||||||
|
Noncurrent liabilities:
|
||||||||
|
Long-term debt
|
138,582 | 135,952 | ||||||
|
Deferred income taxes
|
9,988 | 10,830 | ||||||
|
Pensions
|
62,926 | 85,158 | ||||||
|
Postretirement benefits
|
5,967 | 8,042 | ||||||
|
Other noncurrent liabilities
|
19,983 | 15,709 | ||||||
|
Total noncurrent liabilities
|
237,446 | 255,691 | ||||||
|
Total liabilities
|
553,987 | 518,972 | ||||||
|
Commitments and contingencies (See Note 25)
|
||||||||
|
Shareholders' equity:
|
||||||||
|
Preferred stock, $0.025 par value, authorized 16,000 shares, issued - none
|
- | - | ||||||
|
Common stock, $0.625 par value, authorized 80,000 shares, issued 47,105 and 46,815 shares
|
29,440 | 29,260 | ||||||
|
Additional paid-in capital
|
166,359 | 159,854 | ||||||
|
Retained earnings
|
203,686 | 197,506 | ||||||
|
Accumulated other comprehensive loss
|
(22,533 | ) | (50,431 | ) | ||||
|
Treasury stock at cost: 559 and 554 shares
|
(14,000 | ) | (13,922 | ) | ||||
|
Deferred compensation trust
|
- | (344 | ) | |||||
|
Total shareholders' equity
|
362,952 | 321,923 | ||||||
|
Total liabilities and shareholders' equity
|
$ | 916,939 | $ | 840,895 | ||||
The notes to consolidated financial statements are an integral part of these statements.
|
MODINE MANUFACTURING COMPANY
|
|
CONSOLIDATED STATEMENTS OF CASH FLOWS
|
|
For the years ended March 31, 2011, 2010 and 2009
|
|
(In thousands)
|
|
2011
|
2010
|
2009
|
||||||||||
|
Cash flows from operating activities:
|
||||||||||||
|
Net earnings (loss)
|
$ | 6,180 | $ | (28,676 | ) | $ | (109,069 | ) | ||||
|
Adjustments to reconcile net earnings (loss) with net cash provided by operating activities:
|
||||||||||||
|
Depreciation and amortization
|
56,492 | 64,606 | 72,097 | |||||||||
|
Loss (gain) on sale of businesses
|
- | 611 | (2,466 | ) | ||||||||
|
Pension and postretirement expense
|
6,557 | 1,953 | 3,094 | |||||||||
|
Gain from disposition of property, plant and equipment
|
(3,448 | ) | (656 | ) | (3,904 | ) | ||||||
|
Loss from impairment of goodwill and long-lived assets
|
3,548 | 14,194 | 49,766 | |||||||||
|
Deferred income tax provision
|
(6,945 | ) | 3,317 | (12,760 | ) | |||||||
|
Provision for doubtful accounts
|
(381 | ) | 202 | 1,713 | ||||||||
|
Undistributed (earnings) losses of affiliates, net of dividends received
|
(469 | ) | 105 | (249 | ) | |||||||
|
Stock-based compensation expense
|
5,218 | 2,725 | 3,458 | |||||||||
|
Other – net
|
1,802 | 2,428 | 11,633 | |||||||||
|
Changes in operating assets and liabilities, excluding dispositions:
|
||||||||||||
|
Trade receivables
|
(42,990 | ) | (51,763 | ) | 117,480 | |||||||
|
Inventories
|
(19,351 | ) | (6,707 | ) | 11,771 | |||||||
|
Other current assets
|
(2,646 | ) | (996 | ) | 10,864 | |||||||
|
Accounts payable
|
30,041 | 62,443 | (52,271 | ) | ||||||||
|
Accrued compensation and employee benefits
|
7,309 | (17,310 | ) | (215 | ) | |||||||
|
Income taxes
|
(2,567 | ) | 9,215 | (5,269 | ) | |||||||
|
Accrued expenses and other current liabilities
|
5,903 | 3,400 | (459 | ) | ||||||||
|
Other noncurrent assets and liabilities
|
(23,441 | ) | 2,813 | (1,698 | ) | |||||||
|
Net cash provided by operating activities
|
20,812 | 61,904 | 93,516 | |||||||||
|
Cash flows from investing activities:
|
||||||||||||
|
Expenditures for property, plant and equipment
|
(55,061 | ) | (60,297 | ) | (103,261 | ) | ||||||
|
Change in restricted cash
|
1,368 | 4,862 | (10,828 | ) | ||||||||
|
Proceeds from dispositions of assets
|
3,715 | 8,687 | 7,101 | |||||||||
|
Proceeds from the sale of assets held for sale and discontinued operations
|
8,841 | 10,515 | 10,202 | |||||||||
|
Settlement of derivative contracts
|
(7 | ) | (6,629 | ) | (233 | ) | ||||||
|
Other – net
|
1 | 903 | 3,394 | |||||||||
|
Net cash used for investing activities
|
(41,143 | ) | (41,959 | ) | (93,625 | ) | ||||||
|
Cash flows from financing activities:
|
||||||||||||
|
Short-term debt, net
|
5,554 | (2,999 | ) | 5,845 | ||||||||
|
Borrowings of long-term debt
|
252,855 | 77,122 | 70,611 | |||||||||
|
Repayments of long-term debt
|
(250,572 | ) | (186,488 | ) | (50,293 | ) | ||||||
|
Financing fees paid
|
(215 | ) | (802 | ) | (3,876 | ) | ||||||
|
Book overdrafts
|
(407 | ) | (1,640 | ) | (393 | ) | ||||||
|
Issuance of common stock
|
- | 92,858 | - | |||||||||
|
Proceeds from exercise of stock options
|
1,467 | 250 | 18 | |||||||||
|
Repurchase of common stock, treasury and retirement
|
(78 | ) | (25 | ) | (594 | ) | ||||||
|
Cash dividends paid
|
- | - | (9,679 | ) | ||||||||
|
Net cash provided by (used for) financing activities
|
8,604 | (21,724 | ) | 11,639 | ||||||||
|
Effect of exchange rate changes on cash
|
1,000 | 1,900 | (6,589 | ) | ||||||||
|
Net (decrease) increase in cash and cash equivalents
|
(10,727 | ) | 121 | 4,941 | ||||||||
|
Cash and cash equivalents at beginning of year
|
43,657 | 43,536 | 38,595 | |||||||||
|
Cash and cash equivalents at end of year
|
$ | 32,930 | $ | 43,657 | $ | 43,536 | ||||||
|
Cash paid during the year for:
|
||||||||||||
|
Interest, net of amounts capitalized
|
$ | 28,095 | $ | 17,422 | $ | 14,690 | ||||||
|
Income taxes
|
$ | 15,554 | $ | 7,082 | $ | 29,217 | ||||||
The notes to consolidated financial statements are an integral part of these statements.
|
MODINE MANUFACTURING COMPANY
|
|
CONSOLIDATED STATEMENTS OF SHAREHOLDERS' EQUITY AND COMPREHENSIVE INCOME (LOSS)
|
|
For the years ended March 31, 2011, 2010 and 2009
|
|
(In thousands, except per share amounts)
|
|
Common
stock
|
Additional
paid-in capital
|
Retained
earnings
|
Accumulated other
comprehensive
(loss) income
|
Treasury
stock
|
Deferred
compensation
trust
|
Total
|
||||||||||||||||||||||
|
Balance, March 31, 2008
|
$ | 20,492 | $ | 69,346 | $ | 345,966 | $ | 61,058 | $ | (13,303 | ) | $ | (441 | ) | $ | 483,118 | ||||||||||||
|
Revisions of prior period errors (Note 1)
|
- | - | (1,061 | ) | - | - | - | (1,061 | ) | |||||||||||||||||||
|
Revised beginning balance, April 1, 2008
|
20,492 | 69,346 | 344,905 | 61,058 | (13,303 | ) | (441 | ) | 482,057 | |||||||||||||||||||
|
Comprehensive income (loss):
|
||||||||||||||||||||||||||||
|
Net loss
|
- | - | (109,069 | ) | - | - | - | (109,069 | ) | |||||||||||||||||||
|
Foreign-currency translation
|
- | - | - | (91,363 | ) | - | - | (91,363 | ) | |||||||||||||||||||
|
Cash flow hedges (net of taxes of $0)
|
- | - | - | (11,137 | ) | - | - | (11,137 | ) | |||||||||||||||||||
|
Changes in benefit plans:
|
||||||||||||||||||||||||||||
|
Net actuarial loss (net of taxes of $66)
|
- | - | - | (34,608 | ) | - | - | (34,608 | ) | |||||||||||||||||||
|
Net prior service costs (net of taxes of $0)
|
- | - | - | 13,161 | - | - | 13,161 | |||||||||||||||||||||
|
Total comprehensive loss
|
(233,016 | ) | ||||||||||||||||||||||||||
|
Cash dividends, $0.30 per share
|
- | - | (9,679 | ) | - | - | - | (9,679 | ) | |||||||||||||||||||
|
Purchase of treasury stock
|
- | - | - | - | (594 | ) | - | (594 | ) | |||||||||||||||||||
|
Stock options and awards including related tax benefits
|
12 | 776 | - | - | - | - | 788 | |||||||||||||||||||||
|
Forfeiture of stock awards
|
(10 | ) | (62 | ) | 12 | - | - | - | (60 | ) | ||||||||||||||||||
|
Amortization of deferred compensation under restricted stock plans
|
- | 2,740 | - | - | - | - | 2,740 | |||||||||||||||||||||
|
Investment in deferred compensation trust
|
- | - | - | - | - | 88 | 88 | |||||||||||||||||||||
|
Balance, March 31, 2009
|
20,494 | 72,800 | 226,169 | (62,889 | ) | (13,897 | ) | (353 | ) | 242,324 | ||||||||||||||||||
|
Comprehensive income (loss):
|
||||||||||||||||||||||||||||
|
Net loss
|
- | - | (28,676 | ) | - | - | - | (28,676 | ) | |||||||||||||||||||
|
Foreign-currency translation
|
- | - | - | 22,891 | - | - | 22,891 | |||||||||||||||||||||
|
Cash flow hedges (net of taxes of $0)
|
- | - | - | 8,886 | - | - | 8,886 | |||||||||||||||||||||
|
Changes in benefit plans:
|
||||||||||||||||||||||||||||
|
Net actuarial loss (net of taxes of $0)
|
- | - | - | (17,221 | ) | - | - | (17,221 | ) | |||||||||||||||||||
|
Net prior service costs (net of taxes of $0)
|
- | - | - | (2,098 | ) | - | - | (2,098 | ) | |||||||||||||||||||
|
Total comprehensive loss
|
(16,218 | ) | ||||||||||||||||||||||||||
|
Issuance of common stock
|
8,625 | 84,233 | 92,858 | |||||||||||||||||||||||||
|
Purchase of treasury stock
|
- | - | - | - | (25 | ) | - | (25 | ) | |||||||||||||||||||
|
Stock options and awards including related tax benefits
|
161 | 1,670 | - | - | - | - | 1,831 | |||||||||||||||||||||
|
Forfeiture of stock awards
|
(20 | ) | (339 | ) | 13 | - | - | - | (346 | ) | ||||||||||||||||||
|
Amortization of deferred compensation under restricted stock plans
|
- | 1,490 | - | - | - | - | 1,490 | |||||||||||||||||||||
|
Investment in deferred compensation trust
|
- | - | - | - | - | 9 | 9 | |||||||||||||||||||||
|
Balance, March 31, 2010
|
29,260 | 159,854 | 197,506 | (50,431 | ) | (13,922 | ) | (344 | ) | 321,923 | ||||||||||||||||||
|
Comprehensive income:
|
||||||||||||||||||||||||||||
|
Net earnings
|
- | - | 6,180 | - | - | - | 6,180 | |||||||||||||||||||||
|
Foreign-currency translation
|
- | - | - | 16,954 | - | - | 16,954 | |||||||||||||||||||||
|
Cash flow hedges (net of taxes of $987)
|
- | - | - | 2,343 | - | - | 2,343 | |||||||||||||||||||||
|
Changes in benefit plans:
|
||||||||||||||||||||||||||||
|
Net actuarial gain (net of taxes of $2,358)
|
- | - | - | 11,117 | - | - | 11,117 | |||||||||||||||||||||
|
Net prior service costs (net of taxes of $393)
|
- | - | - | (2,516 | ) | - | - | (2,516 | ) | |||||||||||||||||||
|
Total comprehensive income
|
34,078 | |||||||||||||||||||||||||||
|
Issuance of common stock
|
89 | 1,378 | 1,467 | |||||||||||||||||||||||||
|
Purchase of treasury stock
|
- | - | - | - | (78 | ) | - | (78 | ) | |||||||||||||||||||
|
Stock options and awards including related tax benefits
|
99 | 1,325 | - | - | - | - | 1,424 | |||||||||||||||||||||
|
Forfeiture of stock awards
|
(8 | ) | (85 | ) | - | - | - | - | (93 | ) | ||||||||||||||||||
|
Amortization of deferred compensation under restricted stock plans
|
- | 2,657 | - | - | - | - | 2,657 | |||||||||||||||||||||
|
Investment in deferred compensation trust
|
- | 1,230 | - | - | - | 344 | 1,574 | |||||||||||||||||||||
|
Balance, March 31, 2011
|
$ | 29,440 | $ | 166,359 | $ | 203,686 | $ | (22,533 | ) | $ | (14,000 | ) | $ | - | $ | 362,952 | ||||||||||||
The notes to consolidated financial statements are an integral part of these statements.
MODINE MANUFACTURING COMPANY
NOTES TO CONSOLIDATED FINANCIAL STATEMENTS
(In thousands, except per share amounts)
Note 1: Significant accounting policies
Nature of operations: Modine Manufacturing Company (Modine or the Company) specializes in thermal management systems and components, bringing heating and cooling technology and solutions to diversified global markets. The Company is a leading global developer, manufacturer and marketer of heat exchangers and systems for use in on-highway and off-highway original equipment manufacturer (OEM) vehicular applications, and to a wide array of building, industrial, refrigeration and fuel cell markets. Product lines include radiators and radiator cores, vehicular air conditioning, oil coolers, charge air coolers, heat-transfer packages and modules, building heating, ventilating and air conditioning (HVAC) equipment and exhaust gas recirculation (EGR) coolers.
Basis of presentation: The consolidated financial statements are prepared in conformity with generally accepted accounting principles (GAAP) in the United States. These principles require management to make certain estimates and assumptions in determining Modine’s assets, liabilities, revenue, expenses and related disclosures. Actual amounts could differ from those estimates.
Consolidation principles: The consolidated financial statements include the accounts of Modine Manufacturing Company and its majority-owned or Modine-controlled subsidiaries. Material inter-company transactions and balances are eliminated in consolidation.
Investments in non-consolidated affiliated companies in which ownership is 20 percent or more are accounted for by the equity method. The investments are stated at cost plus or minus a proportionate share of the undistributed net income (loss). Modine’s share of the affiliates’ net income (loss) is reflected in other income – net. See Note 11 for further discussion.
Discontinued operations: The Company considers businesses to be held for sale when management approves and commits to a formal plan to actively market the business for sale at a price reasonable in relation to its fair value, the business is available for immediate sale in its present condition, the sale of the business is probable and expected to be completed within one year and it is unlikely that significant changes will be made to the plan. Upon designation as held for sale, the carrying value of the assets of the business are recorded at the lower of their carrying value or their estimated fair value, less costs to sell. The Company ceases to record depreciation expense at the time of designation as held for sale. Results of operations of a business classified as held for sale are reported as discontinued operations when (a) the operations and cash flows of the business will be eliminated from ongoing operations as a result of the sale and (b) the Company will not have any significant continuing involvement in the operations of the business after the sale. The Company classified the South Korean and the Electronics Cooling businesses as discontinued operations.
Revenue recognition: Sales revenue, including agreed upon commodity price increases, is recognized at the time of product shipment to customers when title and risk of loss pass to customers, selling prices are fixed or determinable and collectibility from the customer is reasonably assured. Appropriate provisions are made for uncollectible accounts based on historical data or specific customer economic data, and for estimated commodity price increases which may ultimately not be collected.
Sales discounts: Sales discounts, which are allowed for prompt payment of invoices by customers, are recorded as a reduction to net sales.
Tooling costs: Modine accounts for pre-production tooling costs as a component of property, plant and equipment – net when the Company owns title to the tooling, and amortizes the capitalized cost to cost of sales over the life of the related program. At March 31, 2011 and 2010, Company-owned tooling totaled $24,799 and $21,379, respectively. In certain instances, the Company makes an upfront payment for customer-owned tooling costs, and subsequently receives a reimbursement from the customer for the upfront payment. The Company accounts for unbilled customer-owned tooling costs as a receivable within other current assets when the customer has guaranteed reimbursement to the Company. No significant arrangements exist where customer-owned tooling costs were not accompanied by guaranteed reimbursement. At March 31, 2011 and 2010, the cost reimbursement receivable related to customer-owned tooling totaled $10,564 and $12,033, respectively.
Warranty: Modine provides product warranties for specific product lines and accrues for estimated future warranty costs in the period in which the sale is recorded. Warranty expense is generally provided based upon historical and current claim data. Accrual balances are monitored and adjusted when it becomes probable that expected claims will differ from existing estimates. Accruals are recorded as current liabilities under the caption accrued expenses and other current liabilities. See Note 20 for further discussion.
MODINE MANUFACTURING COMPANY
NOTES TO CONSOLIDATED FINANCIAL STATEMENTS
(In thousands, except per share amounts)
Shipping and handling costs: Shipping costs for inbound freight are treated as product cost. Shipping and handling costs incurred upon the shipment of products to our OEM customers are recorded as a component of cost of sales, and related amounts billed to these customers are recorded as a component of net sales. Shipping and handling costs incurred upon the shipment of products to our HVAC customers are recorded as a component of SG&A expenses. For the years ended March 31, 2011, 2010 and 2009, these shipping and handling costs recorded as a component of SG&A expenses were $4,815, $2,987 and $3,427, respectively.
Revenue recognition under licensing arrangements (royalty payments): Revenues under various licensing agreements are recognized when earned except in those cases where collection is uncertain, or the amount cannot reasonably be estimated until formal accounting reports are received from the licensee as provided for under the provisions of the licensing agreement. For the years ended March 31, 2011, 2010 and 2009, licensing revenue totaled $1,607, $5,562 and $13,891, respectively, and are recorded in the statement of operations under the caption net sales.
Translation of foreign currencies: Assets and liabilities of foreign subsidiaries and equity investments are translated into U.S. dollars at the period-end exchange rates, and income and expense items are translated at the monthly average exchange rate for the period in which the items occur. Resulting translation adjustments are reported as a component of accumulated other comprehensive (loss) income included in shareholders' equity. Foreign currency transaction gains or losses are included in the statement of operations under the caption other (income) expense – net.
Derivative instruments: The Company enters into derivative financial instruments from time to time to manage certain financial risks. Futures contracts are entered into by the Company to reduce exposure to changing future purchase prices for aluminum, copper and natural gas. Foreign exchange options and forward contracts on foreign currencies are entered into by Modine as hedges against the impact of currency fluctuations on certain sales and purchase transactions. Interest rate locks and swaps are entered into to lock in fixed interest rates for variable-rate borrowings. These instruments are used to protect cash flows and are not speculative. The Company generally designates its derivative instruments as cash flow hedges. Accordingly, unrealized gains and losses on these contracts are deferred as a component of accumulated other comprehensive (loss) income and recognized as a component of earnings at the same time that the underlying transactions impact earnings. See Note 18 for further discussion.
Income taxes: Deferred tax assets and liabilities are determined based on the difference between the amounts reported in the financial statements and the tax bases of assets and liabilities, using enacted tax rates in effect in the years in which the differences are expected to reverse. A valuation allowance is established if it is more likely than not that some portion or all of a deferred tax asset will not be realized. See Note 6 for further discussion.
Earnings per share: Basic earnings per share is calculated based on the weighted average number of common shares outstanding during the year, while diluted earnings per share is calculated based on the dilutive effect of common shares that could be issued. The calculation of diluted earnings per share excludes all potentially dilutive shares in which their inclusion would have the effect of decreasing the loss per share amount. See Note 7 for further discussion.
Cash equivalents: Modine considers all highly liquid investments with original maturities of three months or less to be cash equivalents.
Deferred compensation trust: The Company maintains a deferred compensation trust to fund future obligations under its non-qualified deferred compensation plan. The trust’s investments in third-party debt and equity securities are reflected as short-term investments in the consolidated balance sheet and are treated as trading securities with changes in fair value reflected as a component of earnings.
Trade receivables and allowance for doubtful accounts: Trade receivables are recorded at the invoiced amount and do not bear interest if paid according to the original terms. The allowance for doubtful accounts is Modine’s best estimate of the uncollectible amount contained in the existing trade receivables balance. The allowance is based on historical write-off experience and specific customer economic data. The allowance for doubtful accounts is reviewed periodically and adjusted as necessary. Utilizing age- and size-based criteria, certain individual accounts are reviewed for collectibility, while all other accounts are reviewed on a pooled basis. Receivables are charged off against the allowance when it is probable and to the extent that funds will not be collected. The Company enters into accounts receivable factoring programs from time to time to sell accounts receivables without recourse to third-party financial institutions. Sales of accounts receivable are reflected as a reduction of accounts receivable on the consolidated balance sheets and the proceeds are included in the cash flows from operating activities in the consolidated statements of cash flows. During the years ended March 31, 2011 and 2010, the Company sold, without recourse, $47,778 and $12,289 of accounts receivable to accelerate cash receipts. During the years ended March 31, 2011 and 2010, a loss on the sale of accounts receivables of $225 and $91 was recorded in the consolidated statements of operations. This loss represented implicit interest on the transactions and is included in interest expense.
MODINE MANUFACTURING COMPANY
NOTES TO CONSOLIDATED FINANCIAL STATEMENTS
(In thousands, except per share amounts)
Inventories: Inventories are valued at the lower of cost on a first-in, first-out basis, or market value.
Property, plant and equipment: Property, plant and equipment are stated at cost. For financial reporting purposes, depreciation is principally computed using the straight-line method over the expected useful life of the asset. Maintenance and repair costs are charged to operations as incurred. Costs of improvements are capitalized. Upon the sale or other disposition of an asset, the cost and related accumulated depreciation are removed from the accounts and the gain or loss is included in the statement of operations.
Goodwill and intangible assets: Purchased goodwill and other intangible assets with indefinite lives, primarily tradenames, are not amortized; rather they are tested for impairment annually unless conditions exist that would require a more frequent evaluation. An assessment of the fair value of the Company’s reporting units for its goodwill valuation and its other intangible assets with indefinite lives is required and is based upon, among other things, the present value of the expected future cash flows. An impairment loss is recognized when the book value of goodwill or intangible assets exceeds the fair value. The Company originally elected to perform its annual impairment test of goodwill and indefinite lived intangible assets during its third fiscal quarter. The Company completed its annual impairment tests as of December 31, 2010 in accordance with this policy. There was no impairment charge as a result of this test. During fiscal 2011, the Company changed the date of its annual goodwill and indefinite-lived intangible assets impairment tests to the fourth quarter to better align with its annual and long-term planning process. As a result, the Company performed impairment tests as of March 31, 2011, which resulted in no impairment charge. The Company determined that this change in accounting principle is preferable because it will allow management to utilize the most current plan information. This change in accounting principle had no effect on the Consolidated Financial Statements. A goodwill impairment charge of $9,005 was recorded during fiscal 2009. See Note 14 for further discussion.
Impairment of long-lived assets: Long-lived assets, including property, plant and equipment and intangible assets with finite lives are reviewed for impairment and written down to fair value when facts and circumstances indicate that the carrying value of long-lived assets may not be recoverable through estimated future undiscounted cash flows. If an impairment has occurred, a write-down to estimated fair value is made and the impairment loss is recognized as a charge against current operations. Fair value is estimated using a variety of valuation techniques including discounted cash flows, market values and comparison values for similar assets. Investments are reviewed for impairments and written down to fair value when facts and circumstances indicate that a decline in value is other than temporary. Long-lived asset and equity investment impairment charges of $3,548, $6,548 and $34,370 were recorded during fiscal 2011, 2010 and 2009, respectively. See Note 5 and Note 10 for further discussion.
Restricted cash: At March 31, 2011 and 2010, the Company had long-term restricted cash of $4,682 and $5,926, respectively, included in other noncurrent assets. The balance at March 31, 2011 contains two components, $2,332 secures long-term employee compensation arrangements for certain employees in Europe and $2,350 collateralizes insurance liabilities with an insurance carrier in North America. At March 31, 2010, the Company had long-term restricted cash of $4,000 included in other noncurrent assets primarily as collateral for unrealized losses on commodity derivatives with JPMorgan Chase Bank, N.A. as the counterparty and $1,926 to secure long-term employee compensation arrangements for certain employees in Europe.
Assets held for sale: Assets held for sale totaling $2,450 and $9,870 at March 31, 2011 and 2010, respectively, represent certain facilities that the Company has closed and is currently marketing for sale. During fiscal 2011, the Company sold three facilities previously classified as held for sale for net proceeds of $8,841 and recognized a gain on the sales of $3,258, which has been reflected as a component of selling, general and administrative expenses.
Environmental expenditures: The Company capitalizes environmental expenditures related to current operations that qualify as property, plant and equipment or substantially increase the economic value or extend the useful life of an asset. All other expenditures are expensed as incurred. Environmental expenditures that relate to an existing condition caused by past operations are expensed. If a loss arising from environmental matters is probable and can be reasonably estimated, the Company records the amount of the estimated loss, or the minimum estimated liability when the loss is estimated using a range, and no point within the range is more likely than another.
MODINE MANUFACTURING COMPANY
NOTES TO CONSOLIDATED FINANCIAL STATEMENTS
(In thousands, except per share amounts)
Self-insurance reserves: The Company retains some of the financial risk for various insurance coverage including property, general liability, workers compensation and employee healthcare and therefore maintains reserves that estimate the impact of unreported and under-reported claims that fall below various stop-loss limits and deductibles under its insurance policies. The insurance reserves include settlement cost estimates for known claims, as well as estimates, some of which are actuarially determined, of incurred but not reported claims. Costs of claims, including the impact of changes in reserves due to claim experience and severity, are charged to operations based on claim incurrence. The evaluation of insurance claims and the reasonableness of the related liability accruals are reviewed and updated on a quarterly basis.
Stock-based compensation: The Company recognizes stock-based compensation using the fair-value-based method. Accordingly, compensation cost for stock options, stock awards and restricted stock is calculated based on the fair value of the instrument at the time of grant, and is recognized as expense over the vesting period of the stock-based instrument. The majority of this expense is reflected in corporate as administrative expense, and has not been allocated to various segments. See Note 23 for further discussion.
Revision of prior period financial statements: During the three months ended March 31, 2011, the Company identified the following three errors related to prior periods:
|
·
|
The Company determined that certain trade regulations had not been followed at the Nuevo Laredo, Mexico and Laredo, Texas facilities in the Commercial Products segment. At March 31, 2011, an estimated liability for unpaid duties, interest and penalties totaling $4,528 was identified, of which $4,061 related to prior periods. See Note 25 for further discussion;
|
|
·
|
Inventory write-downs of $1,123 were identified primarily in the Original Equipment – North America segment, of which $595 related to the second quarter of fiscal 2011 and $528 related to the third quarter of fiscal 2011; and
|
|
·
|
Certain assets within the Original Equipment – Europe segment were being depreciated over incorrect lives, resulting in $1,068 of excessive depreciation being recorded in prior periods.
|
These adjustments were not considered to be material individually or in the aggregate to previously issued financial statements. However, because of the significance of these adjustments, the Company revised its fiscal 2009 and fiscal 2010 results in this report. In addition, the quarterly results for fiscal 2010 and fiscal 2011 have been revised. See Note 26 for further discussion of the quarterly revisions. The following table summarizes the effects of revising prior years’ financial statements for these errors, as well as other errors previously deemed immaterial to the prior years’ financial statements. Those other adjustments, reflected in items (4) through (8) below, were previously considered immaterial to prior period results and were corrected in the period when identified.
|
Period in which the errors originated (1)
|
||||||||
|
Year Ended March 31,
|
||||||||
|
2009
|
2010
|
|||||||
|
Trade compliance liability (2)
|
$ | (542 | ) | $ | (1,376 | ) | ||
|
Excess depreciation (3)
|
282 | 387 | ||||||
|
Tooling sale (4)
|
(704 | ) | 914 | |||||
|
Workers compensation (5)
|
578 | (578 | ) | |||||
|
Price adjustment (6)
|
- | (363 | ) | |||||
|
Postretirement curtailment gain (7)
|
- | 1,217 | ||||||
|
Impact on pre-tax earnings (loss)
|
(386 | ) | 201 | |||||
|
Tax effect of excess depreciation (3)
|
(71 | ) | 73 | |||||
|
Income tax receivable (8)
|
- | 329 | ||||||
|
Impact on net earnings (loss) (9)
|
$ | (457 | ) | $ | 603 | |||
MODINE MANUFACTURING COMPANY
NOTES TO CONSOLIDATED FINANCIAL STATEMENTS
(In thousands, except per share amounts)
(1) The Company has concluded that these errors were immaterial, individually and in the aggregate, to all periods presented.
(2) The Company was not following trade compliance obligations at the Nuevo Laredo, Mexico and Laredo, Texas facilities within the Commercial Products segment which resulted in underpaying duties. As a result of this non-compliance, cost of sales and selling, general and administrative (SG&A) expenses were understated by $323 and $219, respectively, in fiscal 2009 and $630 and $746, respectively, in fiscal 2010 for unpaid duties, interest and penalties. Net earnings was overstated by $851 (cumulatively) in fiscal years prior to fiscal 2009 for unpaid duties. The Company recorded a liability for these obligations in accrued expenses and other current liabilities at March 31, 2010 and March 31, 2011.
(3) The Company was over-depreciating certain assets with the Original Equipment – Europe segment. As a result of this error, cost of sales was overstated by $282 in fiscal 2009 and by $387 in fiscal 2010. In addition, provision for income taxes was understated of $71 for fiscal 2009 and overstated by $73 in fiscal 2010. The Company recorded an increase in property, plant and equipment – net at March 31, 2010 and March 31, 2011.
(4) The Company recognized a loss on the sale of tooling in fiscal 2010 which should have been previously recognized in fiscal 2008 and fiscal 2009. As a result of this error, net sales were overstated by $1,770, cost of sales was overstated by $955 and other expense was overstated by $111 in fiscal 2009. In fiscal 2010, net sales were overstated by $295, cost of sales was overstated by $1,207 and other income was understated by $2. Net earnings was overstated by $210 (cumulatively) in fiscal years prior to 2009.
(5) The Company made a clerical error in the workers compensation calculation at March 31, 2009. As a result of this clerical error, SG&A expense was overstated by $578 in fiscal 2009 and understated by $578 in fiscal 2010.
(6) The Company should have recognized a contractual price adjustment with a customer in fiscal 2010. As a result of this error, net sales was overstated by $363 in fiscal 2010. The Company recorded a decrease in trade receivables at March 31, 2010.
(7) The Company identified a postretirement curtailment gain related to the closure of the Harrodsburg, Kentucky manufacturing facility in the Original Equipment – North America segment that should have been recorded in fiscal 2010. As a result of this error, cost of sales was overstated by $1,217 in fiscal 2010. The Company recorded a decrease in accumulated other comprehensive (loss) income at March 31, 2010.
(8) The Company should have recorded an income tax receivable in fiscal 2010. As a result of this error, provision for income taxes was overstated by $329 in fiscal 2010. The Company recorded a reduction to accrued income taxes at March 31, 2010.
(9) The aggregate impact of these errors was an overstatement of diluted earnings per share (EPS) from continuing operations and diluted EPS of $0.02 and $0.01, respectively, in fiscal 2009 and an understatement of diluted EPS from continuing operations and diluted EPS of $0.02, respectively, for fiscal 2010.
Accounting standards changes and new pronouncements: In June 2009, the Financial Accounting Standards Board (FASB) issued guidance on accounting for transfers of financial assets, which requires entities to provide more information regarding sales of securitized financial assets and similar transactions, particularly if the entity has continuing exposure to the risks related to transferred financial assets. The guidance eliminates the concept of a “qualifying special-purpose entity,” changes the requirements for derecognizing financial assets and requires additional disclosures. This guidance was effective for the Company on a prospective basis on or after April 1, 2010 and had no impact on the consolidated financial statements.
In October 2009, the FASB issued updated guidance on revenue arrangements with multiple deliverables, which addresses the unit of accounting for multiple-deliverable arrangements and revises the method by which consideration is allocated among the units of accounting. The overall consideration is allocated to each deliverable by establishing a selling price for individual deliverables based on a hierarchy of evidence, including vendor-specific objective evidence, other third party evidence of the selling price or the reporting entity’s best estimate of the selling price of individual deliverables in the arrangement. This guidance is effective for the Company on a prospective basis on or after April 1, 2011.
In January 2010, the Financial Accounting Standards Board (FASB) issued additional guidance regarding new disclosures and clarification of existing disclosures of fair value measurements. This guidance covers significant transfers in and out of Levels 1 and 2 fair value measurements. In addition, the reconciliation of Level 3 fair value measurements must include information about purchases, sales, issuances and settlements presented separately. The guidance also clarified existing disclosures regarding the level of disaggregation and disclosures about inputs and valuation techniques used to measure fair value for both recurring and nonrecurring fair value measurements. We adopted the provisions of the standard during fiscal 2011 and the adoption had no impact on the consolidated financial statements.
MODINE MANUFACTURING COMPANY
NOTES TO CONSOLIDATED FINANCIAL STATEMENTS
(In thousands, except per share amounts)
Note 2: Research and development costs
Research and development costs charged to operations totaled $66,971 in fiscal 2011, $56,899 in fiscal 2010, and $73,232 in fiscal 2009.
Note 3: Employee benefit plans
Defined Contribution Employee Benefit Plans:
401(k) plans: The Company maintains domestic 401(k) plans that allow employees to choose among various investment alternatives, including Modine stock. The Company’s matching contribution is discretionary. The Company matched 50 percent of the employees’ contribution up to 5 percent of employee contributions during fiscal 2011, fiscal 2010 and fiscal 2009. Company contributions have an initial three-year vesting period.
Defined contribution plan: The Company maintains a domestic defined contribution plan that was established on January 1, 2004 and initially covered all eligible salaried employees hired after January 1, 2004. Effective April 1, 2006, all salaried employees previously covered under the Modine Salaried Employee Pension Plan were eligible to participate in this plan. Modine makes annual discretionary contributions based on a percentage of compensation, which is determined by management. Employees can choose among various investment alternatives including Modine stock.
Deferred compensation plan: The Company maintains a non-qualified deferred compensation plan for eligible employees. The plan allows qualified employees to choose among various investment alternatives. The Company’s matching contributions are participant-directed, similar to the 401(k) plans.
Modine’s expense recorded for the defined contribution employee benefit plans during fiscal 2011, 2010 and 2009 was $4,327, $4,662, and $2,955, respectively.
In addition, various Modine foreign subsidiaries have in place government required defined contribution plans under which Modine contributes a percentage of employee earnings into accounts, consistent with local laws.
Statutory Termination Plans:
Certain of Modine’s foreign subsidiaries have statutory termination indemnity plans covering all of their eligible employees. The benefits under these plans are based upon years of service and final average compensation levels or a monthly retirement benefit amount. These programs are all substantially unfunded in accordance with local laws, but are often covered by national obligatory umbrella insurance programs that protect employees from losses in the event that an employer defaults on its obligations.
Defined Benefit Employee Benefit Plans:
Pension plans: Modine has a non-contributory defined benefit pension plan that covers most of its domestic employees hired on or before December 31, 2003. The benefits provided are based primarily on years of service and average compensation for the salaried and some hourly employees. Benefits for other hourly employees are based on a monthly retirement benefit amount. Domestic salaried employees hired after December 31, 2003 are not covered under any defined benefit plan. Certain of Modine’s foreign subsidiaries also have legacy defined benefit plans covering a small number of active employees.
During fiscal 2011, the Company elected to contribute $17,927 to its U.S. pension plans, which is included in other noncurrent assets and liabilities in the Consolidated Statements of Cash Flows.
In March 2011, the Company announced that effective January 1, 2012, the Modine Manufacturing Company Pension Plan for Non-Union Hourly Factory and Salaried Employees (Non-Union Hourly Factory component) was modified so that no increases in annual earnings and no service performed after December 31, 2011 will be included in calculating the average annual earnings and years of credit service under the pension plan formula. Modine recorded a pension curtailment charge of $1,616 in fiscal 2011 to reflect these modifications.
MODINE MANUFACTURING COMPANY
NOTES TO CONSOLIDATED FINANCIAL STATEMENTS
(In thousands, except per share amounts)
During fiscal 2011 and fiscal 2010, the Company recorded settlement charges of $30 and $780, respectively, related to settlement payments made from the Modine Manufacturing Company Supplemental Executive Retirement Plan.
Postretirement plans: Modine and certain of its domestic subsidiaries provide selected healthcare and life-insurance benefits for retired employees. Designated employees may become eligible for those benefits when they retire. These plans are unfunded. Modine periodically amends the plans, changing the contribution rate of retirees and the amounts and forms of coverage. An annual limit on Modine’s liability was established for most plans between fiscal 1994 and fiscal 1996 after original recognition of the liability in fiscal 1993. It caps future costs at 200 percent of Modine’s then-current cost. These changes reduced the accrued obligation, and the reduction is being amortized as a component of the benefit cost.
During fiscal 2011 and fiscal 2010, the Company recorded a postretirement curtailment gain of $2,075 and $1,217, respectively, related to the closure of the Harrodsburg, Kentucky manufacturing facility. See Note 1 for further discussion on the revision to prior period financial statements.
Effective January 1, 2009, the Modine Manufacturing Company Group Insurance Plan – Retiree Medical Plan was modified to eliminate coverage for retired participants who are Medicare eligible. This plan amendment resulted in a $14,251 reduction of the post-retirement benefit obligation, which has been reflected as a component of other comprehensive (loss) income and is being amortized to earnings over the future service life of active participants.
Measurement Date: Modine uses March 31 as the measurement date for its pension and postretirement plans.
The change in benefit obligations and plan assets as well as the funded status of Modine's pension and postretirement plans were as follows:
MODINE MANUFACTURING COMPANY
NOTES TO CONSOLIDATED FINANCIAL STATEMENTS
(In thousands, except per share amounts)
|
Pensions Plans
|
Postretirement Plans
|
|||||||||||||||
|
Years ended March 31
|
2011
|
2010
|
2011
|
2010
|
||||||||||||
|
Change in benefit obligation:
|
||||||||||||||||
|
Benefit obligation at beginning of year
|
$ | 241,244 | $ | 195,508 | $ | 8,827 | $ | 10,097 | ||||||||
|
Service cost
|
1,919 | 2,014 | 46 | 75 | ||||||||||||
|
Interest cost
|
13,737 | 14,530 | 337 | 527 | ||||||||||||
|
Plan amendments
|
- | 97 | - | - | ||||||||||||
|
Actuarial loss (gain)
|
2,923 | 45,673 | (2,192 | ) | (787 | ) | ||||||||||
|
Benefits paid
|
(14,789 | ) | (17,151 | ) | (749 | ) | (1,333 | ) | ||||||||
|
Settlement/curtailment adjustment
|
- | 324 | 275 | - | ||||||||||||
|
Contributions by plan participants
|
- | - | - | 241 | ||||||||||||
|
Medicare subsidy
|
- | - | 41 | 42 | ||||||||||||
|
Currency translation adjustment
|
933 | 249 | - | - | ||||||||||||
|
Benefit obligation at end of year
|
$ | 245,967 | $ | 241,244 | $ | 6,585 | $ | 8,862 | ||||||||
|
Change in plan assets:
|
||||||||||||||||
|
Fair value of plan assets at beginning of year
|
$ | 155,168 | $ | 127,072 | $ | - | $ | - | ||||||||
|
Actual return on plan assets
|
21,727 | 41,472 | - | - | ||||||||||||
|
Benefits paid
|
(14,789 | ) | (17,151 | ) | (749 | ) | (1,333 | ) | ||||||||
|
Employer contributions
|
19,944 | 3,775 | 708 | 1,050 | ||||||||||||
|
Contributions by plan participants
|
- | - | - | 241 | ||||||||||||
|
Medicare subsidy
|
- | - | 41 | 42 | ||||||||||||
|
Fair value of plan assets at end of year
|
$ | 182,050 | $ | 155,168 | $ | - | $ | - | ||||||||
|
Funded status at end of year
|
$ | (63,917 | ) | $ | (86,076 | ) | $ | (6,585 | ) | $ | (8,862 | ) | ||||
|
Amounts recognized in the consolidated balance sheet consist of:
|
||||||||||||||||
|
Current liability (a)
|
$ | (991 | ) | $ | (918 | ) | $ | (618 | ) | $ | (820 | ) | ||||
|
Noncurrent liability (a)
|
(62,926 | ) | (85,158 | ) | (5,967 | ) | (8,042 | ) | ||||||||
| $ | (63,917 | ) | $ | (86,076 | ) | $ | (6,585 | ) | $ | (8,862 | ) | |||||
|
Amounts recognized in accumulated other comprehensive loss (income) consist of:
|
||||||||||||||||
|
Net actuarial loss
|
$ | 115,731 | $ | 127,166 | $ | (1,197 | ) | $ | 882 | |||||||
|
Prior service cost (credit)
|
- | 1,971 | (4,910 | ) | (9,004 | ) | ||||||||||
| $ | 115,731 | $ | 129,137 | $ | (6,107 | ) | $ | (8,122 | ) | |||||||
(a) The current and noncurrent liability for fiscal 2010 were revised to reflect the domestic pension plan liability as noncurrent given that the plan assets are sufficient to cover the estimated benefit payments.
The accumulated benefit obligation for all defined benefit pension plans was $244,504 and $239,169 as of March 31, 2011 and 2010, respectively.
Pension plans with accumulated benefit obligations in excess of plan assets consist of the following:
|
Years ended March 31
|
2011
|
2010
|
||||||
|
Projected benefit obligation
|
$ | 245,967 | $ | 241,244 | ||||
|
Accumulated benefit obligation
|
244,504 | 239,169 | ||||||
|
Fair value of the plan assets
|
182,050 | 155,168 | ||||||
MODINE MANUFACTURING COMPANY
NOTES TO CONSOLIDATED FINANCIAL STATEMENTS
(In thousands, except per share amounts)
Costs for Modine’s pension and postretirement benefit plans include the following components:
|
Pension Plans
|
Postretirement Plans
|
|||||||||||||||||||||||
|
Years ended March 31
|
2011
|
2010
|
2009
|
2011
|
2010
|
2009
|
||||||||||||||||||
|
Components of net periodic benefit costs:
|
||||||||||||||||||||||||
|
Service cost
|
$ | 1,919 | $ | 2,014 | $ | 2,464 | $ | 46 | $ | 75 | $ | 139 | ||||||||||||
|
Interest cost
|
13,737 | 14,530 | 14,132 | 337 | 527 | 1,126 | ||||||||||||||||||
|
Expected return on plan assets
|
(15,223 | ) | (15,118 | ) | (17,016 | ) | - | - | - | |||||||||||||||
|
Amortization of:
|
||||||||||||||||||||||||
|
Unrecognized net loss (gain)
|
7,670 | 2,543 | 1,914 | (113 | ) | (33 | ) | 142 | ||||||||||||||||
|
Unrecognized prior service cost (credit)
|
356 | 373 | 366 | (1,780 | ) | (2,374 | ) | (1,377 | ) | |||||||||||||||
|
Adjustment for settlement/curtailment
|
1,646 | 633 | 1,204 | (2,075 | ) | (1,217 | ) | - | ||||||||||||||||
|
Net periodic benefit cost (income)
|
$ | 10,105 | $ | 4,975 | $ | 3,064 | $ | (3,585 | ) | $ | (3,022 | ) | $ | 30 | ||||||||||
|
Other changes in plan assets and benefit obligation recognized in other comprehensive income:
|
||||||||||||||||||||||||
|
Net actuarial (gain) loss
|
$ | (3,764 | ) | $ | 19,644 | $ | 41,722 | $ | (2,192 | ) | $ | (822 | ) | $ | (3,909 | ) | ||||||||
|
Prior service (credits) costs
|
(1,616 | ) | 97 | 79 | 2,314 | 1,253 | (14,251 | ) | ||||||||||||||||
|
Reversal of amortization items:
|
||||||||||||||||||||||||
|
Net actuarial loss (gain)
|
(7,670 | ) | (3,111 | ) | (3,129 | ) | 113 | 33 | (142 | ) | ||||||||||||||
|
Prior service costs (credit)
|
(356 | ) | (373 | ) | (366 | ) | 1,780 | 2,374 | 1,377 | |||||||||||||||
|
Total recognized in other comprehensive (income) loss
|
$ | (13,406 | ) | $ | 16,257 | $ | 38,306 | $ | 2,015 | $ | 2,838 | $ | (16,925 | ) | ||||||||||
|
Total recognized in net periodic benefit costs and other comprehensive income
|
$ | (3,301 | ) | $ | 21,232 | $ | 41,370 | $ | (1,570 | ) | $ | (184 | ) | $ | (16,895 | ) | ||||||||
The estimated net actuarial loss for the pension plans that will be amortized from accumulated other comprehensive (loss) income into net periodic benefit cost over the next fiscal year is $6,992. The estimated net actuarial gain and prior service credit for the postretirement plans that will be amortized from accumulated other comprehensive (loss) income into net periodic benefit credit over the next fiscal year are $49 and $1,662, respectively.
The weighted–average assumptions used to determine Modine’s benefit obligation under the plans are detailed as follows:
|
Years ended March 31
|
2011
|
2010
|
||||||||||||||
|
U.S. Plans
|
Foreign Plans
|
U.S. Plans
|
Foreign Plans
|
|||||||||||||
|
Pension plans:
|
||||||||||||||||
|
Discount rate
|
5.83 | % | 5.75 | % | 5.93 | % | 5.00 | % | ||||||||
|
Rate of compensation increase
|
N/A | N/A | N/A | N/A | ||||||||||||
|
Postretirement plans:
|
||||||||||||||||
|
Discount rate
|
5.35 | % | N/A | 5.38 | % | N/A | ||||||||||
MODINE MANUFACTURING COMPANY
NOTES TO CONSOLIDATED FINANCIAL STATEMENTS
(In thousands, except per share amounts)
The weighted-average assumptions used to determine Modine's costs under the plans are detailed as follows:
|
Years ended March 31
|
2011
|
2010
|
2009
|
|||||||||||||||||||||
|
U.S. Plans
|
Foreign Plans
|
U.S. Plans
|
Foreign Plans
|
U.S. Plans
|
Foreign Plans
|
|||||||||||||||||||
|
Pension plans:
|
||||||||||||||||||||||||
|
Discount rate
|
5.93 | % | 5.00 | % | 7.73 | % | 6.10 | % | 6.62 | % | 5.53 | % | ||||||||||||
|
Expected return on plan assets
|
8.10 | % | N/A | 7.90 | % | N/A | 7.90 | % | N/A | |||||||||||||||
|
Rate of compensation increase
|
N/A | N/A | N/A | N/A | N/A | N/A | ||||||||||||||||||
|
Postretirement plans:
|
||||||||||||||||||||||||
|
Discount rate
|
5.38 | % | N/A | 7.35 | % | N/A | 6.62 | % | N/A | |||||||||||||||
The discount rate used to determine the present value of the Company’s future U.S. pension obligations as of the measurement date uses a methodology that equates the plans’ projected benefit obligations to a present value, calculated using a yield curve. The yield curve was constructed from a portfolio of high quality, non-callable corporate debt securities with maturities ranging from six months to thirty years. The discount rate was determined by matching the pension plans’ expected cash flows (on a PBO basis) with spot rates developed from the yield curve. The discount rate used to determine the present value of the Company’s future foreign pension obligations as of the measurement date is based upon the yield for zero coupon bonds plus a yield margin measured as the difference between euro denominated corporate bonds (AA or higher) in Europe and government bonds.
Plan assets in the U.S. defined benefit plans comprise 100 percent of the Company’s world-wide benefit plan assets. Modine's U.S. pension plan weighted-average asset allocations at the measurement dates of March 31, 2011 and 2010 by category, and the target allocation for the years ended March 31, 2011 and 2010 are summarized below:
|
Target allocation
|
Plan assets
|
|||||||||||||||
|
2011
|
2010
|
2011
|
2010
|
|||||||||||||
|
Equity securities
|
55 | % | 55 | % | 56 | % | 59 | % | ||||||||
|
Debt securities
|
38 | % | 38 | % | 38 | % | 35 | % | ||||||||
|
Alternative assets
|
5 | % | 5 | % | 5 | % | 5 | % | ||||||||
|
Cash
|
2 | % | 2 | % | 1 | % | 1 | % | ||||||||
| 100 | % | 100 | % | 100 | % | 100 | % | |||||||||
Due to market conditions and other factors including timing of benefit payments, actual asset allocation may vary from the target allocation outlined above. The assets are periodically rebalanced to the target allocations. There were no shares of Modine common stock included in the plan assets at the end of fiscal 2011 and 2010.
Modine employs a total return investment approach, whereby a mix of equities and fixed income investments are used to maximize the long-term return of plan assets while avoiding excessive risk. Pension plan guidelines have been established based upon an evaluation of market conditions, tolerance for risk and cash requirements for benefit payments. Investment risk is measured and monitored on an ongoing basis through quarterly investment portfolio reviews, annual liability measurements and periodic asset/liability studies.
The expected rate of return on U.S. plan assets is based upon historical return experience and forward-looking return expectations for major asset class categories. For fiscal 2011, Modine assumed a rate of return of 8.1 percent for purposes of determining the U.S. pension plan expense. For fiscal year 2012 U.S. pension plan expense, Modine has assumed a rate of 8.0 percent, net of administrative expenses.
MODINE MANUFACTURING COMPANY
NOTES TO CONSOLIDATED FINANCIAL STATEMENTS
(In thousands, except per share amounts)
With respect to the postretirement plans, for measurement purposes, the assumed healthcare cost trend rates were as follows:
|
Years ended March 31
|
2011
|
2010
|
||||||
|
Healthcare costs trend rate assumed for next year (pre-65)
|
8.0 | % | 6.8 | % | ||||
|
Healthcare costs trend rate assumed for next year (post-65)
|
8.0 | % | 6.8 | % | ||||
|
Ultimate trend rate
|
5.0 | % | 5.0 | % | ||||
|
Year the rate reaches the ultimate trend rate
|
2017 | 2014 | ||||||
Assumed healthcare cost trend rates affect the amounts reported for the postretirement plans. A one percentage point change in assumed healthcare cost trend rates would have the following effects:
|
One percentage point
|
||||||||
|
Year ended March 31, 2011
|
Increase
|
Decrease
|
||||||
|
Effect on total of service and interest cost
|
$ | 11 | $ | (11 | ) | |||
|
Effect on postretirement benefit obligation
|
178 | (171 | ) | |||||
The funding policy for domestic qualified pension plans is to contribute annually at a minimum, the amount necessary on an actuarial basis to provide for benefits in accordance with applicable law and regulation. Modine anticipates that it will make contributions of $10,650 to these plans during fiscal 2012.
The estimated benefit payments, which reflect future service, as appropriate, for the next ten fiscal years are as follows:
|
Years ended March 31
|
||||
|
Pension
|
||||
|
2012
|
$ | 12,247 | ||
|
2013
|
12,649 | |||
|
2014
|
13,469 | |||
|
2015
|
13,864 | |||
|
2016
|
14,770 | |||
|
2017-2021
|
81,637 | |||
Note 4: Operating leases
Modine leases various facilities and equipment under operating leases. Rental expense for these leases totaled $8,849 in fiscal 2011, $10,436 in fiscal 2010 and $6,479 in fiscal 2009.
Future minimum rental commitments at March 31, 2011 under non-cancelable operating leases are as follows:
|
Years ending March 31
|
||||
|
2012
|
$ | 4,198 | ||
|
2013
|
2,869 | |||
|
2014
|
2,204 | |||
|
2015
|
1,543 | |||
|
2016
|
1,285 | |||
|
2017 and beyond
|
5,711 | |||
|
Total future minimum rental commitments
|
$ | 17,810 | ||
MODINE MANUFACTURING COMPANY
NOTES TO CONSOLIDATED FINANCIAL STATEMENTS
(In thousands, except per share amounts)
Note 5: Other (income) expense – net
Other (income) expense – net was comprised of the following:
|
Years ended March 31
|
2011
|
2010
|
2009
|
|||||||||
|
Equity in (earnings) loss of non-consolidated affiliates
|
$ | (469 | ) | $ | 101 | $ | 5,871 | |||||
|
Interest income
|
(709 | ) | (665 | ) | (1,755 | ) | ||||||
|
Foreign currency transactions
|
(2,304 | ) | (3,399 | ) | 6,497 | |||||||
|
Other non-operating income - net
|
(142 | ) | (1,623 | ) | (667 | ) | ||||||
|
Total other (income) expense - net
|
$ | (3,624 | ) | $ | (5,586 | ) | $ | 9,946 | ||||
For the year ended March 31, 2010, the Company sold its 50 percent ownership of Anhui Jianghaui Mando Climate Control Co. Ltd. for $4,860, resulting in a gain of $1,465 included in other non-operating income – net.
Equity in (earnings) loss of non-consolidated affiliates for the year ended March 31, 2009 included an impairment charge of $7,596 related to an equity investment due to a decline in its value which was “other than temporary”.
Foreign currency transactions for the years ended March 31, 2011, 2010 and 2009 were primarily comprised of foreign currency transaction (gains) losses on inter-company loans denominated in a foreign currency.
Note 6: Income taxes
The U.S. and foreign components of earnings (loss) from continuing operations before income taxes and the income tax expense consisted of the following:
|
Years ended March 31
|
2011
|
2010
|
2009
|
|||||||||
|
Components of earnings (loss) from continuing operations before income taxes:
|
||||||||||||
|
United States
|
$ | (27,231 | ) | $ | (42,420 | ) | $ | (80,995 | ) | |||
|
Foreign
|
39,926 | 32,155 | (22,345 | ) | ||||||||
|
Total earnings (loss) from continuing operations before income taxes
|
$ | 12,695 | $ | (10,265 | ) | $ | (103,340 | ) | ||||
|
Income tax expense (benefit):
|
||||||||||||
|
Federal:
|
||||||||||||
|
Current
|
$ | (3,701 | ) | $ | (273 | ) | $ | (974 | ) | |||
|
Deferred
|
2,718 | 2,229 | 4,591 | |||||||||
|
State:
|
||||||||||||
|
Current
|
284 | (283 | ) | 491 | ||||||||
|
Deferred
|
(2,616 | ) | (2,172 | ) | (3,664 | ) | ||||||
|
Foreign:
|
||||||||||||
|
Current
|
10,503 | 6,665 | 13,958 | |||||||||
|
Deferred
|
(3,720 | ) | 3,264 | (13,688 | ) | |||||||
|
Total income tax expense
|
$ | 3,468 | $ | 9,430 | $ | 714 | ||||||
Certain of the Company’s foreign operations generated earnings from continuing operations before income
taxes during the year ended March 31, 2011, which resulted in a foreign income tax provision within these tax jurisdictions. The foreign income tax provision more than offset the income tax benefit of $2,280 recognized on the domestic loss from continuing operations before income taxes, which resulted in a consolidated provision for income taxes for fiscal 2011. The changing mix of foreign earnings and domestic losses, combined with year-over-year changes in the valuation allowance and tax credits, greatly impact changes in the effective tax rate for the years ended March 31, 2011, 2010 and 2009.
The Company allocates income tax expense between continuing operations, discontinued operations, and other comprehensive income. Accounting for income taxes is applied by tax jurisdiction, and in periods in which there is loss from continuing operations before income taxes and pre-tax income in another category (e.g., discontinued operations or other comprehensive income), income tax expense is first allocated to the other sources of income, with a related tax benefit recorded in continuing operations. During the year ended March 31, 2011, income tax expense of $3,738 was allocated to other comprehensive income and a corresponding tax benefit recorded in continuing operations.
MODINE MANUFACTURING COMPANY
NOTES TO CONSOLIDATED FINANCIAL STATEMENTS
(In thousands, except per share amounts)
Income tax expense attributable to earnings (loss) from continuing operations before income taxes differed from the amounts computed by applying the statutory U.S. federal income tax rate as a result of the following:
|
Years ended March 31
|
2011
|
2010
|
2009
|
|||||||||
|
Statutory federal tax
|
35.0 | % | (35.0 | %) | (35.0 | %) | ||||||
|
State taxes, net of federal benefit
|
(19.2 | ) | (21.1 | ) | (3.3 | ) | ||||||
|
Taxes on non-U.S. earnings and losses
|
(11.5 | ) | (1.8 | ) | 2.3 | |||||||
|
Valuation allowance
|
83.6 | 97.6 | 32.2 | |||||||||
|
Tax credits
|
(77.1 | ) | (5.0 | ) | (1.5 | ) | ||||||
|
Deferred tax adjustments
|
- | 15.7 | - | |||||||||
|
Goodwill impairment
|
- | - | 2.1 | |||||||||
|
Foreign tax rate changes
|
(4.4 | ) | - | - | ||||||||
|
Reserve for uncertain tax positions
|
4.2 | (5.7 | ) | (1.5 | ) | |||||||
|
Brazilian interest on equity
|
(7.4 | ) | - | - | ||||||||
|
Dividend repatriation
|
23.2 | 33.5 | 2.8 | |||||||||
|
Other
|
0.9 | 13.7 | 2.6 | |||||||||
|
Effective tax rate
|
27.3 | % | 91.9 | % | 0.7 | % | ||||||
The Other category for the years ended March 31, 2011, 2010 and 2009 includes such items as foreign withholding taxes, state tax refunds, foreign currency and certain incentive awards.
During fiscal 2011, the Company recorded a valuation allowance of $10,619 against net deferred tax assets; $5,977 against net deferred tax assets in the U.S. given the Company’s continued losses and $4,642 against net deferred tax assets in certain foreign jurisdictions. This foreign increase in valuation allowance was largely related to cumulative losses in Germany, Austria and India based on the determination that it was more likely than not that the net deferred tax assets in these jurisdictions will not be realized. The Company will continue to provide a valuation allowance against its net deferred tax assets in each of the applicable jurisdictions going forward until the need for a valuation allowance is eliminated. The need for the valuation allowance will be eliminated when the Company determines it is more likely than not that the deferred tax assets will be realized. One of the Company’s Chinese subsidiaries currently has a full valuation allowance of $711 against its net deferred tax assets as a result of its cumulative loss position; however, it is possible that the valuation allowance may be released during fiscal 2012 as the subsidiary becomes profitable.
During the fourth quarter of fiscal 2011, the Company met the initial labor requirement under Hungarian regulations necessary to obtain a development tax credit in Hungary and as a result recorded a $7,774 tax benefit which significantly benefited the change in the effective tax rate from fiscal 2010 to 2011. The labor requirement must be maintained for a period of four years, and the Company believes that it is more likely than not that such labor requirement will be maintained. For the year ended March 31, 2011, the effective tax rate was also favorably impacted by the implementation of a tax planning action, interest on equity, which allows our Brazilian operation to deduct as interest expense, subject to withholding tax, payments based on net equity made by the operation to the Company.
During fiscal 2010, the Company completed restructuring actions in various foreign tax jurisdictions in which distributions were made, characterized as taxable dividends, which affected the effective tax rate by $3,438 or 33.5 percent. In addition, the Company recorded a one-time adjustment of $1,607 to prior year deferred taxes in the U.S, which had a 15.7 percent impact on the effective tax rate. Both the dividends and deferred tax adjustments were fully offset by a valuation allowance.
During fiscal 2009, the Company experienced losses in the U.S. as well as overall losses in tax jurisdictions outside of the U.S. A valuation allowance of $28,960 against net deferred tax assets in the U.S. was the primary item affecting the effective tax rate.
MODINE MANUFACTURING COMPANY
NOTES TO CONSOLIDATED FINANCIAL STATEMENTS
(In thousands, except per share amounts)
The tax effects of temporary differences that give rise to significant portions of the deferred tax assets and deferred tax liabilities are as follows:
|
March 31
|
2011
|
2010
|
||||||
|
Deferred tax assets:
|
||||||||
|
Accounts receivable
|
$ | 414 | $ | 874 | ||||
|
Inventories
|
5,370 | 4,578 | ||||||
|
Plant and equipment
|
19,472 | 12,508 | ||||||
|
Employee benefits
|
65,446 | 69,403 | ||||||
|
Net operating loss, capital loss and credit carryforwards
|
86,809 | 58,504 | ||||||
|
Other, principally accrued liabilities
|
17,453 | 33,202 | ||||||
|
Total gross deferred tax assets
|
194,964 | 179,069 | ||||||
|
Less: valuation allowance
|
127,420 | 119,393 | ||||||
|
Net deferred tax assets
|
67,544 | 59,676 | ||||||
|
Deferred tax liabilities:
|
||||||||
|
Pension
|
29,003 | 24,848 | ||||||
|
Goodwill
|
5,873 | 5,376 | ||||||
|
Plant and equipment
|
26,391 | 28,023 | ||||||
|
Other
|
6,708 | 4,822 | ||||||
|
Total gross deferred tax liabilities
|
67,975 | 63,069 | ||||||
|
Net deferred tax liability
|
$ | (431 | ) | $ | (3,393 | ) | ||
The valuation allowance increased by $8,027 in fiscal 2011 primarily related to the valuation allowance against the net U.S. deferred tax assets of $4,229; the valuation allowance against the net deferred tax assets in Austria of $1,882; the valuation allowance against the net deferred tax assets in Germany of $1,230 and the valuation allowance against the net deferred tax assets in India of $1,108.
A reconciliation of the beginning and ending amount of unrecognized tax benefits is as follows:
|
2011
|
2010
|
|||||||
|
Balance, April 1
|
$ | 4,475 | $ | 5,157 | ||||
|
Gross increases - tax positions in prior period
|
380 | 21 | ||||||
|
Gross decreases - tax positions in prior period
|
- | (287 | ) | |||||
|
Gross increases - tax positions in current period
|
278 | 574 | ||||||
|
Settlements
|
- | (256 | ) | |||||
|
Lapse of statute of limitations
|
(30 | ) | (806 | ) | ||||
|
Foreign currency impact
|
202 | 72 | ||||||
|
Balance, March 31
|
$ | 5,305 | $ | 4,475 | ||||
The Company’s total gross liability for unrecognized tax benefits as of March 31, 2011 is $5,305, and if recognized, only $3,707 of this amount would have an affect on the effective tax rate as $1,598 of the unrecognized tax benefits are offset by a corresponding increase to the valuation allowance and therefore would have no effect on the effective tax rate.
In accordance with its accounting policy, the Company recognizes accrued interest and penalties related to unrecognized tax benefits as a component of income tax expense. During fiscal 2011, $104 of interest and penalties was included as a component of income tax expense in the consolidated statement of operations. At March 31, 2011, $427 of accrued interest and penalties are included in the consolidated balance sheet.
MODINE MANUFACTURING COMPANY
NOTES TO CONSOLIDATED FINANCIAL STATEMENTS
(In thousands, except per share amounts)
The Company files income tax returns in multiple jurisdictions and is subject to examination by taxing authorities throughout the world. At March 31, 2011, the Company was not engaged in any routine income tax examinations by any federal taxing authority. The Company does not anticipate the gross liability for unrecognized tax benefits to significantly change in the next twelve months other than that which will result from the expiration of the applicable statute of limitations.
The following tax years remain subject to examination by the respective major tax jurisdictions:
|
Austria
|
Fiscal 2008 - 2010
|
|
Brazil
|
Fiscal 2005 - 2010
|
|
Germany
|
Fiscal 2006 - 2010
|
|
United States
|
Fiscal 2008 - 2010
|
At March 31, 2011, the Company has foreign tax credit carry forwards of $4,990 that, if not utilized against domestic taxes, will expire between 2015 and 2017. The Company also has federal and state research and development tax credits of $7,772 that, if not utilized against domestic taxes, will expire between 2018 and 2028. The Company also has various state and local tax loss carryforwards of $191,749 that, if not utilized against state apportioned taxable income, will expire at various times during the years 2012 through 2031. In addition, the Company has tax loss carryforwards of $249,889 in various tax jurisdictions throughout the world. Certain of these carryforwards, primarily in the U.S. and Germany, are offset by a valuation allowance. If not utilized against taxable income, $172,952 of these tax losses will expire at various times during the years 2013 and 2031 and $76,937 will not expire due to an unlimited carryforward period.
At March 31, 2011, the Company had provided $140 of U.S. tax on undistributed earnings of certain joint equity investment companies considered not permanently reinvested. Undistributed earnings considered permanently reinvested in foreign operations totaled $517,274, and no provision has been made for any U.S. taxes that would be payable upon the distribution of such earnings.
As further discussed in Note 12, the South Korean business, retained environmental liability in the Netherlands relating to the Company’s former Aftermarket business and the Electronic Cooling business are presented as discontinued operations in the comparative consolidated financial statements. The loss from discontinued operations has been presented net of income tax expense of $0, $538 and $552 for the fiscal years ended March 31, 2011, 2010 and 2009, respectively. For the year ended March 31, 2011 and March 31, 2010, the loss on sale of discontinued operations for the South Korean business has been presented net of income tax (benefit) expense of $0. For the year ended March 31, 2009, the gain on sale on sale of discontinued operations for the Electronics Cooling business has been presented net of income tax expense (benefit) of $0.
MODINE MANUFACTURING COMPANY
NOTES TO CONSOLIDATED FINANCIAL STATEMENTS
(In thousands, except per share amounts)
Note 7: Earnings per share
The computational components of basic and diluted earnings per share are summarized below:
|
Years Ended March 31
|
2011
|
2010
|
2009
|
|||||||||
|
Basic:
|
||||||||||||
|
Earnings (loss) from continuing operations
|
$ | 9,227 | $ | (19,695 | ) | $ | (104,054 | ) | ||||
|
Less: Undistributed earnings and dividends attributable to unvested shares
|
(37 | ) | - | (56 | ) | |||||||
|
Net earnings (loss) from continuing operations available to common shareholders
|
9,190 | (19,695 | ) | (104,110 | ) | |||||||
|
Net loss from discontinued operations, net of taxes
|
(3,047 | ) | (8,981 | ) | (5,015 | ) | ||||||
|
Net earnings (loss) available to common shareholders
|
$ | 6,143 | $ | (28,676 | ) | $ | (109,125 | ) | ||||
|
Basic Earnings Per Share:
|
||||||||||||
|
Weighted average shares outstanding - basic
|
46,167 | 39,298 | 32,077 | |||||||||
|
Earnings (loss) from continuing operations per common share
|
$ | 0.20 | $ | (0.50 | ) | $ | (3.25 | ) | ||||
|
Net loss from discontinued operations per common share
|
(0.07 | ) | (0.23 | ) | (0.15 | ) | ||||||
|
Net earnings (loss) per common share - basic
|
$ | 0.13 | $ | (0.73 | ) | $ | (3.40 | ) | ||||
|
Diluted:
|
||||||||||||
|
Earnings (loss) from continuing operations
|
$ | 9,227 | $ | (19,695 | ) | $ | (104,054 | ) | ||||
|
Less: Undistributed earnings and dividends attributable to unvested shares
|
(18 | ) | - | (56 | ) | |||||||
|
Net earnings (loss) from continuing operations available to common shareholders
|
9,209 | (19,695 | ) | (104,110 | ) | |||||||
|
Net loss from discontinued operations, net of taxes
|
(3,047 | ) | (8,981 | ) | (5,015 | ) | ||||||
|
Net earnings (loss) available to common shareholders
|
$ | 6,162 | $ | (28,676 | ) | $ | (109,125 | ) | ||||
|
Diluted Earnings Per Share:
|
||||||||||||
|
Weighted average shares outstanding - basic
|
46,167 | 39,298 | 32,077 | |||||||||
|
Effect of dilutive securities
|
562 | - | - | |||||||||
|
Weighted average shares outstanding - diluted
|
46,729 | 39,298 | 32,077 | |||||||||
|
Earnings (loss) from continuing operations per common share
|
$ | 0.20 | $ | (0.50 | ) | $ | (3.25 | ) | ||||
|
Net loss from discontinued operations per common share
|
(0.07 | ) | (0.23 | ) | (0.15 | ) | ||||||
|
Net earnings (loss) per common share - diluted
|
$ | 0.13 | $ | (0.73 | ) | $ | (3.40 | ) | ||||
For the years ended March 31, 2011, 2010 and 2009, the calculation of diluted earnings per share excludes 1,493, 2,094 and 2,472 stock options, respectively, and 11, 37 and 91 restricted stock awards, respectively, as these shares were anti-dilutive.
Note 8: Cash and cash equivalents
Under Modine’s cash management system, cash balances at certain banks are funded when checks are presented for payment. To the extent that checks issued, but not yet presented for payment, exceed the balance on hand at the specific bank they were written against, the amount of those un-presented checks is included in accounts payable. These credit balances included in accounts payable were $0 and $407 at March 31, 2011 and 2010, respectively.
All short-term investments at March 31, 2011 and 2010 that were of an initial duration of less than three months were recorded as cash equivalents. The recorded amount of these cash equivalents approximated fair value based on the short maturity of these instruments.
MODINE MANUFACTURING COMPANY
NOTES TO CONSOLIDATED FINANCIAL STATEMENTS
(In thousands, except per share amounts)
Note 9: Inventories
Inventories consisted of the following:
|
March 31
|
2011
|
2010
|
||||||
|
Raw materials and work in process
|
$ | 93,306 | $ | 71,329 | ||||
|
Finished goods
|
29,323 | 28,230 | ||||||
|
Total inventories
|
$ | 122,629 | $ | 99,559 | ||||
Note 10: Property, plant and equipment
Property, plant and equipment, including depreciable lives, consisted of the following:
|
March 31
|
2011
|
2010
|
||||||
|
Land
|
$ | 12,654 | $ | 12,076 | ||||
|
Buildings and improvements (10-40 years)
|
261,047 | 252,621 | ||||||
|
Machinery and equipment (3-12 years)
|
656,851 | 635,063 | ||||||
|
Office equipment (3-10 years)
|
110,501 | 106,877 | ||||||
|
Transportation equipment (3-9 years)
|
3,615 | 3,781 | ||||||
|
Construction in progress
|
58,016 | 45,677 | ||||||
| 1,102,684 | 1,056,095 | |||||||
|
Less accumulated depreciation
|
(672,389 | ) | (636,802 | ) | ||||
|
Net property, plant and equipment
|
$ | 430,295 | $ | 419,293 | ||||
Depreciation expense totaled $55,827, $63,936 and $67,003 for the years ended March 31, 2011, 2010 and 2009, respectively.
Impairment charges of $3,548 were recorded during fiscal 2011. The impairment charges included $2,215 related to assets in the Original Equipment – Europe segment related to a program cancellation and assets no longer in use. Impairment charges also included $975 within the Original Equipment – North America segment for facilities held for sale to reduce their carrying value to the estimated fair value less costs to sell. Also included in the impairment charges was $358 within the Original Equipment – Asia segment related to a program cancellation.
The Company conducted an assessment for the impairment of certain property, plant and equipment within each of the segments in fiscal 2010 based on certain triggering events during the year. During this assessment, certain long-lived assets were deemed to be impaired and a write-down to fair value was considered necessary. As a result, impairment charges of $6,548 were recorded during fiscal 2010. The impairment charges included $5,343 related to assets in the Original Equipment – North America segment for a facility with projected cash flows unable to support its asset base, for assets related to a held-for-sale facility with projected cash flows unable to support its asset base and other impairment charges for specific assets that became idle during fiscal 2010 and were no longer being utilized by the Company. Impairment charges also included $1,027 related to assets in the Original Equipment – Europe segment for assets specific to a program that was not expected to generate future cash flows and other impairment charges for specific assets that became idle during fiscal 2010 and were no longer being utilized by the Company.
Impairment charges of $26,799 were recorded during fiscal 2009. The impairment charges included $15,829 related to assets in the Original Equipment – North America segment for a facility with projected cash flows unable to support its asset base, for assets related to a cancelled program, a program which was not able to support its asset base and assets no longer in use. Impairment charges also included $10,562 related to certain manufacturing facilities in the Original Equipment – Europe segment with projected cash flows unable to support their asset bases. Also included in the impairment charges was $408 related to certain assets in the Commercial Products segment for the cancellation of a product in its development stage.
MODINE MANUFACTURING COMPANY
NOTES TO CONSOLIDATED FINANCIAL STATEMENTS
(In thousands, except per share amounts)
Gains and losses related to the disposal of property, plant and equipment are recorded in cost of sales or selling, general, and administrative expenses depending on the nature of the assets disposed. Total gains related to the disposal of property, plant and equipment were $3,448, $656 and $3,904 for the years ended March 31, 2011, 2010 and 2009, respectively.
Assets held for sale of $2,450 and $9,870 at March 31, 2011 and March 31, 2010, respectively, consist of certain facilities that the Company has closed within the Original Equipment – North America and Original Equipment – Europe segments. During fiscal 2011, the Company sold three held for sale facilities in the Original Equipment – North America and Original Equipment – Europe segments for net proceeds of $8,841 and recognized a gain on these sales of $3,258. The Company is currently marketing the two remaining facilities for sale in the Original Equipment – North America segment.
Note 11: Investment in affiliates
Investments in non-consolidated affiliates are accounted for under the equity method, and consisted of the following:
|
March 31
|
2011
|
2010
|
||||||||||
|
Percent-owned
|
||||||||||||
|
Nikkei Heat Exchanger Company, Ltd. (Japan)
|
50 | % | $ | 3,863 | $ | 3,079 | ||||||
During fiscal 2010, the Company sold its 50 percent ownership of Anhui Jianghaui Mando Climate Control Co. Ltd. for cash proceeds of $4,860, resulting in a gain of $1,465. Also during fiscal 2010, the Company sold its 41 percent investment in Construction Mechaniques Mota, S.A. to its joint venture partner for a promissory note in the amount of 3,350 euro ($4,526 U.S. equivalent), that will be paid in installments over 4 years.
During fiscal 2009, a long-lived asset impairment charge of $7,596 was recorded related to the investment in Construction Mechaniques Mota, S.A. which was determined to have a decline in its value that was “other than temporary.”
At March 31, 2011, the investment in Nikkei Heat Exchanger Company, Ltd. is equal to the Company's investment in the underlying assets.
The results of operations for Nikkei Heat Exchanger Company, Ltd. and Anhui Jianghaui Mando Climate Control Co. Ltd. (prior to the sale) are reported in the consolidated financial statements using a one-month reporting delay. Operating results for Construction Mechaniques Mota, S.A. (prior to the sale) were included using a three-month delay. Equity in earnings from non-consolidated affiliates is reported under other (income) expense – net in the consolidated statements of operations. These earnings (loss) for fiscal years ended March 31, 2011, 2010 and 2009 were $469, ($101) and $1,725, respectively.
Note 12: Discontinued operations
During fiscal 2009, the Company announced the intended divestiture of the South Korea-based vehicular, heating, ventilating and air conditioning (HVAC) business. Based on the accounting for the disposal of long-lived assets, it was determined during the fourth quarter of fiscal 2009 that the South Korean business should be presented as held for sale and as a discontinued operation in the consolidated financial statements. The operating results have been separately presented as a discontinued operation in the consolidated statement of operations for all periods presented. On December 23, 2009, the Company sold 100 percent of the shares of the South Korea-based vehicular HVAC business for net cash proceeds of $10,515. The Company recorded a loss on sale, net of taxes, of $611 during fiscal 2010. The Company recorded an additional loss on the sale, net of taxes, of $115 during fiscal 2011 related to additional legal fees incurred in conjunction with the sale.
During fiscal 2011 and 2010, the Company recorded environmental cleanup and remediation expenses of $2,932 and $911, respectfully, as a component of loss from discontinued operations related to a facility in the Netherlands that was sold as part of the spin-off of the Company’s Aftermarket business on July 22, 2005. See Note 25 for further discussion.
On May 1, 2008, the Company sold substantially all of the assets of its Electronics Cooling business for $13,149, $2,510 of which is in the form of seller financing with subordinated, promissory notes delivered by the buyer, with the remaining sales proceeds of $10,639 received in cash. The Company paid transaction expenses of $437. The Company recorded a gain on sale of $2,466, net of taxes for fiscal 2009.
MODINE MANUFACTURING COMPANY
NOTES TO CONSOLIDATED FINANCIAL STATEMENTS
(In thousands, except per share amounts)
The following results of the South Korean and Electronics Cooling businesses and the environmental cleanup and remediation in the Netherlands have been presented as loss from discontinued operations in the consolidated statement of operations:
|
Years ended March 31
|
2011
|
2010
|
2009
|
|||||||||
|
Net sales
|
$ | - | $ | 136,762 | $ | 172,867 | ||||||
|
Cost of sales and other expenses
|
2,932 | 144,594 | 179,796 | |||||||||
|
Loss before income taxes
|
(2,932 | ) | (7,832 | ) | (6,929 | ) | ||||||
|
Provision for income taxes
|
- | 538 | 552 | |||||||||
|
Loss from discontinued operations
|
$ | (2,932 | ) | $ | (8,370 | ) | $ | (7,481 | ) | |||
Upon designation as held for sale, the carrying value of the assets of the business are measured at the lower of their carrying value or their estimated fair value, less costs to sell. The Company recognized a loss of $7,646 and $6,031 on the South Korean asset group to reduce their carrying value to the estimated fair value, less costs to sell, in fiscal 2010 and 2009, respectively.
Note 13: Restructuring, plant closures and other related costs
During fiscal 2007, Modine announced a global competitiveness program intended to reduce costs, accelerate technology development, and accelerate market and geographic expansion – all intended to stimulate growth and profits. The Company initiated the following plans: relocated its Harrodsburg, Kentucky-based research and development activities to its technology center in Racine, Wisconsin; offered a voluntary early retirement program in the U.S.; implemented a reduction in force in the U.S.; and announced facility closings within North America in Toledo, Ohio; Richland, South Carolina; Jackson, Mississippi; and Clinton, Tennessee. All of these actions were completed as of March 31, 2009.
During fiscal 2008, the Company announced the closure of three U.S. manufacturing plants in Camdenton, Missouri; Pemberville, Ohio; and Logansport, Indiana, along with the Tübingen, Germany facility. During the third quarter of fiscal 2010, the Company announced the closure of its Harrodsburg, Kentucky manufacturing facility. These measures were aimed at realigning the Company’s manufacturing operations, improving profitability and strengthening global competitiveness. The Tübingen, Germany facility closure was completed at the end of the third quarter of fiscal 2010. The Pemberville, Ohio closure was completed by the end of fiscal 2010. The Harrodsburg, Kentucky and Logansport, Indiana closures were completed during the first quarter and second quarter of fiscal 2011, respectively. The Camdenton, Missouri closure is anticipated to be completed in fiscal 2012.
During fiscal 2009, the Company completed workforce reductions across all business segments. The completed workforce reductions included an approximate 25 percent reduction of the workforce in the Company’s Racine, Wisconsin headquarters and a significant reduction throughout its European facilities, including at its European headquarters in Bonlanden, Germany.
Since the commencement of these plant closures and workforce reductions, the Company has incurred $33,373 of termination charges and $21,568 of other closure costs in the aggregate. Further costs of approximately $200 are anticipated to be incurred through fiscal 2012, consisting of equipment moving costs and miscellaneous facility closing costs. Total additional cash expenditures of approximately $1,500 are anticipated to be incurred related to these closures.
Changes in the accrued restructuring liability for the years ended March 31, 2011 and 2010 were comprised of the following related to the above-described restructuring activities:
MODINE MANUFACTURING COMPANY
NOTES TO CONSOLIDATED FINANCIAL STATEMENTS
(In thousands, except per share amounts)
|
2011
|
2010
|
|||||||
|
Termination Benefits:
|
||||||||
|
Balance, April 1
|
$ | 4,740 | $ | 21,412 | ||||
|
Additions
|
103 | 2,657 | ||||||
|
Adjustments
|
(378 | ) | (3,336 | ) | ||||
|
Effect of exchange rate changes
|
13 | 773 | ||||||
|
Payments
|
(3,177 | ) | (16,766 | ) | ||||
|
Balance, March 31
|
$ | 1,301 | $ | 4,740 | ||||
The following is the summary of restructuring and other repositioning costs recorded related to the programs announced during the years ended March 31, 2011, 2010 and 2009:
|
2011
|
2010
|
2009
|
||||||||||
|
Restructuring (income) charges:
|
||||||||||||
|
Employee severance and related benefits
|
$ | (275 | ) | $ | (679 | ) | $ | 29,331 | ||||
|
Accelerated vesting of stock-based compensation
|
- | - | 1,073 | |||||||||
|
Total restructuring (income) charges
|
(275 | ) | (679 | ) | 30,404 | |||||||
|
Other repositioning costs:
|
||||||||||||
|
Pension curtailment charges
|
1,616 | - | - | |||||||||
|
Postretirement curtailment gain
|
(2,075 | ) | (1,217 | ) | - | |||||||
|
Consulting fees
|
- | 1,637 | 4,151 | |||||||||
|
Miscellaneous other closure costs
|
3,927 | 6,302 | 4,937 | |||||||||
|
Total other repositioning costs
|
3,468 | 6,722 | 9,088 | |||||||||
|
Total restructuring and other repositioning costs
|
$ | 3,193 | $ | 6,043 | $ | 39,492 | ||||||
The total restructuring and other repositioning costs were recorded in the consolidated statement of operations for the year ended March 31, 2011 as follows: $3,109 was recorded as a component of cost of sales; $359 was recorded as a component of selling, general and administrative expenses; and $275 was recorded as restructuring income. The Company accrues severance in accordance with its written plans, procedures and relevant statutory requirements. Restructuring income relates to reversals of severance liabilities due to employee terminations prior to the completion of required retention periods and favorable negotiations of severance packages. Final severance negotiations were reached including an early retirement option in lieu of severance.
The total restructuring and other repositioning costs were recorded in the consolidated statement of operations for the year ended March 31, 2010 as follows: $5,125 was recorded as a component of cost of sales; $1,597 was recorded as a component of selling, general and administrative expenses; and $679 was recorded as restructuring income.
The total restructuring and other repositioning costs were recorded in the consolidated statement of operations for the year ended March 31, 2009 as follows: $5,483 was recorded as a component of cost of sales; $3,605 was recorded as a component of selling, general and administrative expenses; and $30,404 was recorded as restructuring charges.
MODINE MANUFACTURING COMPANY
NOTES TO CONSOLIDATED FINANCIAL STATEMENTS
(In thousands, except per share amounts)
Note 14: Goodwill
The changes in the carrying amount of goodwill, by segment and in the aggregate, were as follows:
|
March 31, 2009
|
Fluctuations in foreign currency
|
March 31, 2010
|
Fluctuations in foreign currency
|
March 31, 2011
|
||||||||||||||||
|
OE - Asia
|
||||||||||||||||||||
|
Gross goodwill
|
$ | 517 | $ | 3 | $ | 520 | $ | - | $ | 520 | ||||||||||
|
Accumulated impairments
|
- | - | - | - | - | |||||||||||||||
|
Net goodwill balance
|
517 | 3 | 520 | - | 520 | |||||||||||||||
|
OE - Europe
|
||||||||||||||||||||
|
Gross goodwill
|
9,005 | 152 | 9,157 | 451 | 9,608 | |||||||||||||||
|
Accumulated impairments
|
(9,005 | ) | (152 | ) | (9,157 | ) | (451 | ) | (9,608 | ) | ||||||||||
|
Net goodwill balance
|
- | - | - | - | - | |||||||||||||||
|
OE - North America
|
||||||||||||||||||||
|
Gross goodwill
|
23,769 | - | 23,769 | - | 23,769 | |||||||||||||||
|
Accumulated impairments
|
(23,769 | ) | - | (23,769 | ) | - | (23,769 | ) | ||||||||||||
|
Net goodwill balance
|
- | - | - | - | - | |||||||||||||||
|
South America
|
||||||||||||||||||||
|
Gross goodwill
|
10,632 | 3,237 | 13,869 | 1,240 | 15,109 | |||||||||||||||
|
Accumulated impairments
|
- | - | - | - | - | |||||||||||||||
|
Net goodwill balance
|
10,632 | 3,237 | 13,869 | 1,240 | 15,109 | |||||||||||||||
|
Commercial Products
|
||||||||||||||||||||
|
Gross goodwill
|
14,490 | 673 | 15,163 | 780 | 15,943 | |||||||||||||||
|
Accumulated impairments
|
- | - | - | - | - | |||||||||||||||
|
Net goodwill balance
|
14,490 | 673 | 15,163 | 780 | 15,943 | |||||||||||||||
|
Total
|
||||||||||||||||||||
|
Gross goodwill
|
58,413 | 4,065 | 62,478 | 2,471 | 64,949 | |||||||||||||||
|
Accumulated impairments
|
(32,774 | ) | (152 | ) | (32,926 | ) | (451 | ) | (33,377 | ) | ||||||||||
|
Net goodwill balance
|
$ | 25,639 | $ | 3,913 | $ | 29,552 | $ | 2,020 | $ | 31,572 | ||||||||||
Goodwill is assessed for impairment by the Company annually or more frequently if events or circumstances change that would, more likely than not, reduce the fair value of the reporting until below its carrying value. The Company conducted its annual assessment for goodwill impairment in the third quarter of fiscal 2011 by applying a fair value-based test and determined that the fair value of the Company’s reporting units exceeded their respective book values. During fiscal 2011, the Company changed the date of its annual goodwill impairment test to the fourth quarter to better align with its annual and long-term planning process. As a result, the Company performed the impairment test as of March 31, 2011, which resulted in no impairment charge. In fiscal 2010, the fair value of the Company’s reporting units exceeded their respective book values. The Company conducted its annual assessment for goodwill impairment in the third quarter of fiscal 2009 by applying a fair value-based test and determined that the Original Equipment – Europe segment goodwill was fully impaired, necessitating a charge of $9,005. The fair value of the Company’s remaining reporting units exceeded their respective book values based on the fiscal 2009 assessment.
MODINE MANUFACTURING COMPANY
NOTES TO CONSOLIDATED FINANCIAL STATEMENTS
(In thousands, except per share amounts)
Note 15: Intangible assets
Intangible assets were comprised of the following:
|
March 31, 2011
|
March 31, 2010
|
|||||||||||||||||||||||
|
Gross Carrying Value
|
Accumulated Amortization
|
Net Intangible Assets
|
Gross Carrying Value
|
Accumulated Amortization
|
Net Intangible Assets
|
|||||||||||||||||||
|
Amortized intangible assets:
|
||||||||||||||||||||||||
|
Patents and product technology
|
$ | 3,952 | $ | (3,952 | ) | $ | - | $ | 3,952 | $ | (3,952 | ) | $ | - | ||||||||||
|
Trademarks
|
9,077 | (3,580 | ) | 5,497 | 8,726 | (2,860 | ) | 5,866 | ||||||||||||||||
|
Other intangibles
|
444 | (444 | ) | - | 416 | (337 | ) | 79 | ||||||||||||||||
|
Total amortized intangible assets
|
13,473 | (7,976 | ) | 5,497 | 13,094 | (7,149 | ) | 5,945 | ||||||||||||||||
|
Unamortized intangible assets:
|
||||||||||||||||||||||||
|
Tradename
|
1,036 | - | 1,036 | 943 | - | 943 | ||||||||||||||||||
|
Total intangible assets
|
$ | 14,509 | $ | (7,976 | ) | $ | 6,533 | $ | 14,037 | $ | (7,149 | ) | $ | 6,888 | ||||||||||
The amortization expense for intangible assets for the fiscal years ended March 31, 2011, 2010 and 2009 was $665, $670 and $960, respectively. The estimated amortization expense related to intangible assets is expected to be as follows:
|
Fiscal Year
|
Estimated Amortization Expense
|
|||
|
2012
|
$ | 605 | ||
|
2013
|
605 | |||
|
2014
|
605 | |||
|
2015
|
605 | |||
|
2016
|
605 | |||
|
2017 and beyond
|
2,472 | |||
Note 16: Indebtedness
Long-term indebtedness was comprised of the following:
|
Type of issue
|
Interest rate percentage at March 31, 2011
|
Fiscal year of maturity
|
March 31, 2011
|
March 31, 2010
|
||||||||||||
|
Denominated in U.S. dollars:
|
||||||||||||||||
|
Fixed rate -
|
||||||||||||||||
|
2015 Notes
|
10.00 | 2016 | $ | - | $ | 60,726 | ||||||||||
|
2017 Notes A
|
10.75 | 2018 | - | 40,484 | ||||||||||||
|
2017 Notes B
|
10.75 | 2018 | - | 20,242 | ||||||||||||
|
2020 Notes
|
6.83 | 2021 | 125,000 | - | ||||||||||||
|
Variable rate -
|
||||||||||||||||
|
Revolving credit facility
|
3.25 | 2015 | 6,500 | 7,500 | ||||||||||||
| 131,500 | 128,952 | |||||||||||||||
|
Capital lease obligations
|
2012-2029 | 7,344 | 7,234 | |||||||||||||
| 138,844 | 136,186 | |||||||||||||||
|
Less current portion
|
262 | 234 | ||||||||||||||
|
Total long-term debt
|
$ | 138,582 | $ | 135,952 | ||||||||||||
MODINE MANUFACTURING COMPANY
NOTES TO CONSOLIDATED FINANCIAL STATEMENTS
(In thousands, except per share amounts)
At March 31, 2010, the Company had $60,726 outstanding on 10.0 percent Senior Notes, maturing on September 29, 2015 (“2015 Notes”), $40,484 outstanding on 10.75 percent Senior Notes maturing on December 7, 2017 (“2017 Notes A”) and $20,242 outstanding on 10.75 percent Senior Notes maturing on December 7, 2017 (“2017 Notes B”). The Company also had $7,500 outstanding under its $142,110 domestic revolving credit facility, which was due to expire in July 2011.
On August 12, 2010, the Company entered into a four-year, $145,000 Amended and Restated Credit Agreement with six financial institutions led by JPMorgan Chase Bank, N.A. The credit agreement amended and restated the Company’s then existing three-year, $142,110 revolving credit facility. The Company has the right to request an increase in the aggregate commitment by up to a maximum additional amount of $50,000 subject to the agreement of JPMorgan Chase Bank, N.A. and the other lenders providing the increase in aggregate commitment. Interest is based on a variable interest rate of London Interbank Offered Rate (LIBOR) plus 250 to 375 basis points depending upon the Company’s Consolidated Total Debt to Consolidated Adjusted Earnings before Interest, Taxes, Depreciation and Amortization ratio (leverage ratio) for the then four preceding fiscal quarters. As of March 31, 2011, the Company’s variable interest rate was LIBOR plus 300 basis points, or 3.25 percent. The Company incurred $1,424 of fees to its creditors in conjunction with the Amended and Restated Credit Agreement, which will be amortized as a component of interest expense over the four-year term of the facility. At March 31, 2011, $6,500 was outstanding under the revolving credit facility.
On August 12, 2010, the Company also issued $125,000 of 6.83 percent Series A Senior Notes to Prudential Investment Management, Inc., The Prudential Insurance Company of America and Prudential Retirement Insurance and Annuity Company (collectively the “Note Holders”) maturing on August 12, 2020 (“2020 Notes”). The Company will be required to make principal payments of $4,000 quarterly beginning November 12, 2016 on the 2020 Notes. The Company may also authorize the issuance of additional senior notes in an aggregate principal amount of $25,000 under the Note Purchase Agreement among the Company and the Note Holders pursuant to a currently uncommitted facility. The Company provided under its revolving credit facility and 2020 Notes a blanket lien on all domestic assets, certain of the Company’s domestic subsidiaries are guaranteeing the Company’s outstanding borrowings, and 65 percent of the Company’s and debt guarantors’ stock in foreign subsidiaries is pledged.
The proceeds from the 2020 Notes were used to repay the outstanding 2015 Notes, 2017 Notes A and 2017 Notes B. For the year ended March 31, 2011, the Company recognized a loss of $17,866 on early extinguishment of debt as a component of interest expense, which includes the prepayment penalty of $16,570 and $1,296 of unamortized debt issuance costs.
Provisions in the Company’s Amended and Restated Credit Agreement and 2020 Notes include customary restrictive covenants. The Company is subject to an adjusted earnings before interest, taxes, depreciation and amortization (EBITDA) to interest expense (interest expense coverage ratio) covenant and a leverage ratio covenant. Adjusted EBITDA is defined as earnings from continuing operations before interest expense and provision for income taxes, adjusted to exclude unusual, non-recurring or extraordinary non-cash charges and up to $40,000 of cash restructuring and repositioning charges, not to exceed $20,000 in any fiscal year, and further adjusted to add back depreciation and amortization. The Company is required to maintain the interest expense coverage ratio and leverage ratio covenants based on the following ratios:
|
Interest Expense Coverage Ratio Covenant (Not Permitted to Be Less Than):
|
Leverage Ratio Covenant (Not Permitted to Be Greater Than):
|
|||
|
Fiscal quarter ending on or before August 12, 2014
|
3.00 to 1.0
|
3.25 to 1.0
|
||
|
All fiscal quarters ending thereafter
|
3.00 to 1.0
|
3.00 to 1.0
|
The Company was in compliance with its covenants as of March 31, 2011.
MODINE MANUFACTURING COMPANY
NOTES TO CONSOLIDATED FINANCIAL STATEMENTS
(In thousands, except per share amounts)
Long-term debt matures as follows:
|
Years ending March 31
|
||||
|
2012
|
$ | 262 | ||
|
2013
|
306 | |||
|
2014
|
316 | |||
|
2015
|
6,816 | |||
|
2016
|
316 | |||
|
2017 & beyond
|
130,828 | |||
Modine also maintains credit agreements with foreign banks. The foreign unused lines of credit in Europe, Brazil and China at March 31, 2011 were approximately $40,766. Domestic unused lines of credit at March 31, 2011, were $138,500. In aggregate, the Company had total available lines of credit of $179,266 at March 31, 2011. The availability of these funds is subject to the Company’s ability to remain in compliance with the financial covenants and limitations in the respective debt agreements.
The fair value of the long-term debt is estimated by discounting the future cash flows at rates offered to the Company for similar debt instruments of comparable maturities. At March 31, 2011 and March 31, 2010, the carrying value of Modine’s long-term debt approximated fair value, with the exception of the senior notes outstanding on those dates, which had a fair value of approximately $121,463 and $131,960, respectively.
At March 31, 2011 and March 31, 2010, the Company had short-term debt of $8,825 and $3,011, respectively, primarily consisting of short-term borrowings at foreign locations.
Interest expense charged to earnings was as follows:
|
Years ending March 31
|
2011
|
2010
|
2009
|
|||||||||
|
Gross interest cost
|
$ | 34,065 | $ | 24,162 | $ | 14,697 | ||||||
|
Capitalized interest on major construction projects
|
(342 | ) | (1,274 | ) | (922 | ) | ||||||
|
Interest expense
|
$ | 33,723 | $ | 22,888 | $ | 13,775 | ||||||
Note 17: Concentrations of credit risk/financial instruments
The Company invests excess cash in investment quality, short-term liquid debt instruments. Such investments are made only in instruments issued by high quality institutions. Financial instruments that potentially subject the Company to significant concentrations of credit risk consist principally of accounts receivable. The Company sells a broad range of products that provide thermal solutions to a diverse group of customers operating throughout the world. In fiscal 2011, 2010 and 2009, one customer accounted for ten percent or more of total Company sales. Sales to the Company’s top ten customers were approximately 58 percent, 57 percent and 59 percent of total annual sales in fiscal 2011, 2010 and 2009, respectively. At March 31, 2011, 2010 and 2009, approximately 48 percent, 47 percent and 43 percent, respectively, of the Company's trade accounts receivables were from the Company's top ten individual customers. These customers operate primarily in the automotive, truck and heavy equipment markets and are influenced by many of the same market and general economic factors. To reduce the credit risk, the Company performs periodic credit evaluations of each customer and actively monitors their financial condition and developing business news. Collateral or advanced payments are generally not required, but may be used in those cases where a substantial credit risk is identified. Credit losses to customers operating in the markets served by the Company have not been material. Total bad debt write-offs for the periods presented have been below one percent of outstanding trade receivable balances at respective year-ends. See Note 25 for further discussion on market, credit and counterparty risks.
In addition to the external borrowing, the Company has certain foreign-denominated long-term inter-company loans that are sensitive to foreign exchange rates. The Company has inter-company loans outstanding at March 31, 2011 as follows:
|
|
·
|
$15,589 among three loans to its wholly owned subsidiary, Modine Thermal Systems Private Limited (Modine India), that matures on April 30, 2013;
|
MODINE MANUFACTURING COMPANY
NOTES TO CONSOLIDATED FINANCIAL STATEMENTS
(In thousands, except per share amounts)
|
|
·
|
$12,000 between two loans to its wholly owned subsidiary, Modine Thermal Systems (Changzhou) Co. Ltd. (Changzhou, China), with various maturity dates through June 2012;
|
|
|
·
|
$15,592 loan to its wholly owned subsidiary, Modine Holding GmbH, that matures on January 31, 2020;
|
|
|
·
|
$5,782 receivable with its wholly owned subsidiary, Modine do Brazil Sistemas Terminos Ltda. (Modine Brazil) related to the interest on equity tax planning action; and
|
|
|
·
|
$300 loan to its wholly owned subsidiary, Modine Thermal Systems Korea, that matures on April 19, 2012.
|
These inter-company loans are sensitive to movement in foreign exchange rates, and the Company does not have any derivative instruments that hedge this exposure at March 31, 2011. In fiscal 2009, the Company entered into a purchase option contract to hedge the foreign exchange exposure on inter-company loans outstanding with Modine Brazil. The Company settled this derivative instrument on February 11, 2009 for cash proceeds of $1,838. These derivative instruments were not being treated as hedges, and accordingly, transaction gains or losses on the derivatives were recorded in other (income) expense – net in the consolidated statement of operations and acted to offset any currency movement on the outstanding loan receivable.
Note 18: Derivative instruments
Modine uses derivative financial instruments in a limited way as a tool to manage certain financial risks. Their use is restricted primarily to hedging assets and obligations already held by Modine, and they are used to protect cash flows rather than generate income or engage in speculative activity. Leveraged derivatives are prohibited by Company policy.
Derivative financial instruments are required to be measured at fair value and recognized as assets or liabilities in the consolidated balance sheets. Accounting for the gain or loss resulting from the change in the fair value of the derivative financial instruments depends on whether it has been designed, and is effective, as a hedge and, if so, on the nature of the hedging activity.
Commodity Derivatives: The Company enters into future contracts related to certain of the Company’s forecasted purchases of aluminum and copper. The Company’s strategy in entering into these contracts is to reduce its exposure to changing purchase prices for future purchases of these commodities. These contracts have been designated as cash flow hedges by the Company. Accordingly, unrealized gains and losses on these contracts are deferred as a component of other comprehensive (loss) income, and recognized as a component of earnings at the same time that the underlying purchases of aluminum and copper impact earnings.
In addition, the Company has entered into futures contracts from time to time related to certain of the Company’s forecasted purchases of nickel. The Company’s strategy in entering into these contracts is to reduce its exposure to changing purchase prices for future purchases of these commodities. The Company has not designated these contracts as hedges, therefore gains and losses on these contracts are recorded directly in the consolidated statements of operations. During the year ended March 31, 2011, the Company did not enter into any new futures contracts for forecasted purchases of nickel.
Interest rate derivative: On October 25, 2006, the Company entered into two forward starting swaps in anticipation of the $75,000 private placement debt offering that occurred on December 7, 2006. On November 14, 2006, the fixed interest rate of the private placement borrowing was locked and, accordingly, the Company terminated and settled the forward starting swaps at a loss of $1,812. These interest rate derivatives were treated as cash flow hedges of forecasted transactions. Accordingly, the losses were reflected as a component of accumulated other comprehensive (loss) income, and were being amortized to interest expense over the respective lives of the borrowings. In conjunction with the repayment of the 2015 and 2017 Notes on August 12, 2010, the remaining unamortized balance for these interest rate derivatives of $1,606 was reflected as a component of interest expense. The Company amortized $462 of the interest rate derivatives in proportion with the mandatory prepayment of the Senior Notes on September 30, 2009 in connection with the Company’s secondary public offering.
MODINE MANUFACTURING COMPANY
NOTES TO CONSOLIDATED FINANCIAL STATEMENTS
(In thousands, except per share amounts)
The fair value of the derivative financial instruments recorded in the consolidated balance sheets as of March 31, 2011 and March 31, 2010 are as follows:
|
Balance Sheet Location
|
March 31, 2011
|
March 31, 2010
|
|||||||
|
Derivative instruments designated as cash flow hedges:
|
|||||||||
|
Commodity derivatives
|
Deferred income taxes and other current assets
|
$ | 929 | $ | - | ||||
|
Commodity derivatives
|
Accrued expenses and other current liabilities
|
650 | 1,243 | ||||||
The amounts recorded in accumulated other comprehensive (loss) income (AOCI) and in the consolidated statement of operations for the year ended March 31, 2011 are as follows:
|
Amount of Gain Recognized in AOCI
|
Location of Loss Reclassified from AOCI into Continuing Operations
|
Amount of Gain (Loss) Reclassified from AOCI into Continuing Operations
|
|||||||
|
Designated derivative instruments:
|
|||||||||
|
Commodity derivatives
|
$ | 335 |
Cost of sales
|
$ | (7 | ) | |||
|
Interest rate derivative
|
- |
Interest expense
|
(1,751 | ) | |||||
|
Total
|
$ | 335 | $ | (1,758 | ) | ||||
The amounts recorded in AOCI and in the consolidated statement of operations for the year ended March 31, 2010 are as follows:
|
Amount of Loss Recognized in AOCI
|
Location of Loss Reclassified from AOCI into Continuing Operations
|
Amount of Loss Reclassified from AOCI into Continuing Operations
|
|||||||
|
Designated derivative instruments:
|
|||||||||
|
Commodity derivatives
|
$ | (2,020 | ) |
Cost of sales
|
$ | (5,945 | ) | ||
|
Interest rate derivative
|
(604 | ) |
Interest expense
|
(853 | ) | ||||
|
Total
|
$ | (2,624 | ) | $ | (6,798 | ) | |||
Note 19: Fair value measurements
Fair value is defined as the exchange price that would be received for an asset or paid to transfer a liability (an exit price) in the principal or most advantageous market for the asset or liability in an orderly transaction between market participants. Fair value measurements are classified under the following hierarchy:
|
·
|
Level 1 – Quoted prices for identical instruments in active markets.
|
|
·
|
Level 2 – Quoted prices for similar instruments in active markets; quoted prices for identical or similar instruments in markets that are not active; and model-derived valuations in which all significant inputs or significant value-drivers are observable in active markets.
|
|
·
|
Level 3 – Model-derived valuations in which one or more significant inputs or significant value-drivers are unobservable.
|
When available, the Company uses quoted market prices to determine fair value and classified such measurements within Level 1. In some cases, where market prices are not available, the Company makes use of observable market-based inputs to calculate fair value, in which case the measurements are classified within Level 2. If quoted or observable market prices are not available, fair value is based upon internally developed models that use, where possible, current market-based parameters such as interest rates, yield curves, currency rates, etc. These measurements are classified within Level 3.
MODINE MANUFACTURING COMPANY
NOTES TO CONSOLIDATED FINANCIAL STATEMENTS
(In thousands, except per share amounts)
Fair value measurements are classified according to the lowest level input or value-driver that is significant to the valuation. A measurement may therefore be classified within Level 3 even though there may be significant inputs that are readily observable.
Trading securities
The Company’s trading securities are a mix of various investments maintained in a deferred compensation trust to fund future obligations under Modine’s non-qualified deferred compensation plan. The securities’ fair values are the market values from active markets (such as the New York Stock Exchange (NYSE)) and are classified within Level 1 of the valuation hierarchy. The fair values of money market investments have been determined to approximate their net asset values, with no discounts for credit quality or liquidity restrictions and are classified with Level 2 of the valuation hierarchy.
Derivative financial instruments
As part of the Company’s risk management strategy, Modine enters into derivative transactions to mitigate certain identified exposures. The derivative instruments include commodity derivatives. These are not exchange traded and are customized over-the-counter derivative transactions. These derivative exposures are with counterparties that have long-term credit ratings of BBB- or better.
The Company measures fair values assuming that the unit of account is an individual derivative transaction and that derivatives are sold or transferred on a stand-alone basis. Therefore, derivative assets and liabilities are presented on a gross basis without consideration of master netting arrangements. The Company estimates the fair value of these derivative instruments based on dealer quotes as the dealer is willing to settle at the quoted prices. These derivative instruments are classified within Level 2 of the valuation hierarchy.
Deferred compensation obligation
The fair value of the deferred compensation obligation is recorded at the fair value of the investments held by the deferred compensation trust. As noted above, the fair values are the market values directly from active markets (such as the NYSE) and are classified within Level 1 of the valuation hierarchy. The fair values of money market investments have been determined to approximate their net asset values, with no discounts for credit quality or liquidity restrictions and are classified with Level 2 of the valuation hierarchy.
At March 31, 2011, the assets and liabilities that are measured at fair value on a recurring basis are classified as follows:
|
Level 1
|
Level 2
|
Level 3
|
Total Assets / Liabilities at Fair Value
|
|||||||||||||
|
Assets:
|
||||||||||||||||
|
Trading securities (short term investments)
|
$ | 2,707 | $ | 13 | $ | - | $ | 2,720 | ||||||||
|
Derivative financial instruments
|
- | 929 | - | 929 | ||||||||||||
|
Total assets
|
$ | 2,707 | $ | 942 | $ | - | $ | 3,649 | ||||||||
|
Liabilities:
|
||||||||||||||||
|
Derivative financial instruments
|
$ | - | $ | 650 | $ | - | $ | 650 | ||||||||
|
Deferred compensation obligation
|
2,723 | - | - | 2,723 | ||||||||||||
|
Total liabilities
|
$ | 2,723 | $ | 650 | $ | - | $ | 3,373 | ||||||||
MODINE MANUFACTURING COMPANY
NOTES TO CONSOLIDATED FINANCIAL STATEMENTS
(In thousands, except per share amounts)
At March 31, 2010, the assets and liabilities that are measured at fair value on a recurring basis were classified as follows:
|
Level 1
|
Level 2
|
Level 3
|
Total Assets / Liabilities at Fair Value
|
|||||||||||||
|
Assets:
|
||||||||||||||||
|
Trading securities (short term investments)
|
$ | 1,239 | $ | - | $ | - | $ | 1,239 | ||||||||
|
Total assets
|
$ | 1,239 | $ | - | $ | - | $ | 1,239 | ||||||||
|
Liabilities:
|
||||||||||||||||
|
Derivative financial instruments
|
$ | - | $ | 1,243 | $ | - | $ | 1,243 | ||||||||
|
Deferred compensation obligation
|
2,390 | - | - | 2,390 | ||||||||||||
|
Total liabilities
|
$ | 2,390 | $ | 1,243 | $ | - | $ | 3,633 | ||||||||
U.S. pension plan assets
At March 31, 2011, the U.S. pension plan assets are classified as follows:
|
Level 1
|
Level 2
|
Level 3
|
Total Assets
|
|||||||||||||
|
Money market investments
|
$ | - | $ | 11,583 | $ | - | $ | 11,583 | ||||||||
|
Common stocks
|
28,005 | 76 | - | 28,081 | ||||||||||||
|
Corporate bonds
|
- | 18,079 | - | 18,079 | ||||||||||||
|
Exchanged traded funds
|
1,693 | - | - | 1,693 | ||||||||||||
|
Foreign bonds
|
- | 3,234 | - | 3,234 | ||||||||||||
|
Pooled equity funds
|
67,245 | 11,414 | - | 78,659 | ||||||||||||
|
Pooled fixed income funds
|
14,251 | - | - | 14,251 | ||||||||||||
|
U.S. government and agency securities
|
- | 25,648 | - | 25,648 | ||||||||||||
|
Other
|
235 | 96 | - | 331 | ||||||||||||
|
Total U.S. pension plan assets
|
$ | 111,429 | $ | 70,130 | $ | - | $ | 181,559 | ||||||||
At March 31, 2010, the U.S. pension plan assets were classified as follows:
|
Level 1
|
Level 2
|
Level 3
|
Total Assets
|
|||||||||||||
|
Money market investments
|
$ | - | $ | 5,368 | $ | - | $ | 5,368 | ||||||||
|
Common stocks
|
23,519 | - | - | 23,519 | ||||||||||||
|
Corporate bonds
|
- | 16,038 | - | 16,038 | ||||||||||||
|
Exchanged traded funds
|
1,469 | - | - | 1,469 | ||||||||||||
|
Foreign bonds
|
- | 1,763 | - | 1,763 | ||||||||||||
|
Pooled equity funds
|
60,750 | 7,502 | - | 68,252 | ||||||||||||
|
Pooled fixed income funds
|
22,530 | - | - | 22,530 | ||||||||||||
|
U.S. government and agency securities
|
- | 15,309 | - | 15,309 | ||||||||||||
|
Other
|
246 | 285 | - | 531 | ||||||||||||
|
Total U.S. pension plan assets
|
$ | 108,514 | $ | 46,265 | $ | - | $ | 154,779 | ||||||||
The fair value of money market investments has been determined to approximate their net asset values, with no discounts for credit quality or liquidity restrictions and are classified within Level 2 of the valuation hierarchy. The fair value of common stocks, exchange traded funds, pooled equity funds and pooled fixed income funds are the market values from active markets (such as the NYSE) and are classified within Level 1 of the valuation hierarchy. The fair value of certain common stocks, corporate bonds, foreign bonds, pooled equity funds and U.S. government and agency securities are valued based upon recent bid prices or the average of recent bid and asking prices when available and, if not available, they are valued through matrix pricing models developed by sources considered by management to be reliable. These are classified within Level 2 of the valuation hierarchy. In addition to the above-listed pension plan assets, there was $491 of accrued interest and dividends included in the total plan assets.
MODINE MANUFACTURING COMPANY
NOTES TO CONSOLIDATED FINANCIAL STATEMENTS
(In thousands, except per share amounts)
Note 20: Product warranties, guarantees and other commitments
Product warranties: Modine provides product warranties for its assorted product lines with warranty periods generally ranging from one to ten years, with the majority falling within a two to four year time period. The Company accrues for estimated future warranty costs in the period in which the sale is recorded, and warranty expense estimates are forecasted based on the best information available using analytical and statistical analysis of both historical and current claim data. These expenses are adjusted when it becomes probable that expected claims will differ from initial estimates recorded at the time of the sale.
Changes in the warranty liability were as follows:
|
Years ended March 31
|
2011
|
2010
|
||||||
|
Balance, April 1
|
$ | 13,126 | $ | 9,107 | ||||
|
Accruals for warranties issued in current period
|
6,611 | 5,800 | ||||||
|
Accruals related to pre-existing warranties
|
1,516 | 5,562 | ||||||
|
Settlements made
|
(6,906 | ) | (7,937 | ) | ||||
|
Effect of exchange rate changes
|
334 | 594 | ||||||
|
Balance, March 31
|
$ | 14,681 | $ | 13,126 | ||||
Indemnification agreements: From time to time, the Company provides indemnification agreements related to the sale or purchase of an entity or facility. These indemnification agreements cover customary representations and warranties typically provided in conjunction with the transactions, including income, sales, excise or other tax matters, environmental matters and other third-party claims. The indemnification periods provided generally range from less than one year to fifteen years. The Company obtains insurance coverage for certain indemnification matters, as considered appropriate based on the nature of the indemnification matter or length of indemnification period. The fair value of the Company’s outstanding indemnification obligations at March 31, 2011 is not material.
Commitments: At March 31, 2011, the Company had capital expenditure commitments of $21,081. Significant commitments include tooling and equipment expenditures for new and renewal platforms with new and current customers in Europe and North America along with new program launches in Asia. The Company utilizes consignment inventory arrangements with certain vendors in the normal course of business, whereby the suppliers maintain certain inventory stock at the Company's facilities or at other outside facilities. In these cases, the Company has agreements with the vendor to use the material within a specific period of time.
MODINE MANUFACTURING COMPANY
NOTES TO CONSOLIDATED FINANCIAL STATEMENTS
(In thousands, except per share amounts)
Note 21: Common and treasury stock
Following is a summary of common and treasury stock activity for the years ended March 31, 2009, 2010 and 2011:
|
Common stock
|
Treasury stock at cost
|
|||||||||||||||
|
Shares
|
Amount
|
Shares
|
Amount
|
|||||||||||||
|
Balance, March 31, 2008
|
32,788 | $ | 20,492 | (495 | ) | $ | (13,303 | ) | ||||||||
|
Purchase of treasury stock
|
- | - | (54 | ) | (594 | ) | ||||||||||
|
Stock options and awards
|
2 | 2 | - | - | ||||||||||||
|
Balance, March 31, 2009
|
32,790 | 20,494 | (549 | ) | (13,897 | ) | ||||||||||
|
Purchase of treasury stock
|
- | - | (5 | ) | (25 | ) | ||||||||||
|
Public offering
|
13,800 | 8,625 | - | - | ||||||||||||
|
Stock options and awards
|
225 | 141 | - | - | ||||||||||||
|
Balance, March 31, 2010
|
46,815 | 29,260 | (554 | ) | (13,922 | ) | ||||||||||
|
Purchase of treasury stock
|
- | - | (5 | ) | (78 | ) | ||||||||||
|
Stock options and awards
|
290 | 180 | - | - | ||||||||||||
|
Balance, March 31, 2011
|
47,105 | $ | 29,440 | (559 | ) | $ | (14,000 | ) | ||||||||
On September 30, 2009, the Company completed a public offering of 13,800 shares of its common stock at a price of $7.15 per share. Cash proceeds were $92,858 after deducting underwriting discounts, commissions, legal, accounting and printing fees of $5,812.
The Company announced a common share repurchase program on May 18, 2005 approved by the Board of Directors which was a dual purpose program authorizing the repurchase of up to five percent of the Company’s outstanding common stock, as well as the indefinite buy-back of additional shares to offset dilution from Modine’s incentive stock plans. The five percent portion of this program was completed in fiscal 2006. No shares were repurchased under the anti-dilution portion of this program during fiscal 2009, 2010 and 2011.
During fiscal 2011, 2010 and 2009, the Company repurchased 5, 5 and 54 shares of stock, respectively, for a cost of $78, $25 and $594, respectively. The Company, pursuant to its equity compensation plans, gave participants the opportunity to deliver back to the Company the number of shares from the vesting of stock awards sufficient to satisfy the individual’s minimum tax withholding obligations. These shares are held as treasury shares.
The Company is allowed to make purchases of common stock under the Amended and Restated Credit Agreement with its primary lenders and the Note Purchase Agreement with the senior Note Holders.
Note 22: Accumulated other comprehensive loss
Comprehensive income (loss) includes net earnings (loss), foreign currency translation adjustments, the change in benefit plan adjustment and the effective portion of a cash flow hedge, net of tax that are currently presented as a component of shareholders’ equity. The Company’s total comprehensive income (loss) was $34,078, ($16,218) and ($233,016) fiscal 2011, 2010 and 2009, respectively.
The components of accumulated other comprehensive (loss) income at year end were as follows:
|
March 31
|
2011
|
2010
|
||||||
|
Unrealized foreign currency translation adjustments
|
$ | 57,831 | $ | 40,877 | ||||
|
Net loss on derivative instruments designated as cash flow hedge, net of tax
|
(281 | ) | (2,624 | ) | ||||
|
Defined benefit plans, net of tax
|
(80,083 | ) | (88,684 | ) | ||||
|
Accumulated other comprehensive loss
|
$ | (22,533 | ) | $ | (50,431 | ) | ||
MODINE MANUFACTURING COMPANY
NOTES TO CONSOLIDATED FINANCIAL STATEMENTS
(In thousands, except per share amounts)
Note 23: Stock purchase, option and award plans
The Company’s long-term stock-based incentive plans for employees consist of the following: (1) a discretionary stock option program for top managers and other key employees, and (2) a long-term incentive compensation program for officers and key executives that consists of a stock option component, restricted stock component granted for retention and performance and discretionary unrestricted stock. For fiscal 2009, the performance component of the long-term incentive compensation program consisted of an earnings per share measure (weighted at 60 percent) based on a cumulative three-year period and a total shareholder return measure (weighted at 40 percent) compared to the performance of the S&P 500 (stock price change and dividends) over the same three year period. In fiscal 2010, there was no performance component of the long-term incentive compensation program. For fiscal 2011, the performance component of the long-term incentive compensation program is based on a target compound annual growth rate in adjusted earnings before interest, taxes, deprecation and amortization (EBITDA) over a three year period (weighted at 60 percent) and a target return on average capital employed (ROACE) at the end of the three year period (weighted at 40 percent). Adjusted EBITDA is defined as earnings (loss) from continuing operations before interest expense and provision for income taxes, adjusted to exclude unusual, non-recurring or extraordinary non-cash charges and cash restructuring and repositioning charges and further adjusted to add back depreciation and amortization expense. ROACE is defined as net earnings adding back after tax interest expense and adjusted to exclude unusual, non-recurring or extraordinary non-cash charges and cash restructuring and repositioning charges; divided by the average total debt, less cash, plus shareholders’ equity.
In addition to the long-term stock-based incentive plans for employees, stock options and stock awards may be granted to non-employee directors. The Board or the Officer Nomination and Compensation Committee, as applicable, have the broad discretionary authority to set the terms of the awards of stock under the Company’s 2008 Incentive Compensation Plan. Stock options expire no later than 10 years after the grant date and have an exercise price equal to the fair market value of the common stock on the date of the grant. Unrestricted stock awards granted vest immediately.
The fulfillment of equity-based grants is currently being accomplished through the issuance of new common shares. Under the Company’s 2008 Incentive Compensation Plan, 82 shares are available for the granting of additional options and awards at March 31, 2011.
Accounting guidance for stock-based compensation requires the cash flow resulting from the tax deductions in excess of the compensation cost recognized for stock-based incentive plans (excess tax benefits) to be classified as financing cash flows. As of March 31, 2011, $810 of carryforwards related to windfall tax benefits are available to be recorded in additional paid-in capital when realized.
Stock Options: The fair value of the option awards is estimated on the date of grant using the Black-Scholes option valuation model with the following assumptions for stock options granted in fiscal 2011 and fiscal 2010:
|
2011
|
2010
|
|||||||
|
Weighted average fair value of options
|
$ | 6.43 | $ | 3.34 | ||||
|
Risk-free interest rate
|
2.36 | % | 3.19 | % | ||||
|
Expected volatility of the Company's stock
|
77.99 | % | 72.95 | % | ||||
|
Expected dividend yield on the Company's stock
|
0.00 | % | 0.00 | % | ||||
|
Expected life of options - years
|
6.3 | 6.1 | ||||||
|
Expected pre-vesting forfeiture rate
|
2.5 | % | 2.5 | % | ||||
There were no stock option awards granted during fiscal 2009.
Stock options granted have an exercise price equal to the fair market value of the common stock on the date of grant. The risk-free interest rate was based on yields of U.S. zero-coupon issues with a term equal to the expected life of the option for the week the options were granted. The expected volatility assumption was derived by referring to changes in the Company’s historical common stock prices over the same time frame as the expected life of the awards. The expected dividend yield is 0% as the Company does not anticipate paying dividends over the expected life of the options. The Company anticipates reinvesting its cash flows into the operations of the business over the expected life of the options. The expected lives of the awards are based on historical patterns and the terms of the options. All options granted in fiscal 2011 and 2010 vest 25% at grant date and 25% annually thereafter for the next three years. A pre-vesting forfeiture rate of 2.5% was used these periods as an estimate of expected forfeitures prior to completing the required service period.
MODINE MANUFACTURING COMPANY
NOTES TO CONSOLIDATED FINANCIAL STATEMENTS
(In thousands, except per share amounts)
Compensation expense recorded in fiscal 2011, 2010 and 2009 related to stock options was $1,564, $1,052 and $72 respectively. The total fair value of stock options vesting during the year ended March 31, 2011 was $1,505. As of March 31, 2011, the total compensation expense not yet recognized related to non-vested stock options was $1,105 and the weighted average period in which the remaining expense is expected to be recognized is approximately 1.7 years.
A summary of the stock option activity for the years ended March 31, 2011, 2010 and 2009 is as follows:
|
Years ended March 31
|
2011
|
2010
|
2009
|
|||||||||||||||||||||
|
Shares
|
Weighted Average exercise price
|
Shares
|
Weighted Average exercise price
|
Shares
|
Weighted average exercise price
|
|||||||||||||||||||
|
Outstanding, April 1
|
2,657 | $ | 20.05 | 2,472 | $ | 24.51 | 2,672 | $ | 25.06 | |||||||||||||||
|
Granted
|
304 | 8.58 | 666 | 5.01 | - | - | ||||||||||||||||||
|
Exercised
|
(144 | ) | 10.22 | (48 | ) | 5.18 | (2 | ) | 11.94 | |||||||||||||||
|
Forfeited or expired
|
(519 | ) | 25.92 | (433 | ) | 24.04 | (198 | ) | 32.11 | |||||||||||||||
|
Outstanding, March 31
|
2,298 | $ | 17.84 | 2,657 | $ | 20.05 | 2,472 | $ | 24.51 | |||||||||||||||
|
Exercisable, March 31
|
1,887 | $ | 20.32 | 2,237 | $ | 22.84 | 2,457 | $ | 24.58 | |||||||||||||||
The accompanying table summarizes information about stock options outstanding at March 31, 2011:
|
Options Outstanding
|
Options Exercisable
|
|||||||||||||||||||||||||||
|
Range of exercise prices
|
Shares
|
Weighted Average remaining contractual life (years)
|
Weighted Average exercise price
|
Aggregate Intrinsic value
|
Shares
|
Weighted Average exercise price
|
Aggregate Intrinsic value
|
|||||||||||||||||||||
|
$5.01 - $14.43
|
1,118 | 7.7 | $ | 8.30 | $ | 8,763 | 707 | $ | 9.36 | $ | 4,791 | |||||||||||||||||
|
$16.12 - $21.17
|
218 | 1.6 | 19.92 | - | 218 | 19.92 | - | |||||||||||||||||||||
|
$22.24 - $27.89
|
359 | 2.9 | 25.16 | - | 359 | 25.16 | - | |||||||||||||||||||||
|
$28.48 - $33.74
|
603 | 2.9 | 30.42 | - | 603 | 30.42 | - | |||||||||||||||||||||
|
$5.01 - $33.74
|
2,298 | 5.1 | $ | 17.84 | $ | 8,763 | 1,887 | $ | 20.32 | $ | 4,791 | |||||||||||||||||
The aggregate intrinsic value in the preceding table represents the pre-tax difference between the closing price of Modine common shares on the last trading day of fiscal 2011 over the exercise price of the stock option, multiplied by the number of options outstanding or exercisable. The aggregate value shown is not recorded for financial statement purposes and the value will change based upon daily changes in the fair value of Modine’s common shares.
Additional information related to stock options exercised during the years ended March 31, 2011, 2010 and 2009 were as follows:
|
Years ended March 31
|
2011
|
2010
|
2009
|
|||||||||
|
Intrinsic value of stock options exercised
|
$ | 703 | $ | 297 | $ | 8 | ||||||
|
Proceeds from stock options exercised
|
$ | 1,467 | $ | 250 | $ | 18 | ||||||
MODINE MANUFACTURING COMPANY
NOTES TO CONSOLIDATED FINANCIAL STATEMENTS
(In thousands, except per share amounts)
Restricted Stock: A summary of the restricted stock activity for the fiscal years ended March 31, 2011, 2010 and 2009 is as follows:
|
Years ended March 31
|
2011
|
2010
|
2009
|
|||||||||||||||||||||
|
Weighted Average price
|
Shares subject to restrictions
|
Weighted Average price
|
Shares subject to restrictions
|
Weighted Average price
|
Shares subject to restrictions
|
|||||||||||||||||||
|
Non-vested balance, April 1
|
$ | 8.03 | 163 | $ | 20.98 | 91 | $ | 22.51 | 232 | |||||||||||||||
|
Granted
|
8.97 | 159 | 5.45 | 208 | 14.64 | 17 | ||||||||||||||||||
|
Vested
|
10.14 | (118 | ) | 13.09 | (105 | ) | 22.32 | (144 | ) | |||||||||||||||
|
Forfeited
|
5.01 | (2 | ) | 11.12 | (31 | ) | 20.61 | (14 | ) | |||||||||||||||
|
Non-vested balance, March 31
|
$ | 7.56 | 202 | $ | 8.03 | 163 | $ | 20.98 | 91 | |||||||||||||||
At March 31, 2011, Modine had approximately $1,112 of total unrecognized compensation cost related to non-vested restricted stock. The cost is expected to be recognized over a weighted average period of 2.6 years. The amounts charged to operations using straight-line amortization in fiscal 2011, 2010 and 2009 were $1,017, $1,399, and $2,685, respectively. Under the Company’s restricted award provisions, employees of foreign subsidiaries can immediately sell their shares once the shares vest. There were no sales of restricted stock by employees of foreign subsidiaries in fiscal 2011, 2010 or 2009.
Retention restricted stock awards are granted at fair market value and vest annually over a period of four years. Management has made an estimate (based upon historical rates) of expected forfeitures and is recognizing compensation costs for those restricted shares expected to vest.
Restricted Stock – Performance-Based Shares: Shares are earned under the performance portion of the restricted stock award program based on the attainment of corporate financial goals over a three-year period and are paid at the end of that three-year performance period if the performance targets have been achieved. A new performance period may begin each fiscal year so multiple performance periods, with separate goals, operate simultaneously. For fiscal 2008 and fiscal 2009, the performance award consisted of two performance measures - an earnings per share (EPS) measure and a Total Shareholder Return (TSR) measure. Based on the fiscal 2011 and 2010 EPS, there was no expense recorded relative to the EPS portion of the fiscal 2009 or fiscal 2008 performance awards. Based upon performance calculations performed by management through March 31, 2010, no shares were issued under the TSR portion of the fiscal 2008 performance award. The final performance calculations are currently being completed for the TSR portion of the fiscal 2009 performance award. If the TSR portion of the performance goals is not achieved at the end of each three year period, compensation expense recorded is not reversed because awards with a market condition are recognized provided the requisite service period is fulfilled by the employees. The fair value of the TSR portion of the award granted in fiscal 2009 and 2008 was estimated using the Monte Carlo valuation model. The following table sets forth the assumptions used to determine the fair value of the performance award:
|
May 2008 Grant
|
May 2007 Grant
|
|||||||
|
Expected life of award - years
|
3 | 3 | ||||||
|
Risk-free interest rate
|
2.68 | % | 4.96 | % | ||||
|
Expected volatility of the Company's stock
|
36.00 | % | 29.60 | % | ||||
|
Expected dividend yield on the Company's stock
|
2.50 | % | 2.88 | % | ||||
|
Expected forfeiture rate
|
1.50 | % | 1.50 | % | ||||
There was no performance component of the long-term incentive compensation program in fiscal 2010. For fiscal 2011, the performance award was based on a target compound annual growth rate in adjusted EBITDA over a three year period and a target ROACE at the end of the three year period. The Company currently considers the attainment of these performance targets to be probable.
For the years ended March 31, 2011, 2010, and 2009, Modine recorded $1,411, $274, and $935, respectively, in compensation expense resulting from the performance awards. At March 31, 2011, Modine had approximately $2,160 of total unrecognized compensation cost related to unvested performance-based restricted stock. That cost is expected to be recognized over a weighted average period of 2.0 years.
MODINE MANUFACTURING COMPANY
NOTES TO CONSOLIDATED FINANCIAL STATEMENTS
(In thousands, except per share amounts)
Note 24: Segment and geographic information
Modine’s product lines consist of heat-transfer components and systems. Modine serves the vehicular; industrial; building heating, ventilating and air conditioning; and fuel cell original-equipment markets. The Company has five reportable segments, as follows:
Original Equipment – Asia
Comprised of vehicular and industrial original equipment products in Asia.
Original Equipment – Europe
Comprised of vehicular and industrial original equipment products in Europe.
Original Equipment – North America
Comprised of vehicular and industrial original equipment products in North America.
South America
Comprised of vehicular and industrial original equipment products and aftermarket products in South America.
Commercial Products
Comprised of building heating, ventilating and air conditioning products throughout the world.
Each Modine segment is managed at the vice-president level and has separate financial results reviewed by the Company’s chief operating decision makers. These results are used by management in evaluating the performance of each business segment, and in making decisions on the allocation of resources among the Company’s various businesses. The segment results include certain allocations of Corporate selling, general and administrative expenses, and the significant accounting policies of the segments are the same as those of Modine as a whole. In addition, the segment data is presented on a continuing operations basis, except where noted.
The following is a summary of net sales, gross profit (loss) and earnings (loss) from continuing operations by segment:
|
Years ended March 31
|
2011
|
2010
|
2009
|
|||||||||
|
Sales :
|
||||||||||||
|
Original Equipment – Asia
|
$ | 63,890 | $ | 32,231 | $ | 17,405 | ||||||
|
Original Equipment – Europe
|
546,709 | 469,399 | 597,361 | |||||||||
|
Original Equipment – North America
|
527,090 | 412,266 | 497,738 | |||||||||
|
South America
|
158,850 | 117,640 | 136,415 | |||||||||
|
Commercial Products
|
177,192 | 170,139 | 187,723 | |||||||||
|
Segment sales
|
1,473,731 | 1,201,675 | 1,436,642 | |||||||||
|
Corporate and administrative
|
1,482 | 2,791 | 3,166 | |||||||||
|
Eliminations
|
(26,978 | ) | (41,890 | ) | (32,864 | ) | ||||||
|
Sales from continuing operations
|
$ | 1,448,235 | $ | 1,162,576 | $ | 1,406,944 | ||||||
|
Years ended March 31
|
2011
|
2010
|
2009
|
|||||||||||||||||||||
|
Gross profit (loss):
|
% of sales
|
% of sales
|
% of sales
|
|||||||||||||||||||||
|
Original Equipment - Asia
|
$ | 5,224 | 8.2 | % | $ | 32 | 0.1 | % | $ | (524 | ) | -3.0 | % | |||||||||||
|
Original Equipment - Europe
|
74,539 | 13.6 | % | 58,982 | 12.6 | % | 77,575 | 13.0 | % | |||||||||||||||
|
Original Equipment - North America
|
70,795 | 13.4 | % | 46,215 | 11.2 | % | 41,769 | 8.4 | % | |||||||||||||||
|
South America
|
31,220 | 19.7 | % | 23,008 | 19.6 | % | 28,552 | 20.9 | % | |||||||||||||||
|
Commercial Products
|
48,033 | 27.1 | % | 46,815 | 27.5 | % | 42,759 | 22.8 | % | |||||||||||||||
|
Segment gross profit
|
229,811 | 15.6 | % | 175,052 | 14.6 | % | 190,131 | 13.2 | % | |||||||||||||||
|
Corporate and administrative
|
1,507 | - | (3,437 | ) | - | (3,902 | ) | - | ||||||||||||||||
|
Eliminations
|
49 | - | 117 | - | (51 | ) | - | |||||||||||||||||
|
Gross profit
|
$ | 231,367 | 16.0 | % | $ | 171,732 | 14.8 | % | $ | 186,178 | 13.2 | % | ||||||||||||
MODINE MANUFACTURING COMPANY
NOTES TO CONSOLIDATED FINANCIAL STATEMENTS
(In thousands, except per share amounts)
|
Years ended March 31
|
2011
|
2010
|
2009
|
|||||||||
|
Operating earnings (loss):
|
||||||||||||
|
Original Equipment – Asia
|
$ | (3,082 | ) | $ | (4,792 | ) | $ | (9,170 | ) | |||
|
Original Equipment – Europe
|
27,903 | 23,343 | (12,944 | ) | ||||||||
|
Original Equipment – North America
|
27,348 | 4,036 | (37,174 | ) | ||||||||
|
South America
|
12,975 | 7,600 | 11,903 | |||||||||
|
Commercial Products
|
17,469 | 19,162 | 13,926 | |||||||||
|
Segment earnings
|
82,613 | 49,349 | (33,459 | ) | ||||||||
|
Corporate and administrative
|
(39,859 | ) | (42,416 | ) | (46,024 | ) | ||||||
|
Eliminations
|
40 | 104 | (136 | ) | ||||||||
|
Other items not allocated to segments
|
(30,099 | ) | (17,302 | ) | (23,721 | ) | ||||||
|
Earnings (loss) from continuing operations before income taxes
|
$ | 12,695 | $ | (10,265 | ) | $ | (103,340 | ) | ||||
Inter-segment sales are accounted for based on an established markup over production costs. Sales eliminations represent the elimination of inter-segment sales. Operating loss for corporate and administrative includes certain research and development costs, legal, finance and other general corporate expenses. It also includes a percentage of the central services costs not directly attributable to a reportable segment. Other items not allocated to segments primarily include interest expense, interest income, foreign currency transaction gains/losses and equity in the earnings of non-consolidated affiliates.
Following is a summary of assets by segment:
|
March 31
|
2011
|
2010
|
||||||
|
Assets:
|
||||||||
|
Original Equipment – Asia
|
$ | 91,748 | $ | 62,952 | ||||
|
Original Equipment – Europe
|
392,964 | 362,879 | ||||||
|
Original Equipment – North America
|
201,757 | 216,570 | ||||||
|
South America
|
103,733 | 88,240 | ||||||
|
Commercial Products
|
102,160 | 78,545 | ||||||
|
Corporate and administrative
|
45,103 | 31,868 | ||||||
|
Assets held for sale
|
2,450 | 9,870 | ||||||
|
Eliminations
|
(22,976 | ) | (10,029 | ) | ||||
|
Total assets
|
$ | 916,939 | $ | 840,895 | ||||
Corporate assets include cash and cash equivalents, accounts and notes receivable, investments in affiliates, intangibles and significant long-lived assets. Eliminations consist primarily of trade and other receivables and property, plant and equipment. In fiscal 2011, the strengthening of the euro against the U.S. dollar increased the value of assets reported in the Original Equipment – Europe segment, from the year before, by approximately 5 percent. Additionally, the value of the Brazil real strengthened and increased the value of assets reported in the South America segment by approximately 9 percent against the U.S. dollar.
MODINE MANUFACTURING COMPANY
NOTES TO CONSOLIDATED FINANCIAL STATEMENTS
(In thousands, except per share amounts)
Following is a summary of capital expenditures and depreciation and amortization expense by segment:
|
March 31
|
2011
|
2010
|
2009
|
|||||||||
|
Capital expenditures:
|
||||||||||||
|
Original Equipment – Asia
|
$ | 10,796 | $ | 8,036 | $ | 16,047 | ||||||
|
Original Equipment – Europe
|
24,957 | 36,640 | 54,485 | |||||||||
|
Original Equipment – North America
|
11,329 | 12,919 | 25,949 | |||||||||
|
South America
|
4,127 | 2,532 | 3,970 | |||||||||
|
Commercial Products
|
3,857 | 1,871 | 2,157 | |||||||||
|
Corporate and administrative
|
(5 | ) | (1,922 | ) | - | |||||||
|
Capital expenditures - continuing operations
|
55,061 | 60,076 | 102,608 | |||||||||
|
Capital expenditures - discontinued operations
|
- | 221 | 653 | |||||||||
|
Total capital expenditures
|
$ | 55,061 | $ | 60,297 | $ | 103,261 | ||||||
|
March 31
|
2011
|
2010
|
2009
|
|||||||||
|
Depreciation and amortization expense:
|
||||||||||||
|
Original Equipment – Asia
|
$ | 3,091 | $ | 2,435 | $ | 1,360 | ||||||
|
Original Equipment – Europe
|
25,525 | 28,600 | 30,073 | |||||||||
|
Original Equipment – North America
|
19,942 | 25,864 | 28,133 | |||||||||
|
South America
|
4,038 | 3,689 | 3,702 | |||||||||
|
Commercial Products
|
3,939 | 4,065 | 4,604 | |||||||||
|
Corporate and administrative
|
2 | 11 | 172 | |||||||||
|
Eliminations
|
(45 | ) | (58 | ) | (81 | ) | ||||||
|
Depreciation and amortization expense - continuing operations
|
56,492 | 64,606 | 67,963 | |||||||||
|
Depreciation and amortization expense - discontinued operations
|
- | - | 4,134 | |||||||||
|
Total depreciation and amortization expense
|
$ | 56,492 | $ | 64,606 | $ | 72,097 | ||||||
Following is a summary of net sales by geographical area:
|
Years ended March 31
|
2011
|
2010
|
2009
|
|||||||||
|
Net sales by country:
|
||||||||||||
|
Brazil
|
$ | 156,620 | $ | 115,862 | $ | 133,188 | ||||||
|
Germany
|
280,271 | 293,077 | 365,234 | |||||||||
|
United States
|
632,278 | 515,513 | 606,654 | |||||||||
|
Other
|
379,066 | 238,124 | 301,868 | |||||||||
|
Total net sales
|
$ | 1,448,235 | $ | 1,162,576 | $ | 1,406,944 | ||||||
Net sales are attributed to countries based on the location of the selling unit.
MODINE MANUFACTURING COMPANY
NOTES TO CONSOLIDATED FINANCIAL STATEMENTS
(In thousands, except per share amounts)
Following is a summary of long-lived assets by geographical area:
|
March 31
|
2011
|
2010
|
||||||
|
Long-lived assets:
|
||||||||
|
Germany
|
$ | 149,523 | $ | 151,729 | ||||
|
United States
|
118,781 | 127,572 | ||||||
|
Other
|
180,455 | 160,390 | ||||||
|
Eliminations
|
- | (514 | ) | |||||
|
Long-lived assets
|
448,759 | 439,177 | ||||||
|
Assets held for sale
|
2,450 | 9,870 | ||||||
|
Total long-lived assets
|
$ | 451,209 | $ | 449,047 | ||||
Long-lived assets are primarily property, plant and equipment, but also include investments and other noncurrent assets. Assets held for sale for fiscal 2011 and 2010 includes certain facilities which the Company has closed or intended to close and is currently marketing for sale. Eliminations are primarily inter-company sales of property, plant and equipment.
Following is a summary of net sales by product type:
|
Years ended March 31
|
2011
|
2010
|
2009
|
|||||||||
|
Modules/packages
|
$ | 406,908 | $ | 378,443 | $ | 417,517 | ||||||
|
Oil coolers
|
232,355 | 157,756 | 219,247 | |||||||||
|
Radiators
|
187,906 | 153,515 | 225,348 | |||||||||
|
Building HVAC
|
143,137 | 140,688 | 156,075 | |||||||||
|
Charge-air coolers
|
140,154 | 95,381 | 131,668 | |||||||||
|
EGR coolers
|
130,877 | 77,958 | 103,725 | |||||||||
|
Vehicular air conditioning
|
62,979 | 45,176 | 54,884 | |||||||||
|
Other
|
143,919 | 113,659 | 98,480 | |||||||||
|
Total net sales
|
$ | 1,448,235 | $ | 1,162,576 | $ | 1,406,944 | ||||||
Note 25: Contingencies and litigation
Market risk: The Company sells a broad range of products that provide thermal solutions to a diverse group of customers operating primarily in the commercial vehicle, off-highway, automotive and commercial heating and air conditioning markets. The Company operates in diversified markets as a strategy for offsetting the risk associated with a downturn in any one or more of the markets its serves. The Company pursues new market opportunities after careful consideration of the potential associated risks and benefits. Successes in new markets are dependent on the Company’s ability to commercialize its investments. Current examples of new and emerging markets for Modine include those related to waste heat recovery and expansion into the Chinese and Indian markets. However, the risk associated with any market downturn, such as the downturn experienced in fiscal 2009 and 2010, is still present.
Credit risk: The Company manages credit risks through its focus on the following:
|
|
·
|
Cash and investments – cash deposits and short-term investments are reviewed to ensure banks have credit ratings acceptable to the Company and that all short-term investments are maintained in secured or guaranteed instruments;
|
|
|
·
|
Pension assets – ensuring that investments within these plans provide appropriate diversification, monitoring of investment teams and ensuring that portfolio managers are adhering to the Company’s investment policies and directives, and ensuring that exposure to high risk securities and other similar assets is limited; and
|
|
|
·
|
Insurance – ensuring that insurance providers have acceptable financial ratings to the Company.
|
Counterparty risks: The Company manages counterparty risks through its focus on the following:
|
|
·
|
Customers – performing thorough review of customer credit reports and accounts receivable aging reports by an internal credit committee;
|
|
|
·
|
Suppliers – implementation of a supplier risk management program and utilizing industry sources to identify and mitigate high risk situations; and
|
MODINE MANUFACTURING COMPANY
NOTES TO CONSOLIDATED FINANCIAL STATEMENTS
(In thousands, except per share amounts)
|
|
·
|
Derivatives – ensuring that counterparties to derivative instruments have acceptable credit ratings to the Company.
|
Trade Compliance: During the fourth quarter of fiscal 2011, in the course of an internal investigation into an alleged employee ethics matter at the Company’s Laredo, Texas warehouse, the Company determined that it was not in compliance with certain trade regulations related to import and export activity between its warehouse in Laredo, Texas and its plant in Nuevo Laredo, Mexico within the Commercial Products segment. The Company believes that the trade regulation issues are limited to operations at the Laredo warehouse and the Nuevo Laredo plant. As part of the investigation process, the Company has disclosed these trade compliance issues to appropriate U.S. government agencies and will fully cooperate with these agencies in their review. At March 31, 2011, the Company has recorded an estimated liability for the trade regulation issues of $4,528, which consists of an estimate for unpaid duties, interest and penalties which may be levied against the Company by the government agencies. The Company estimates that $1,759 of this exposure related to fiscal 2011, of which $675 was recorded as a component of cost of sales and $1,084 was recorded as a component of SG&A expenses. The remaining exposure of $2,769 was incurred over the previous four fiscal years, and the prior period financial statements have been revised to record this portion of the liability. See Note 1 for further discussion of the revisions. The Company’s investigation as it relates to the alleged employee ethics matter is sufficiently complete, however the government agencies have not yet begun their review related to the trade compliance matters, and accordingly, there can be no assurance about the ultimate resolution of this matter. The Company will continue to work with the government agencies and currently cannot be certain that the financial statements will not be materially impacted by duties and fines in excess of the amount accrued. However, such duties and fines in excess of the amount accrued could be material.
Environmental: At present, the United States Environmental Protection Agency (“USEPA”) has designated the Company as a potentially responsible party (“PRP”) for remediation of six sites with which the Company had involvement. These sites include: Auburn Incinerator, Inc./Lake Calumet Cluster (Illinois), LWD, Inc. (Kentucky), Circle Environmental of Dawson (two sites: Dawson, GA and Terrell County, GA), Casmalia (California), and a scrap metal site known as Chemetco (Illinois). These sites are not Company-owned and allegedly contain materials attributable to Modine from past operations. The percentage of material allegedly attributable to Modine is relatively low. Remediation of these sites is in various stages of administrative or judicial proceedings and includes recovery of past governmental costs and for future investigations and remedial actions. Costs anticipated for the remedial settlement of these sites cannot be reasonably defined at this time; however those costs are not believed to be material and have not been accrued based upon Modine’s relatively small portion of contributed materials. In addition, Modine is voluntarily participating in the care for an inactive landfill owned by the City of Trenton (Missouri).
The Company has been monitoring a groundwater contamination issue at its manufacturing facility in Brazil. The Company believes that the contamination occurred prior to its ownership of this facility. As of March 31, 2010, the Company had a reserve of $776 for environmental monitoring and investigative procedures at this site. The Company is in the process of working with its environmental consultants to determine the most appropriate means to remediate this contamination, which has migrated to neighboring properties. The Company is currently conducting a pilot program, among other analyses, that will provide additional information as to the appropriate means of remediation of the contamination as well as a more defined range of the potential costs. As a result of information obtained from the pilot program during fiscal 2011, the Company has analyzed the range of estimated costs to remediate the contamination and, based upon preliminary information, believes such cost is between approximately $1,700 and $5,500. Accordingly, the Company accrued $1,700 of expense during fiscal 2011 for the estimated liability for environmental investigation and remediation expense for this matter as no point within the estimated range is more likely than another. The undiscounted reserve for this matter totaled $2,456 at March 31, 2011. The Company is unable to determine the ultimate outcome of this matter which is subject to inherent uncertainties, including the potential for significant future expenditures in excess of the current liability. During fiscal 2011, one of the neighbors of the operation in Brazil filed suit against Modine’s Brazilian subsidiary seeking remediation and certain other damages as a result of the contamination. The Company is defending this suit and believes that the ultimate outcome of this matter will not be material.
The Company has also recorded other environmental investigation, cleanup and remediation expense accruals for certain facilities located in the United States and The Netherlands. These expenditures generally relate to facilities where past operations followed practices and procedures that were considered acceptable under then existing regulations, or where the Company is a successor to the obligations of prior owners and current laws and regulations require investigative and/or remedial work to ensure sufficient environmental compliance. The undiscounted reserves for these other environmental matters totaled $4,914 and $2,272 at March 31, 2011 and 2010, respectively. Based on updated remediation plans, the Company recorded charges of $3,193 and $1,036, net of insurance recoveries, for the years ended March 31, 2011 and 2010, respectively, of which $2,932 and $911, respectively, were recorded as a component of loss from discontinued operations. Certain of these matters are covered by various insurance policies; however, the Company does not record any insurance recoveries until these are realized or realizable. As additional information becomes available, any potential liability related to these matters is assessed and the estimates are revised, if necessary. Based on currently available information, Modine believes that the ultimate outcome of these matters, individually and in the aggregate, will not have a material adverse effect on the financial position or overall trends in results of operations. However, these matters are subject to inherent uncertainties, and unfavorable outcomes could occur, including significant monetary damages.
MODINE MANUFACTURING COMPANY
NOTES TO CONSOLIDATED FINANCIAL STATEMENTS
(In thousands, except per share amounts)
Other litigation: In the normal course of business, the Company and its subsidiaries are named as defendants in various other lawsuits and enforcement proceedings by private parties, the Occupational Safety and Health Administration, the Environmental Protection Agency, other governmental agencies and others in which claims, such as personal injury, property damage, intellectual property, labor and employment or antitrust and trade regulation issues, are asserted against Modine. At March 31, 2011 and March 31, 2010, the Company did not have an accrual related to any such matter as resulting liabilities were not deemed probable.
Employee agreements: The Company has employment agreements with certain key employees that provide for compensation and certain other benefits. The agreements also provide for other terms and conditions of employment including termination payments under certain specific circumstances such as a change in control, as defined in the agreements. In the unlikely event that these agreements were all triggered simultaneously, the possible contingent payments that would be required under the employment contracts are estimated to be approximately $11,000 depending on incentive payment calculations and other factors which are not determinable until the actual event occurs.
Note 26: Quarterly financial data (unaudited)
Quarterly financial data is summarized below for the fiscal years ended March 31, 2011 and 2010:
MODINE MANUFACTURING COMPANY
NOTES TO CONSOLIDATED FINANCIAL STATEMENTS
(In thousands, except per share amounts)
|
Fiscal 2011 quarters ended
|
June
|
Sept.
|
Dec.
|
March
|
||||||||||||
|
Net sales (a)
|
$ | 345,532 | $ | 345,902 | $ | 360,043 | $ | 396,758 | ||||||||
|
Gross profit (b)
|
58,976 | 55,769 | 56,547 | 60,075 | ||||||||||||
|
Earnings (loss) from continuing operations (c) (e)
|
5,026 | (13,690 | ) | 5,585 | 12,306 | |||||||||||
|
Net earnings (loss) (c)
|
4,988 | (16,660 | ) | 5,551 | 12,301 | |||||||||||
|
Earnings (loss) from continuing operations per common share:
|
||||||||||||||||
|
Basic
|
$ | 0.11 | $ | (0.30 | ) | $ | 0.12 | $ | 0.26 | |||||||
|
Diluted (d)
|
0.11 | (0.30 | ) | 0.12 | 0.26 | |||||||||||
|
Net earnings (loss) per common share:
|
||||||||||||||||
|
Basic
|
$ | 0.11 | $ | (0.36 | ) | $ | 0.12 | $ | 0.26 | |||||||
|
Diluted (d)
|
0.11 | (0.36 | ) | 0.12 | 0.26 | |||||||||||
|
Fiscal 2010 quarters ended
|
June
|
Sept.
|
Dec.
|
March
|
||||||||||||
|
Net sales (a)
|
$ | 253,337 | $ | 282,298 | $ | 302,167 | $ | 324,774 | ||||||||
|
Gross profit (b)
|
35,771 | 42,513 | 47,673 | 45,775 | ||||||||||||
|
(Loss) earnings from continuing operations (c) (f)
|
(5,917 | ) | (4,921 | ) | 2,191 | (11,048 | ) | |||||||||
|
Net (loss) earnings (c)
|
(14,777 | ) | (6,492 | ) | 3,844 | (11,251 | ) | |||||||||
|
(Loss) earnings from continuing operations per common share:
|
||||||||||||||||
|
Basic
|
$ | (0.18 | ) | $ | (0.15 | ) | $ | 0.05 | $ | (0.24 | ) | |||||
|
Diluted (d)
|
$ | (0.18 | ) | $ | (0.15 | ) | $ | 0.05 | $ | (0.24 | ) | |||||
|
Net (loss) earnings per common share:
|
||||||||||||||||
|
Basic
|
$ | (0.46 | ) | $ | (0.20 | ) | $ | 0.08 | $ | (0.24 | ) | |||||
|
Diluted (d)
|
$ | (0.46 | ) | $ | (0.20 | ) | $ | 0.08 | $ | (0.24 | ) | |||||
During the 4th quarter of fiscal 2011, the Company revised previously issued financial statements. See Note 1 for further discussion of these revisions. Items (a) – (d) describe the impact on the quarterly results of these revisions.
|
(a)
|
Net sales increased by $363 for the quarter ended June 30, 2010. Net sales decreased $295, $223 and $140 for the quarters ended June 30, 2009, December 31, 2009 and March 31, 2010, respectively.
|
|
(b)
|
Gross profit increased $302 for the quarter ended June 30, 2010 and decreased $1,858 and $548 for the quarters ended September 30, 2010 and December 31, 2010, respectively. Gross profit decreased $94 for the quarter ended June 30, 2009, increased $154 for the quarter ended September 30, 2009, decreased $43 for the quarter ended December 31, 2009 and increased $1,506 for the quarter ended March 31, 2010.
|
|
(c)
|
Earning (loss) from continuing operations and net earnings(loss) decreased $378, $1,928 and $439 for the quarters ended June 30, 2010, September 30, 2010 and December 31, 2010, respectively. (Loss) earnings from continuing operations and net (loss) earnings increased $274 for the quarter ended June 30, 2009, increased $35 for the quarter ended September 30, 2009, increased $65 for the quarter ended December 31, 2010 and decreased $847 for the quarter ended March 31, 2010.
|
|
(d)
|
Diluted earnings (loss) from continuing operations per share and diluted net earnings (loss) per share decreased $0.01 for the quarter ended June 30, 2010, decreased $0.04 for the quarter ended September 30, 2010 and decreased $0.01 for the quarter ended December 31, 2010. Diluted (loss) earnings from continuing operations per share increased $0.02 for the quarter ended March 31, 2010. Diluted net (loss) earnings per share decreased $0.01 for the quarters ended June 30, 2009 and September 30, 2009, respectively, and increased $0.02 for the quarter ended March 31, 2010.
|
|
(e)
|
The 2nd quarter of fiscal 2011 includes a loss from extinguishment of debt of $17,866.
|
|
(f)
|
The 2nd quarter of fiscal 2010 includes $3,159 of income from the release of restructuring liabilities and long-lived impairment charges of $3,850.
|
Report of Independent Registered Public Accounting Firm
To the Shareholders and Board of Directors of Modine Manufacturing Company:
In our opinion, the consolidated financial statements listed in the index appearing under Item 15(a)(1), present fairly, in all material respects, the financial position of Modine Manufacturing Company and its subsidiaries at March 31, 2011 and 2010, and the results of their operations and their cash flows for each of the three years in the period ended March 31, 2011 in conformity with accounting principles generally accepted in the United States of America. In addition, in our opinion, the financial statement schedule listed in the index appearing under Item 15(a)(2) presents fairly, in all material respects, the information set forth therein when read in conjunction with the related consolidated financial statements. Also in our opinion, the Company did not maintain, in all material respects, effective internal control over financial reporting as of March 31, 2011, based on criteria established in Internal Control - Integrated Framework issued by the Committee of Sponsoring Organizations of the Treadway Commission (COSO) because material weaknesses in internal control over financial reporting related to interim inventory management in the Original Equipment – North America segment and the Nuevo Laredo, Mexico facility in the Commercial Products segment, and trade compliance at the Nuevo Laredo, Mexico and Laredo, Texas facilities in the Commercial Products segment existed as of that date. A material weakness is a deficiency, or a combination of deficiencies, in internal control over financial reporting, such that there is a reasonable possibility that a material misstatement of the annual or interim financial statements will not be prevented or detected on a timely basis. The material weaknesses referred to above are described in Management's Report on Internal Control over Financial Reporting included under Item 9A. We considered these material weaknesses in determining the nature, timing, and extent of audit tests applied in our audit of the March 31, 2011 consolidated financial statements and our opinion regarding the effectiveness of the Company’s internal control over financial reporting does not affect our opinion on those consolidated financial statements. The Company's management is responsible for these financial statements and financial statement schedule, for maintaining effective internal control over financial reporting and for its assessment of the effectiveness of internal control over financial reporting included in management's report referred to above. Our responsibility is to express opinions on these financial statements, on the financial statement schedule, and on the Company's internal control over financial reporting based on our integrated audits. We conducted our audits in accordance with the standards of the Public Company Accounting Oversight Board (United States). Those standards require that we plan and perform the audits to obtain reasonable assurance about whether the financial statements are free of material misstatement and whether effective internal control over financial reporting was maintained in all material respects. Our audits of the financial statements included examining, on a test basis, evidence supporting the amounts and disclosures in the financial statements, assessing the accounting principles used and significant estimates made by management, and evaluating the overall financial statement presentation. Our audit of internal control over financial reporting included obtaining an understanding of internal control over financial reporting, assessing the risk that a material weakness exists, and testing and evaluating the design and operating effectiveness of internal control based on the assessed risk. Our audits also included performing such other procedures as we considered necessary in the circumstances. We believe that our audits provide a reasonable basis for our opinions.
A company’s internal control over financial reporting is a process designed to provide reasonable assurance regarding the reliability of financial reporting and the preparation of financial statements for external purposes in accordance with generally accepted accounting principles. A company’s internal control over financial reporting includes those policies and procedures that (i) pertain to the maintenance of records that, in reasonable detail, accurately and fairly reflect the transactions and dispositions of the assets of the company; (ii) provide reasonable assurance that transactions are recorded as necessary to permit preparation of financial statements in accordance with generally accepted accounting principles, and that receipts and expenditures of the company are being made only in accordance with authorizations of management and directors of the company; and (iii) provide reasonable assurance regarding prevention or timely detection of unauthorized acquisition, use, or disposition of the company’s assets that could have a material effect on the financial statements.
Because of its inherent limitations, internal control over financial reporting may not prevent or detect misstatements. Also, projections of any evaluation of effectiveness to future periods are subject to the risk that controls may become inadequate because of changes in conditions, or that the degree of compliance with the policies or procedures may deteriorate.
/s/PricewaterhouseCoopers LLP
PricewaterhouseCoopers LLP
Milwaukee, Wisconsin
June 14, 2011
ITEM 9. CHANGES IN AND DISAGREEMENTS WITH ACCOUNTANTS ON ACCOUNTING AND FINANCIAL DISCLOSURE.
Not applicable.
ITEM 9A. CONTROLS AND PROCEDURES.
Conclusion Regarding Disclosure Controls and Procedures
As of the end of the period covered by this Annual Report on Form 10-K, management of the Company, at the direction of the General Counsel and under the supervision, and with the participation, of the Company's President and Chief Executive Officer and Vice President, Finance, Chief Financial Officer and Treasurer, evaluated the effectiveness of the Company's disclosure controls and procedures as defined in the Securities Exchange Act Rules 13a-15(e) and 15d-15(e), with the participation of the Company's management. Based upon that evaluation, the President and Chief Executive Officer and Vice President, Finance, Chief Financial Officer and Treasurer have concluded that the design and operation of the Company's disclosure controls and procedures were not effective as of March 31, 2011 due to failure of the controls to ensure the timely disclosure of the facts underlying the material weaknesses in internal control over financial reporting described in Management’s Report on Internal Control Over Financial Reporting below. In light of the material weaknesses described below, the Company performed an additional analysis and other post-closing procedures to ensure our consolidated financial statements are prepared in accordance with generally accepted accounting principles. Our management, including our President and Chief Executive Officer and Vice President, Finance, Chief Financial Officer and Treasurer, has concluded that our consolidated financial statements for the periods covered by and included in this Annual Report on Form 10-K are fairly presented in all material respects in accordance with accounting principles generally accepted in the United States of America (GAAP) for the periods presented herein.
Management’s Report on Internal Control Over Financial Reporting
The management of the Company is responsible for establishing and maintaining adequate internal control over financial reporting, as such term is defined in Rules 13a-15(f) and 15d-15(f) under the Securities Exchange Act of 1934, as amended. The Company’s internal control over financial reporting is a process designed by, or under the supervision of, our President and Chief Executive Officer and Vice President, Finance, Chief Financial Officer and Treasurer, to provide reasonable assurance regarding the reliability of its financial reporting and the preparation of financial statements for external purposes in accordance with generally accepted accounting principles. The Company’s internal control over financial reporting includes those policies and procedures that (i) pertain to the maintenance of records that, in reasonable detail, accurately and fairly reflect the transactions and dispositions of the assets of the Company; (ii) provide reasonable assurance that transactions are recorded as necessary to permit preparation of financial statements in accordance with generally accepted accounting principles, and that receipts and expenditures of the Company are being made only in accordance with authorizations of management and directors of the Company; and (iii) provide reasonable assurance regarding prevention or timely detection of unauthorized acquisition, use, or disposition of the Company’s assets that could have a material effect on the financial statements. Because of its inherent limitations, internal control over financial reporting may not prevent or detect misstatements. Also, projections of any evaluation of effectiveness to future periods are subject to the risk that controls may become inadequate because of changes in conditions, or that the degree of compliance with the policies or procedures may deteriorate.
Management, with the participation of the Company’s President and Chief Executive Officer and Vice President, Finance, Chief Financial Officer and Treasurer, assessed the effectiveness of the Company’s internal control over financial reporting as of March 31, 2011. The assessment was based on criteria set forth by the Committee of Sponsoring Organizations of the Treadway Commission in “Internal Control—Integrated Framework.” Based on this assessment, management concluded that, as of March 31, 2011, the Company’s internal control over financial reporting was not effective due to the material weaknesses described below. These material weaknesses could result in a misstatement of the related account balances or disclosures that would result in a material misstatement to the annual or interim consolidated financial statements that would not be prevented or detected.
A material weakness is a deficiency, or a combination of deficiencies, in internal control over financial reporting, such that there is a reasonable possibility that a material misstatement of the Company’s annual or interim financial statements will not be prevented or detected on a timely basis. In connection with the assessment described above, management identified the following control deficiencies as of March 31, 2011 that constituted material weaknesses:
Interim inventory management deficiencies that aggregate to a material weakness in the Original Equipment – North America segment and the Nuevo Laredo, Mexico facility in the Commercial Products segment. The Company did not have effective controls to ensure the existence and accuracy of inventory balances at interim periods during fiscal 2011 in the Original Equipment – North America segment and the Nuevo Laredo, Mexico facility. Interim analyses to monitor inventory balances were not being performed with an appropriate level of precision, and manual adjustments made to inventory balances within the Company’s inventory sub-ledger system lacked appropriate root-cause review and supervision. In addition, there was a lack of proper interim inventory count procedures across the Original Equipment – North America and Nuevo Laredo manufacturing facilities.
Trade compliance deficiency at the Nuevo Laredo, Mexico and Laredo, Texas facilities in the Commercial Products segment. The Company did not have effective controls to ensure compliance with certain regulatory obligations related to import and export activity between its Nuevo Laredo, Mexico facility and its Laredo, Texas warehouse within the Commercial Products segment. There was a lack of policies and procedures to ensure the timely and accurate submission of required import and export regulatory filings and proper maintenance of supporting documentation as required by statute. There was also a lack of adequate monitoring of the status of the facility’s compliance with import and export regulatory requirements in order to assess the exposure, and if necessary record a liability, for noncompliance in a timely manner.
These material weaknesses resulted in the revision of prior period financial statements as disclosed in Note 1 of the Notes to Consolidated Financial Statements.
The effectiveness of the Company’s internal control over financial reporting as of March 31, 2011 has been audited by PricewaterhouseCoopers LLP, an independent registered public accounting firm, as stated in their report which appears herein.
Plan for Remediation of Material Weaknesses in Internal Control Over Financial Reporting
The Company is developing and implementing plans to address the material weaknesses discussed above. Our management has taken immediate action to begin remediating the material weaknesses identified. While certain remedial actions have been completed, we continue to actively plan for and implement additional control procedures. These remediation efforts, outlined below, are intended both to address the identified material weaknesses and to enhance our overall financial control environment:
Interim inventory management deficiency in the Original Equipment – North America segment and the Nuevo Laredo, Mexico facility in the Commercial Products segment. The following remediation plans are being implemented to address the interim inventory management deficiency:
|
·
|
The Company assigned functional responsibility to a member of senior management to establish global standards for inventory materials transactions.
|
|
·
|
All Company-owned inventories held at off-site locations will be confirmed at each quarter end;
|
|
·
|
System-generated inventory transactions have been implemented to automatically track the movement of certain inventories, which reduces the risk of manual inventory transaction errors;
|
|
·
|
Advanced authorization levels have been implemented for all manual inventory adjustments;
|
|
·
|
Monthly inventory analytical reviews are being performed for each facility, at which fluctuations in inventory balances by product, aging of inventory parts and all manual inventory adjustments are assessed;
|
|
·
|
Cycle counting procedures and more frequent physical inventory counts will be performed at the manufacturing facilities; and
|
|
·
|
Quarterly inventory variance analysis will include a review of inventory levels by category and product details.
|
Trade compliance deficiency at the Nuevo Laredo, Mexico and Laredo, Texas facilities in the Commercial Products segment. The following remediation plans are being implemented to address the trade compliance deficiency between the Company’s Nuevo Laredo, Mexico facility and its Laredo, Texas warehouse:
|
·
|
The Company appointed a Director, Global Compliance & Ethics Programs, who is responsible for overseeing the Company’s compliance and ethics program by working with management and the Company’s Board of Directors to develop programs to promote compliance with applicable rules and regulations as well as the Company’s Code of Ethics and Business Conduct. While the appointment of this individual was separate from this trade compliance issue, he is and will continue to oversee ongoing compliance.
|
|
·
|
The Company is obtaining certificates of origin for all products that are qualified under the North American Free Trade Agreement (NAFTA). The Company has also set up a procedure in which new parts will be analyzed and added to the certificate of origin if they qualify. The updated lists will also be regularly provided to the Company’s customs broker(s) to ensure that NAFTA claims will only be made on qualified goods.
|
|
·
|
The Company has drafted an import compliance manual for its Laredo, Texas warehouse, including a procedure regarding the requirements that must be met in order for Modine to claim NAFTA on goods coming into the U.S.
|
|
·
|
The Company is in the process of drafting an export compliance manual for its Laredo, Texas warehouse, as well as an import compliance manual and export compliance manual for its Nuevo Laredo, Mexico facility.
|
|
·
|
The Company hired a trade compliance expert to conduct on-site training at both the Nuevo Laredo, Mexico facility and Laredo, Texas warehouse on the import and export compliance manuals.
|
|
·
|
The Company’s Nuevo Laredo personnel are receiving training on customs valuation from outside experts.
|
|
·
|
The Company granted the appropriate power of attorney to its approved freight forwarders to make all required filings with the U.S. Census Bureau.
|
|
·
|
The Company has made appropriate personnel changes to ensure accountability.
|
Changes in Internal Control Over Financial Reporting
During the fourth quarter of fiscal 2011, there was no change in Modine’s internal control over financial reporting that materially affected, or is reasonably likely to materially affect, the Company’s internal control over financial reporting.
ITEM 9B. OTHER INFORMATION.
Omitted as not applicable.
PART III
ITEM 10. DIRECTORS, EXECUTIVE OFFICERS AND CORPORATE GOVERNANCE.
Directors. The Company incorporates by reference the information appearing in the Company's Proxy Statement for the 2011 Annual Meeting of Shareholders to be held on July 21, 2011 (the “2011 Annual Meeting Proxy Statement”) under the caption “Election of Directors.”
Executive Officers. The information in response to this Item appears under the caption "Executive Officers of the Registrant" in this Form 10-K.
Compliance with Section 16(a) of the Exchange Act. The Company incorporates by reference the information appearing in the 2011 Annual Meeting Proxy Statement under the caption “Section 16(a) Beneficial Ownership Reporting Compliance.”
Code of Ethics. The Company incorporates by reference the information appearing in the 2011 Annual Meeting Proxy Statement under the caption “Corporate Governance – Code of Ethics.” The Company's Code of Ethics (labeled as the Code of Ethics and Business Conduct) is included on its website, www.modine.com (Investor Relations link).
Board Committee Charters. The Board of Directors has approved charters for its Audit Committee, Officer Nomination and Compensation Committee, Corporate Governance and Nominating Committee and Technology Committee. These charters are included on the Company’s website, www.modine.com (Investor Relations link).
Audit Committee Financial Expert. The Company incorporates by reference the information appearing in the 2011 Annual Meeting Proxy Statement under the caption “Committees of the Board of Directors – Audit Committee.”
Audit Committee Disclosure. The Company incorporates by reference the information appearing in the 2011 Annual Meeting Proxy Statement under the captions “Committees of the Board of Directors – Audit Committee” and “Board Meetings and Committees.”
Guidelines on Corporate Governance. The Board of Directors has adopted the Guidelines on Corporate Governance. The Company’s Guidelines on Corporate Governance are included on its website, www.modine.com (Investor Relations link).
Security Holder Recommendation of Board Nominees. The Company incorporates by reference the information appearing in the 2011 Annual Meeting Proxy Statement under the caption “Shareholder Nominations and Recommendations of Director Candidates.”
ITEM 11. EXECUTIVE COMPENSATION.
The information appearing in the 2011 Annual Meeting Proxy Statement under the captions “Executive Compensation”; “Compensation of Directors”, “Committees of the Board of Directors – Officer Nomination and Compensation Committee: Compensation Committee Interlocks and Insider Participation”; and “Compensation Committee Report” is incorporated herein by reference.
ITEM 12. SECURITY OWNERSHIP OF CERTAIN BENEFICIAL OWNERS AND MANAGEMENT AND RELATED STOCKHOLDER MATTERS.
The Company incorporates by reference the information relating to stock ownership under the caption “Security Ownership of Certain Beneficial Owners and Management”, and under the caption “Equity Compensation Plan Information,” in the 2011 Annual Meeting Proxy Statement.
ITEM 13. CERTAIN RELATIONSHIPS AND RELATED TRANSACTIONS, AND DIRECTOR INDEPENDENCE.
The Company incorporates by reference the information contained in the 2011 Annual Meeting Proxy Statement under the captions “Certain Relationships and Related Transactions” and “Director Independence.”
ITEM 14. PRINCIPAL ACCOUNTANT FEES AND SERVICES.
The Company incorporates by reference the information contained in the 2011 Annual Meeting Proxy Statement under the caption “Independent Auditors’ Fees for Fiscal 2011 and 2010.”
PART IV
ITEM 15. EXHIBITS AND FINANCIAL STATEMENT SCHEDULES.
(a) Documents Filed. The following documents are filed as part of this Report:
|
Page in Form 10-K
|
|
|
1. The consolidated financial statements of Modine Manufacturing Company and its subsidiaries filed under Item 8:
|
|
|
Consolidated Statements of Operations for the years ended March 31, 2011, 2010 and 2009
|
44
|
|
Consolidated Balance Sheets at March 31, 2011 and 2010
|
45
|
|
Consolidated Statements of Cash Flows for the years ended March 31, 2011, 2010 and 2009
|
46
|
|
Consolidated Statements of Shareholders' Equity and Comprehensive Income (Loss) for the years ended March 31, 2011, 2010 and 2009
|
47
|
|
Notes to Consolidated Financial Statements
|
48-87
|
|
Report of Independent Registered Public Accounting Firm
|
88
|
|
2. Financial Statement Schedules.
|
|
|
The following financial statement schedule should be read in conjunction with the consolidated financial statements set forth in Item 8:
|
|
|
Schedule II -- Valuation and Qualifying Accounts
|
94
|
|
Schedules other than those listed above are omitted because they are not applicable, not required, or because the required information is included in the consolidated financial statements and the notes thereto.
|
|
|
3. Exhibits and Exhibit Index.
|
95-97
|
|
See the Exhibit Index included as the last part of this report, which is incorporated herein by reference. Each management contract and compensatory plan or arrangement required to be filed as an exhibit to this report is identified in the Exhibit Index by an asterisk following its exhibit number.
|
SIGNATURES
Pursuant to the requirements of Section 13 or 15(d) of the Securities Exchange Act of 1934, the registrant has duly caused this report to be signed on its behalf by the undersigned, thereunto duly authorized.
|
Date: June 14, 2011
|
Modine Manufacturing Company
|
||
|
By:
|
/s/ Thomas A. Burke
|
||
|
Thomas A. Burke, President and Chief Executive Officer
|
|||
|
(Principal Executive Officer)
|
|||
Pursuant to the requirements of the Securities Exchange Act of 1934, this report has been signed below by the following persons on behalf of the registrant and in the capacities indicated.
|
/s/ Thomas A. Burke
Thomas A. Burke
President, Chief Executive Officer and Director
(Principal Executive Officer)
|
June 14, 2011
|
|
/s/ Michael B. Lucareli
Michael B. Lucareli
Vice President, Finance, Chief Financial Officer
and Treasurer
(Principal Financial Officer)
|
June 14, 2011
|
|
/s/ Gary L. Neale
Gary L. Neale
Director
|
June 14, 2011
|
|
/s/ David J. Anderson
David J. Anderson
Director
|
June 14, 2011
|
|
/s/ Charels. P. Cooley
Charles P. Cooley
Director
|
June 14, 2011
|
|
/s/ Frank P. Incropera
Frank P. Incropera
Director
|
June 14, 2011
|
|
/s/ Frank W. Jones
Frank W. Jones
Director
|
June 14, 2011
|
|
/s/ Dennis J. Kuester
Dennis J. Kuester
Director
|
June 14, 2011
|
|
/s/ Vincent L. Martin
Vincent L. Martin
Director
|
June 14, 2011
|
|
/s/ Larry O. Moore
Larry O. Moore
Director
|
June 14, 2011
|
|
/s/ Christopher W. Patterson
Christopher W. Patterson
Director
|
June 14, 2011
|
|
/s/ Marsha C. Williams
Marsha C. Williams
Director
|
June 14, 2011
|
|
/s/ Michael T. Yonker
Michael T. Yonker
Director
|
June 14, 2011
|
MODINE MANUFACTURING COMPANY AND SUBSIDIARIES
(A Wisconsin Corporation)
SCHEDULE II - VALUATION AND QUALIFYING ACCOUNTS
for the years ended March 31, 2011, 2010 and 2009
($ In Thousands)
|
Column A
|
Column B
|
Column C
Additions
|
Column D
|
Column E
|
||||||||||||||||
| (1) | (2) | |||||||||||||||||||
|
Description
|
Balance at Beginning of Period
|
Charged (Benefit) to Costs and Expenses
|
Charged to Other Accounts
|
Deductions
|
Balance at End of Period
|
|||||||||||||||
|
2011: Allowance for Doubtful Accounts
|
$ | 2,420 | $ | (318 | ) | $ | 89 |
(B)
|
$ | 1,437 |
(A)
|
$ | 754 | |||||||
|
Valuation Allowance for Deferred Tax Assets
|
$ | 119,393 | $ | 13,662 | $ | (5,635 | )(B) | $ | - | $ | 127,420 | |||||||||
|
2010: Allowance for Doubtful Accounts
|
$ | 2,831 | $ | (8 | ) | $ | 193 |
(B)
|
$ | 596 |
(A)
|
$ | 2,420 | |||||||
|
Valuation Allowance for Deferred Tax Assets
|
$ | 105,665 | $ | 10,017 | $ | 3,711 |
(B)
|
$ | - | $ | 119,393 | |||||||||
|
2009: Allowance for Doubtful Accounts
|
$ | 2,218 | $ | 1,856 | $ | (238 | )(B) | $ | 1,005 |
(A)
|
$ | 2,831 | ||||||||
|
Valuation Allowance for Deferred Tax Assets
|
$ | 60,060 | $ | 33,230 | $ | 12,375 |
(B)
|
$ | - | $ | 105,665 | |||||||||
Notes:
(A) Bad debts charged off during the year
(B) Translation and other adjustments
MODINE MANUFACTURING COMPANY
(THE “REGISTRANT”)
(COMMISSION FILE NO. 1-1373)
EXHIBIT INDEX
TO
2011 ANNUAL REPORT ON FORM 10-K
|
Exhibit No.
|
Description
|
Incorporated Herein By Referenced To
|
Filed Herewith
|
|||
|
3.1
|
Amended and Restated Articles of Incorporation, as amended.
|
Exhibit 4.2 to Registrant’s Registration Statement on Form S-3 (333-161030) dated August 4, 2009.
|
||||
|
3.2
|
Bylaws, as amended.
|
Exhibit 3.1 to Registrant’s Current Report on Form 8-K dated May 25, 2010.
|
||||
|
4.1
|
Form of Stock Certificate of the Registrant.
|
Exhibit 4(a) to Form 10-K for the fiscal year ended March 31, 2003 ("2003 10-K").
|
||||
|
4.2
|
Amended and Restated Articles of Incorporation, as amended.
|
See Exhibit 3.1 hereto.
|
||||
|
4.3**
|
Amended and Restated Credit Agreement dated as of August 12, 2010 among the Registrant, the Foreign Subsidiary Borrowers, JPMorgan Chase Bank, N.A. as Administrative Agent, as Swing Line Lender, as LC Issuer, and as a Lender, U.S. Bank, N.A and Wells Fargo Bank, N.A., each as Syndication Agent and as a Lender, M&I Marshall & Ilsley Bank, as Documentation Agent and as a Lender, Associated Bank, N.A., and Comerica Bank.
|
Exhibit 4.1 to Registrant’s Current Report on Form 8-K dated August 12, 2010 (“August 12, 2010 8-K”)
|
||||
|
4.4**
|
Note Purchase and Private Shelf Agreement dated as of August 12, 2010 among the Registrant and the Series A Purchasers named therein of $125,000,000 6.83% Secured Senior Notes, Series A, due August 12, 2020 and $25,000,000 Private Shelf Facility and each Prudential Affiliate (as defined therein) that may become bound by certain provisions thereof.
|
Exhibit 4.2 to August 12, 2010 8-K
|
||||
|
4.5
|
Amended and Restated Collateral Agency Intercreditor Agreement dated as of August 12, 2010 among the Lenders (as defined therein), the Noteholders (as defined therein) and JPMorgan Chase Bank, N.A. as Collateral Agent.
|
Exhibit 4.3 to August 12, 2010 8-K
|
||||
|
4.6
|
Credit Facility Agreement among Modine Holding GmbH, Modine Europe GmbH and Deutsche Bank AG dated as of May 15, 2009.
|
Exhibit 10.2 to Registrant’s Form 10-Q for the quarter ended June 30, 2009 (“Fiscal 2010 First Quarter 10-Q”).
|
||||
|
10.1*
|
Director Emeritus Retirement Plan effective April 1, 1992 (and frozen as of July 1, 2000).
|
Exhibit 10(a) to Registrant’s Form 10-K for the fiscal year ended March 31, 2002 (“2002 10-K”).
|
||||
|
10.2*
|
Employment Agreement between the Registrant and Thomas A. Burke dated as of June 15, 2007.
|
Exhibit 10.3 to Registrant’s Current Report on Form 8-K dated June 15, 2007 8-K (“June 15, 2007 8-K”).
|
|
10.3*
|
Form of Amendment No. 1 to Employment Agreement entered into as of July 1, 2008 with Thomas A. Burke.
|
Exhibit 10.1 to Registrant’s Current Report on Form 8-K dated July 1, 2008.
|
||||
|
10.4*
|
Form of Change in Control and Termination Agreement (amended and restated) between the Registrant and officers other than Thomas A. Burke.
|
Exhibit 10(f) to Registrant’s Form 10-K for the year ended March 31, 2004 (“2004 10-K”).
|
||||
|
10.5*
|
Employment Agreement, dated April 25, 2009, between Modine Holding GmbH and Klaus Feldmann.
|
Exhibit 10.1 to Fiscal 2010 First Quarter 10-Q.
|
||||
|
10.6*
|
2000 Stock Incentive Plan for Non-Employee Directors (Amended and Restated as of March 16, 2005).
|
Appendix A to Registrant’s Proxy Statement for the 2005 Annual Meeting dated June 15, 2005.
|
||||
|
10.7*
|
Executive Supplemental Retirement Plan (as amended).
|
Exhibit 10(f) to Registrant's Form 10-K for the fiscal year ended March 31, 2000 ("2000 10-K").
|
||||
|
10.8*
|
Deferred Compensation Plan (as amended).
|
Exhibit 10(y) to 2003 10-K.
|
||||
|
10.9*
|
1994 Incentive Compensation Plan (as amended).
|
Exhibit 10(o) to 2002 10-K.
|
||||
|
10.10*
|
Form of Incentive and Non-Qualified Stock Option Agreements.***
|
Exhibit 10(q) to Registrant’s Form 10-K for the fiscal year ended March 31, 2001 (“200110-K”).
|
||||
|
10.11
|
Form of Stock Award Plan. ****
|
Exhibit 10(p) to 2001 10-K.
|
||||
|
10.12*
|
2000 Stock Option Plan for Non-Employee Directors.
|
Exhibit 10(ac) to 2001 10-K.
|
||||
|
10.13*
|
Form of Director's Stock Option Agreement (for 2000 Stock Option Plan for Non-Employee Directors).***
|
Exhibit 10(ad) to 200110-K.
|
||||
|
10.14*
|
2007 Incentive Compensation Plan.
|
Appendix A to the Registrant's Proxy Statement dated June 18, 2007.
|
||||
|
10.15*
|
Board of Directors Deferred Compensation Plan.
|
Exhibit 10(eee) to 2003 10-K.
|
||||
|
10.16*
|
2008 Incentive Compensation Plan.
|
Exhibit 10.2 to Registrant’s Current report on Form 8-K dated July 17, 2008.
|
||||
|
Amendment No. 1 to Form of Change in Control and Termination Agreement (amended and restated) between the Registrant and Officers other than Thomas A. Burke
|
X
|
|||||
|
Preferability letter PricewaterhouseCoopers LLP regarding a change in accounting principle dated June 14, 2011.
|
X
|
|||||
|
List of subsidiaries of the Registrant.
|
X
|
|||||
|
Consent of independent registered public accounting firm.
|
X
|
|
Rule 13a-14(a)/15d-14(a) Certification of Thomas A. Burke, President and Chief Executive Officer.
|
X
|
|||||
|
Rule 13a-14(a)/15d-14(a) Certification of Michael B. Lucareli, Vice President, Finance, Chief Financial Officer and Treasurer.
|
X
|
|||||
|
Section 1350 Certification of Thomas A. Burke, President and Chief Executive Officer.
|
X
|
|||||
|
Section 1350 Certification of Michael B. Lucareli, Vice President, Finance, Chief Financial Officer and Treasurer.
|
X
|
|
*
|
Denotes management contract or executive compensation plan or arrangement required to be filed as an exhibit pursuant to Item 15 of Form 10-K.
|
|
**
|
Pursuant to Item 601(b)(4)(iii)(A) of Regulation S-K, the Registrant has omitted certain agreements with respect to long-term debt not exceeding 10% of consolidated total assets. The Registrant agrees to furnish a copy of any such agreements to the Securities and Exchange Commission upon request.
|
|
***
|
Each year the Company enters into Stock Option Agreements, the terms of which are not materially different from the form agreement included herewith.
|
|
****
|
Each year the Company enters into a Stock Award Plan, the terms of which are not materially different from the form agreement included herewith.
|
97