Attached files
| file | filename |
|---|---|
| 8-K - FORM 8-K - Delek US Holdings, Inc. | c18667e8vk.htm |
Exhibit 99.1

| Investor Presentation |

| Safe Harbor Provision 2 Delek US Holdings is traded on the New York Stock Exchange in the United States under the symbol "DK" and, as such, is governed by the rules and regulations of the United States Securities and Exchange Commission. This presentation may contain forward-looking statements that are based upon current expectations and involve a number of risks and uncertainties. Statements concerning our current estimates, expectations and projections about our future results, performance, prospects and opportunities and other statements, concerns, or matters that are not historical facts are "forward-looking statements," as that term is defined under United States securities laws. Investors are cautioned that the following important factors, among others, may affect these forward-looking statements. These factors include but are not limited to: management's ability to execute its strategy of growth through acquisitions and transactional risks in acquisitions; our competitive position and the effects of competition; the projected growth of the industry in which we operate; changes in the scope, costs, and/or timing of capital projects; losses from derivative instruments; general economic and business conditions, particularly levels of spending relating to travel and tourism or conditions affecting the southeastern United States; risks and uncertainties with the respect to the quantities and costs of crude oil, the costs to acquire feedstocks and the price of the refined petroleum products we ultimately sell; potential conflicts of interest between our majority stockholder and other stockholders; and other risks contained in our filings with the Securities and Exchange Commission. Forward-looking statements should not be read as a guarantee of future performance or results and will not be accurate indications of the times at, or by which such performance or results will be achieved. Forward-looking information is based on information available at the time and/or management's good faith belief with respect to future events, and is subject to risks and uncertainties that could cause actual performance or results to differ materially from those expressed in the statements. Delek US undertakes no obligation to update or revise any such forward-looking statements. |
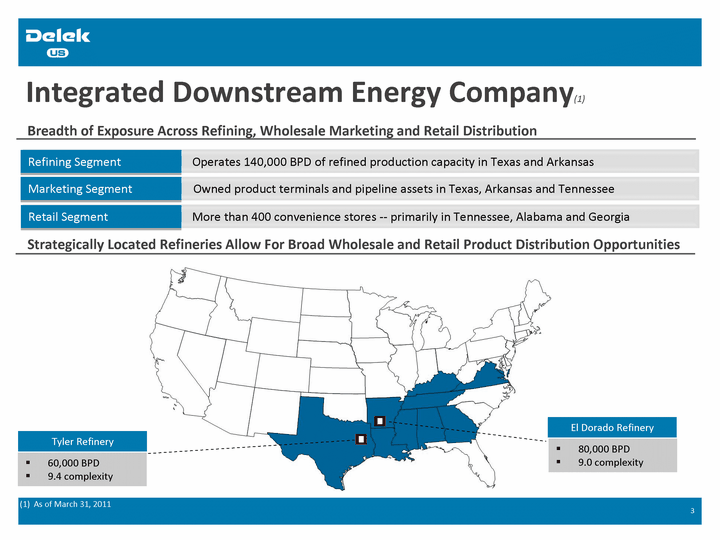
| Integrated Downstream Energy Company(1) Breadth of Exposure Across Refining, Wholesale Marketing and Retail Distribution Operates 140,000 BPD of refined production capacity in Texas and Arkansas Refining Segment ) Owned product terminals and pipeline assets in Texas, Arkansas and Tennessee Marketing Segment More than 400 convenience stores -- primarily in Tennessee, Alabama and Georgia Retail Segment 3 60,000 BPD 9.4 complexity (1) As of March 31, 2011 Tyler Refinery 80,000 BPD 9.0 complexity El Dorado Refinery Strategically Located Refineries Allow For Broad Wholesale and Retail Product Distribution Opportunities |
| Lion Oil Transaction Executive Summary |

| Transaction Summary Asset Overview Purchase Summary 80,000 BPD refinery in El Dorado, Arkansas 80-mile Magnolia-El Dorado crude oil system (Shreveport, LA to Magnolia terminal) 28-mile El Dorado crude oil system (Magnolia terminal to El Dorado refinery) Crude oil gathering system with more than 800 miles of pipelines 3 light product distribution terminals (Memphis and Nashville, TN; El Dorado, AR) Owned asphalt distribution terminal in El Dorado, Arkansas Transaction completed on April 29, 2011 Delek US has acquired Ergon's 53.7% equity interest in Lion Oil for a combination of cash, stock and the payment and replacement of all debt owed by Lion to Ergon as follows: $45 million in restricted Delek US Common Stock(1) $50 million cash payment to Ergon $50 million term note executed by Lion Oil payable to Ergon; secured by Delek US Lion Oil divested certain non-refining assets to Ergon Delek US has assisted Lion Oil in obtaining third-party financing of working capital 5 Determined by the average closing price of Delek US' common stock as reported on the NYSE for the ten consecutive trading days immediately preceding the closing date on April 29, 2011. In total, 3,292,844 shares of common stock issued to Ergon in conjunction with the purchase agreement. |
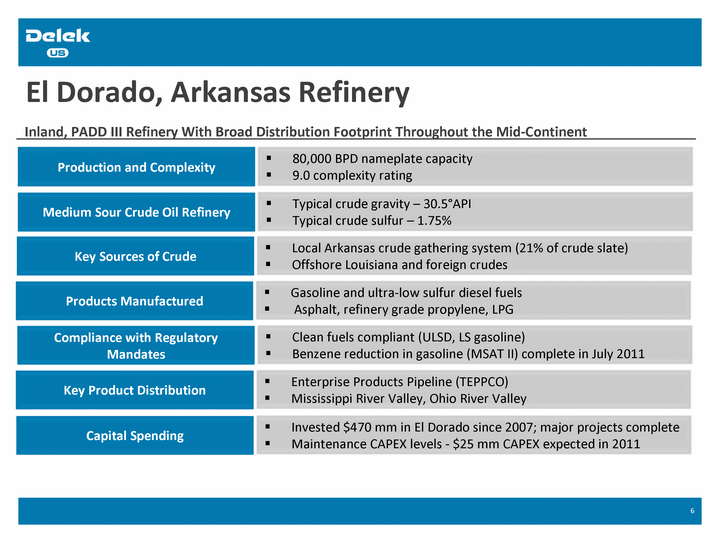
| El Dorado, Arkansas Refinery 6 Inland, PADD III Refinery With Broad Distribution Footprint Throughout the Mid-Continent Medium Sour Crude Oil Refinery Typical crude gravity - 30.5°API Typical crude sulfur - 1.75% Key Sources of Crude Local Arkansas crude gathering system (21% of crude slate) Offshore Louisiana and foreign crudes Production and Complexity 80,000 BPD nameplate capacity 9.0 complexity rating Key Product Distribution Enterprise Products Pipeline (TEPPCO) Mississippi River Valley, Ohio River Valley Compliance with Regulatory Mandates Clean fuels compliant (ULSD, LS gasoline) Benzene reduction in gasoline (MSAT II) complete in July 2011 Capital Spending Invested $470 mm in El Dorado since 2007; major projects complete Maintenance CAPEX levels - $25 mm CAPEX expected in 2011 Products Manufactured Gasoline and ultra-low sulfur diesel fuels Asphalt, refinery grade propylene, LPG |

| El Dorado Refinery Crude Slate (Calendar 2010) 7 El Dorado processes a combination of local Arkansas, domestic offshore and foreign crude oils Louisiana Offshore crude oil includes: Eugene Island, Louisiana Light Sweet, Mars, North Louisiana Sweet, Poseidon and Thunder Horse Blend Other crude oils includes: Yoho condensate, Basrah Light and Appalachian Light Sweet Local Arkansas Crudes are WTI- linked |

| Transaction Expected To Diversify Delek US' Crude Slate 8 Balanced Exposure - Less Dependence on Light, Sweet Crude Pricing Essentially 50/50 (Sour-intermediate vs. Light) Crude Slate Becomes More Balanced Crude Slate Transition - Pre/Post Transaction Tyler Refinery El Dorado Refinery Pro-Forma (Combined) |

| Anticipated Combined Product Slate(1) 9 Tyler Refinery El Dorado Refinery Pro-Forma (Combined) (1) "Other" includes LPG, Black Oil and other residual products |

| Light Product Marketing Throughout the Mid-Continent 10 Access To The Enterprise Products Pipeline(1) Integration Opportunity Expands marketing opportunity into the Mid-Continent El Dorado expected to supply MAPCO store locations in Tennessee and Arkansas Tyler and El Dorado Expected To Ship Product North Supply markets that support better margins Expand Retail Store Presence In Adjacent Markets Opportunity to build/acquire new store locations in markets adjacent to El Dorado (i.e. Little Rock, Arkansas) (1) Formerly the TEPPCO pipeline system |
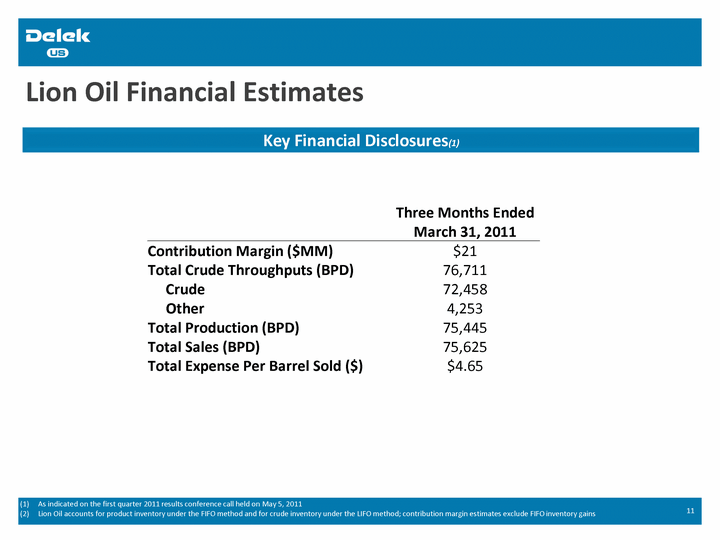
| Lion Oil Financial Estimates 11 Key Financial Disclosures(1) As indicated on the first quarter 2011 results conference call held on May 5, 2011 Lion Oil accounts for product inventory under the FIFO method and for crude inventory under the LIFO method; contribution margin estimates exclude FIFO inventory gains Three Months Ended March 31, 2011 Contribution Margin ($MM) $21 Total Crude Throughputs (BPD) 76,711 Crude 72,458 Other 4,253 Total Production (BPD) 75,445 Total Sales (BPD) 75,625 Total Expense Per Barrel Sold ($) $4.65 |
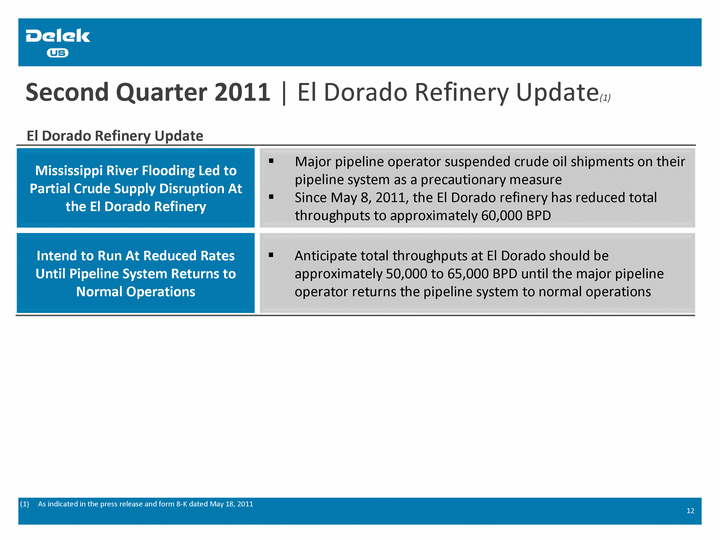
| Second Quarter 2011 | El Dorado Refinery Update(1) 12 As indicated in the press release and form 8-K dated May 18, 2011 Mississippi River Flooding Led to Partial Crude Supply Disruption At the El Dorado Refinery Major pipeline operator suspended crude oil shipments on their pipeline system as a precautionary measure Since May 8, 2011, the El Dorado refinery has reduced total throughputs to approximately 60,000 BPD Intend to Run At Reduced Rates Until Pipeline System Returns to Normal Operations Anticipate total throughputs at El Dorado should be approximately 50,000 to 65,000 BPD until the major pipeline operator returns the pipeline system to normal operations El Dorado Refinery Update |

| Refining Segment Operational Update |

| Refining Segment | Tyler Refinery Update Tyler Refinery Update 14 Refining Segment Drove Strong First Quarter Results Gulf Coast Refining Economics Remain Strong Early Into 2Q:11 WTI Discount Continues To Benefit Tyler During 2Q:11 Decline in volumetric loss following recent capital work As of June 9, 2011 As indicated in the form 10-Q filed with the SEC on May 6, 2011 Lower CAPEX requirements Ahead |
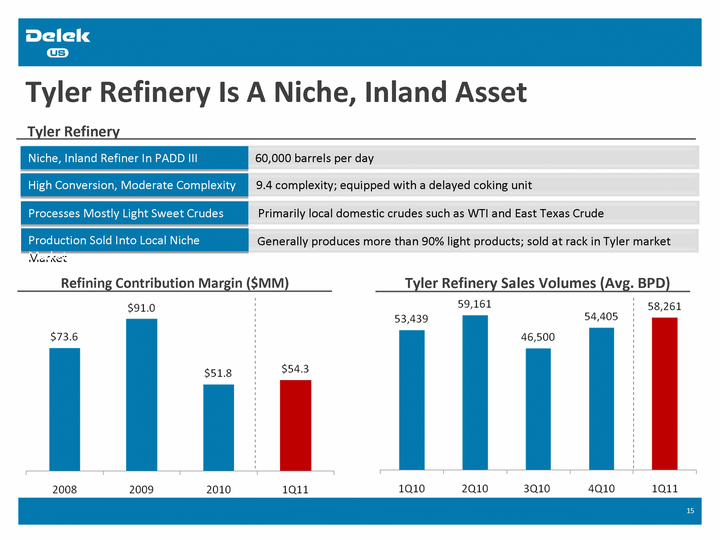
| Tyler Refinery Is A Niche, Inland Asset Tyler Refinery 60,000 barrels per day Niche, Inland Refiner In PADD III ) 9.4 complexity; equipped with a delayed coking unit High Conversion, Moderate Complexity Primarily local domestic crudes such as WTI and East Texas Crude Processes Mostly Light Sweet Crudes Refining Contribution Margin ($MM) 15 Generally produces more than 90% light products; sold at rack in Tyler market Production Sold Into Local Niche Market Tyler Refinery Sales Volumes (Avg. BPD) |
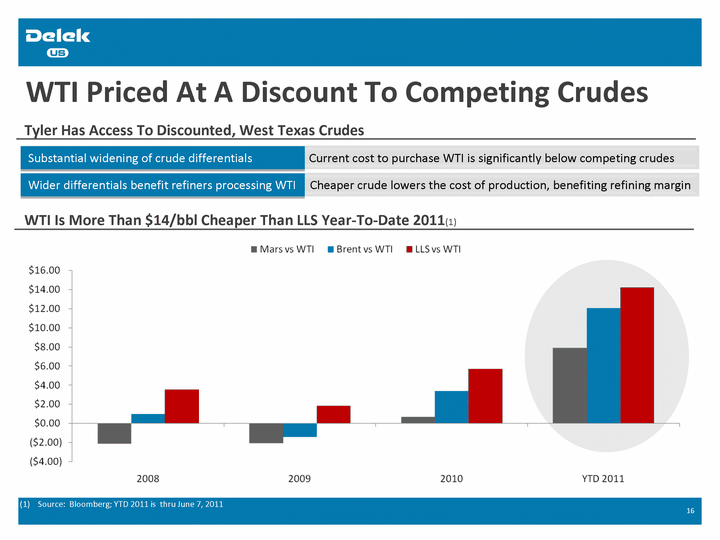
| WTI Priced At A Discount To Competing Crudes Current cost to purchase WTI is significantly below competing crudes Substantial widening of crude differentials ) Cheaper crude lowers the cost of production, benefiting refining margin Wider differentials benefit refiners processing WTI 16 WTI Is More Than $14/bbl Cheaper Than LLS Year-To-Date 2011(1) Source: Bloomberg; YTD 2011 is thru June 7, 2011 Tyler Has Access To Discounted, West Texas Crudes |

| WTI Contango Market Structure Favors Tyler WTI Contango Benefit Effectively Reduces Tyler's Cost of Crude Oil Tyler historically has purchased mostly WTI - an inexpensive local crude Purchase Light, Sweet, Domestic Crudes ) Serves as a reduction to our cost of goods; benefits refining margin Contango Lessens Our Cost of Crude 17 WTI (Contango) Differential To CMA NYMEX(1) (1) Quarterly contango calculation derived from Argus Media (trade) month average prices |

| Contango Benefits The "Theoretical" Benchmark Building a Theoretical Benchmark High-Sulfur Diesel 5-3-2 Gulf Coast Crack Spread + Contango = Theoretical Margin "Theoretical" Benchmark For Tyler 18 High-Sulfur Diesel 5-3-2 Gulf Coast Crack Spread, Including Contango Benefit* *Source: WTI Backwardation/Contango data is supplied by Argus Media; all crack spread data supplied by Platts; crack spread data for June 2011 is thru June 9, 2011 |

| Refining Benchmark Well Above Historical Levels 19 Crack Spread (per bbl) Reached Multi-Year High During April-May-June 2011(1) (1) Source: Platts; references the High Sulfur Diesel 5-3-2 Gulf Coast Crack Spread; June 2011 data is as of June 9, 2011 Recent Elevated 5-3-2 Gulf Coast Crack Spread Strong Refining Economics Entering 2011 Improved Benchmark Refining Economics During Early 2011 Nearly $10/bbl Above 4-Yr Trailing Average in April 2011 More Than $9/bbl Above 4-Yr Trailing Average in May 2011 More Than $10/bbl Above 4-Yr Trailing Average in June 2011 |
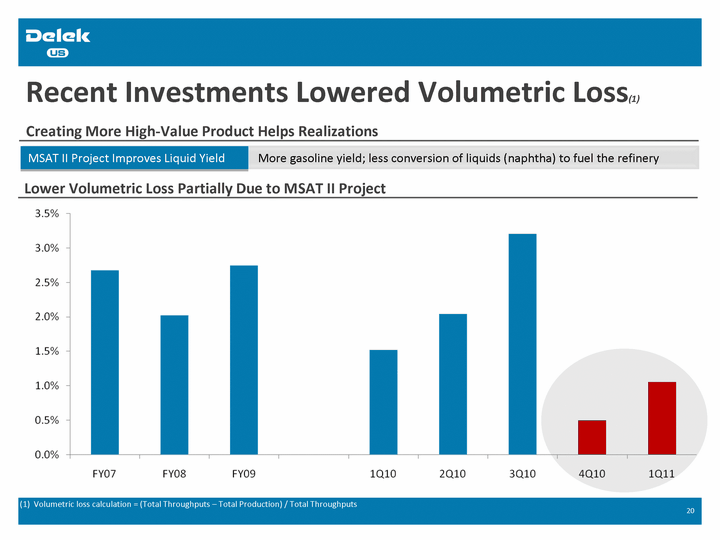
| Recent Investments Lowered Volumetric Loss(1) More gasoline yield; less conversion of liquids (naphtha) to fuel the refinery MSAT II Project Improves Liquid Yield 20 Lower Volumetric Loss Partially Due to MSAT II Project Creating More High-Value Product Helps Realizations (1) Volumetric loss calculation = (Total Throughputs - Total Production) / Total Throughputs |
| Retail Segment Operational Update |

| Retail Segment | Operational Update 22 Seven Consecutive Quarters of Same- Store Merchandise Sales Growth(1) Higher Crude Prices Generally Impact Demand, Retail Fuel Margins Food Service Initiative Gaining Momentum Private Label Initiative - A Key Margin Driver Store Reimaging Program Successful - Remains a Key Focus in 2011 Multi-Year New Store Construction Program Begins In 2011(2) Thru the first quarter 2011 As indicated on the Company's Fourth Quarter 2010 Earnings Conference Call |
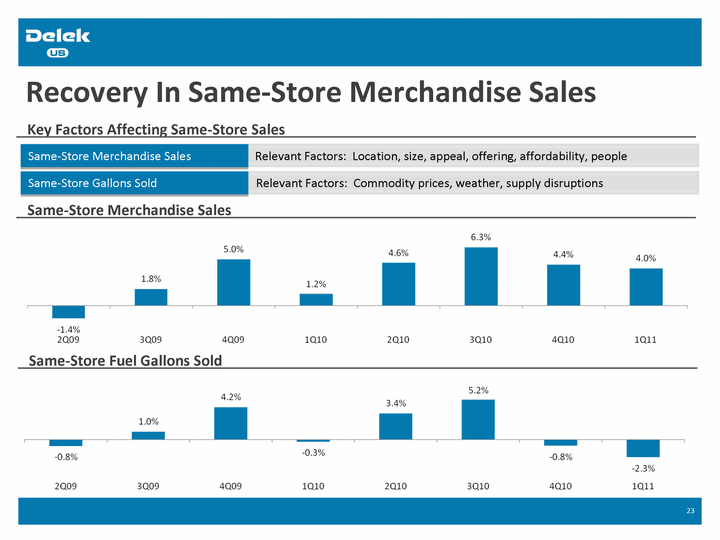
| Recovery In Same-Store Merchandise Sales Key Factors Affecting Same-Store Sales Relevant Factors: Location, size, appeal, offering, affordability, people Same-Store Merchandise Sales ) Relevant Factors: Commodity prices, weather, supply disruptions Same-Store Gallons Sold 23 Same-Store Merchandise Sales Same-Store Fuel Gallons Sold |
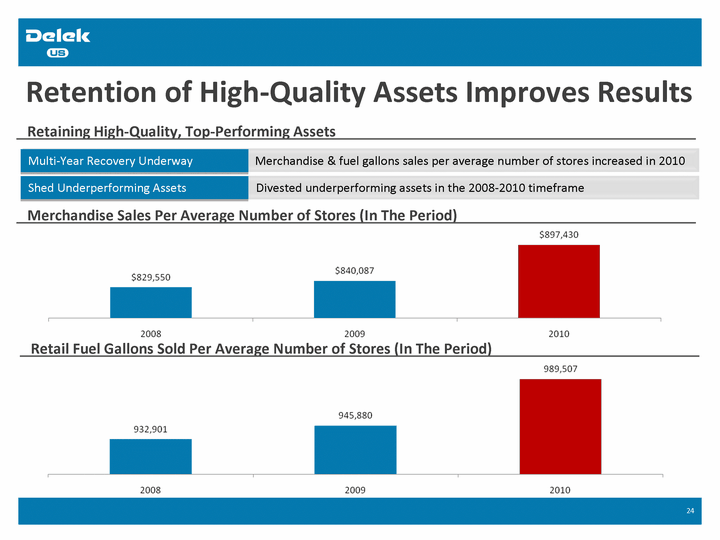
| Retention of High-Quality Assets Improves Results Retaining High-Quality, Top-Performing Assets Merchandise & fuel gallons sales per average number of stores increased in 2010 Multi-Year Recovery Underway ) Divested underperforming assets in the 2008-2010 timeframe Shed Underperforming Assets 24 Merchandise Sales Per Average Number of Stores (In The Period) Retail Fuel Gallons Sold Per Average Number of Stores (In The Period) |

| Fresh Food Service Initiative Performing Well Opportunity To Grow Inside Sales and Margins Redefining the utility of the neighborhood convenience store Food Service as a Destination Point ) Food service margins exceed the trailing corporate merchandise margin average Food Service as a Margin Driver 25 Same-Store Sales of Food Service |
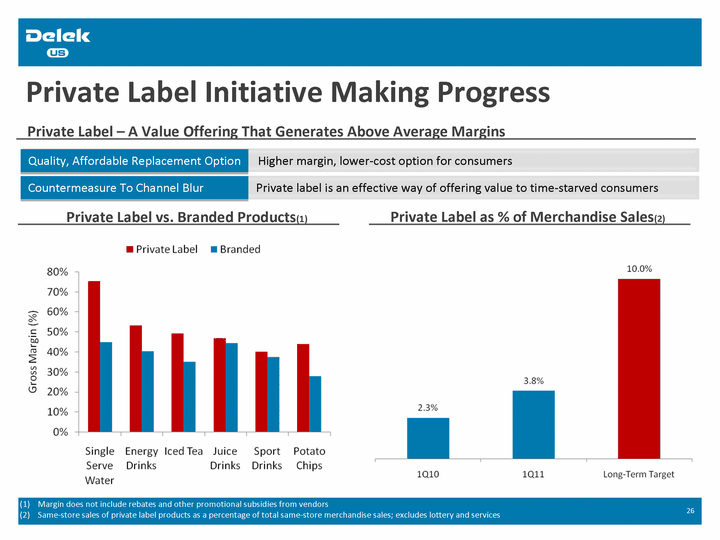
| Private Label Initiative Making Progress Private Label - A Value Offering That Generates Above Average Margins Higher margin, lower-cost option for consumers Quality, Affordable Replacement Option ) Private label is an effective way of offering value to time-starved consumers Countermeasure To Channel Blur 26 Private Label vs. Branded Products(1) Margin does not include rebates and other promotional subsidies from vendors Same-store sales of private label products as a percentage of total same-store merchandise sales; excludes lottery and services Private Label as % of Merchandise Sales(2) |

| Store Reimaging & New Construction Initiatives Elevate MAPCO Brand Through Store Remodeling and New Construction More than 36% of store base was reimaged or newly constructed as of 3/31/11 Multi-Year Store Enhancement Initiative ) Construct 10-20 new stores per annum in the 2011-2015 timeframe(1) Five-Year New Store Construction Plan 27 Multi-Year Remodeling & Construction Initiative ) Expanding into new markets in the Midwest and Southeastern U.S. Expanding Market Footprint As indicated on the Company's Fourth Quarter 2010 Earnings Conference Call As of March 31, 2011 ) Reimaging at least 25 sites in 2011 Accelerating Store Reimaging Plan |
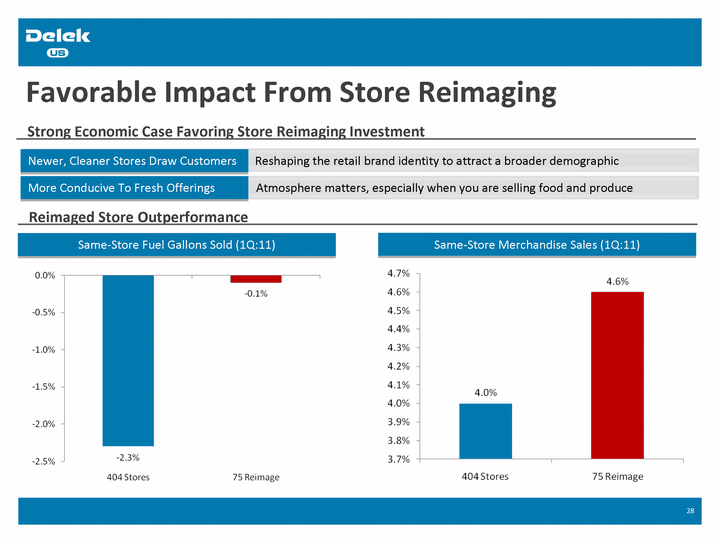
| Favorable Impact From Store Reimaging Strong Economic Case Favoring Store Reimaging Investment Reshaping the retail brand identity to attract a broader demographic Newer, Cleaner Stores Draw Customers ) Atmosphere matters, especially when you are selling food and produce More Conducive To Fresh Offerings 28 Reimaged Store Outperformance Same-Store Fuel Gallons Sold (1Q:11) Same-Store Merchandise Sales (1Q:11) |

| Marketing Segment Operational Update |

| Marketing Segment | Operational Update Wholesale Marketing In West Texas Owned (San Angelo, Abilene, Tyler); Third-Party (Aledo, Odessa, Big Springs, Frost) Product Marketing Terminals ) Owned and leased pipelines transport crude to Tyler refinery Supply Synergies With Tyler 30 ) Annual CAPEX less than $1 million per year 2006-2010 Minimal CAPEX requirements ) Positive contribution margin every quarter since 2006 Consistent Contribution Margin Total Sales Volumes (BPD) Consistent Contribution Margin ($MM) |

| Appendix Additional Data |
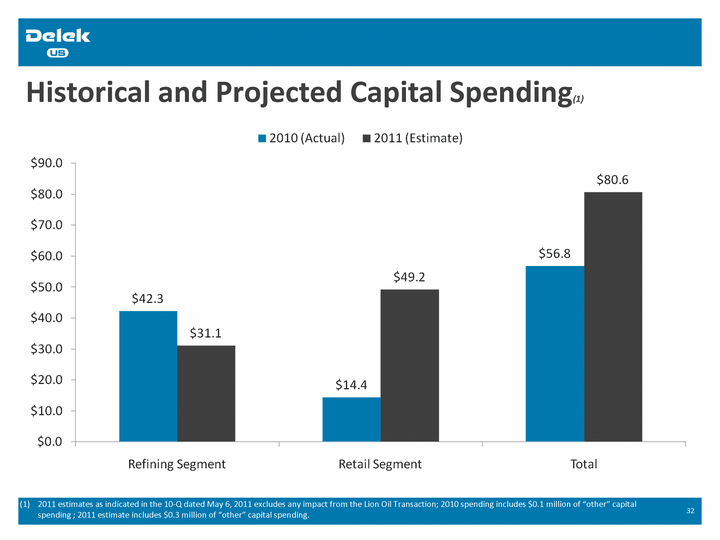
| Historical and Projected Capital Spending(1) 32 2011 estimates as indicated in the 10-Q dated May 6, 2011 excludes any impact from the Lion Oil Transaction; 2010 spending includes $0.1 million of "other" capital spending ; 2011 estimate includes $0.3 million of "other" capital spending. |

| Combined Asset Overview Delek US (March 31, 2011) Lion Oil Delek US (Post-Transaction) Refining Segment Marketing Segment Other 1 refinery, Tyler, TX PADD III 60,000 BPD 9.4 complexity High conversion 3 company-owned terminals 7 product pipelines Crude pipelines 404 retail company operated retail locations More than 60% of underlying real estate is owned 1 refinery, El Dorado, AR PADD III 80,000 BPD 9.0 complexity Clean fuels compliant 3 light product terminals - Memphis and Nashville, TN and El Dorado, AR Connected to Enterprise Products Pipeline Asphalt distribution business; owned asphalt terminal in El Dorado, AR 2 PADD III refineries 140,000 BPD Moderate complexity Expanded crude slate Expanded product mix Scales logistics business to include distribution points throughout the Gulf Coast and Mid- Continent regions Diversified set of downstream assets 33 |

| Combined Asset Map 34 West Texas Crude Louisiana Offshore Crude Foreign Crude Tyler Refinery El Dorado Refinery Delek US Terminals Lion Oil Terminals Crude Pipelines Product Pipelines |
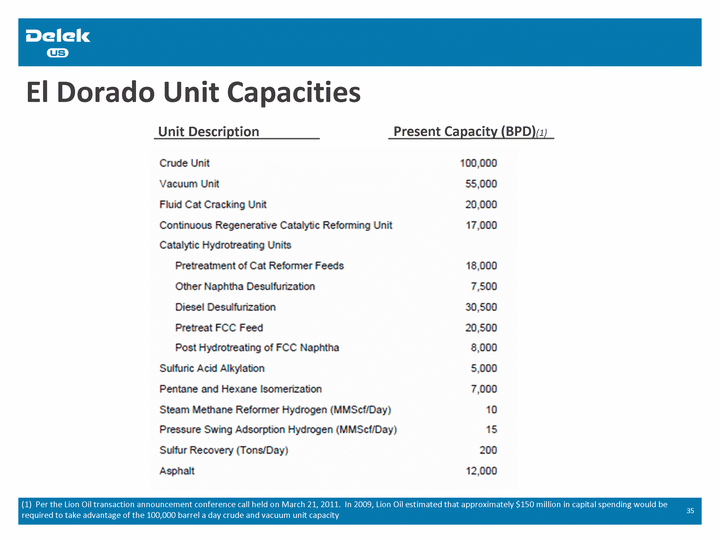
| El Dorado Unit Capacities 35 Unit Description Present Capacity (BPD)(1) (1) Per the Lion Oil transaction announcement conference call held on March 21, 2011. In 2009, Lion Oil estimated that approximately $150 million in capital spending would be required to take advantage of the 100,000 barrel a day crude and vacuum unit capacity |
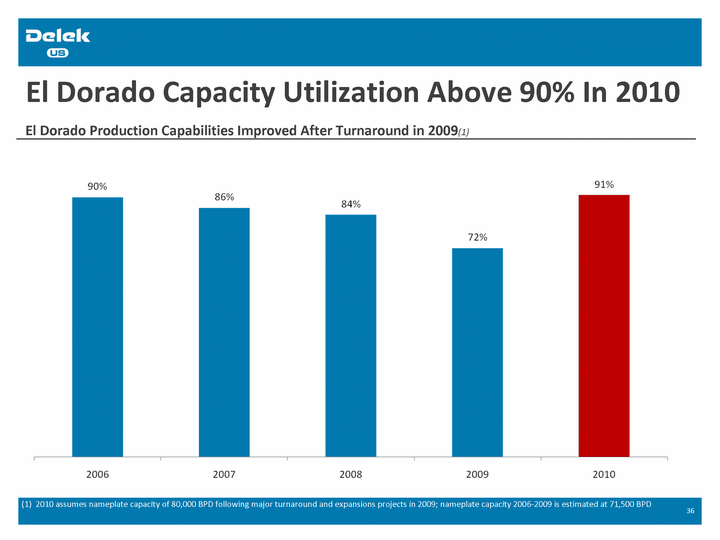
| El Dorado Capacity Utilization Above 90% In 2010 36 (1) 2010 assumes nameplate capacity of 80,000 BPD following major turnaround and expansions projects in 2009; nameplate capacity 2006-2009 is estimated at 71,500 BPD El Dorado Production Capabilities Improved After Turnaround in 2009(1) Turnaround |

| Major Capital Projects Have Been Completed 37 (1) Refining segment capital spending data for the Tyler refinery as indicated in the form 10-Q filed with the SEC on May 6, 2011 *Includes refining segment only; 2009 capital spending includes cost to rebuild saturated gas plant Historical/Projected Capital Spending at Tyler and El Dorado ($MM)(1) |
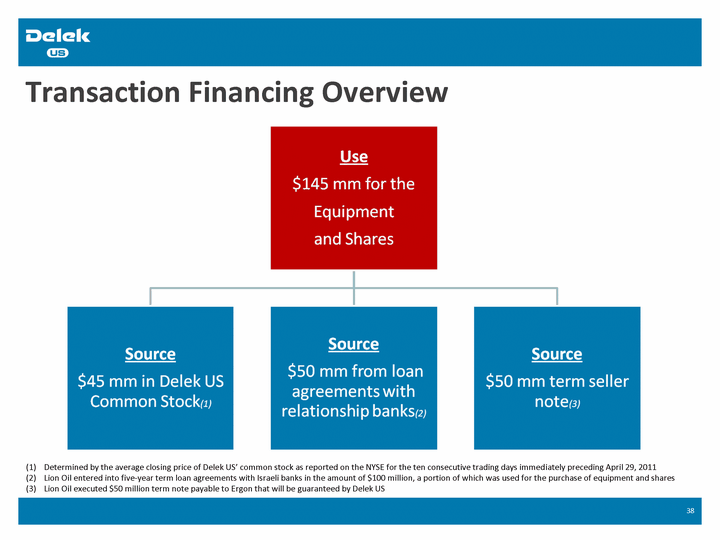
| Transaction Financing Overview 38 Determined by the average closing price of Delek US' common stock as reported on the NYSE for the ten consecutive trading days immediately preceding April 29, 2011 Lion Oil entered into five-year term loan agreements with Israeli banks in the amount of $100 million, a portion of which was used for the purchase of equipment and shares Lion Oil executed $50 million term note payable to Ergon that will be guaranteed by Delek US |

