Attached files
| file | filename |
|---|---|
| 8-K - REPUBLIC BANCORP, INC. 8-K - REPUBLIC BANCORP INC /KY/ | a6751427.htm |
| EX-99.1 - EXHIBIT 99.1 - REPUBLIC BANCORP INC /KY/ | a6751427ex99_1.htm |
EXHIBIT 99.2
Slide: 1 Other Placeholder: 1 Thursday, June 9, 2011
Slide: 2 Other Placeholder: 2 Title: Safe Harbor Body: During the course of this presentation, we will be providing you with a discussion of some of the factors we currently anticipate may influence the future results of Republic Bancorp, Inc. (“Republic” or the “Company”), as well as certain financial projections. We want to emphasize that these forward-looking statements involve judgment, and that individual judgments may vary. Moreover, these statements are based on limited information available to us now, which is subject to change. Actual results may differ substantially from what we say today and no one should assume later that the comments we provide today are still valid. They speak only as of today. Specific risk factors that could change causing our projections not to be achieved are discussed in the “Risk Factors” section of our Form 10-K filed with the Securities and Exchange Commission (“SEC”) on March 3, 2011, and other reports filed with the SEC from time to time.

Slide: 3 Other Placeholder: 3 Body: Steve TragerPresident and Chief Executive Officer
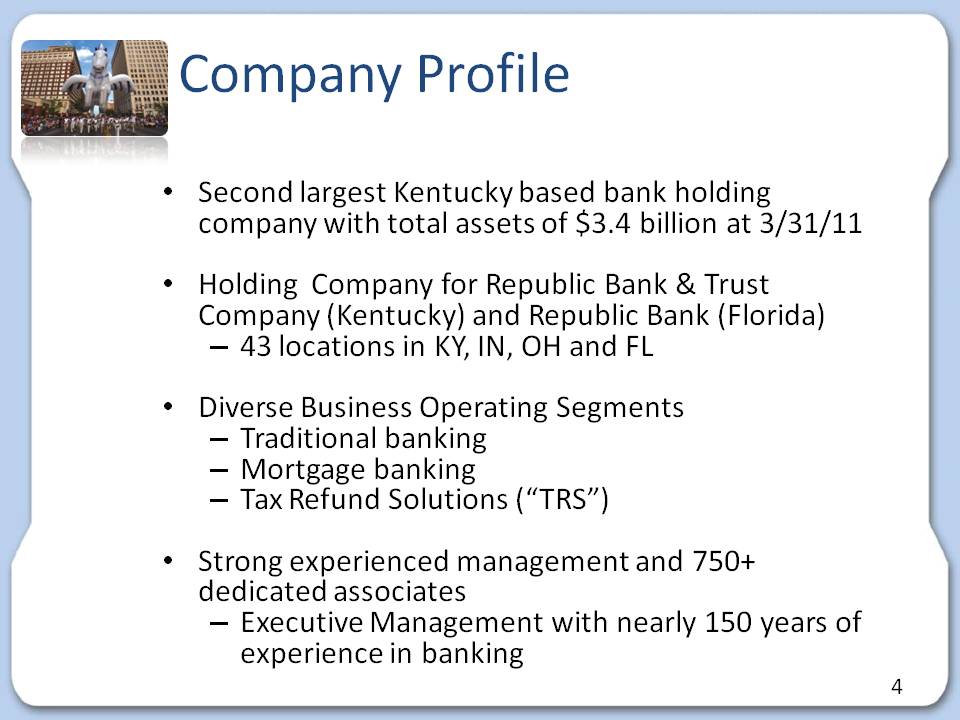
Slide: 4 Other Placeholder: 4 Title: Company Profile Body: Second largest Kentucky based bank holding company with total assets of $3.4 billion at 3/31/11Holding Company for Republic Bank & Trust Company (Kentucky) and Republic Bank (Florida)43 locations in KY, IN, OH and FLDiverse Business Operating SegmentsTraditional bankingMortgage bankingTax Refund Solutions (“TRS”)Strong experienced management and 750+ dedicated associatesExecutive Management with nearly 150 years of experience in banking
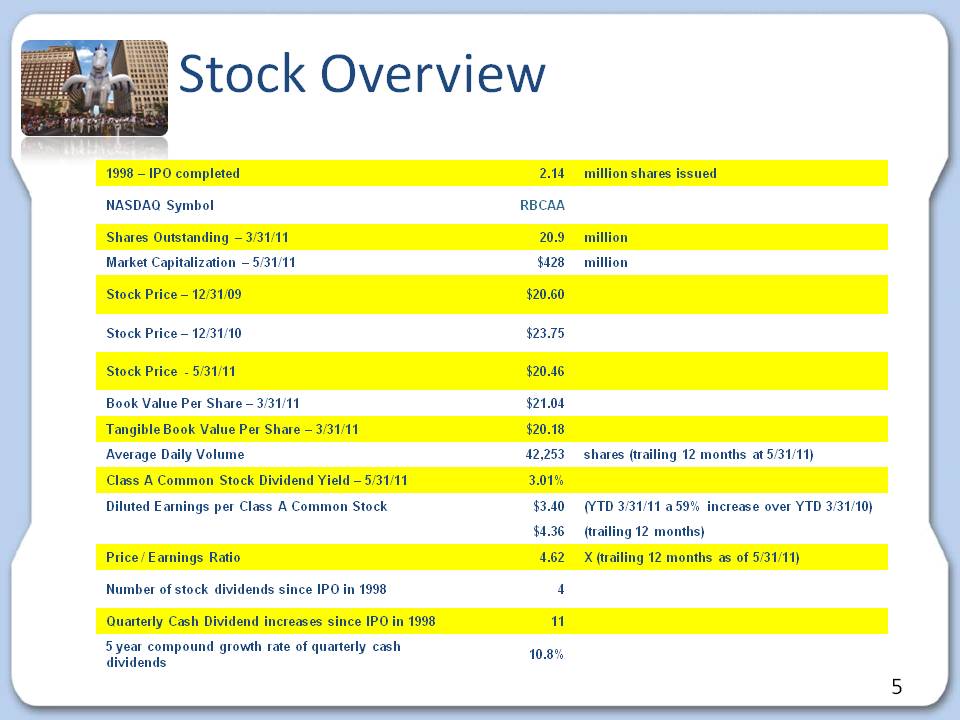
Stock Overview 1998 – IPO completed 2.14 million shares issued p NASDAQ Symbol RBCAA Shares Outstanding – 3/31/11 20.9 million Market Capitalization – 5/31/11 $428 million p Stock Price – 12/31/09 $20.60 Stock Price – 12/31/10 $23.75 Stock Price - 5/31/11 $20.46 Book Value Per Share – 3/31/11 $21.04 Tangible Book Value Per Share – 3/31/11 $20.18 42 2 3 ( 12 /11) Average Daily Volume 42,253 shares trailing months at 5/31/Class A Common Stock Dividend Yield – 5/31/11 3.01% Diluted Earnings per Class A Common Stock $3.40 (YTD 3/31/11 a 59% increase over YTD 3/31/10) $4.36 (trailing 12 months) Price / Earnings Ratio 4.62 X (trailing 12 months as of 5/31/11) Number of stock dividends since IPO in 1998 4 Quarterly Cash Dividend increases since IPO in 1998 11 5 5 year compound growth rate of quarterly cash dividends
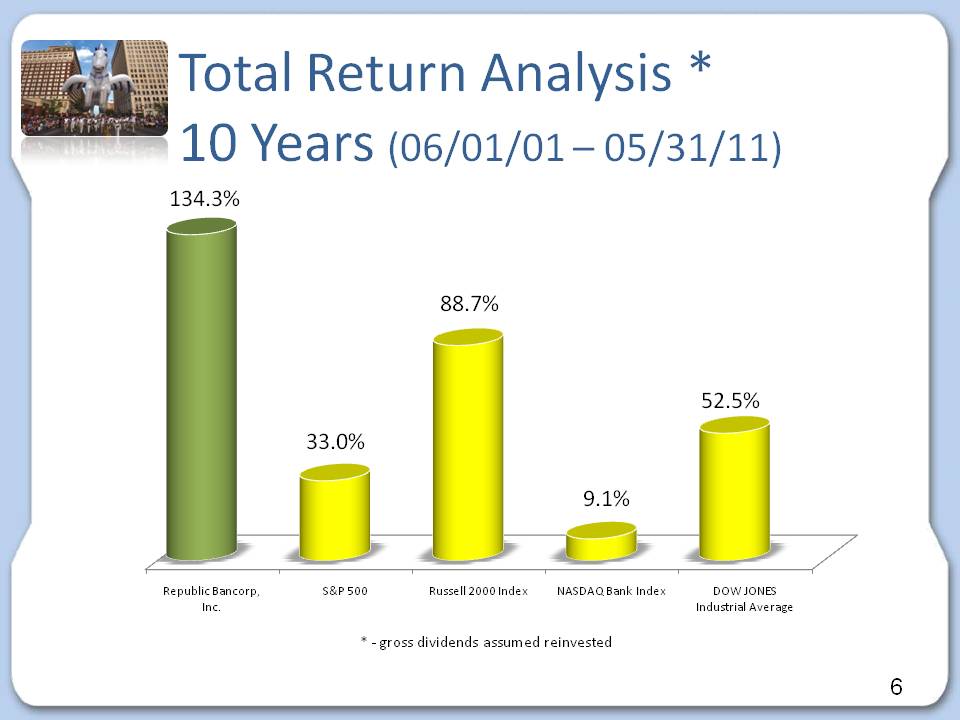
Slide: 6 Other Placeholder: 6 Title: Total Return Analysis * 10 Years (06/01/01 – 05/31/11) * - gross dividends assumed reinvested
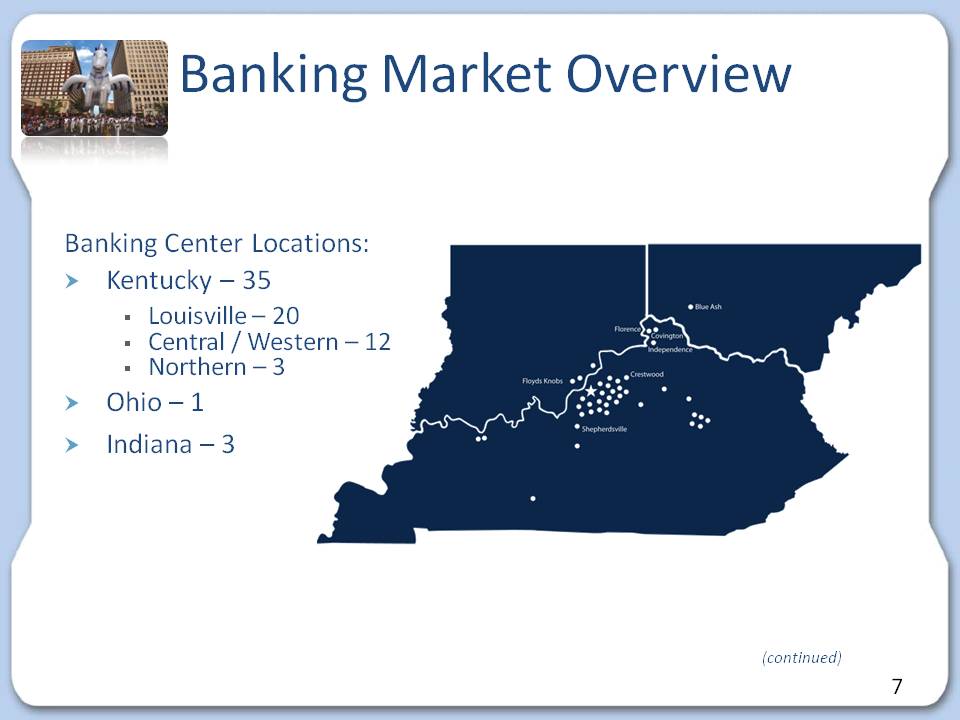
Slide: 7 Other Placeholder: 7 Title: Banking Market Overview Banking Center Locations:Kentucky – 35Louisville – 20Central / Western – 12Northern – 3Ohio – 1Indiana – 3 (continued)
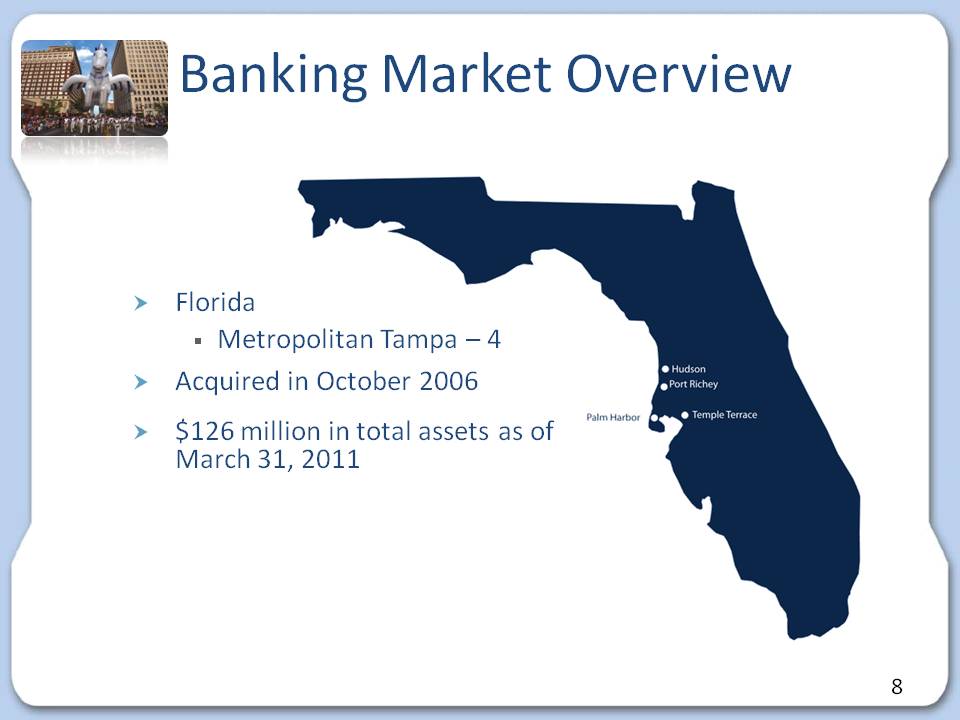
Slide: 8 Other Placeholder: 8 Title: Banking Market Overview FloridaMetropolitan Tampa – 4Acquired in October 2006$126 million in total assets as of March 31, 2011
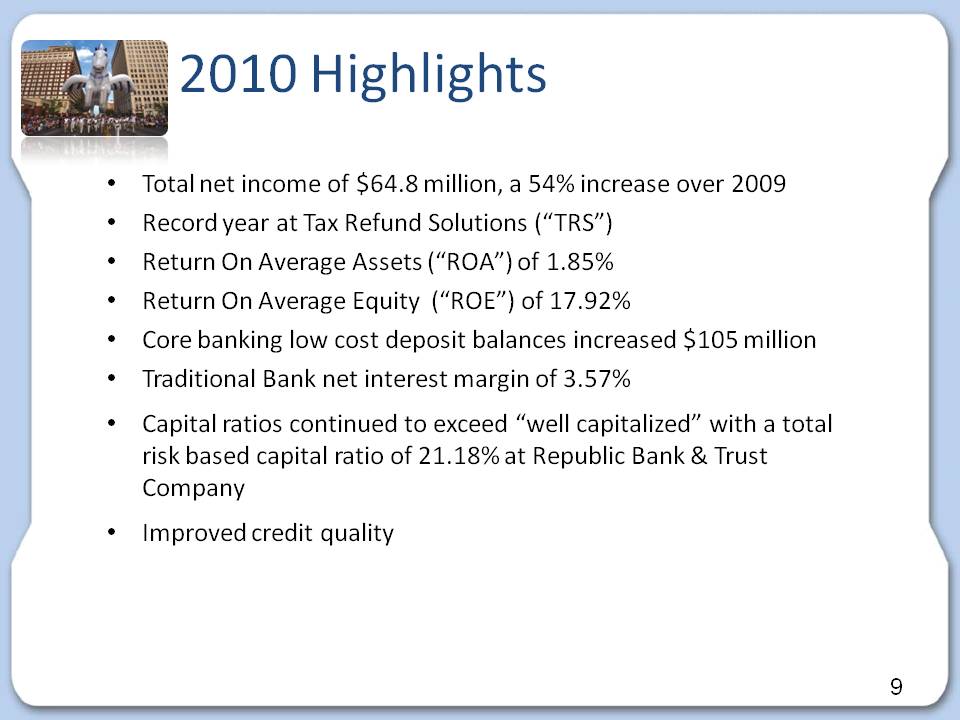
Slide: 9 Other Placeholder: 9 Title: 2010 Highlights Body: Total net income of $64.8 million, a 54% increase over 2009Record year at Tax Refund Solutions (“TRS”)Return On Average Assets (“ROA”) of 1.85%Return On Average Equity (“ROE”) of 17.92%Core banking low cost deposit balances increased $105 millionTraditional Bank net interest margin of 3.57%Capital ratios continued to exceed “well capitalized” with a total risk based capital ratio of 21.18% at Republic Bank & Trust CompanyImproved credit quality
Slide: 10 Other Placeholder: 10 Title: 2010 Highlights (Continued) Body: Enhanced technologyNew core operating systemMobile BankingBranch CaptureRepublic Bank Foundation established with a $5 million initial contributionNational Recognition February 2010 - Sandler O'Neil & Partners released its annual rankings of the top 150 financial institutions in Bank Director Magazine and ranked Republic as #5 based on total assets, profitability, capital adequacy and asset quality. August 2010 - Republic was ranked as #7 in the American Banker’s ranking of the nation’s most efficient bank holding companies. September 2010 - With a 5-year dividend growth rate of nearly 14% and a 12-month trailing dividend yield of 2.9%, Republic was recognized as a top dividend paying Company by the popular financial website, The Motley Fool. April 2011 - the American Bankers Association's Banking Journal ranked Republic as #4 performing bank in the US based on 2010 Return on Average Total Equity (ROAE).
Slide: 11 Other Placeholder: 11 Body: HighlightsFirst Quarter 2011
Slide: 12 Other Placeholder: 12 Title: First Quarter 2011 Highlights Body: Record net income of $71.4 million, a 60% increase over prior yearTRS segment net income increased $27.8 millionReturn On Average Assets (“ROA”) of 7.01%Return On Average Equity (“ROE”) of 69.96%“Traditional Bank” 1Q 2011 average quarterly deposit balances increased $25 million compared to 4Q 2010.Capital ratios continued to exceed “well capitalized” with a total risk based capital ratio of 23.42% at RB&TCCredit metrics continued to outperform peers
Slide: 13 Other Placeholder: 13 Body: 3.6 million customers$14.4 billion of state and federal electronic tax refunds processed16.3% increase in the amount of refunds processed662,000 Refund Anticipation Loans (“RALs”)$1.0 billion of RALs processedRALs outstanding past their expected funding date from the IRS at March 31, 2011 = 1.75% of total RALs originated15%/85% - RAL / Electronic Refund Check (“ERC”) mix based on number of products First Quarter 2011 HighlightsTax Season Overview
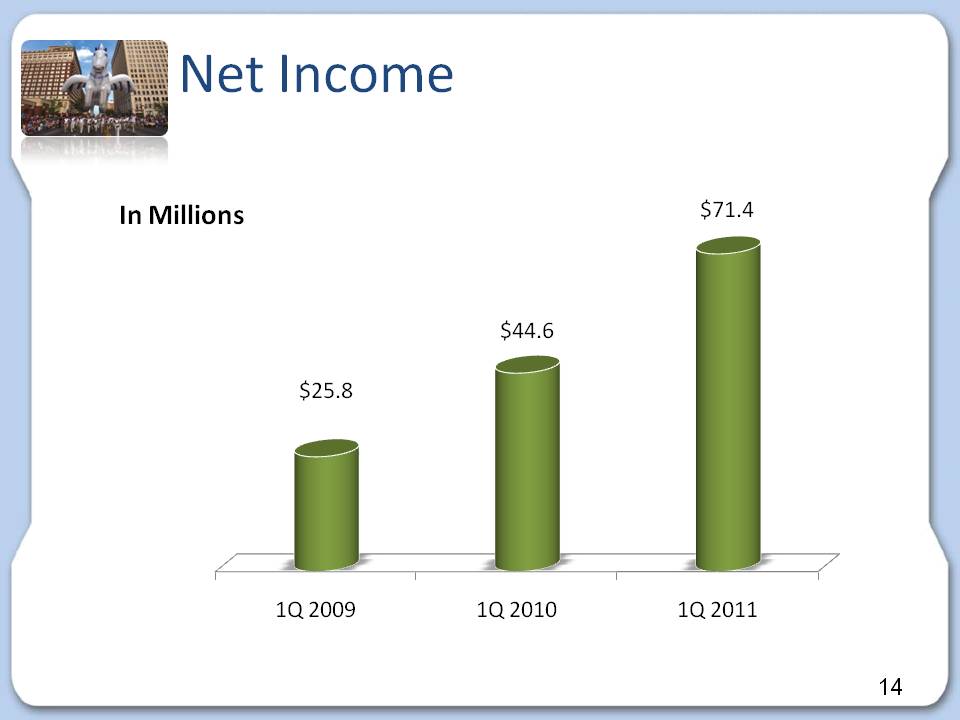
Slide: 14 Other Placeholder: 14 Title: Net Income
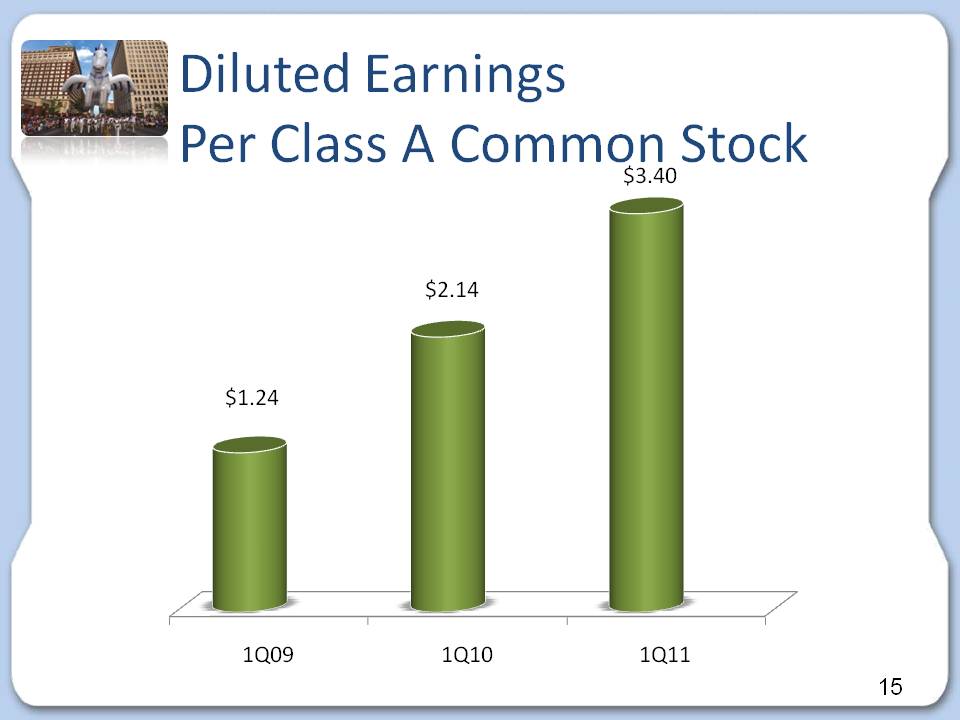
Slide: 15 Other Placeholder: 15 Title: Diluted Earnings Per Class A Common Stock
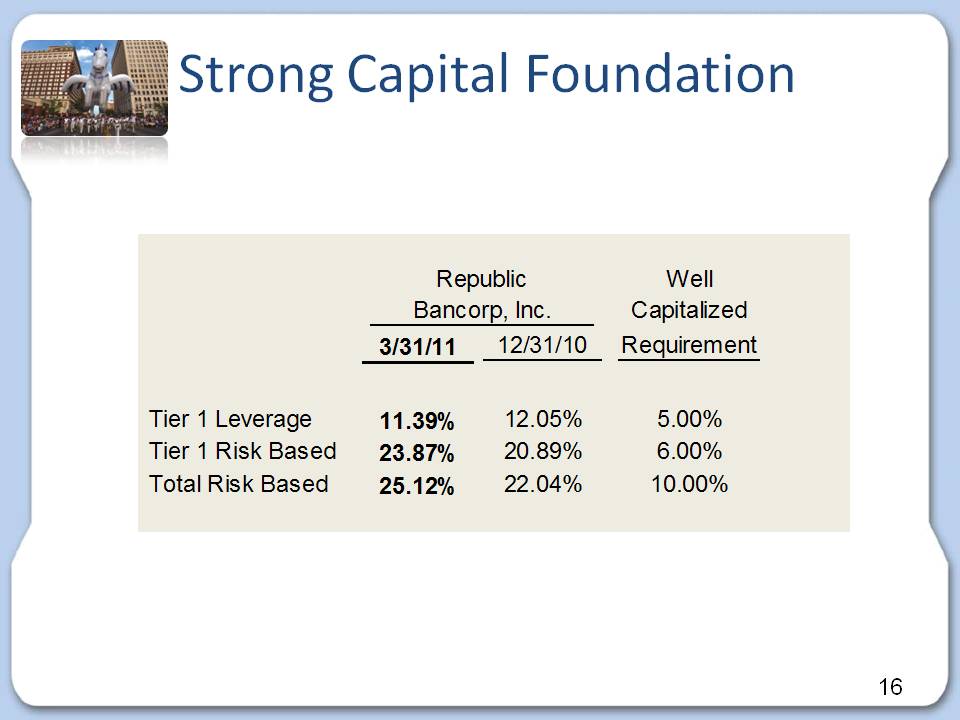
Strong Capital Foundation Republic Well Bancorp, Inc. Capitalized 3/31/11 12/31/10 Requirement Tier 1 Leverage 11.39% 12.05% 5.00% Tier 1 Risk 23 87% 20 89% 6 00% Based 23.87% 20.89% 6.00% Total Risk Based 25.12% 22.04% 10.00% 16
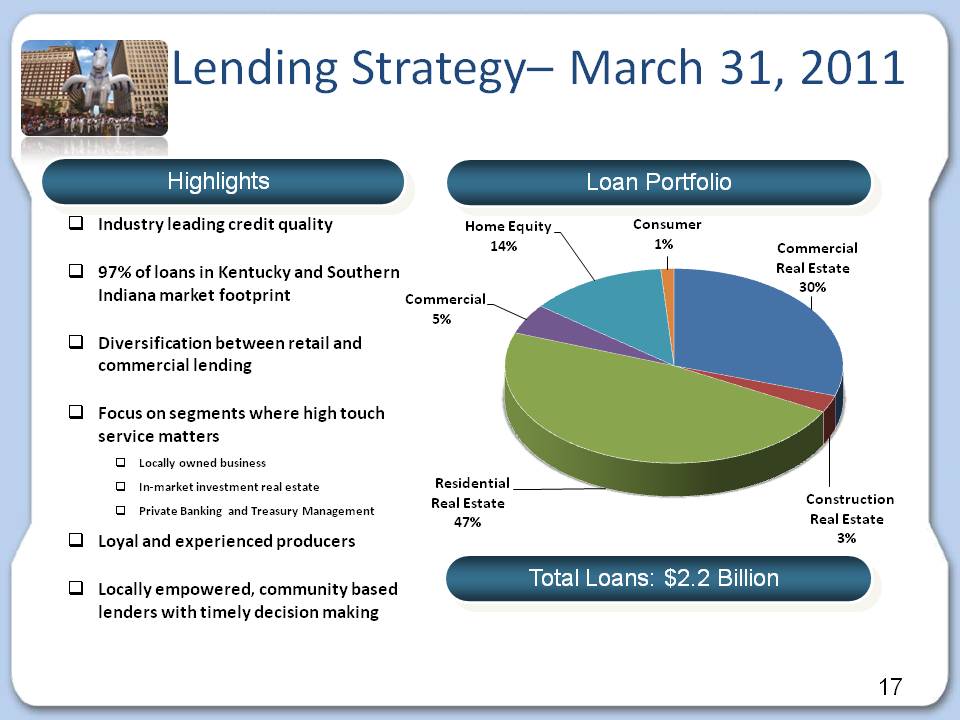
Slide: 17 Other Placeholder: 17 Highlights Loan Portfolio Total Loans: $2.2 Billion Industry leading credit quality97% of loans in Kentucky and Southern Indiana market footprintDiversification between retail and commercial lendingFocus on segments where high touch service mattersLocally owned businessIn-market investment real estatePrivate Banking and Treasury ManagementLoyal and experienced producersLocally empowered, community based lenders with timely decision making Lending Strategy– March 31, 2011
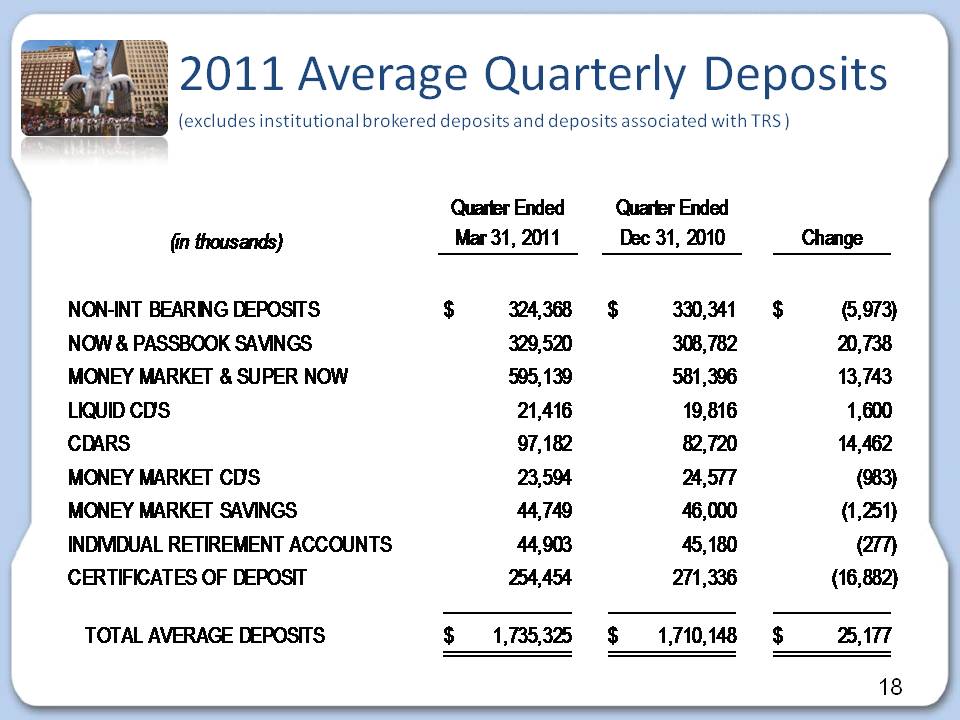
2011 Average Quarterly Deposits 0 e age Qua te y epos ts (excludes institutional brokered deposits and deposits associated with TRS ) Quarter Ended Quarter Ended (in thousands) Mar 31, 2011 Dec 31, 2010 Change NON-INT BEARING DEPOSITS 324,368 $ 330,341 $ (5,973) $ NOW & PASSBOOK SAVINGS 329,520 308,782 20,738 MONEY MARKET & SUPER NOW 595,139 581,396 13,743 LIQUID CD'S 21,416 19,816 1,600 CDARS 97,182 82,720 14,462 MONEY MARKET CD'S 23,594 24,577 (983) MONEY MARKET SAVINGS 44,749 46,000 (1,251) INDIVIDUAL RETIREMENT ACCOUNTS 44 903 45 180 (277) 44,903 45,180 CERTIFICATES OF DEPOSIT 254,454 271,336 (16,882) TOTAL AVERAGE DEPOSITS 1 735 325 $ 1 710 148 $ 25 177 $ 18
Slide: 18 Other Placeholder: 18 2011 Average Quarterly Deposits (excludes institutional brokered deposits and deposits associated with TRS )
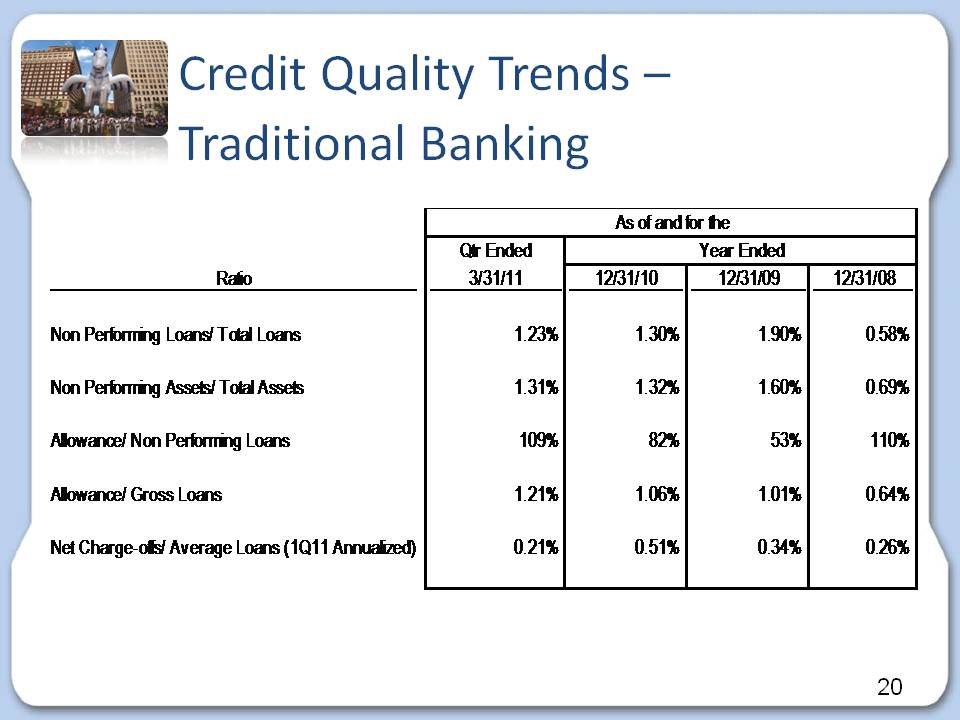
Credit Quality Trends – C ed t Qua ty e ds Traditional Banking As of and for the Qtr Ended R i 3/31/11 12/31/10 12/31/09 12/31/08 Year Ended Ratio Non Performing Loans/ Total Loans 1.23% 1.30% 1.90% 0.58% Non Performing Assets/ Total Assets 1.31% 1.32% 1.60% 0.69% Allowance/ Non Performing Loans 109% 82% 53% 110% g Allowance/ Gross Loans 1.21% 1.06% 1.01% 0.64% N t Ch ff / A L (1Q11 A li d) 0 21% 0 51% 0 34% 0 26% Net Charge-offs/ Average Loans Annualized) 0.21% 0.51% 0.34% 0.26% 20
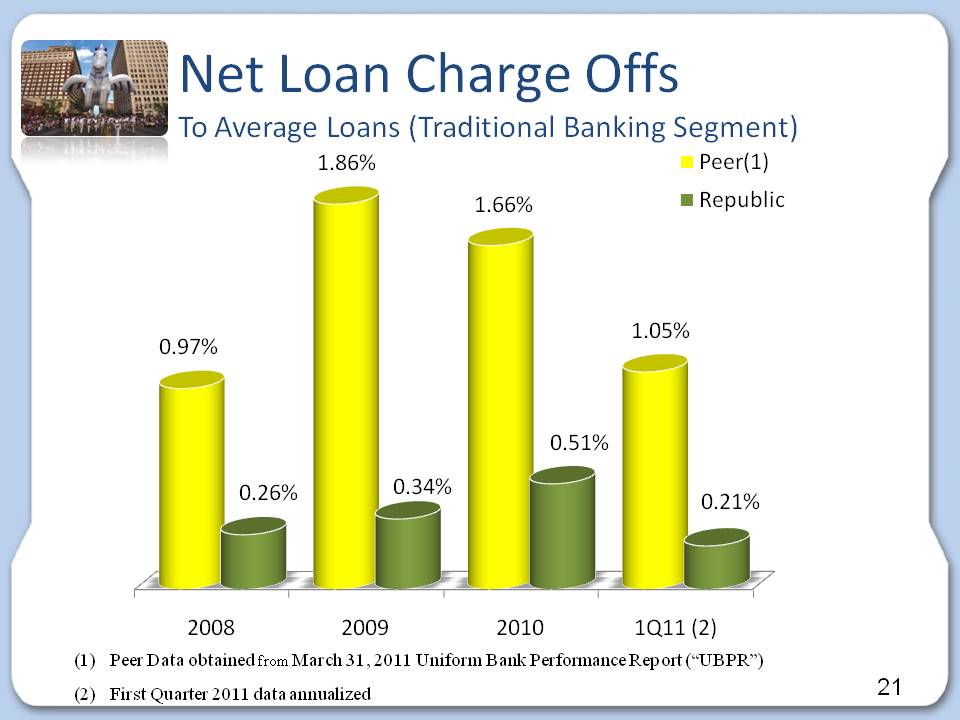
Slide: 21 Title: Net Loan Charge Offs To Average Loans (Traditional Banking Segment) Other Placeholder: 21 Peer Data obtained from March 31, 2011 Uniform Bank Performance Report (“UBPR”)First Quarter 2011 data annualized
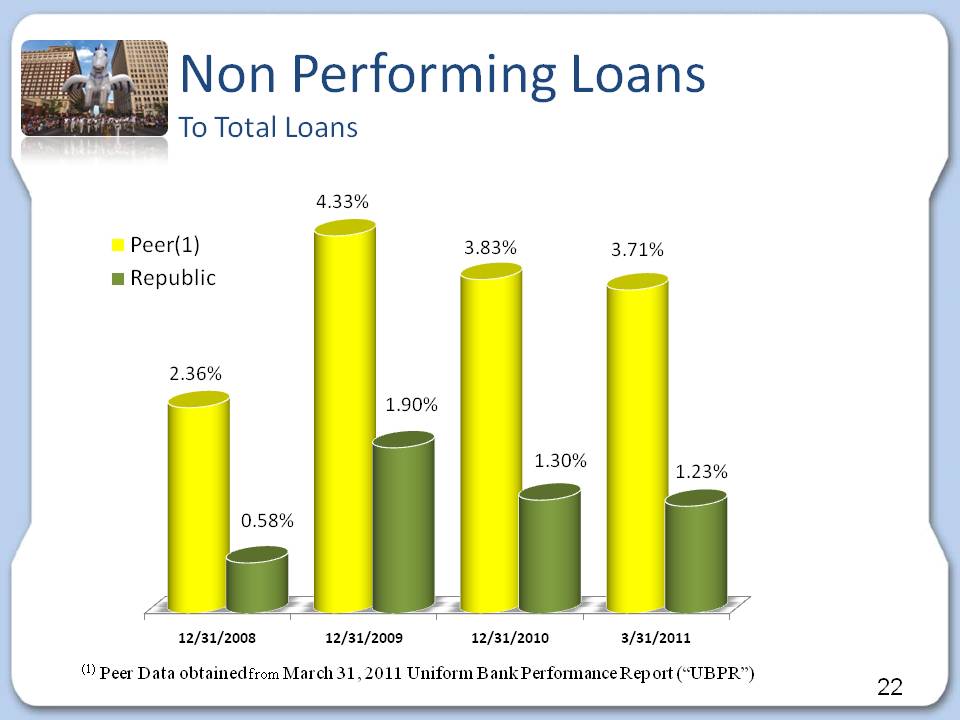
Slide: 22 Other Placeholder: 22 Title: Non Performing Loans To Total Loans (1) Peer Data obtained from March 31, 2011 Uniform Bank Performance Report (“UBPR”)
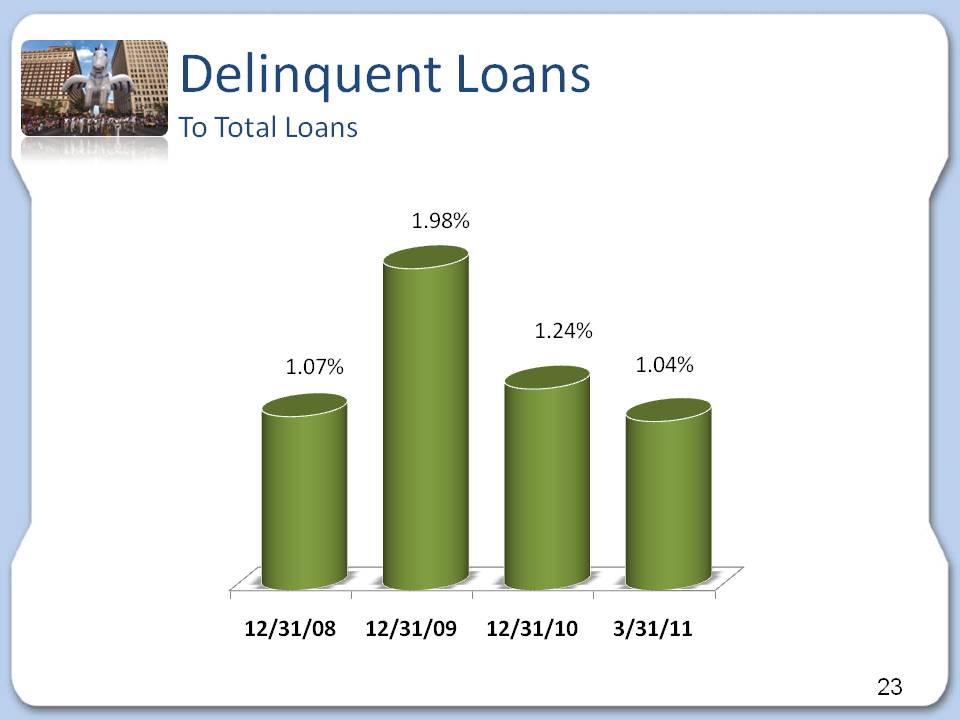
Slide: 23 Other Placeholder: 23 Title: Delinquent Loans To Total Loans
Slide: 24 Other Placeholder: 24 Title: Growth Initiatives Body: Develop new lines of businessSecondary market lendingAttract customers leaving troubled institutions looking for safety and soundnessAdd strategically located banking centers and make selective acquisitionsOutperform peer financial performanceFocus on core deposit growth initiativesContinue to improve on already solid loan quality metricsRemain positioned for sustainable, profitable growth
Slide: 25 Other Placeholder: 25 Title: 2011 Challenges & Opportunities Body: ChallengesNew Regulation E requirementsNew FDIC overdraft guidanceOngoing regulatory dialogue regarding the TRS businessImproving net interest margin by capitalizing on low cost deposit opportunities within Treasury ManagementNon-interest expense controlContinue to increase the solid returns we achieved at TRSExpand product offerings to the under-served market through nontraditional delivery channels Maintain credit quality


Slide: 27 Other Placeholder: 27 THANK YOU