Attached files
| file | filename |
|---|---|
| 8-K - FORM 8-K - EQUITY LIFESTYLE PROPERTIES INC | c64985e8vk.htm |
Exhibit 99.1

| Hometown Acquisition |
| June 7, 2011 |
| Equity LifeStyle Properties |
| ELS |

| Forward-Looking Statements |
| This presentation includes certain “forward-looking statements” within the meaning of the Private Securities Litigation Reform Act of 1995. When used, words such as “anticipate,” “expect,” “believe,” “project,” “intend,” “may be” and “will be” and similar words or phrases, or the negative thereof, unless the context requires otherwise, are intended to identify forward-looking statements and may include, without limitation, information regarding the Company’s expectations, goals or intentions regarding the future, statements regarding the anticipated closing of the Company’s pending Acquisition of the Hometown Portfolio and the expected effect of the Acquisition on the Company. These forward-looking statements are subject to numerous assumptions, risks and uncertainties, including, but not limited to: _ the Company’s ability to control costs, real estate market conditions, the actual rate of decline in customers, the actual use of sites by customers and its success in acquiring new customers at its Properties (including those that it may acquire); _ the Company’s ability to maintain historical rental rates and occupancy with respect to Properties currently owned or that the Company may acquire; _ the Company’s assumptions about rental and home sales markets; _ in the age-qualified Properties, home sales results could be impacted by the ability of potential homebuyers to sell their existing residences as well as by financial, credit and capital markets volatility; _ results from home sales and occupancy will continue to be impacted by local economic conditions, lack of affordable manufactured home financing and competition from alternative housing options, including site-built single-family housing; _ impact of government intervention to stabilize site-built single family housing and not manufactured housing; _ the completion of the acquisition of the Hometown Portfolio in its entirety and future acquisitions, if any, and timing and effective integration with respect thereto; _ the Company’s inability to secure the contemplated debt financings to fund a portion of the stated purchase price of the acquisition on favorable terms or at all and the timing with respect thereto; _ unanticipated costs or unforeseen liabilities associated with the acquisition; _ ability to obtain financing or refinance existing debt on favorable terms or at all; _ the effect of interest rates; _ the dilutive effects of issuing additional securities; _ the effect of accounting for the sale of agreements to customers representing a right-to-use the Properties under the Codification Topic “Revenue Recognition;” and |
| _ other risks indicated from time to time in the Company’s filings with the Securities and Exchange Commission. |
| These forward-looking statements are based on management’s present expectations and beliefs about future events. As with any projection or forecast, these statements are inherently susceptible to uncertainty and changes in circumstances. The Company is under no obligation to, and expressly disclaims any obligation to, update or alter its forward-looking statements whether as a result of such changes, new information, subsequent events or otherwise. |
| 2 |

| Equity LifeStyle Properties |
| ELS Value Drivers 3 |
| ?? Long term predictable cash flows ?? High barrier to entry markets |
| ?? High quality and well maintained assets ?? Asset scarcity |
| ?? Balance sheet flexibility ?? Opportunistic acquisition philosophy |
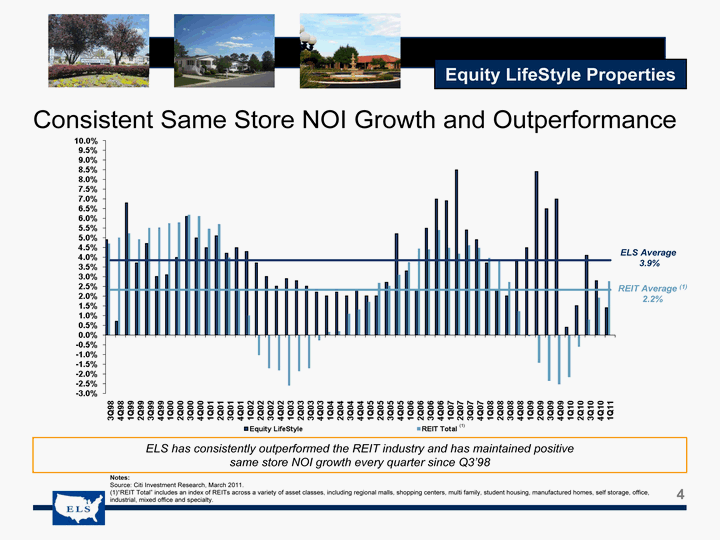
| Consistent Same Store NOI Growth and OutperformanceELS has consistently outperformed the REIT industry and has maintained positive |
| same store NOI growth every quarter since Q3’98Notes: Source: Citi Investment Research, March 2011. |
| (1)“REIT Total” includes an index of REITs across a variety of asset classes, including regional malls, shopping centers, multi family, student housing, manufactured homes, self storage, office, 4 industrial, mixed office and specialty. |
| Equity LifeStyle Properties |
| Transaction Overview |
| Equity LifeStyle Properties |
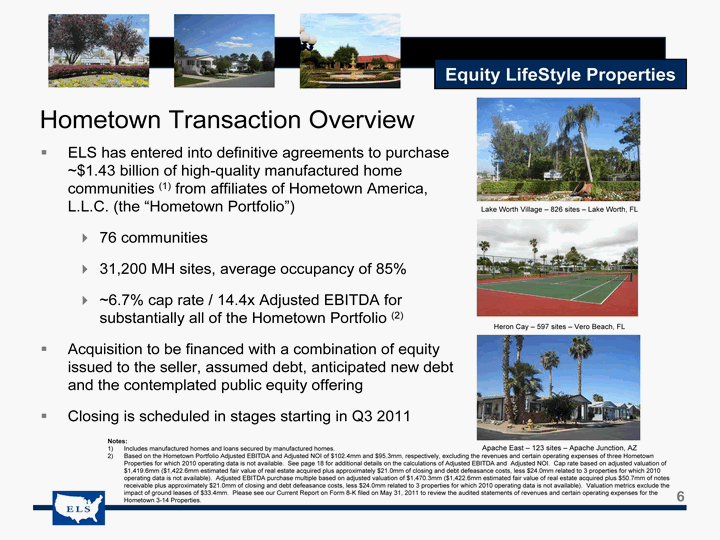
| Hometown Transaction Overview |
| ELS has entered into definitive agreements to purchase |
| ~$1.43 billion of high-quality manufactured home communities (1) from affiliates of Hometown America, L.L.C. (the “Hometown Portfolio”) |
| _ 76 communities _ 31,200 MH sites, average occupancy of 85% |
| _ ~6.7% cap rate / 14.4x Adjusted EBITDA for substantially all of the Hometown Portfolio (2) |
| Acquisition to be financed with a combination of equity issued to the seller, assumed debt, anticipated new debt and the contemplated public equity offering |
| Closing is scheduled in stages starting in Q3 2011 |
| Notes: |
| 1) Includes manufactured homes and loans secured by manufactured homes. Apache East — 123 sites — Apache Junction, AZ |
| 2) Based on the Hometown Portfolio Adjusted EBITDA and Adjusted NOI of $102.4mm and $95.3mm, respectively, excluding the revenues and certain operating expenses of three Hometown Properties for which 2010 operating data is not available. See page 18 for additional details on the calculations of Adjusted EBITDA and Adjusted NOI. Cap rate based on adjusted valuation of $1,419.6mm ($1,422.6mm estimated fair value of real estate acquired plus approximately $21.0mm of closing and debt defeasance costs, less $24.0mm related to 3 properties for which 2010 operating data is not available). Adjusted EBITDA purchase multiple based on adjusted valuation of $1,470.3mm ($1,422.6mm estimated fair value of real estate acquired plus $50.7mm of notes receivable plus approximately $21.0mm of closing and debt defeasance costs, less $24.0mm related to 3 properties for which 2010 operating data is not available). Valuation metrics exclude the impact of ground leases of $33.4mm. Please see our Current Report on Form 8-K filed on May 31, 2011 to review the audited statements of revenues and certain operating expenses for the 6 Hometown 3-14 Properties. |
| Equity LifeStyle Properties |
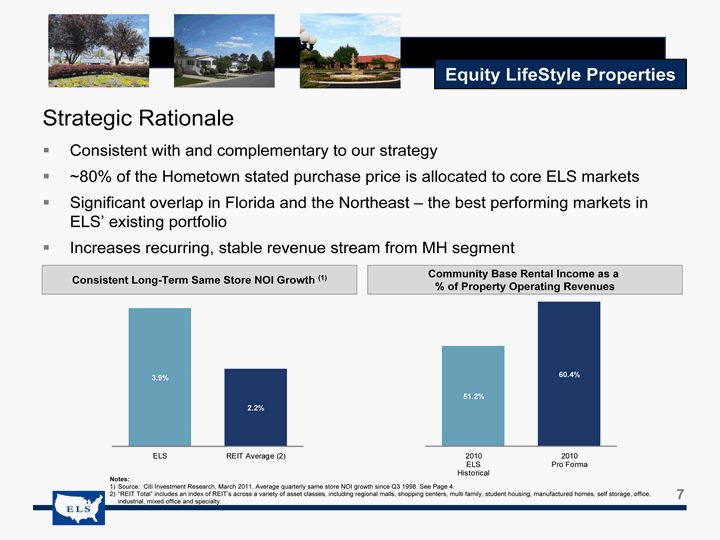
| Strategic Rationale |
| Consistent with and complementary to our strategy |
| ~80% of the Hometown stated purchase price is allocated to core ELS markets Significant overlap in Florida and the Northeast — the best performing markets in ELS’ existing portfolio Increases recurring, stable revenue stream from MH segment |
| Community Base Rental Income as a Consistent Long-Term Same Store NOI Growth (1) % of Property Operating Revenues |
| Notes: |
| 1) Source: Citi Investment Research, March 2011. Average quarterly same store NOI growth since Q3 1998. See Page 4. |
| 2) “REIT Total” includes an index of REIT’s across a variety of asset classes, including regional malls, shopping centers, multi family, student housing, manufactured homes, self storage, office, 7 industrial, mixed office and specialty. |
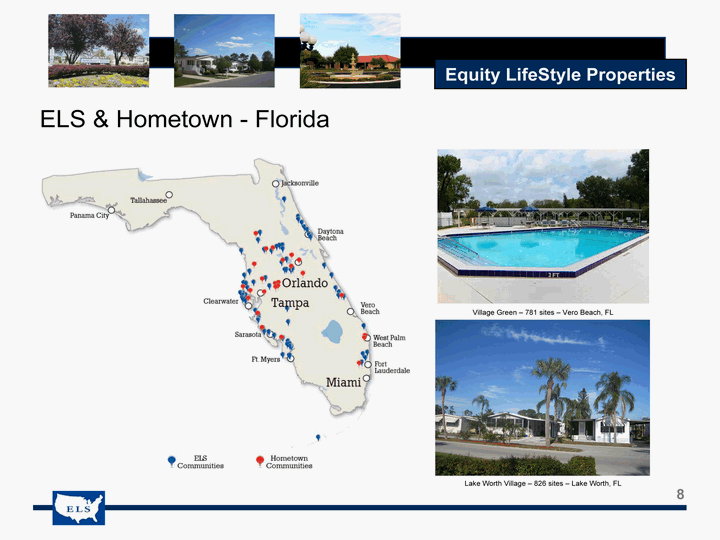
| ELS & Hometown — Florida Village Green — 781 sites — Vero Beach, FL |
| Lake Worth Village — 826 sites — Lake Worth, FL |
| 8 |
| Equity LifeStyle Properties |
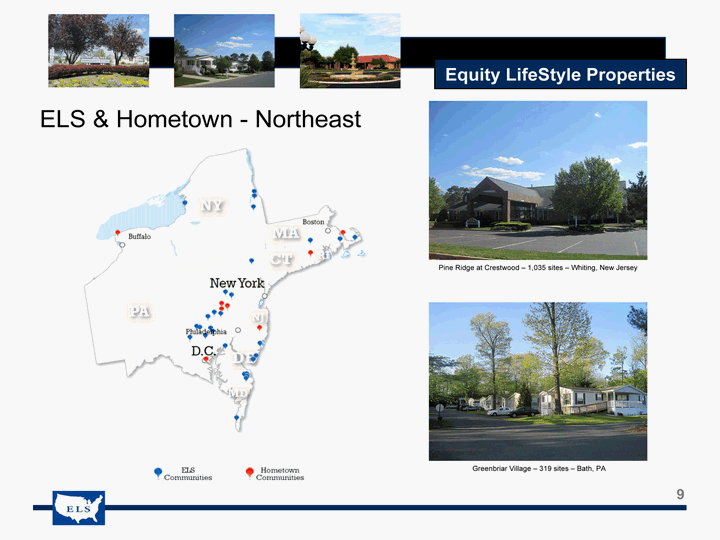
| ELS & Hometown — Northeast |
| Greenbriar Village — 319 sites — Bath, PA |
| 9 |
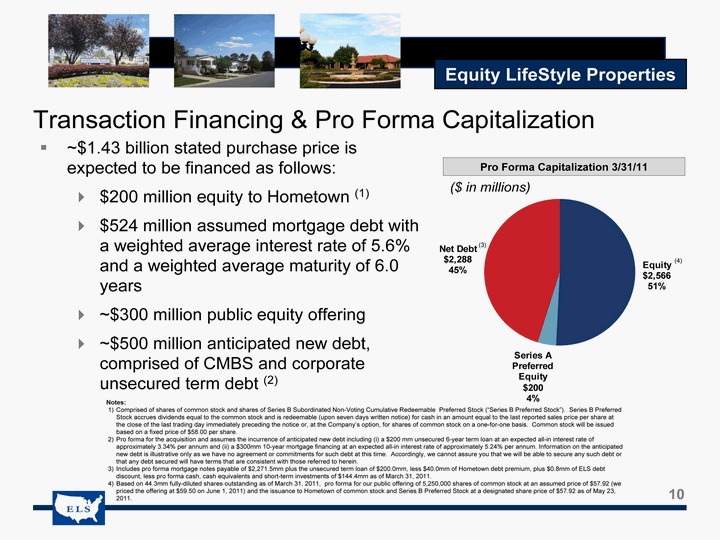
| Transaction Financing & Pro Forma Capitalization ~$1.43 billion stated purchase price is expected to be financed as follows: _ $200 million equity to Hometown (1) $524 million assumed mortgage debt with a weighted average interest rate of 5.6% and a weighted average maturity of 6.0 years _ ~$300 million public equity offering _ ~$500 million anticipated new debt, comprised of CMBS and corporate unsecured term debt (2) Notes: 1) Comprised of shares of common stock and shares of Series B Subordinated Non-Voting Cumulative Redeemable Preferred Stock (“Series B Preferred Stock”). Series B Preferred Stock accrues dividends equal to the common stock and is redeemable (upon seven days written notice) for cash in an amount equal to the last reported sales price per share at the close of the last trading day immediately preceding the notice or, at the Company’s option, for shares of common stock on a one-for-one basis. Common stock will be issued based on a fixed price of $58.00 per share. 2) Pro forma for the acquisition and assumes the incurrence of anticipated new debt including (i) a $200 mm unsecured 6-year term loan at an expected all-in interest rate of approximately 3.34% per annum and (ii) a $300mm 10-year mortgage financing at an expected all-in interest rate of approximately 5.24% per annum. Information on the anticipated new debt is illustrative only as we have no agreement or commitments for such debt at this time. Accordingly, we cannot assure you that we will be able to secure any such debt or that any debt secured will have terms that are consistent with those referred to herein. 3) Includes pro forma mortgage notes payable of $2,271.5mm plus the unsecured term loan of $200.0mm, less $40.0mm of Hometown debt premium, plus $0.8mm of ELS debt discount, less pro forma cash, cash equivalents and short-term investments of $144.4mm as of March 31, 2011. 4) Based on 44.3mm fully-diluted shares outstanding as of March 31, 2011, pro forma for our public offering of 5,250,000 shares of common stock at an assumed price of $57.92 (we priced the offering at $59.50 on June 1, 2011) and the issuance to Hometown of common stock and Series B Preferred Stock at a designated share price of $57.92 as of May 23, 10 2011. |
| Integration Plan Strong and seasoned management team Long-term operating experience in Hometown’s markets Staged closing Expected interim property management services agreement with Hometown Equity LifeStyle Properties 11 |
| Equity LifeStyle Properties Transaction Background Rare opportunity to acquire a complementary portfolio, in scale, of high-quality manufactured housing assets in our existing core markets at an attractive valuation Familiarity with portfolio and geographies Ability to move quickly and provide certainty of execution Flexible capital structure and Hometown’s desire for ELS stock 12 |
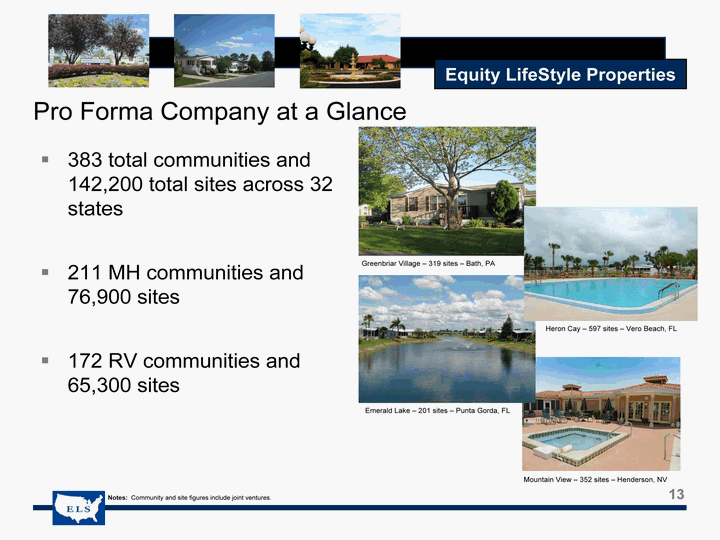
| Equity LifeStyle Properties Pro Forma Company at a Glance 383 total communities and 142,200 total sites across 32 states 211 MH communities and 76,900 sites 172 RV communities and 65,300 sites Notes: Community and site figures include joint ventures. 13 |
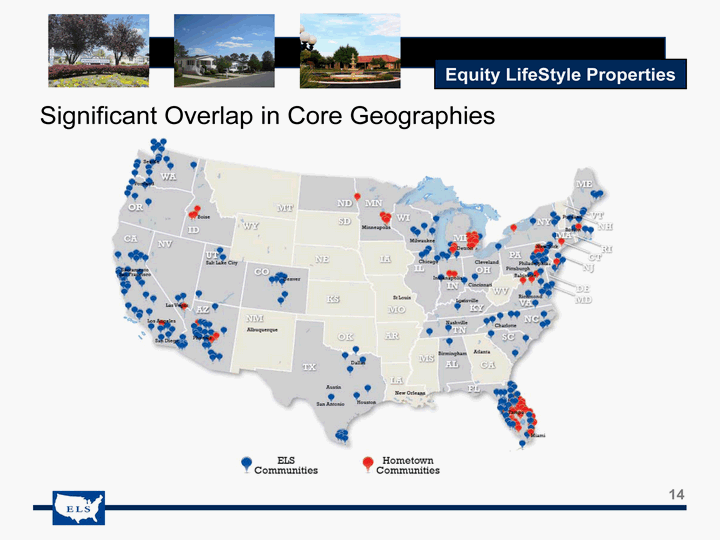
| Equity LifeStyle Properties Significant Overlap in Core Geographies 14 |
| Equity LifeStyle Properties Financial Update |
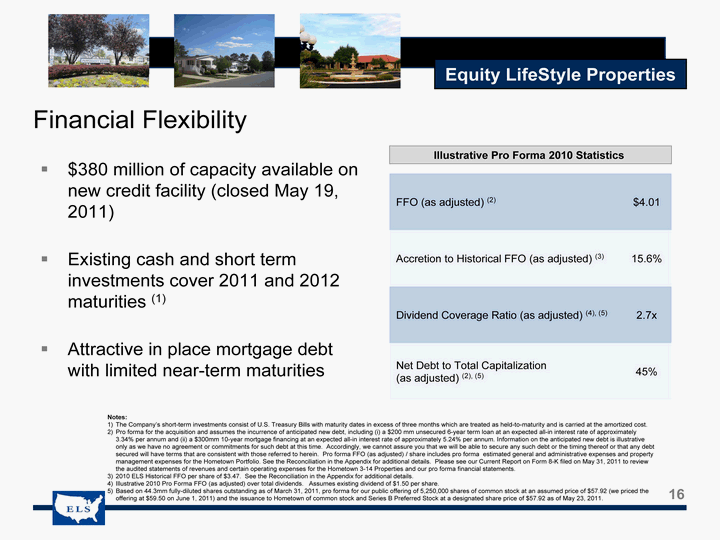
| Equity LifeStyle Properties Financial Flexibility $380 million of capacity available on new credit facility (closed May 19, 2011) Existing cash and short term investments cover 2011 and 2012 maturities (1) Attractive in place mortgage debt with limited near-term maturities Illustrative Pro Forma 2010 Statistics FFO (as adjusted) (2) $4.01 Accretion to Historical FFO (as adjusted) (3) 15.6% Dividend Coverage Ratio (as adjusted) (4), (5) 2.7x Net Debt to Total Capitalization 45% (as adjusted) (2), (5) Notes: 1) The Company’s short-term investments consist of U.S. Treasury Bills with maturity dates in excess of three months which are treated as held-to-maturity and is carried at the amortized cost. 2) Pro forma for the acquisition and assumes the incurrence of anticipated new debt, including (i) a $200 mm unsecured 6-year term loan at an expected all-in interest rate of approximately 3.34% per annum and (ii) a $300mm 10-year mortgage financing at an expected all-in interest rate of approximately 5.24% per annum. Information on the anticipated new debt is illustrative only as we have no agreement or commitments for such debt at this time. Accordingly, we cannot assure you that we will be able to secure any such debt or the timing thereof or that any debt secured will have terms that are consistent with those referred to herein. Pro forma FFO (as adjusted) / share |
| includes pro forma estimated general and administrative expenses and property management expenses for the Hometown Portfolio. See the Reconciliation in the Appendix for additional details. Please see our Current Report on Form 8-K filed on May 31, 2011 to review the audited statements of revenues and certain operating expenses for the Hometown 3-14 Properties and our pro forma financial statements. |
| 3) 2010 ELS Historical FFO per share of $3.47. See the Reconciliation in the Appendix for additional details. |
| 4) Illustrative 2010 Pro Forma FFO (as adjusted) over total dividends. Assumes existing dividend of $1.50 per share. |
| 5) Based on 44.3mm fully-diluted shares outstanding as of March 31, 2011, pro forma for our public offering of 5,250,000 shares of common stock at an assumed price of $57.92 (we priced the 16 offering at $59.50 on June 1, 2011) and the issuance to Hometown of common stock and Series B Preferred Stock at a designated share price of $57.92 as of May 23, 2011. |
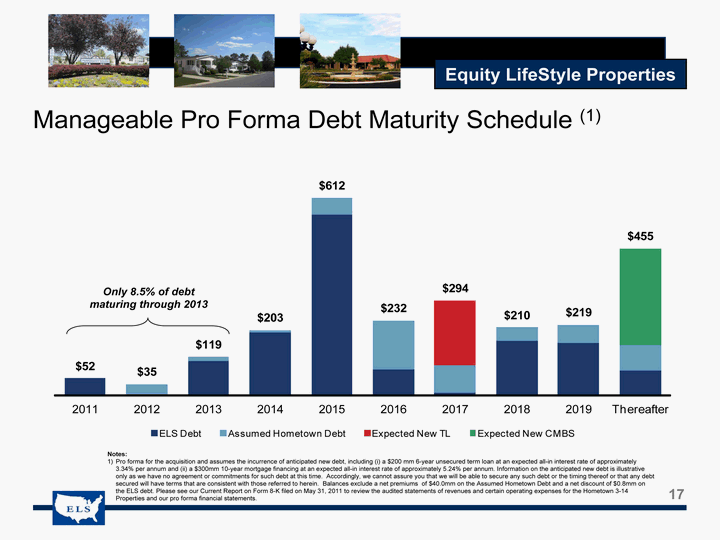
| Equity LifeStyle Properties Manageable Pro Forma Debt Maturity Schedule (1) Notes: 1) Pro forma for the acquisition and assumes the incurrence of anticipated new debt, including (i) a $200 mm 6-year unsecured term loan at an expected all-in interest rate of approximately 3.34% per annum and (ii) a $300mm 10-year mortgage financing at an expected all-in interest rate of approximately 5.24% per annum. Information on the anticipated new debt is illustrative only as we have no agreement or commitments for such debt at this time. Accordingly, we cannot assure you that we will be able to secure any such debt or the timing thereof or that any debt secured will have terms that are consistent with those referred to herein. Balances exclude a net premiums of $40.0mm on the Assumed Hometown Debt and a net discount of $0.8mm on the ELS debt. Please see our Current Report on Form 8-K filed on May 31, 2011 to review the audited statements of revenues and certain operating expenses for the Hometown 3-14 17 Properties and our pro forma financial statements. |
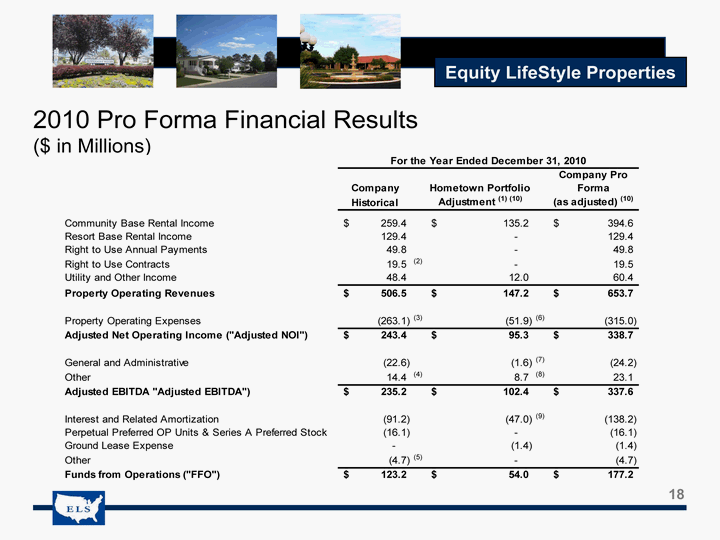
| Equity LifeStyle Properties 2010 Pro Forma Financial Results ($ in Millions) Community Base Rental Income Resort Base Rental Income Right to Use Annual Payments Right to Use Contracts Utility and Other Income Property Operating Revenues Property Operating Expenses Adjusted Net Operating Income (“Adjusted NOI”) General and Administrative Other Adjusted EBITDA “Adjusted EBITDA”) Interest and Related Amortization Perpetual Preferred OP Units & Series A Preferred Stock Ground Lease Expense Other Funds from Operations (“FFO”) For the Year Ended December 31, 2010 Company Pro Company Hometown Portfolio Forma Historical Adjustment (1) (10) (as adjusted) (10) $259.4 $135.2 $394.6 129.4 — 129.4 49.8 — 49.8 19.5 (2) — 19.5 48.4 12.0 60.4 $506.5 $147.2 $653.7 (263.1) (3) (51.9) (6) (315.0) $243.4 $95.3 $338.7 (22.6) (1.6) (7) (24.2) 14.4 (4) 8.7 (8) 23.1 $235.2 $102.4 $337.6 (91.2) (47.0) (9) (138.2) (16.1) — (16.1) - (1.4) (1.4) (4.7) (5) — (4.7) $123.2 $54.0 $177.2 |
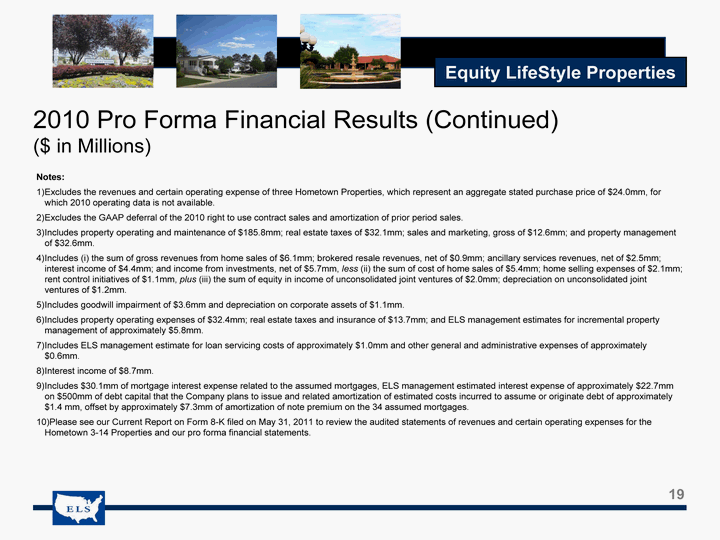
| Equity LifeStyle Properties 2010 Pro Forma Financial Results (Continued) ($ in Millions) Notes: 1)Excludes the revenues and certain operating expense of three Hometown Properties, which represent an aggregate stated purchase price of $24.0mm, for which 2010 operating data is not available. 2)Excludes the GAAP deferral of the 2010 right to use contract sales and amortization of prior period sales. 3)Includes property operating and maintenance of $185.8mm; real estate taxes of $32.1mm; sales and marketing, gross of $12.6mm; and property management of $32.6mm. 4)Includes (i) the sum of gross revenues from home sales of $6.1mm; brokered resale revenues, net of $0.9mm; ancillary services revenues, net of $2.5mm; interest income of $4.4mm; and income from investments, net of $5.7mm, less (ii) the sum of cost of home sales of $5.4mm; home selling expenses of $2.1mm; rent control initiatives of $1.1mm, plus (iii) the sum of equity in income of unconsolidated joint ventures of $2.0mm; depreciation on unconsolidated joint ventures of $1.2mm. 5)Includes goodwill impairment of $3.6mm and depreciation on corporate assets of $1.1mm. 6)Includes property operating expenses of $32.4mm; real estate taxes and insurance of $13.7mm; and ELS management estimates for incremental property management of approximately $5.8mm. 7)Includes ELS management estimate for loan servicing costs of approximately $1.0mm and other general and administrative expenses of approximately $0.6mm. 8)Interest income of $8.7mm. 9)Includes $30.1mm of mortgage interest expense related to the assumed mortgages, ELS management estimated interest expense of approximately $22.7mm on $500mm of debt capital that the Company plans to issue and related amortization of estimated costs incurred to assume or originate debt of approximately $1.4 mm, offset by approximately $7.3mm of amortization of note premium on the 34 assumed mortgages. 10)Please see our Current Report on Form 8-K filed on May 31, 2011 to review the audited statements of revenues and certain operating expenses for the Hometown 3-14 Properties and our pro forma financial statements. 19 |
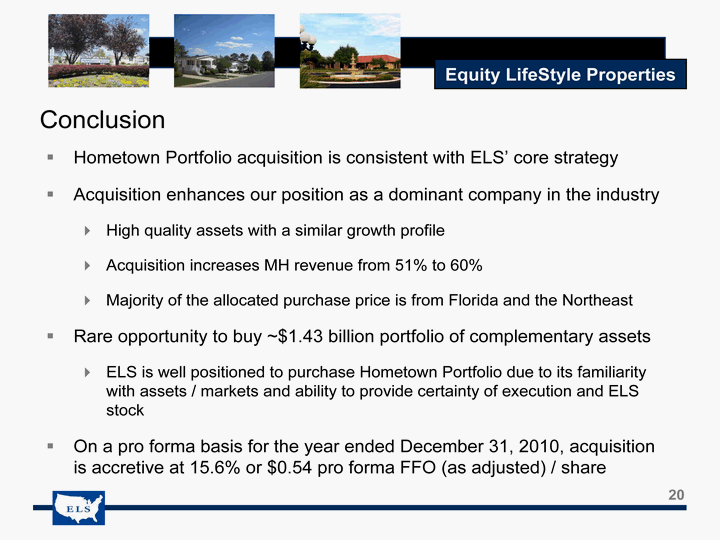
| Equity LifeStyle Properties Conclusion Hometown Portfolio acquisition is consistent with ELS’ core strategy Acquisition enhances our position as a dominant company in the industry _ High quality assets with a similar growth profile _ Acquisition increases MH revenue from 51% to 60% _ Majority of the allocated purchase price is from Florida and the Northeast Rare opportunity to buy ~$1.43 billion portfolio of complementary assets _ ELS is well positioned to purchase Hometown Portfolio due to its familiarity with assets / markets and ability to provide certainty of execution and ELS stock On a pro forma basis for the year ended December 31, 2010, acquisition is accretive at 15.6% or $0.54 pro forma FFO (as adjusted) / share 20 |
| Equity LifeStyle Properties |
| Appendix |
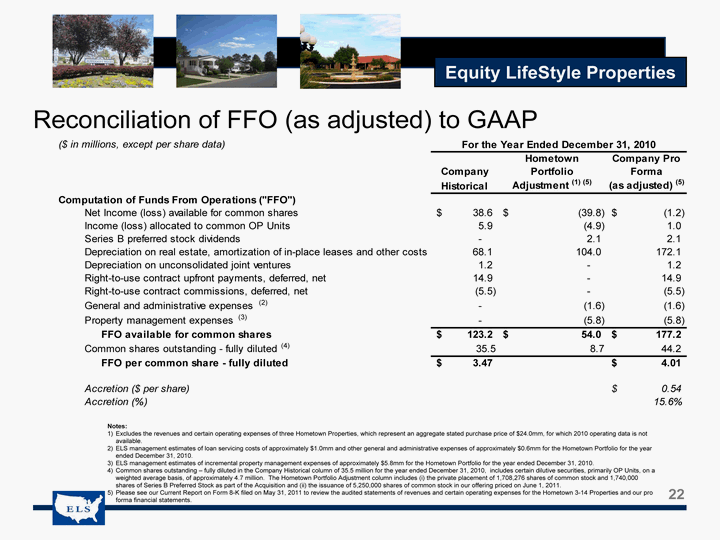
| Equity LifeStyle Properties Reconciliation of FFO (as adjusted) to GAAP ($ in millions, except per share data) Computation of Funds From Operations (“FFO”) Net Income (loss) available for common shares Income (loss) allocated to common OP Units Series B preferred stock dividends Depreciation on real estate, amortization of in-place leases and other costs Depreciation on unconsolidated joint ventures Right-to-use contract upfront payments, deferred, net Right-to-use contract commissions, deferred, net General and administrative expenses (2) Property management expenses (3) FFO available for common shares Common shares outstanding — fully diluted (4) FFO per common share — fully diluted Accretion ($ per share) Accretion (%) | | For the Year Ended December 31, 2010 Hometown Company Pro Company Portfolio Forma Historical Adjustment (1) (5) (as adjusted) (5) $38.6 $(39.8) $(1.2) 5.9 (4.9) 1.0 - 2.1 2.1 68.1 104.0 172.1 1.2 — 1.2 14.9 — 14.9 (5.5) — (5.5) - (1.6) (1.6) - (5.8) (5.8) $123.2 $54.0 $177.2 35.5 8.7 44.2 $3.47 $4.01 $0.54 15.6% Notes: 1) Excludes the revenues and certain operating expenses of three Hometown Properties, which represent an aggregate stated purchase price of $24.0mm, for which 2010 operating data is not available. 2) ELS management estimates of loan servicing costs of approximately $1.0mm and other general and administrative expenses of approximately $0.6mm for the Hometown Portfolio for the year ended December 31, 2010. 3) ELS management estimates of incremental property management expenses of approximately $5.8mm for the Hometown Portfolio for the year ended December 31, 2010. 4) Common shares outstanding — fully diluted in the Company Historical column of 35.5 million for the year ended December 31, 2010, includes certain dilutive securities, primarily OP Units, on a weighted average basis, of approximately 4.7 million. The Hometown Portfolio Adjustment column includes (i) the private placement of 1,708,276 shares of common stock and 1,740,000 shares of Series B Preferred Stock as part of the Acquisition and (ii) the issuance of 5,250,000 shares of common stock in our offering priced on June 1, 2011. 5) Please see our Current Report on Form 8-K filed on May 31, 2011 to review the audited statements of revenues and certain operating expenses for the Hometown 3-14 Properties and our pro 22 forma financial statements. |

| Pro Forma FFO (as adjusted) Definition Funds from Operations (“FFO”) and pro forma FFO (as adjusted) are non-GAAP financial measures. The Company believes that FFO, as defined by the Board of Governors of the National Association of Real Estate Investment Trusts (“NAREIT”), is generally an appropriate measure of performance for an equity REIT. Additionally, the Company believes that pro forma FFO (as adjusted) is useful in evaluating the impact of certain costs that management estimates would have been incurred for property management and additional general and administrative expenses relating to the Hometown Portfolio. While FFO is a relevant and widely used measure of operating performance for equity REITs, it does not, nor does pro forma FFO (as adjusted), represent cash flow from operations or net income as defined by GAAP, and neither measure should be considered as an alternative to these indicators in evaluating liquidity or operating performance. The Company defines FFO as net income, computed in accordance with GAAP, excluding gains or actual or estimated losses from sales of properties, plus real estate related depreciation and amortization, and after adjustments for unconsolidated partnerships and joint ventures. Adjustments for unconsolidated partnerships and joint ventures are calculated to reflect FFO on the same basis. The Company receives up-front non-refundable payments from the entry of right-to-use contracts. In accordance with GAAP, the upfront non-refundable payments and related commissions are deferred and amortized over the estimated customer life. Although the NAREIT definition of FFO does not address the treatment of nonrefundable right-to-use payments, the Company believes that it is appropriate to adjust for the impact of the deferral activity in its calculation of FFO. The Company believes that FFO is helpful to investors as one of several measures of the performance of an equity REIT. The Company further believes that by excluding the effect of depreciation, amortization and gains or actual or estimated losses from sales of real estate, all of which are based on historical costs and which may be of limited relevance in evaluating current performance, FFO can facilitate comparisons of operating performance between periods and among other equity REITs. The Company believes that the adjustment to FFO for the net revenue deferral of upfront non-refundable payments and expense deferral of right-to-use contract commissions also facilitates the comparison to other equity REITs. The Company defines pro forma FFO (as adjusted) as FFO less management’s estimates of costs that would have been incurred during the year ended December 31, 2010 for property management and additional general and administrative expenses relating to the Hometown Portfolio. Investors should review FFO and pro forma FFO (as adjusted), along with GAAP net income and cash flow from operating activities, investing activities and financing activities, when evaluating the Company’s operating performance. The Company computes FFO in accordance with its interpretation of standards established by NAREIT, which may not be comparable to FFO reported by other REITs that do not define the term in accordance with the current NAREIT definition or that interpret the current NAREIT definition differently than the Company does. Neither FFO or pro forma FFO (as adjusted) represents cash generated from operating activities in accordance with GAAP, nor does either measure represent cash available to pay distributions and should not be considered as an alternative to net income, determined in accordance with GAAP, as an indication of the Company’s financial performance, or to cash flow from operating activities, determined in accordance with GAAP, as a measure of the Company’s liquidity, nor is either measure indicative of funds available to fund the Company’s cash needs, including its ability to make cash distributions. Adjusted EBITDA Definition Earnings Before Interest, Taxes and Depreciation (“EBITDA”) and EBITDA (as adjusted) (“Adjusted EBITDA”), are non-GAAP financial measures. EBITDA and Adjusted EBITDA do not represent cash flow from operations or net income as defined by GAAP, and should not be considered an alternative to these indicators in evaluating liquidity or operating performance. The Company defines Adjusted EBITDA as EBITDA of the Hometown 3-14 Properties less management’s estimates of costs that would have been incurred during the year ended December 31, 2010 for property management and additional general and administrative expenses relating to the Hometown Portfolio. The Company believes Adjusted EBITDA is useful to an investor in understanding and evaluating the operating performance of the Hometown 3-14 Properties because it helps investors meaningfully evaluate and compare the results of such operations from period to period by removing from its operating results the impact of Hometown’s capital structure (primarily interest charges from the Hometown’s outstanding debt) and the Hometown’s asset base (primarily depreciation and amortization), which are not indicative of the Hometown’s operating performance for these assets going forward. Detailed calculations for Adjusted EBITDA are included on pages 18 and 19 of this presentation. Adjusted NOI Definition Net Operating Income (“NOI”) and NOI (as adjusted) (“Adjusted NOI”), are non-GAAP financial measures. NOI and Adjusted NOI do not represent cash flow from operations or net income as defined by GAAP, and should not be considered as an alternative to these indicators in evaluating liquidity or operating performance. The Company defines Adjusted NOI as NOI of the Hometown 3-14 Properties less management’s estimates of costs that would have been incurred during the year ended December 31, 2010 for property management and additional general and administrative expenses relating to the Hometown Portfolio. The Company believes Adjusted NOI is useful to an investor in understanding and evaluating the operating performance of the Hometown 3-14 Properties because it helps investors meaningfully evaluate and compare the results of such operations from period to period by removing from its operating results the impact of Hometown’s capital structure (primarily interest charges from outstanding debt) and Hometown’s asset base (primarily depreciation and amortization), which are not indicative of the operating performance for those assets going forward. Detailed calculations for Adjusted NOI are included on pages 18 and 19 of this presentation. 23 |
