Attached files
| file | filename |
|---|---|
| 8-K - FORM 8-K - EDISON INTERNATIONAL | d8k.htm |
Exhibit 99.1
Leading the Way in Electricity SM
27th Annual
Bernstein Strategic Decisions Conference June 3, 2011
Theodore F. Craver, Jr. Chairman, President & CEO
Edison International
June 3, 2011 EDISON INTERNATIONAL®
Leading the Way in Electricity SM
Forward-Looking Statements
Statements contained in this presentation about future performance, including, without limitation, earnings, asset and rate base growth, load growth, capital expenditures, and other statements that are not purely historical, are forward-looking statements. These forward-looking statements reflect our current expectations; however, such statements involve risks and uncertainties. Actual results could differ materially from current expectations. These forward-looking statements represent our expectations only as of the date of this presentation, and Edison International assumes no duty to update them to reflect new information, events or circumstances. Important factors that could cause different results are discussed under the headings “Risk Factors,” and “Management’s Discussion and Analysis” in Edison International’s 2010 Form 10-K, most recent Form 10-Q, and other reports filed with the Securities and Exchange Commission, which are available on our website: www.edisoninvestor.com. These filings also provide additional information on historical and other factual data contained in this presentation.
June 3, 2011 1 EDISON INTERNATIONAL®
Leading the Way in Electricity SM
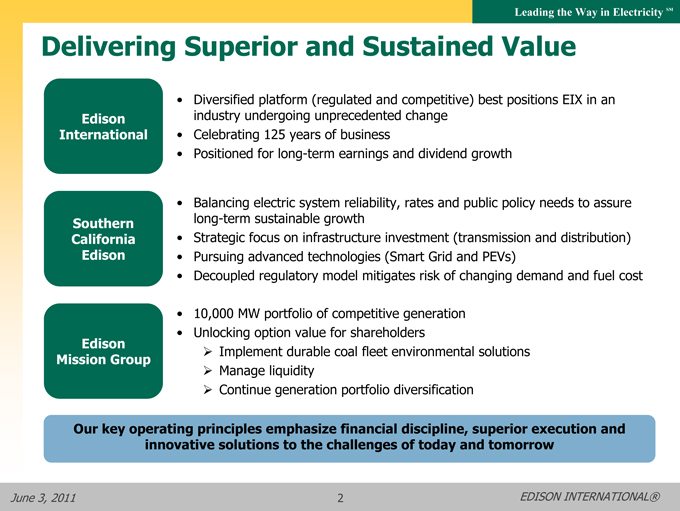
Delivering Superior and Sustained Value
Edison International
Southern California Edison
Edison Mission Group
• Diversified platform (regulated and competitive) best positions EIX in an industry undergoing unprecedented change
• Celebrating 125 years of business
• Positioned for long-term earnings and dividend growth
• Balancing electric system reliability, rates and public policy needs to assure long-term sustainable growth
• Strategic focus on infrastructure investment (transmission and distribution)
• Pursuing advanced technologies (Smart Grid and PEVs)
• Decoupled regulatory model mitigates risk of changing demand and fuel cost
• 10,000 MW portfolio of competitive generation
• Unlocking option value for shareholders
Implement durable coal fleet environmental solutions
Manage liquidity
Continue generation portfolio diversification
Our key operating principles emphasize financial discipline, superior execution and innovative solutions to the challenges of today and tomorrow
June 3, 2011 2 EDISON INTERNATIONAL®
Leading the Way in Electricity SM
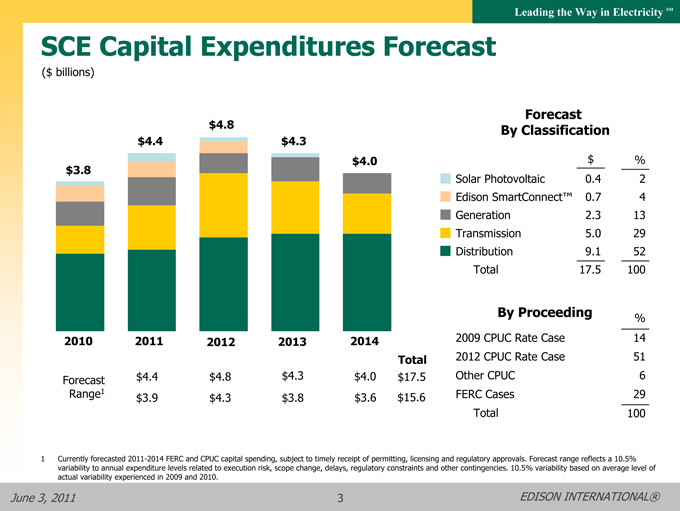
SCE Capital Expenditures Forecast
($ billions)
$3.8 $4.4 $4.8 $4.3 $4.0
2010 2011 2012 2013 2014
Total
Forecast $4.4 $4.8 $4.3 $4.0 $17.5
Range1 $3.9 $4.3 $3.8 $3.6 $15.6
Forecast By Classification
$%
Solar Photovoltaic 0.4 2
Edison SmartConnect™ 0.7 4
Generation 2.3 13
Transmission 5.0 29
Distribution 9.1 52
Total 17.5 100
By Proceeding%
2009 CPUC Rate Case 14
2012 CPUC Rate Case 51
Other CPUC 6
FERC Cases 29
Total 100
1 Currently forecasted 2011-2014 FERC and CPUC capital spending, subject to timely receipt of permitting, licensing and regulatory approvals. Forecast range reflects a 10.5% variability to annual expenditure levels related to execution risk, scope change, delays, regulatory constraints and other contingencies. 10.5% variability based on average level of actual variability experienced in 2009 and 2010.
June 3, 2011 3 EDISON INTERNATIONAL®
Leading the Way in Electricity SM
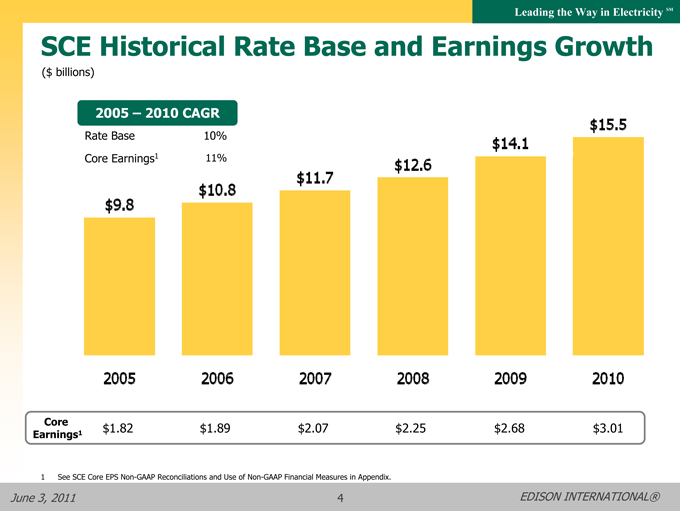
SCE Historical Rate Base and Earnings Growth
($ billions)
2005 – 2010 CAGR
Rate Base 10%
Core Earnings1 11%
$9.8 $10.8 $11.7 $12.6 $14.1 $15.5
2005 2006 2007 2008 2009 2010
Core Earnings1
$1.82 $1.89 $2.07 $2.25 $2.68 $3.01
1 See SCE Core EPS Non-GAAP Reconciliations and Use of Non-GAAP Financial Measures in Appendix.
June 3, 2011 4 EDISON INTERNATIONAL®
Leading the Way in Electricity SM
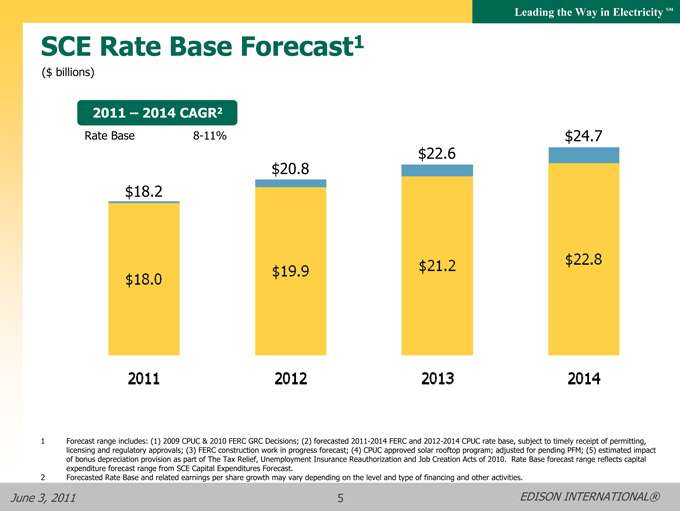
SCE Rate Base Forecast1
($ billions)
2011 – 2014 CAGR2
Rate Base 8-11%
$18.2 $20.8 $22.6 $24.7
$18.0 $19.9 $21.2 $22.8
2011 2012 2013 2014
1 Forecast range includes: (1) 2009 CPUC & 2010 FERC GRC Decisions; (2) forecasted 2011-2014 FERC and 2012-2014 CPUC rate base, subject to timely receipt of permitting, licensing and regulatory approvals; (3) FERC construction work in progress forecast; (4) CPUC approved solar rooftop program; adjusted for pending PFM; (5) estimated impact of bonus depreciation provision as part of The Tax Relief, Unemployment Insurance Reauthorization and Job Creation Acts of 2010. Rate Base forecast range reflects capital expenditure forecast range from SCE Capital Expenditures Forecast.
2 Forecasted Rate Base and related earnings per share growth may vary depending on the level and type of financing and other activities.
June 3, 2011 5 EDISON INTERNATIONAL®
Leading the Way in Electricity SM
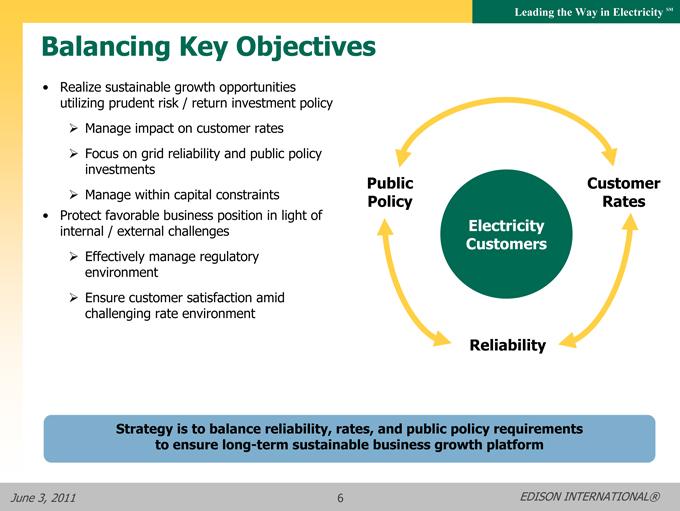
Balancing Key Objectives
• Realize sustainable growth opportunities utilizing prudent risk / return investment policy
Manage impact on customer rates
Focus on grid reliability and public policy investments
Manage within capital constraints
• Protect favorable business position in light of internal / external challenges
Effectively manage regulatory environment
Ensure customer satisfaction amid challenging rate environment
Public Policy
Customer Rates
Reliability
Electricity Customers
Strategy is to balance reliability, rates, and public policy requirements to ensure long-term sustainable business growth platform
June 3, 2011 6 EDISON INTERNATIONAL®
Leading the Way in Electricity SM
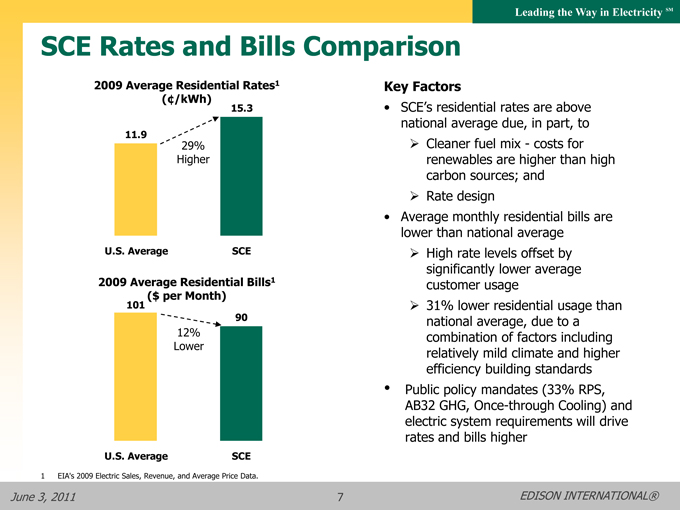
SCE Rates and Bills Comparison
2009 Average Residential Rates1 (¢/kWh)
11.9 U.S. Average
29% Higher
15.3 SCE
2009 Average Residential Bills1 ($ per Month)
101 U.S. Average
12% Lower
90 SCE
Key Factors
• SCE’s residential rates are above national average due, in part, to
Cleaner fuel mix - costs for renewables are higher than high carbon sources; and
Rate design
• Average monthly residential bills are lower than national average
High rate levels offset by significantly lower average customer usage
31% lower residential usage than national average, due to a combination of factors including relatively mild climate and higher efficiency building standards
• Public policy mandates (33% RPS, AB32 GHG, Once-through Cooling) and electric system requirements will drive rates and bills higher
1 EIA’s 2009 Electric Sales, Revenue, and Average Price Data.
June 3, 2011 7 EDISON INTERNATIONAL®
Leading the Way in Electricity SM
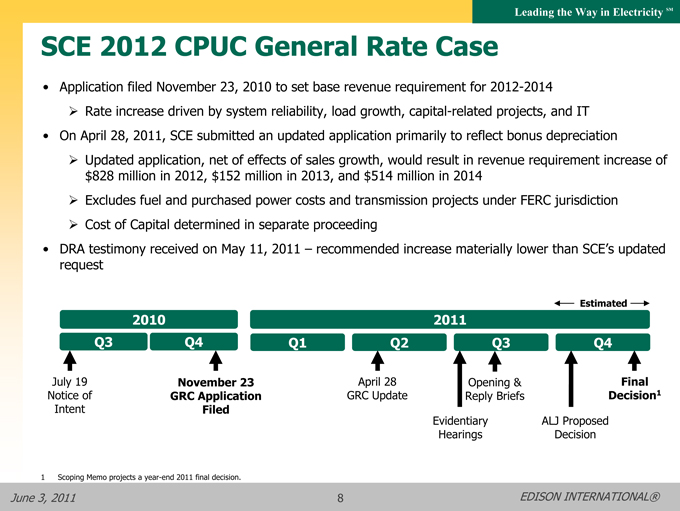
SCE 2012 CPUC General Rate Case
• Application filed November 23, 2010 to set base revenue requirement for 2012-2014
Rate increase driven by system reliability, load growth, capital-related projects, and IT
• On April 28, 2011, SCE submitted an updated application primarily to reflect bonus depreciation
Updated application, net of effects of sales growth, would result in revenue requirement increase of $828 million in 2012, $152 million in 2013, and $514 million in 2014
Excludes fuel and purchased power costs and transmission projects under FERC jurisdiction
Cost of Capital determined in separate proceeding
• DRA testimony received on May 11, 2011 – recommended increase materially lower than SCE’s updated request
Estimated
2010 2011
Q3 Q4 Q1 Q2 Q3 Q4
July 19 Notice of Intent
November 23 GRC Application Filed
April 28 GRC Update
Evidentiary Hearings
Opening & Reply Briefs
ALJ Proposed Decision
Final Decision1
1 Scoping Memo projects a year-end 2011 final decision.
June 3, 2011 8 EDISON INTERNATIONAL®
Leading the Way in Electricity SM
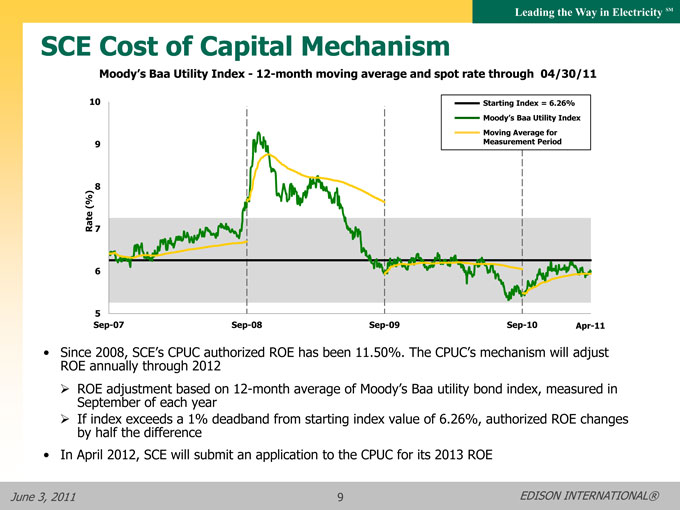
SCE Cost of Capital Mechanism
Moody’s Baa Utility Index - 12-month moving average and spot rate through 04/30/11
Starting Index = 6.26%
Moody’s Baa Utility Index
Moving Average for Measurement Period
10 9 8 7 6 5
Rate (%)
Sep-07 Sep-08 Sep-09 Sep-10 Apr-11
• Since 2008, SCE’s CPUC authorized ROE has been 11.50%. The CPUC’s mechanism will adjust ROE annually through 2012
ROE adjustment based on 12-month average of Moody’s Baa utility bond index, measured in September of each year
If index exceeds a 1% deadband from starting index value of 6.26%, authorized ROE changes by half the difference
• In April 2012, SCE will submit an application to the CPUC for its 2013 ROE
June 3, 2011 9 EDISON INTERNATIONAL®
Leading the Way in Electricity SM
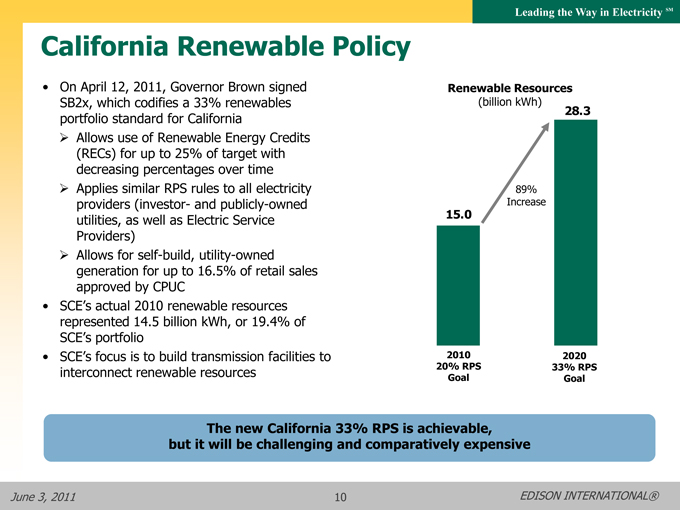
California Renewable Policy
• On April 12, 2011, Governor Brown signed SB2x, which codifies a 33% renewables portfolio standard for California
Allows use of Renewable Energy Credits (RECs) for up to 25% of target with decreasing percentages over time
Applies similar RPS rules to all electricity providers (investor- and publicly-owned utilities, as well as Electric Service Providers)
Allows for self-build, utility-owned generation for up to 16.5% of retail sales approved by CPUC
• SCE’s actual 2010 renewable resources represented 14.5 billion kWh, or 19.4% of SCE’s portfolio
• SCE’s focus is to build transmission facilities to interconnect renewable resources
Renewable Resources
(billion kWh)
15.0
2010 20% RPS
Goal
89% Increase
28.3
2020 33% RPS
Goal
The new California 33% RPS is achievable, but it will be challenging and comparatively expensive
June 3, 2011 10 EDISON INTERNATIONAL®
Leading the Way in Electricity SM
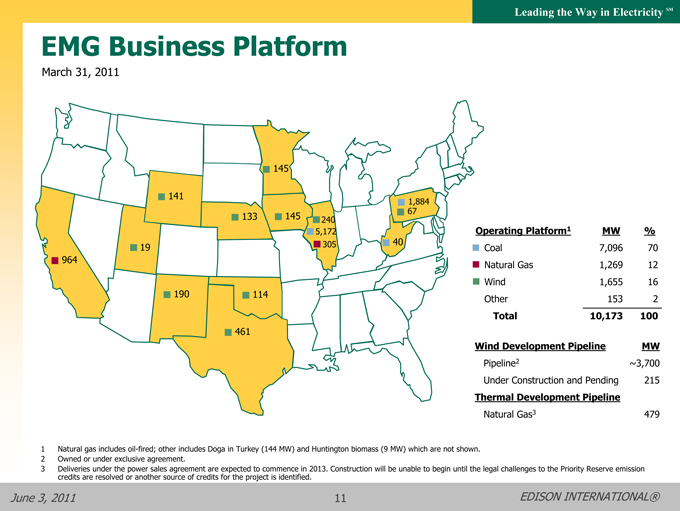
EMG Business Platform
March 31, 2011
964 19 141 190 133 114 461 145 145 240 5,172 305 1,884 67 40
Operating Platform1 MW%
Coal 7,096 70
Natural Gas 1,269 12
Wind 1,655 16
Other 153 2
Total 10,173 100
Wind Development Pipeline MW
Pipeline2 ~3,700
Under Construction and Pending 215
Thermal Development Pipeline
Natural Gas3 479
1 Natural gas includes oil-fired; other includes Doga in Turkey (144 MW) and Huntington biomass (9 MW) which are not shown.
2 Owned or under exclusive agreement.
3 Deliveries under the power sales agreement are expected to commence in 2013. Construction will be unable to begin until the legal challenges to the Priority Reserve emission credits are resolved or another source of credits for the project is identified.
June 3, 2011 11 EDISON INTERNATIONAL®
Leading the Way in Electricity SM
Unlocking EMG Option Value
• Finalize durable solution for coal fleet environmental challenges
Midwest Generation: Activated Carbon (Mercury), Selective Non-Catalytic Reduction (NOx), Dry Sorbent Injection & particulate removal upgrades (SO2, Acid Gases)
Homer City: under discussion with Owner-Lessors
• Address upcoming maturities
Credit Facilities: 2012
Unsecured Notes: 2013
• Continue generation portfolio diversification
Seeking external capital for wind business
Developing 479 MW Walnut Creek “peaking” project
• Need recovery of energy and capacity prices
2014 – 15 RPM auction results demonstrated improving RTO price trend
June 3, 2011 12 EDISON INTERNATIONAL®
Leading the Way in Electricity SM
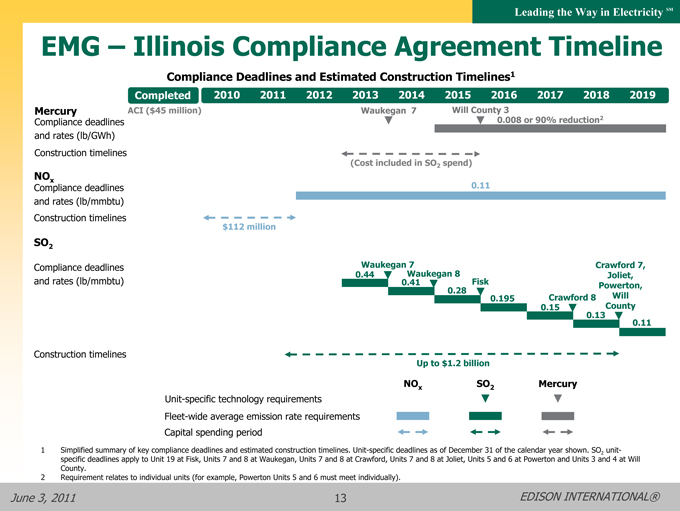
EMG – Illinois Compliance Agreement Timeline
Compliance Deadlines and Estimated Construction Timelines1
Completed 2010 2011 2012 2013 2014 2015 2016 2017 2018 2019
Mercury Compliance deadlines and rates (lb/GWh) Construction timelines ACI ($45 million) Waukegan 7 Will County 3
0.008 or 90% reduction2
(Cost included in SO2 spend)
NOx Compliance deadlines and rates (lb/mmbtu) Construction timelines 0.11 $112 million
SO2 Compliance deadlines and rates (lb/mmbtu) Waukegan 7 Crawford 7, 0.44 Waukegan 8 Joliet, 0.41 Fisk Powerton, 0.28 0.195 Crawford 8 Will 0.15 County
0.13
0.11
Construction timelines
Up to $1.2 billion
NOx SO2 Mercury
Unit-specific technology requirements
Fleet-wide average emission rate requirements
Capital spending period
1 Simplified summary of key compliance deadlines and estimated construction timelines. Unit-specific deadlines as of December 31 of the calendar year shown. SO2 unit-specific deadlines apply to Unit 19 at Fisk, Units 7 and 8 at Waukegan, Units 7 and 8 at Crawford, Units 7 and 8 at Joliet, Units 5 and 6 at Powerton and Units 3 and 4 at Will County.
2 Requirement relates to individual units (for example, Powerton Units 5 and 6 must meet individually).
June 3, 2011 13 EDISON INTERNATIONAL®
Leading the Way in Electricity SM
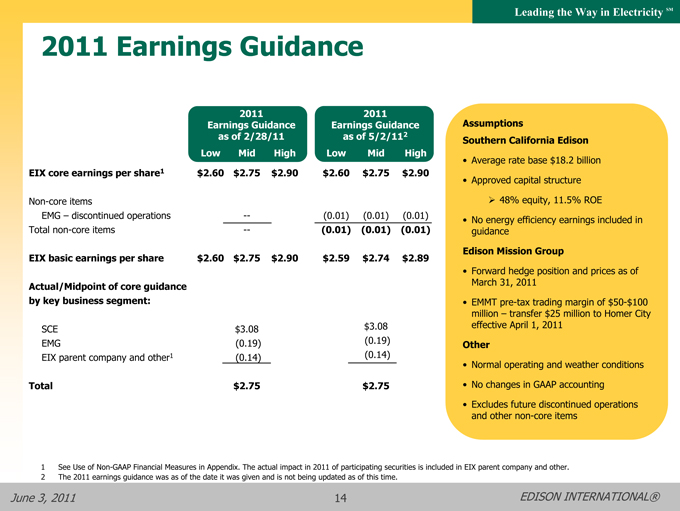
2011 Earnings Guidance
2011 Earnings Guidance as of 2/28/11 Low Mid High
2011 Earnings Guidance as of 5/2/112 Low Mid High
EIX core earnings per share1 $2.60 $2.75 $2.90 $2.60 $2.75 $2.90
Non-core items
EMG – discontinued operations — (0.01) (0.01) (0.01)
Total non-core items — (0.01) (0.01) (0.01)
EIX basic earnings per share $2.60 $2.75 $2.90 $2.59 $2.74 $2.89
Actual/Midpoint of core guidance by key business segment:
SCE $3.08 $3.08
EMG(0.19)(0.19)
EIX parent company and other1 (0.14) (0.14)
Total $2.75 $2.75
Assumptions
Southern California Edison
• Average rate base $18.2 billion
• Approved capital structure
48% equity, 11.5% ROE
• No energy efficiency earnings included in guidance
Edison Mission Group
• Forward hedge position and prices as of March 31, 2011
• EMMT pre-tax trading margin of $50-$100 million – transfer $25 million to Homer City effective April 1, 2011
Other
• Normal operating and weather conditions
• No changes in GAAP accounting
• Excludes future discontinued operations and other non-core items
1 See Use of Non-GAAP Financial Measures in Appendix. The actual impact in 2011 of participating securities is included in EIX parent company and other.
2 The 2011 earnings guidance was as of the date it was given and is not being updated as of this time.
June 3, 2011 14 EDISON INTERNATIONAL®

Leading the Way in Electricity SM
Our Shareholder Value Proposition
• Dual platform operating across the full spectrum of the electricity industry
• Southern California Edison
Among the best domestic electric utility growth platforms
Supportive regulatory framework
Leadership in renewable energy, energy efficiency, electric vehicles and smart grid development
• Edison Mission Group
See real equity value in the portfolio
Working coal fleet environmental compliance issues
Current wind construction program is self-funding
• Commitment to long-term shareholder value creation
• Incentive compensation and stock ownership guidelines consistent with shareholder interests
• Edison people committed to safety, customer service, and operational excellence
June 3, 2011 15 EDISON INTERNATIONAL®

Leading the Way in Electricity SM
EDISON INTERNATIONAL
Celebrating 125 Years
1886-2011
June 3, 2011 16 EDISON INTERNATIONAL®
Leading the Way in Electricity SM
Use of Non-GAAP Financial Measures
Edison International’s earnings are prepared in accordance with generally accepted accounting principles used in the United States and represent the company’s earnings as reported to the Securities and Exchange Commission. Our management uses core earnings and EPS by principal operating subsidiary internally for financial planning and for analysis of performance. We also use core earnings and EPS by principal operating subsidiary when communicating with analysts and investors regarding our earnings results and outlook, to facilitate the company’s performance from period to period.
Core earnings is a Non-GAAP financial measure and may not be comparable to those of other companies. Core earnings and core earnings per share are defined as GAAP earnings and basic earnings per share excluding income or loss from discontinued operations and income or loss from significant discrete items that management does not consider representative of ongoing earnings. GAAP earnings refer to net income attributable to Edison International common shareholders or attributable to the common shareholders of each subsidiary. EPS by principal operating subsidiary is based on the principal operating subsidiaries’ net income attributable to the common shareholders of each subsidiary, respectively, and Edison International’s weighted average outstanding common shares. The impact of participating securities (vested stock options that earn dividend equivalents that may participate in undistributed earnings with common stock) for each principal operating subsidiary is not material to each principal operating subsidiary’s EPS and is therefore reflected in the results of the Edison International holding company, which we refer to as EIX parent company and other.
A reconciliation of Non-GAAP information to GAAP information, including the impact of participating securities, is included either on the slide where the information appears or on another slide referenced in this presentation.
June 3, 2011 17 EDISON INTERNATIONAL®