Attached files
| file | filename |
|---|---|
| 8-K - FORM 8-K - EXELON GENERATION CO LLC | d8k.htm |
 Investor Meetings
June 2011
Exhibit 99.1 |
 2
Forward-Looking Statements
This presentation includes forward-looking statements within the meaning of the
Private Securities Litigation Reform Act of 1995, that are subject to risks
and uncertainties. The factors that could cause actual results to differ
materially from these forward-looking statements include those discussed
herein as well as those discussed in (1) Exelon’s 2010 Annual Report on Form
10-K in (a) ITEM 1A. Risk Factors, (b) ITEM 7. Management’s
Discussion and Analysis of Financial Condition and Results of Operations and
(c) ITEM 8. Financial Statements and Supplementary Data: Note 18; (2) Exelon’s
First Quarter 2011 Quarterly Report on Form 10-Q in (a) Part II, Other
Information, ITEM 1A. Risk Factors, (b) Part 1, Financial Information,
ITEM 2. Management’s Discussion and Analysis of Financial Condition and
Results of Operations and (c) Part I , Financial Information, ITEM 1. Financial
Statements: Note 12 and (3) other factors discussed in filings with the Securities
and Exchange Commission (SEC) by Exelon Corporation, Commonwealth Edison
Company, PECO Energy Company and Exelon Generation Company, LLC (Companies).
Readers are cautioned not to place undue reliance on these
forward-looking statements, which apply only as of the date of this
presentation.
None
of
the
Companies
undertakes
any
obligation
to
publicly
release
any
revision
to
it
s forward-looking statements to reflect events or circumstances after the date
of this presentation. |
 PJM
RPM Auction Results 3
Base Auction Clearing Prices ($ / MW –
Day)
LDA
RTO
MAAC
EMAAC
SWMAAC
PY 12/13
Single Product
$16.46
$133.37
$139.73
$133.37
PY 13/14
Single Product
$27.73
$226.15
$245
$226.15
PY 14/15
Limited DR
$125.47
$125.47
$125.47
$125.47
Extended Summer DR and
Annual Resources
$125.99
$136.50
$136.50
$136.50
Increased quantities of uncleared generation in RTO reflect changed bidding behavior
by some generators to include the cost of environmental compliance
Note: RPM = Reliability Pricing Model; PY = Planning year; LDA = Locational Deliverability Area; DR =
Demand response |
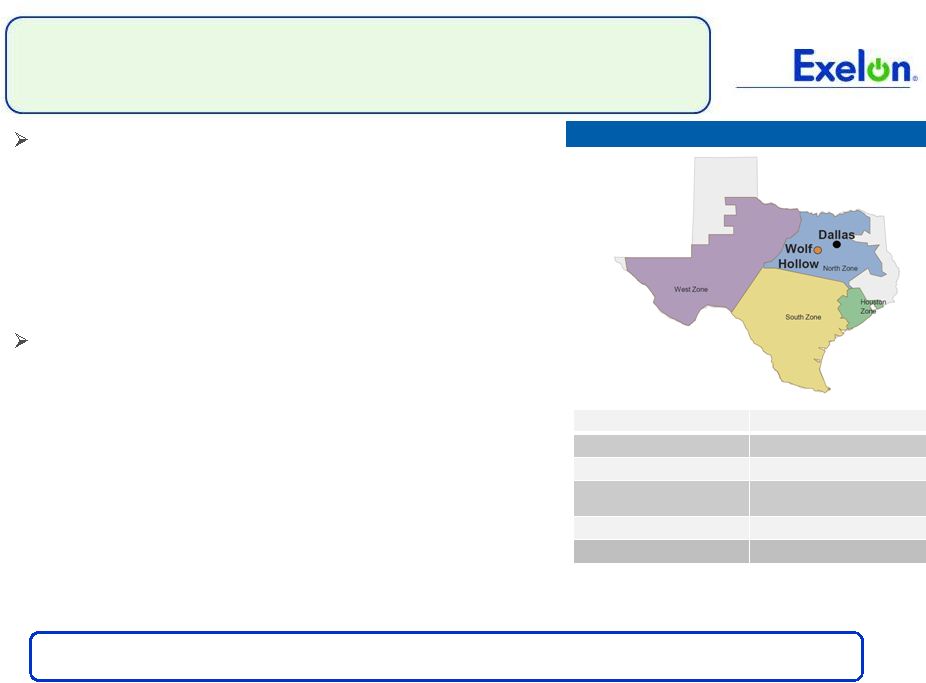 Wolf
Hollow Acquisition 4
Wolf Hollow Overview
Diversifies generation portfolio
•
Expands geographic and fuel characteristics
of fleet
•
Advances Exelon and Constellation merger
strategy of matching load with generation in
key competitive markets
Creates value for shareholders
•
Purchase price compares favorably to cost of
new build
•
Free cash flow accretive beginning in 2012;
earnings and credit neutral
•
Eliminates current above market purchase
power agreement (PPA) with Wolf Hollow
•
Enhances opportunity to benefit from future
market heat rate expansion in ERCOT
Transaction expected to close in Q3 2011
Location
Granbury, Texas
Commercial Operation Date
August 2003
Nominal Net Operating Capacity
720MW
Equipment Technology
2 Mitsubishi combined-cycle gas
turbines
Primary Fuel
Natural Gas
Secondary Fuel
None
ERCOT = Electric Reliability Council of Texas |
 5
ComEd Load Trends
Chicago
U.S.
Unemployment rate
(1)
8.5%
8.8%
2011 annualized growth in
gross domestic/metro product
(2)
2.5%
3.2% Note: C&I = Commercial & Industrial
Weather-Normalized Load Year-over-Year
Key Economic Indicators
2010
1Q11 2011E
Average Customer Growth
0.2%
0.4%
0.5%
Average Use-Per-Customer
(1.4)%
(2.2)%
0.1%
Total Residential
(1.2)%
(1.8)% 0.5%
Small C&I
(0.6)%
0.6%
(0.3)%
Large C&I
2.6%
1.4%
(0.1)%
All Customer Classes
0.2%
(0.1)%
0.0%
(1)
Source: U.S. Dept. of Labor (March 2011) and Illinois
Department of Security (March 2011)
(2) Source: Global Insight February 2011
-6.0%
-3.0%
0.0%
3.0%
6.0%
1Q10
2Q10
3Q10
4Q10
1Q11
2Q11
3Q11
4Q11
-6.0%
-3.0%
0.0%
3.0%
6.0%
All Customer Classes
Large C&I
Residential
Gross Metro Product
Weather-Normalized Load |
 ComEd
2010 Rate Case Final Order (ICC Docket No. 10-0467)
On 5/24/11, the Illinois Commerce Commission (ICC) issued an order in ComEd’s
2010 distribution rate case –
new rates scheduled to go into effect in June 2011
Rate Case Details
ICC Order
(5/24/11)
ComEd Reply Brief
(2/23/11)
Revenue Requirement Increase
$143M
(1)
$343M
Rate Base
$6,549M
$7,349M
ROE
10.50%
11.50%
(2)
Equity Ratio
47.28%
47.28%
(1)
Reflects ~$(13)M adjustment to ICC Order
(2)
Included 40 bp adder for energy efficiency, not approved by ICC
6 |
 Illinois Power Agency (IPA)
RFP Procurement
Note: Chart is for illustrative purposes only.
REC = Renewable Energy Credit; RFP = request for proposal
June 2011
June 2012
June 2013
June 2014
Financial Swap Agreement with ExGen
(ATC baseload energy –
notional quantity
3,000 MW)
2011 RFP
2012 RFP
2012 RFP
2013 RFP
2013 RFP
2014 RFP
Financial Swap
2010 RFP
2011 RFP
2011 RFP
2012 RFP
ICC has approved Standard Products and Annual REC
Procurement held in May 2011
–
Effective ATC of $34.77/MWh for 9 winning Standard Product
suppliers for the 2011-12 plan-year
–
2.12 million MWh of renewable resources for the 2011-12 plan-year
from 12 winning suppliers
–
Provisions included:
•
Annual energy procurements over a three-year time frame
•
Target a 35%/35%/30% laddered procurement approach
•
No additional Energy Efficiency, Demand Response purchases
•
No additional long-term contracts for renewables
•
No
10%
overprocurement
for
summer
peak
energy
June 2015
Delivery
Period
Peak
Off-Peak
June 2011 -
May 2012
5,118
4,001
June 2012 -
May 2013
1,129
358
June 2013 -
May 2014
6,494
6,062
Volume procured in the 2011 IPA
Procurement Event (GWh)
Term
Fixed Price
($/MWh)
1/1/11-12/31/11
$51.26
1/1/12-12/31/12
$52.37
1/13/13-5/31/13
$53.48
7 |
 8
PECO Load Trends
Philadelphia
U.S.
Unemployment rate
(1)
8.4%
8.8%
2010 annualized growth in
gross domestic/metro product
(2)
3.0%
3.2% Note: C&I = Commercial &
Industrial 2010
1Q11 2011E
Average Customer Growth
0.3%
0.4%
0.4%
Average Use-Per-Customer
0.3%
0.2%
1.7%
Total Residential
0.5%
0.5% 2.1%
Small C&I
(1.9)%
(1.1)% 0.1%
Large C&I
0.8%
(2.7)% (1.6)%
All Customer Classes
0.1%
(1.1)% 0.1%
(1) Source:
U.S.
Dept.
of
Labor
data
March
2011
-
US
U.S.
Dept.
of
Labor
prelim.
data
February
2011
-
Philadelphia
(2) Source: Global Insight February 2011
-6.0%
-3.0%
0.0%
3.0%
6.0%
1Q10
2Q10
3Q10
4Q10
1Q11
2Q11
3Q11
4Q11
-6.0%
-3.0%
0.0%
3.0%
6.0%
All Customer Classes
Large C&I
Residential
Gross Metro Product
Weather-Normalized Load Year-over-Year
Key Economic Indicators
Weather-Normalized Load |
 9
PECO Procurement Plan
Customer Class
Products
Residential
75% full requirements
20% block energy
5% energy only spot
Small Commercial
(peak demand <100 kW)
90% full requirements
10% full requirements spot
Medium Commercial
(peak demand >100 kW but
<= 500 kW)
85% full requirements
15% full requirements spot
Large Commercial &
Industrial
(peak
demand
>500 kW)
Fixed-Priced full
requirements
(2)
Hourly full requirements
PECO Procurement Plan
(1)
Residential –
weighted average wholesale prices
80 MW of baseload (24x7) block energy product (for Jan-Dec 2012) –
$51.52/MWh
70 MW of Jun-Aug 2011 summer on-peak block energy product –
$67.24/MWh
40 MW of Dec 2011-Feb 2012 winter on-peak block energy product
– $63.05/MWh
Large
Commercial
and
Industrial
(Hourly)
–
weighted average
wholesale price
36%
of
hourly
full
requirements
product
(for
Jun
2011-May
2012)
(3)
–
$4.97/MWh
(4)
May
2,
2011
RFP
-
Fifth in a series of nine
procurements for the PUC-approved
Default Service Plan
Spring
2011
RFP
was
held
on
May
2,
2011,
with
results
announced
on
May
18th
(1)
See PECO Procurement website (http://www.pecoprocurement.com) for additional details regarding
PECO’s procurement plan and RFP results. (2)
For Large C&I customers who previously opted to participate in the 2011 fixed-priced full
requirements product. (3)
Large C&I tranches which were not fully subscribed in the fall 2010 procurement.
(4)
The price for the hourly full requirements product includes only ancillary services/Alternative Energy
Portfolio Standard (AEPS) and miscellaneous costs. The price does not include energy and
capacity costs. Energy costs will be based on the PECO Zone Day-Ahead locational marginal pricing (LMP) price, and capacity will be based on the
PJM RPM price per day. |
 2010
2011
2012
2013
2014
2015
2016
2017
2018
PJM RPM Auction
14/15
15/16
16/17
17/18
Hazardous Air
Pollutants
Criteria
Pollutants
Greenhouse
Gases
Coal
Combustion
By-Products
Cooling Water
Effluents
10
EPA Regulations Will Move Forward in 2011
Develop Toxics Rule
Develop ICI
MACT
Pre Compliance Period
Compliance With Toxics Rule
Pre Compliance Period
Compliance With ICI MACT
Develop
Transport Rule
Compliance With Transport Rule
Interim CAIR
Develop O3
Transport
Rule (TR 2)
Estimated Compliance
Develop Criteria
NSPS revision
Compliance with Revised Criteria NSPS
Develop Revised
NAAQS
SIP provisions developed in response to revised NAAQS
(e.g., Ozone, PM2.5, SO2, NO2, NOx/SOx, CO)
Compliance with Federal GHG Reporting Rule
PSD/BACT and Title V Apply to GHG Emissions (PSD only for new and modified
sources) Develop GHG NSPS
Pre Compliance Period
Compliance With GHG NSPS
Develop Coal Combustion
By-Products Rule
Pre Compliance Period
Compliance With Federal CCB Regulations
Develop 316(b) Regulations
Pre Compliance Period
Phase In Of Compliance
Phase In Of
Compliance
Develop Effluent Regulations
Pre Compliance Period
Notes: RPM auctions take place annually in May.
For definition of the EPA regulations referred to on this slide, please see the EPA’s Terms of
Environment (http://www.epa.gov/OCEPAterms/). |
 11
2011 Events of Interest
Q1
Q2
Q3
Q4
RPM Auction results
(5/13)
Illinois Power Agency
RFP (5/16)
ALJ Proposed Order
–
DST Rate Case
(4/1)
Procurement RFP
(bids accepted 5/2;
results 5/18)
DST Rate Case Final
Order (5/24)
EPA Final Toxics
Rule (November)
Retirement of Cromby
1 & Eddystone 1 units
(5/31)
Proposed Toxics Rule
(3/16)
Procurement RFP
(bids due 9/19;
results by 10/19)
Retirement of
Cromby 2 unit
(12/31)
Proposed 316(b) EPA
Regulation (3/28)
EPA Final Transport
Rule (June)
For definition of the EPA regulations referred to on this slide, please see the EPA’s Terms of
Environment (http://www.epa.gov/OCEPAterms/). |
  12
Exelon Generation Hedging Disclosures
(as of March 31, 2011) |
 Important Information
13
The following slides are intended to provide additional information regarding the hedging
program at Exelon Generation and to serve as an aid for the purposes of modeling Exelon
Generation’s gross margin (operating revenues less purchased power and fuel expense). The
information on the following slides is not intended to represent earnings guidance or a forecast
of future events. In fact, many of the factors that ultimately will determine Exelon
Generation’s actual gross margin are based upon highly variable market factors outside of
our control. The information on the following slides is as of March 31, 2011. We
update this information on a quarterly basis.
Certain information on the following slides is based upon an internal simulation model that
incorporates assumptions regarding future market conditions, including power and commodity
prices, heat rates, and demand conditions, in addition to operating performance and dispatch
characteristics of our generating fleet. Our simulation model and the assumptions therein are
subject to change. For example, actual market conditions and the dispatch profile of our
generation fleet in future periods will likely differ – and may differ significantly –
from the assumptions underlying the simulation results included in the slides. In addition,
the forward- looking information included in the following slides will likely change over time
due to continued refinement of our simulation model and changes in our views on future market
conditions. |
 Portfolio Management Objective
Align Hedging Activities with Financial Commitments
Power Team utilizes several product types
and channels to market
•
Wholesale and retail sales
•
Block products
•
Load-following products
and load auctions
•
Put/call options
Exelon’s hedging program is designed to
protect the long-term value of our
generating fleet and maintain an
investment-grade balance sheet
•
Hedge enough commodity risk to meet future cash
requirements if prices drop
•
Consider: financing policy (credit rating objectives,
capital structure, liquidity); spending (capital and
O&M); shareholder value return policy
Consider market, credit, operational risk
Approach to managing volatility
•
Increase hedging as delivery approaches
•
Have enough supply to meet peak load
•
Purchase fossil fuels as power is sold
•
Choose hedging products based on generation
portfolio
–
sell
what
we
own
•
Heat rate options
•
Fuel products
•
Capacity
•
Renewable credits
% Hedged
High End of Profit
Low End of Profit
Open Generation
with LT Contracts
Portfolio
Optimization
Portfolio
Management
Portfolio Management Over Time
14 |
 Percentage of Expected
Generation Hedged
•
How many equivalent MW have been
hedged at forward market prices; all hedge
products used are converted to an
equivalent average MW volume
•
Takes ALL
hedges into account whether
they are power sales or financial products
Equivalent MWs Sold
Expected Generation
=
Our normal practice is to hedge commodity risk on a ratable basis
over the three years leading to the spot market
•
Carry operational length into spot market to manage forced outage and
load-following risks
•
By
using
the
appropriate
product
mix,
expected
generation
hedged
approaches
the
mid-90s percentile as the delivery period approaches
•
Participation in larger procurement events, such as utility auctions, and some
flexibility in the timing of hedging may mean the hedge program is not
strictly ratable from quarter to quarter
Exelon Generation Hedging Program
15 |
 2011
2012
2013
Estimated Open Gross Margin ($ millions)
(1)(2)
$5,250
$4,900
$5,500
Open gross margin assumes all expected generation is sold
at the Reference Prices listed below
Reference Prices
(1)
Henry Hub Natural Gas ($/MMBtu)
NI-Hub ATC Energy Price ($/MWh)
PJM-W ATC Energy Price ($/MWh)
ERCOT
North
ATC
Spark
Spread
($/MWh)
(3)
$4.47
$31.32
$44.23
$4.42
$5.06
$31.32
$46.19
$1.88
$5.41
$32.83
$48.10
$2.06
Exelon Generation Open Gross Margin and
Reference Prices
16
(1)
Based on March 31, 2011 market conditions.
(2)
Gross margin is defined as operating revenues less fuel expense and purchased power expense, excluding
the impact of decommissioning and other incidental revenues. Open gross margin is estimated
based upon an internal model that is developed by dispatching our expected generation to current market power and fossil fuel prices.
Open gross margin assumes there is no hedging in place other than fixed assumptions for capacity
cleared in the RPM auctions and uranium costs for nuclear power plants. Open gross margin
contains assumptions for other gross margin line items such as various ISO bill and ancillary revenues and costs and PPA capacity revenues and
payments. The estimation of open gross margin incorporates management discretion and modeling
assumptions that are subject to change. (3)
ERCOT North ATC spark spread using Houston Ship Channel Gas, 7,200 heat rate, $2.50 variable O&M.
|
 2011
2012
2013
Expected Generation
(GWh)
(1)
165,800
165,400
162,800
Midwest
99,000
97,800
96,100
Mid-Atlantic
56,300
57,200
56,400
South & West
10,500
10,400
10,300
Percentage of Expected Generation Hedged
(2)
93-96%
73-76%
38-41%
Midwest
93-96
75-78
35-38
Mid-Atlantic
94-97
72-75
42-45
South & West
76-79
59-62
40-43
Effective Realized Energy Price
($/MWh)
(3)
Midwest
$43.00
$41.00
$41.00
Mid-Atlantic
$56.50
$50.50
$50.50
South & West
$4.50
$0.00
($3.00)
Generation Profile
17
(1)
Expected generation represents the amount of energy estimated to be generated or purchased through
owned or contracted for capacity. Expected generation is based upon a simulated dispatch
model that makes assumptions regarding future market conditions, which are calibrated to market quotes for power, fuel, load following products,
and options. Expected generation assumes 12 refueling outages in 2011 and 10 refueling outages in 2012
and 2013 at Exelon-operated nuclear plants and Salem. Expected generation assumes
capacity factors of 93.0%, 93.6% and 93.1% in 2011, 2012 and 2013 at Exelon-operated nuclear plants. These estimates of expected
generation in 2012 and 2013 do not represent guidance or a forecast of future results as Exelon has
not completed its planning or optimization processes for those years. (2)
Percent of expected generation hedged is the amount of equivalent sales divided by the expected
generation. Includes all hedging products, such as wholesale and retail sales of power,
options, and swaps. Uses expected value on options. Reflects decision to permanently retire Cromby Station and Eddystone Units 1&2 as of May 31, 2011.
(3)
Effective realized energy price is representative of an all-in hedged price, on a per MWh basis,
at which expected generation has been hedged. It is developed by considering the energy
revenues and costs associated with our hedges and by considering the fossil fuel that has been purchased to lock in margin. It excludes uranium
costs and RPM capacity revenue, but includes the mark-to-market value of capacity contracted
at prices other than RPM clearing prices including our load obligations. It can be
compared with the reference prices used to calculate open gross margin in order to determine the mark-to-market value of Exelon Generation's energy hedges. |
 Gross Margin Sensitivities with Existing Hedges ($ millions)
(1)
Henry Hub Natural Gas
+ $1/MMBtu
-
$1/MMBtu
NI-Hub ATC Energy Price
+$5/MWH
-$5/MWH
PJM-W ATC Energy Price
+$5/MWH
-$5/MWH
Nuclear Capacity Factor
+1% / -1%
2011
$5
$(5)
$15
$(10)
$10
$(10)
+/-
$30
2012
$145
$(65)
$145
$(125)
$90
$(90)
+/-
$45
2013
$425
$(380)
$315
$(310)
$180
$(175)
+/-
$45
Exelon Generation Gross Margin Sensitivities
(with Existing Hedges)
(1)
Based on March 31, 2011 market conditions and hedged position. Gas price
sensitivities are based on an assumed gas-power relationship derived from an internal
model that is updated periodically.
Power prices sensitivities are derived by adjusting the power price assumption
while keeping all other prices inputs constant. Due to
correlation
of
the
various
assumptions,
the
hedged
gross
margin
impact
calculated
by
aggregating
individual
sensitivities
may
not be equal to the hedged
gross margin impact calculated when correlations between the various assumptions
are also considered. 18 |
  95%
case 5% case
$5,500
$7,100
$6,800
$6,200
Exelon Generation Gross Margin Upside / Risk
(with Existing Hedges)
$3,000
$4,000
$5,000
$6,000
$7,000
$8,000
$9,000
2011
2012
2013
$6,900
$4,900
19
(1)
Represents an approximate range of expected gross margin, taking into account hedges in place, between
the 5th and 95th percent confidence levels assuming all unhedged supply is sold into the spot
market. Approximate gross margin ranges are based upon an internal simulation model and are subject to change based upon market
inputs, future transactions and potential modeling changes. These ranges of approximate gross margin
in 2012 and 2013 do not represent earnings guidance or a forecast of future results as Exelon
has not completed its planning or optimization processes for those years. The price distributions that generate this range are calibrated to market
quotes for power, fuel, load following products, and options as of March 31, 2011.
|
 Midwest
Mid-Atlantic
South & West
Step 1
Start
with
fleetwide
open
gross
margin
$5.25 billion
Step 2
99,000GWh * 94% *
($43.00/MWh-$31.32MWh)
= $1.09 billion
56,300GWh * 95% *
($56.50/MWh-$44.23MWh)
= $0.66 billion
10,500GWh * 77% *
($4.50/MWh-$4.42/MWh)
= $0.00 billion
Step 3
Open gross
margin:
MTM
value
of
energy
hedges:
Estimated hedged gross margin:
Illustrative Example
of Modeling Exelon Generation 2011 Gross Margin
(with Existing Hedges)
20
Determine the mark-to-market value of
energy hedges
Estimate hedged gross margin by
adding open gross margin to mark-to-
market value of energy hedges
$5.25 billion
$1.09billion
+
$0.66billion
+
$0.00
billion
$7.00 billion |
 Market Price Snapshot
Forward NYMEX Natural Gas
PJM-West and Ni-Hub On-Peak Forward Prices
PJM-West and Ni-Hub Wrap Forward Prices
2012
$5.21
2013 $5.49
Forward NYMEX Coal
2012
$78.21
2013
$82.04
2012 Ni-Hub $40.60
2013 Ni-Hub
$42.66
2013 PJM-West $54.37
2012 PJM-West
$52.35
2012 Ni-Hub
$25.18
2013 Ni-Hub
$27.24
2013 PJM-West
$40.97
2012 PJM-West
$39.03
21
Rolling
12
months,
as
of
May
6th
2011.
Source:
OTC
quotes
and
electronic
trading
system.
Quotes
are
daily. |
 Market Price Snapshot
2013
9.36
2012
9.23
2012
$46.94
2013
$50.23
2012
$5.09
2013
$5.37
Houston Ship Channel Natural Gas
Forward Prices
ERCOT North On-Peak Forward Prices
ERCOT North On-Peak v. Houston Ship Channel
Implied Heat Rate
2012
$7.72
2013
$9.00
ERCOT North On Peak Spark Spread
Assumes a 7.2 Heat Rate, $1.50 O&M, and $.15 adder
Rolling
12
months,
as
of
May
6th
2011.
Source:
OTC
quotes
and
electronic
trading
system.
Quotes
are
daily.
22 |