Attached files
| file | filename |
|---|---|
| 8-K - FORM 8-K - GRAHAM CORP | l42805e8vk.htm |
Exhibit 99.1

| Supplemental Slides Fourth Quarter Fiscal 2011 Earnings Call PUTTING OUR BRAND TO WORK 1 NYSE Amex: GHM 1 |
| Safe Harbor Statement This presentation contains forward-looking statements within the meaning of Section 27A of the Securities Act of 1933, as amended, and Section 21E of the Securities Exchange Act of 1934, as amended. Forward-looking statements are subject to risks, uncertainties and assumptions and are identified by words such as "expects," "estimates," "projects," "anticipates," "believes," "could," and other similar words. All statements addressing operating performance, events, or developments that Graham Corporation expects or anticipates will occur in the future, including but not limited to, statements relating to anticipated revenue, the timing of conversion of backlog to sales, profit margins, foreign sales operations, its strategy to build its global sales representative channel, the effectiveness of automation in expanding its engineering capacity, its ability to improve cost competitiveness, customer preferences, changes in market conditions in the industries in which it operates, changes in general economic conditions and customer behavior and its acquisition strategy are forward-looking statements. Because they are forward-looking, they should be evaluated in light of important risk factors and uncertainties. These risk factors and uncertainties are more fully described in Graham Corporation's most recent Annual and Quarterly Reports filed with the Securities and Exchange Commission, including under the heading entitled "Risk Factors." Should one or more of these risks or uncertainties materialize, or should any of Graham Corporation's underlying assumptions prove incorrect, actual results may vary materially from those currently anticipated. In addition, undue reliance should not be placed on Graham Corporation's forward-looking statements. Except as required by law, Graham Corporation disclaims any obligation to update or publicly announce any revisions to any of the forward-looking statements contained in this presentation. 2 |
| Jim Lines President and Chief Executive Officer PUTTING OUR BRAND TO WORK NYSE Amex: GHM |
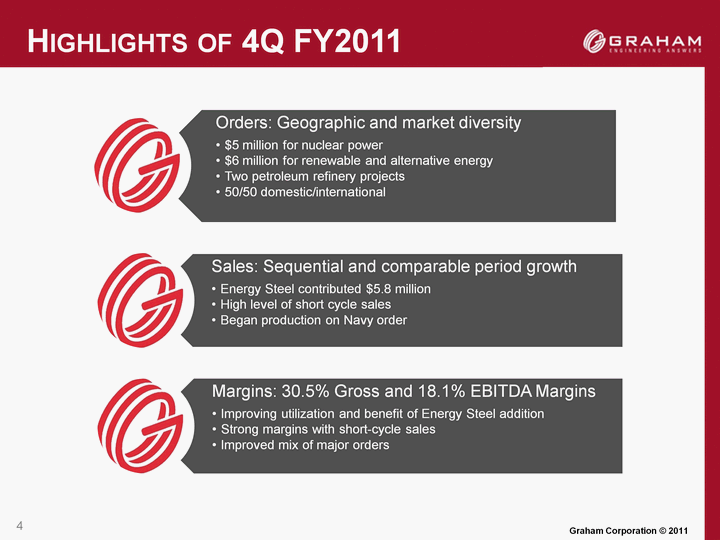
| 4 Highlights of 4Q FY2011 |
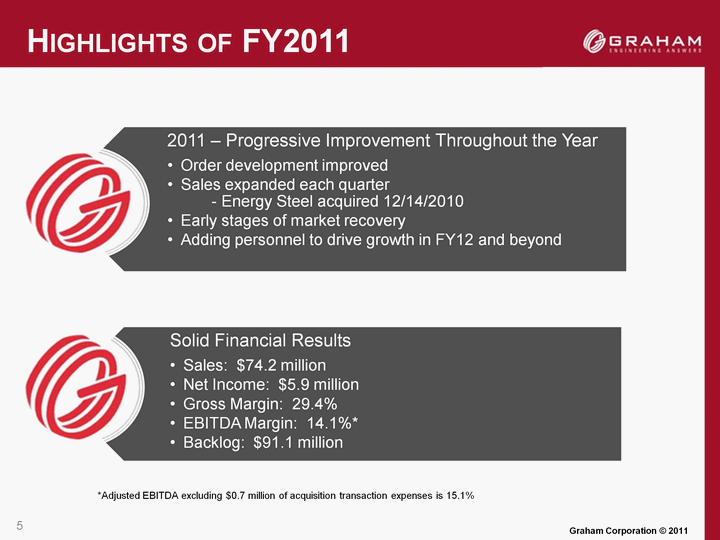
| 5 Highlights of FY2011 *Adjusted EBITDA excluding $0.7 million of acquisition transaction expenses is 15.1% |
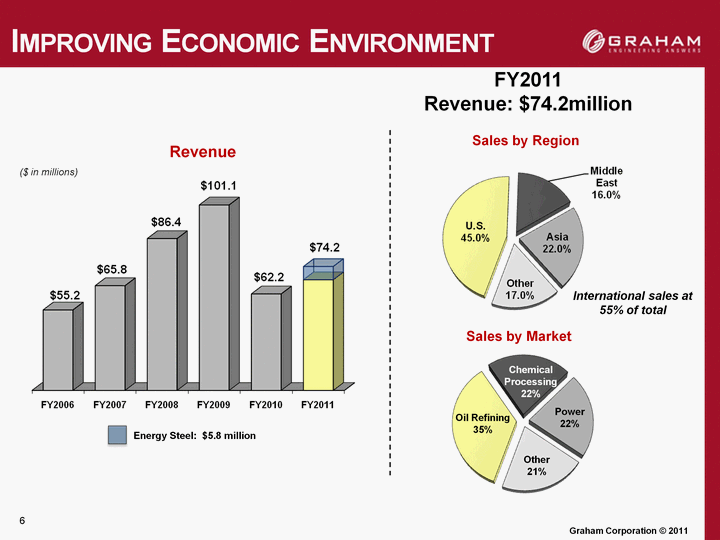
| Improving Economic Environment Sales by Region International sales at 55% of total 6 Sales by Market Oil Refining 35% Chemical Processing 22% Power 22% Other 21% FY2011 Revenue: $74.2million Revenue ($ in millions) Energy Steel: $5.8 million |
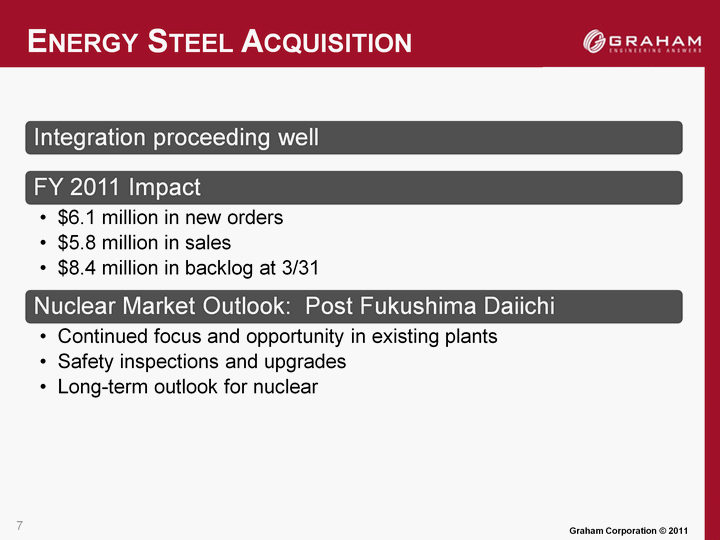
| 7 Energy Steel Acquisition |
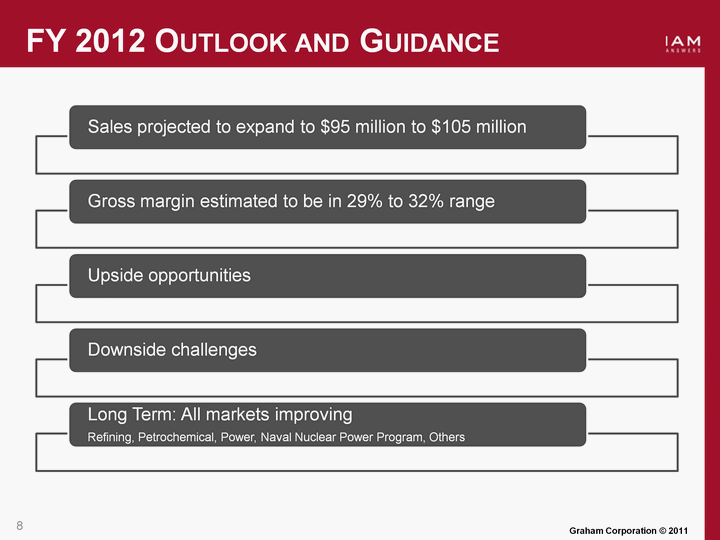
| FY 2012 Outlook and Guidance 8 8 |
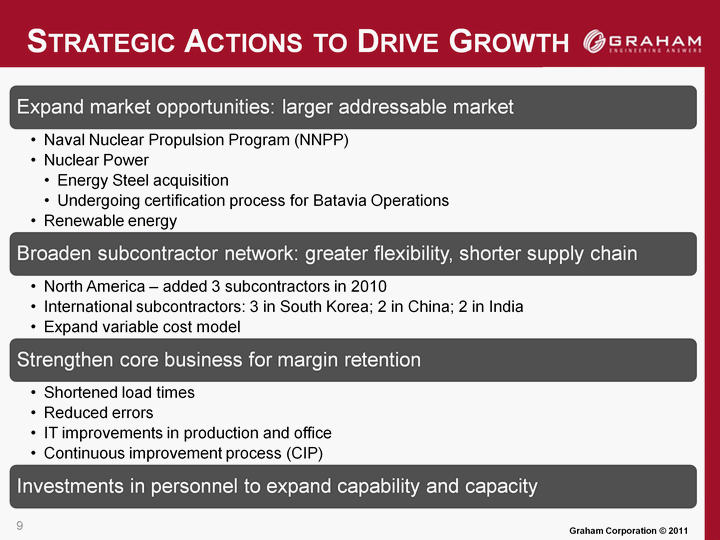
| 9 Strategic Actions to Drive Growth |
| Jeff Glajch Vice President and Chief Financial Officer PUTTING OUR BRAND TO WORK NYSE Amex: GHM |
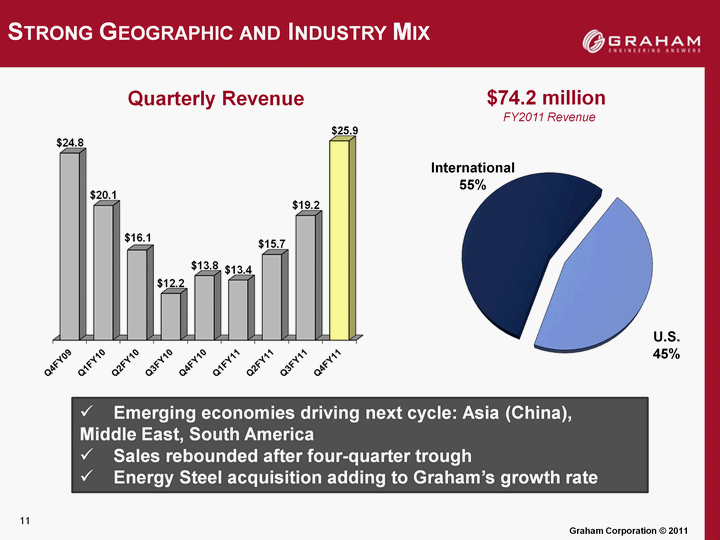
| Strong Geographic and Industry Mix 11 Emerging economies driving next cycle: Asia (China), Middle East, South America Sales rebounded after four-quarter trough Energy Steel acquisition adding to Graham's growth rate Quarterly Revenue International 55% U.S. 45% $74.2 million FY2011 Revenue $25.9 |
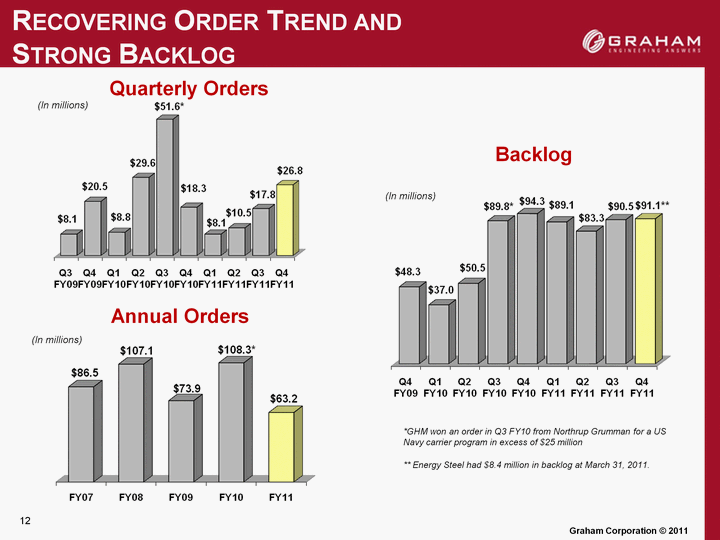
| Recovering Order Trend and Strong Backlog *GHM won an order in Q3 FY10 from Northrup Grumman for a US Navy carrier program in excess of $25 million ** Energy Steel had $8.4 million in backlog at March 31, 2011. 12 Backlog (In millions) Quarterly Orders Annual Orders (In millions) (In millions) |
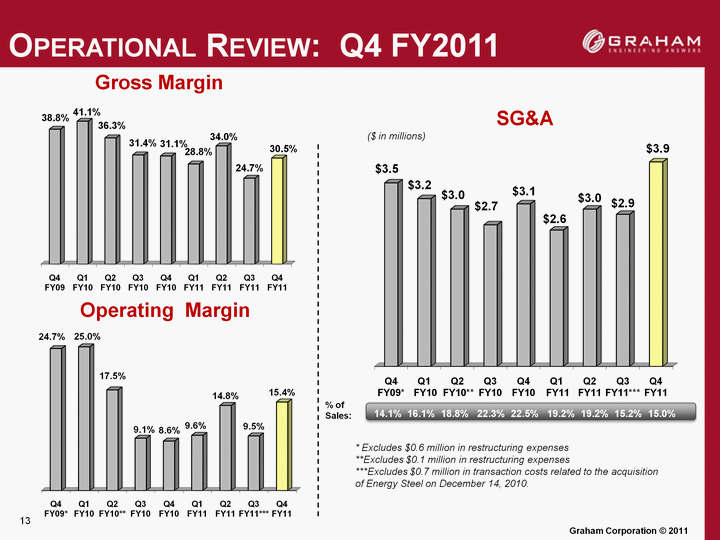
| (CHART) (CHART) (CHART) Operational Review: Q4 FY2011 SG&A 13 Gross Margin Operating Margin ($ in millions) * Excludes $0.6 million in restructuring expenses **Excludes $0.1 million in restructuring expenses ***Excludes $0.7 million in transaction costs related to the acquisition of Energy Steel on December 14, 2010. % of Sales: |
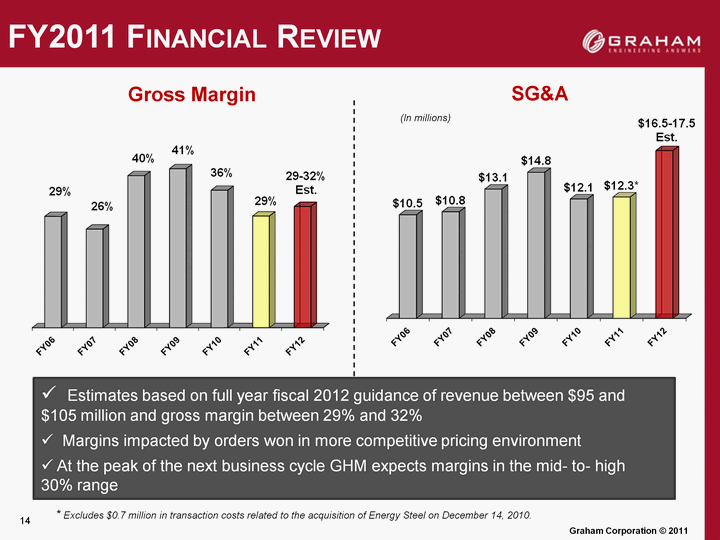
| FY2011 Financial Review 14 Estimates based on full year fiscal 2012 guidance of revenue between $95 and $105 million and gross margin between 29% and 32% Margins impacted by orders won in more competitive pricing environment At the peak of the next business cycle GHM expects margins in the mid- to- high 30% range Gross Margin SG&A (In millions) * Excludes $0.7 million in transaction costs related to the acquisition of Energy Steel on December 14, 2010. |
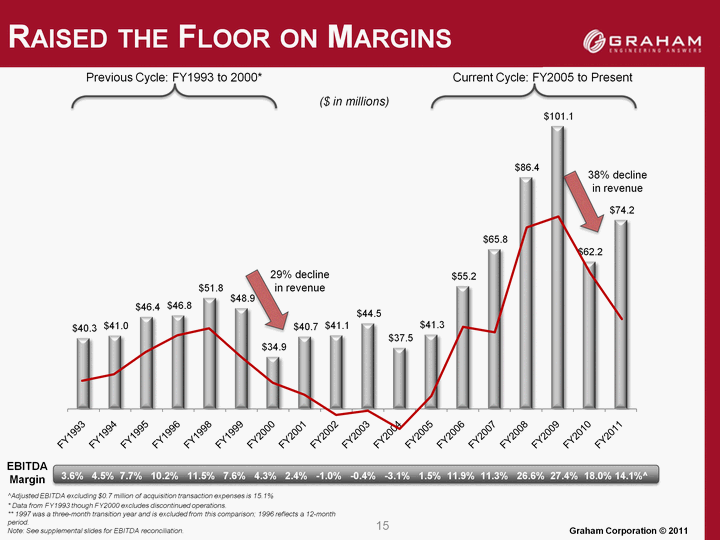
| (CHART) (CHART) ($ in millions) Previous Cycle: FY1993 to 2000* Current Cycle: FY2005 to Present * Data from FY1993 though FY2000 excludes discontinued operations. ** 1997 was a three-month transition year and is excluded from this comparison; 1996 reflects a 12-month period. Note: See supplemental slides for EBITDA reconciliation. EBITDA Margin 15 Raised the Floor on Margins 3.6% 4.5% 7.7% 10.2% 11.5% 7.6% 4.3% 2.4% -1.0% -0.4% -3.1% 1.5% 11.9% 11.3% 26.6% 27.4% 18.0% 14.1%^ 38% decline in revenue 29% decline in revenue ^Adjusted EBITDA excluding $0.7 million of acquisition transaction expenses is 15.1% |
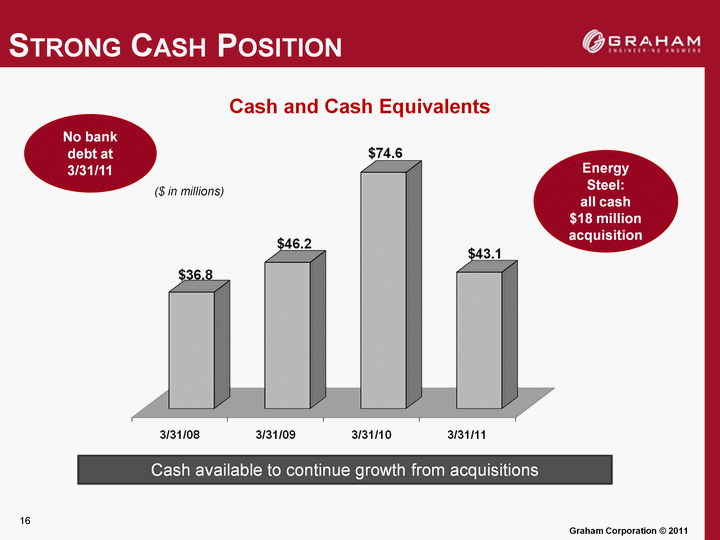
| ($ in millions) Strong Cash Position Cash and Cash Equivalents No bank debt at 3/31/11 16 Cash available to continue growth from acquisitions Energy Steel: all cash $18 million acquisition |

| Supplemental Slides Fourth Quarter Fiscal 2011 Earnings Call PUTTING OUR BRAND TO WORK 17 NYSE Amex: GHM 17 |
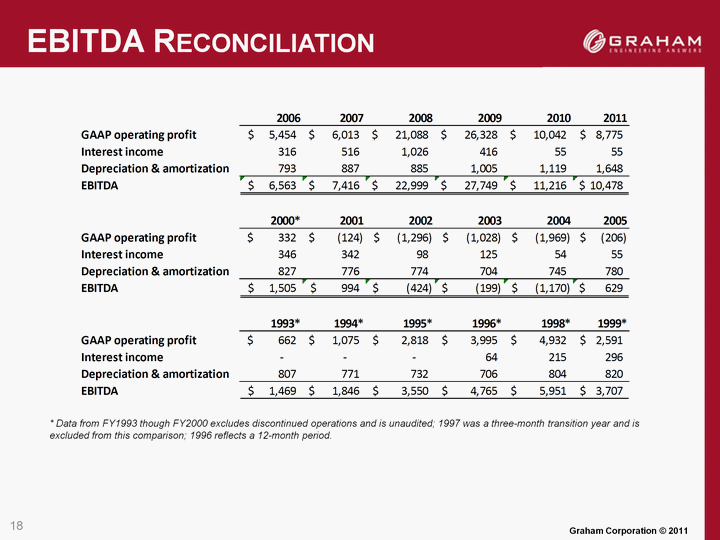
| EBITDA Reconciliation * Data from FY1993 though FY2000 excludes discontinued operations and is unaudited; 1997 was a three-month transition year and is excluded from this comparison; 1996 reflects a 12-month period. 18 |