Attached files
| file | filename |
|---|---|
| EX-99.1 - EX-99.1 - Novelis Inc. | g27376exv99w1.htm |
| 8-K - FORM 8-K - Novelis Inc. | g27376e8vk.htm |
Exhibit 99.2
| Novelis Fourth Quarter & Fiscal Year End 2011 Earnings Conference Call Philip Martens President and Chief Executive Officer Steve Fisher Senior Vice President and Chief Financial Officer Brighter Ideas with Aluminum May 26, 2011 |
| Forward-Looking Statements Statements made in this presentation which describe Novelis' intentions, expectations, beliefs or predictions may be forward-looking statements within the meaning of securities laws. Forward-looking statements include statements preceded by, followed by, or including the words "believes," "expects," "anticipates," "plans," "estimates," "projects," "forecasts," or similar expressions. Examples of such statements in this presentation are our target Adjusted EBITDA for fiscal 2012 our projections for aluminum flat rolled products demand, expected capital costs associated with planned expansion activities, and anticipated increases to our production capacity from our strategic initiatives. Novelis cautions that, by their nature, forward- looking statements involve risk and uncertainty and that Novelis' actual results could differ materially from those expressed or implied in such statements. We do not intend, and we disclaim any obligation, to update any forward-looking statements, whether as a result of new information, future events or otherwise. Factors that could cause actual results or outcomes to differ from the results expressed or implied by forward-looking statements include, among other things: changes in the prices and availability of aluminum (or premiums associated with such prices) or other materials and raw materials we use; the capacity and effectiveness of our metal hedging activities, including our internal used beverage cans (UBCs) and smelter hedges; relationships with, and financial and operating conditions of, our customers, suppliers and other stakeholders; fluctuations in the supply of, and prices for, energy in the areas in which we maintain production facilities; our ability to access financing for future capital requirements; changes in the relative values of various currencies and the effectiveness of our currency hedging activities; factors affecting our operations, such as litigation, environmental remediation and clean-up costs, labor relations and negotiations, breakdown of equipment and other events; the impact of restructuring efforts in the future; economic, regulatory and political factors within the countries in which we operate or sell our products, including changes in duties or tariffs; competition from other aluminum rolled products producers as well as from substitute materials such as steel, glass, plastic and composite materials; changes in general economic conditions including deterioration in the global economy, particularly sectors in which our customers operate; changes in the fair value of derivative instruments; cyclical demand and pricing within the principal markets for our products as well as seasonality in certain of our customers' industries; changes in government regulations, particularly those affecting taxes, environmental, health or safety compliance; changes in interest rates that have the effect of increasing the amounts we pay under our principal credit agreement and other financing agreements; the effect of taxes and changes in tax rates; and our indebtedness and our ability to generate cash. The above list of factors is not exhaustive. Other important risk factors included under the caption "Risk Factors" in our Annual Report on Form 10-K for the fiscal year ended March 31, 2011 are specifically incorporated by reference into this presentation. Non-GAAP Financial Measures This presentation contains non-GAAP financial measures as defined by SEC rules. We think that these measures are helpful to investors in measuring our financial performance and liquidity and comparing our performance to our peers. However, our non-GAAP financial measures may not be comparable to similarly titled non-GAAP financial measures used by other companies. These non-GAAP financial measures have limitations as an analytical tool and should not be considered in isolation or as a substitute for GAAP financial measures. We have included reconciliations of each of these measures to the most directly comparable GAAP measure. In addition, a more detailed description of these non-GAAP financial measures used in this presentation, together with a discussion of the usefulness and purpose of such measures, is included as Exhibit 99.2 to our Current Report on Form 8-K furnished to the SEC with our earnings press release. Safe Harbor Statement |
| DETAILED FINANCIAL PERFORMANCE NOVELIS STRATEGY QUESTIONS AND ANSWERS FY 2011 FINANCIAL HIGHLIGHTS Agenda |

| Fiscal 2011 Highlights Exceeded Goal of $1B in Adjusted EBITDA in FY11 Strong Global Demand Driving Near 100% Capacity Closed FY11 with Record Financial Results: Net Sales Up 22% vs. FY10 to $10.6 Billion Shipments Up 10% vs. FY10 to 2,969 Kilotonnes Record Adjusted EBITDA Up 42% vs. FY10 to $1.1 Billion Net Income of $116 Million Strong Liquidity of $1.1 Billion Solid Free Cash Flow of $310 Million Successfully Completed $4.8 Billion Refinancing |
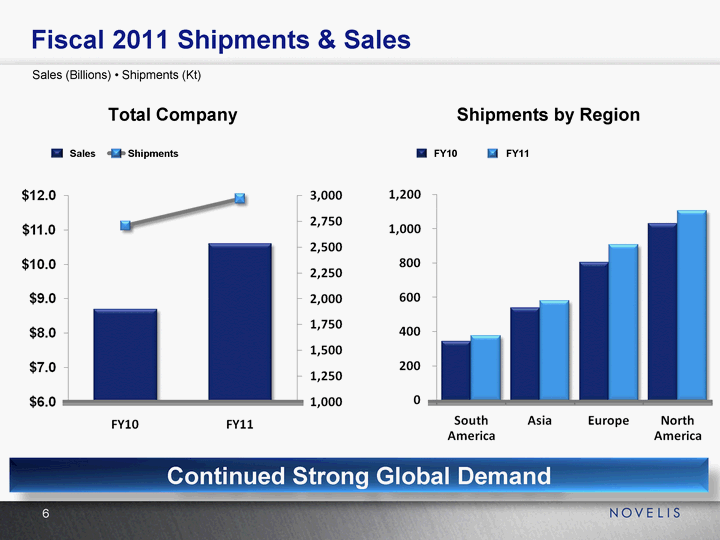
| Fiscal 2011 Shipments & Sales Shipments by Region Total Company Sales (Billions) • Shipments (Kt) Continued Strong Global Demand Sales FY10 |
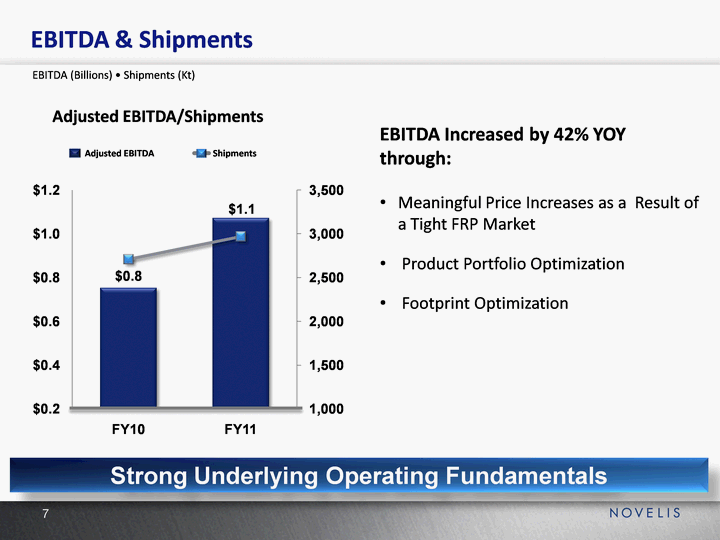
| Adjusted EBITDA/Shipments EBITDA & Shipments Strong Underlying Operating Fundamentals EBITDA (Billions) • Shipments (Kt) Shipments Adjusted EBITDA EBITDA Increased by 42% YOY through: Meaningful Price Increases as a Result of a Tight FRP Market Product Portfolio Optimization Footprint Optimization |
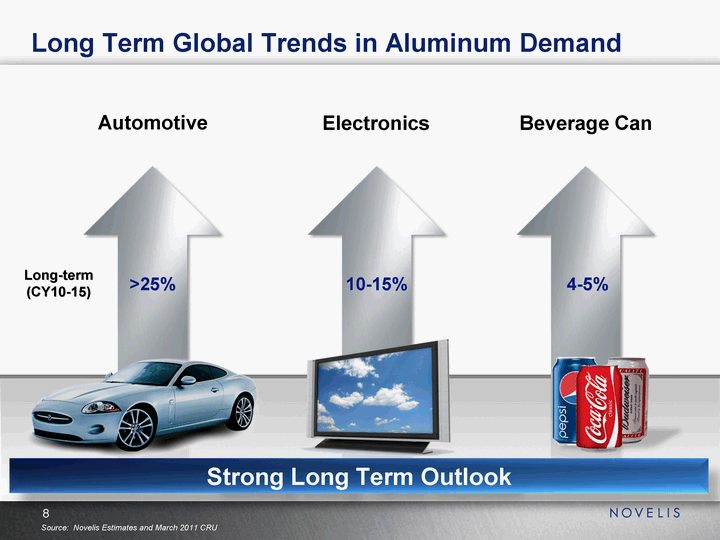
| Source: Novelis Estimates and March 2011 CRU Long Term Global Trends in Aluminum Demand Electronics Beverage Can Automotive Long-term (CY10-15) >25% 10-15% 4-5% Strong Long Term Outlook |
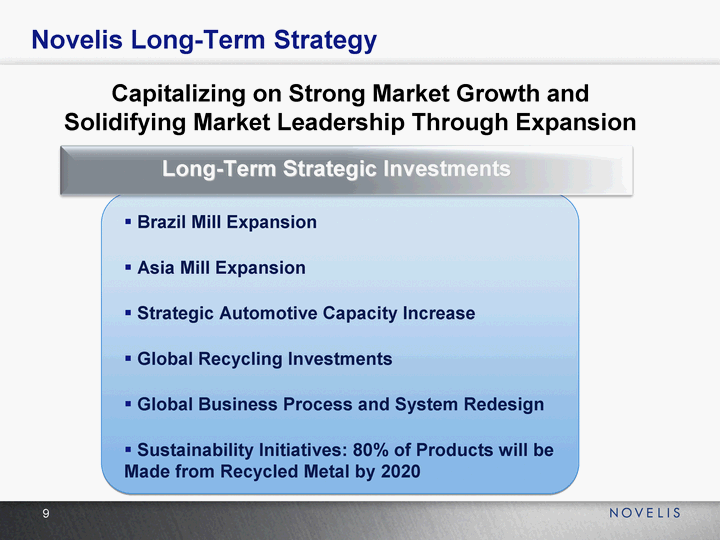
| Capitalizing on Strong Market Growth and Solidifying Market Leadership Through Expansion Novelis Long-Term Strategy Long-Term Strategic Investments Brazil Mill Expansion Asia Mill Expansion Strategic Automotive Capacity Increase Global Recycling Investments Global Business Process and System Redesign Sustainability Initiatives: 80% of Products will be Made from Recycled Metal by 2020 |
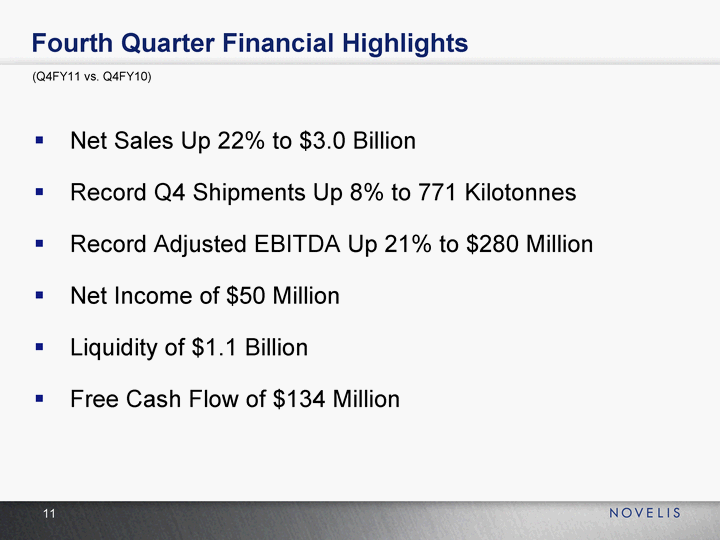
| Fourth Quarter Financial Highlights (Q4FY11 vs. Q4FY10) Net Sales Up 22% to $3.0 Billion Record Q4 Shipments Up 8% to 771 Kilotonnes Record Adjusted EBITDA Up 21% to $280 Million Net Income of $50 Million Liquidity of $1.1 Billion Free Cash Flow of $134 Million |
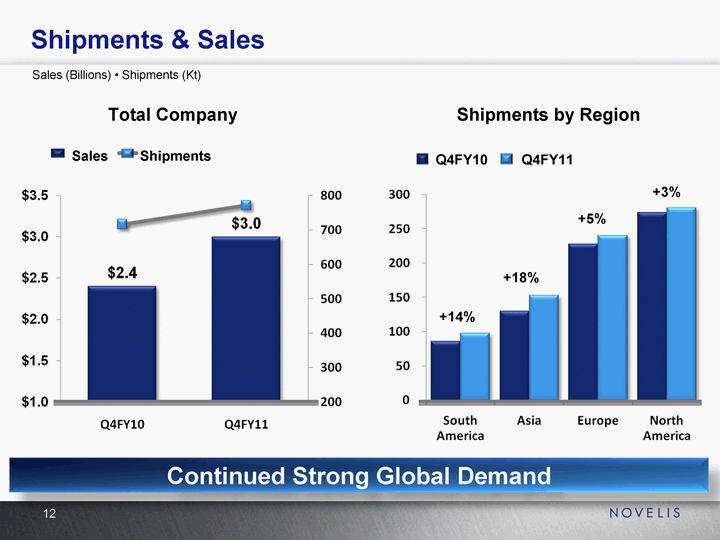
| Shipments & Sales Shipments by Region Total Company Sales (Billions) • Shipments (Kt) Continued Strong Global Demand Sales Q4FY10 +14% +18% +5% +3% |
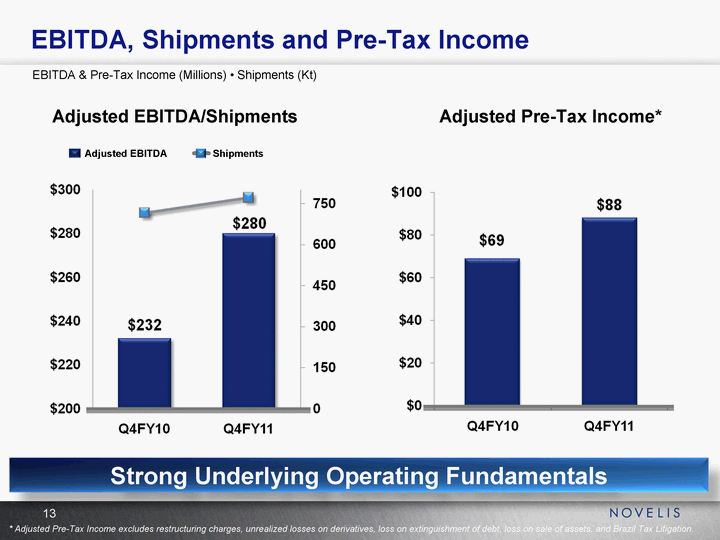
| Adjusted EBITDA/Shipments Adjusted Pre-Tax Income* EBITDA, Shipments and Pre-Tax Income Strong Underlying Operating Fundamentals EBITDA & Pre-Tax Income (Millions) • Shipments (Kt) Shipments Adjusted EBITDA * Adjusted Pre-Tax Income excludes restructuring charges, unrealized losses on derivatives, loss on extinguishment of debt, loss on sale of assets, and Brazil Tax Litigation. |
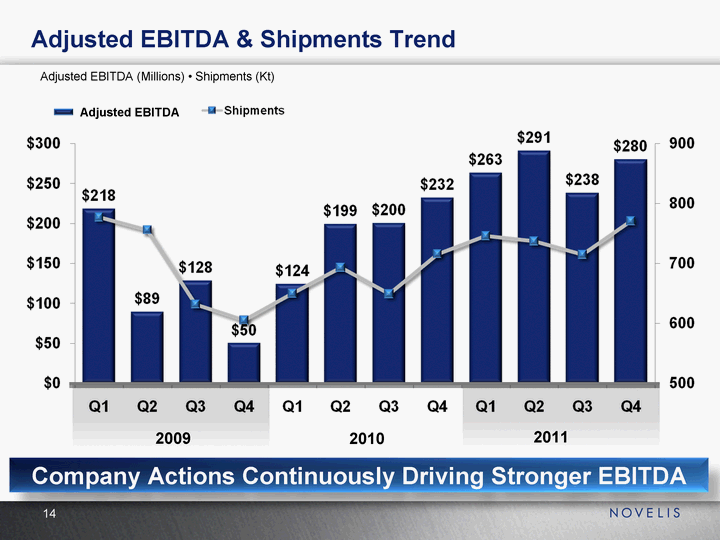
| 2009 2011 Adjusted EBITDA & Shipments Trend Adjusted EBITDA (Millions) • Shipments (Kt) Company Actions Continuously Driving Stronger EBITDA Adjusted EBITDA 2010 |
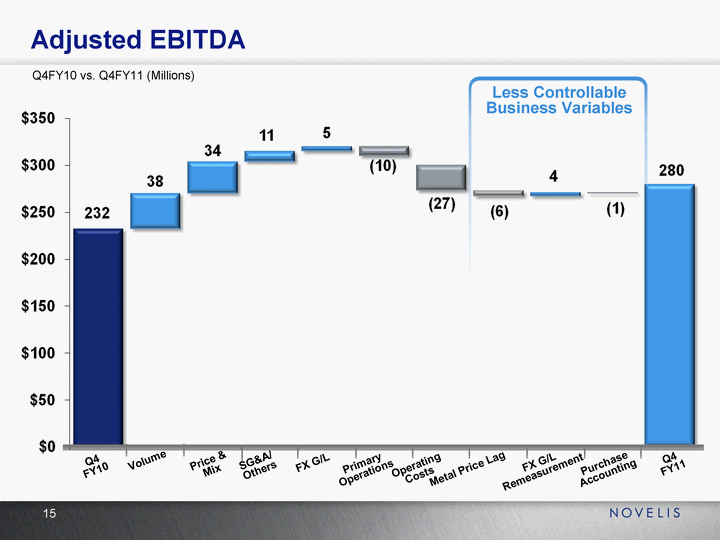
| Less Controllable Business Variables Q4 FY10 Volume Price & Mix Operating Costs SG&A/ Others FX G/L Primary Operations Metal Price Lag FX G/L Remeasurement Purchase Accounting Q4 FY11 Adjusted EBITDA Q4FY10 vs. Q4FY11 (Millions) |
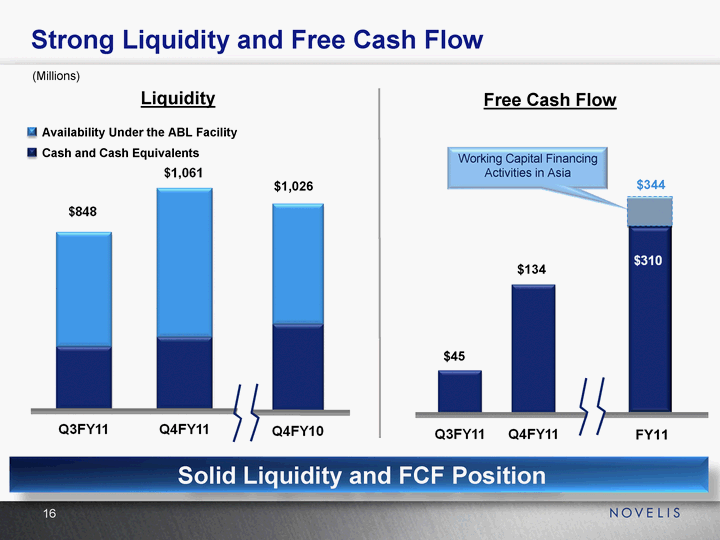
| (Millions) Solid Liquidity and FCF Position Strong Liquidity and Free Cash Flow Availability Under the ABL Facility $1,026 Liquidity Free Cash Flow Working Capital Financing Activities in Asia $344 FY11 $134 $45 |
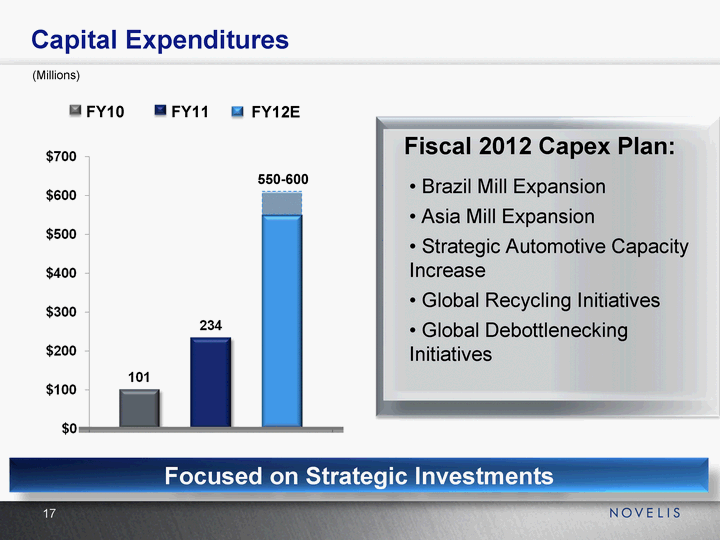
| (Millions) Capital Expenditures Focused on Strategic Investments Fiscal 2012 Capex Plan: Brazil Mill Expansion Asia Mill Expansion Strategic Automotive Capacity Increase Global Recycling Initiatives Global Debottlenecking Initiatives FY11 FY12E 550-600 |
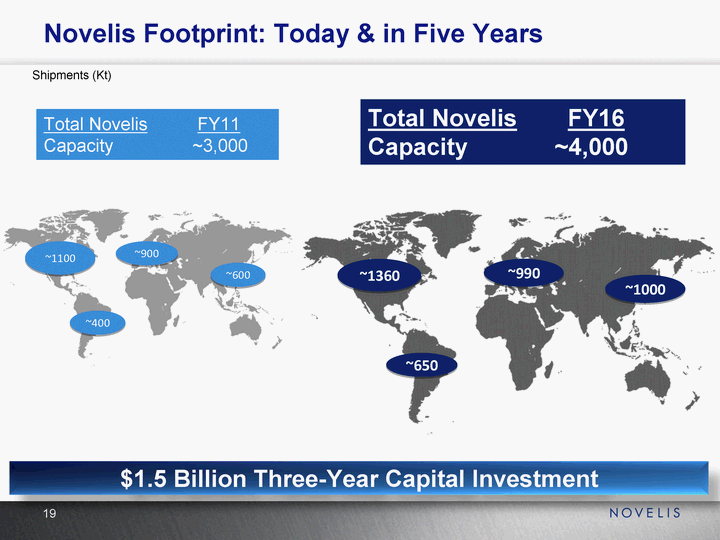
| Novelis Footprint: Today & in Five Years $1.5 Billion Three-Year Capital Investment Total Novelis FY11 Capacity ~3,000 Total Novelis FY16 Capacity ~4,000 ~650 ~1360 ~990 ~1100 ~400 ~900 ~600 ~1000 Shipments (Kt) |
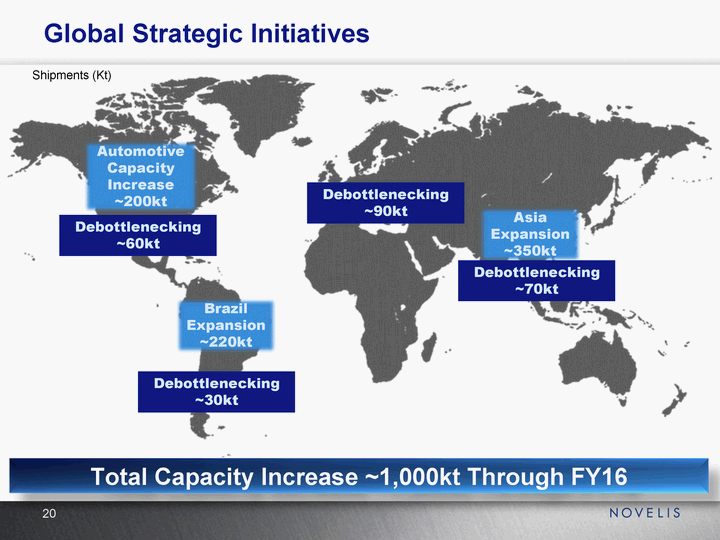
| Global Strategic Initiatives Total Capacity Increase ~1,000kt Through FY16 Asia Expansion ~350kt Brazil Expansion ~220kt Debottlenecking ~60kt Debottlenecking ~30kt Debottlenecking ~90kt Debottlenecking ~70kt Automotive Capacity Increase ~200kt Shipments (Kt) |
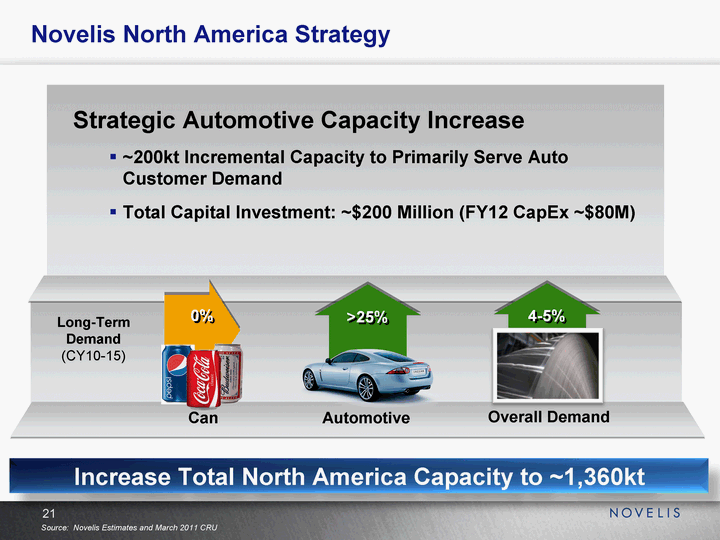
| Novelis North America Strategy Automotive Can Overall Demand >25% 0% 4-5% Strategic Automotive Capacity Increase ~200kt Incremental Capacity to Primarily Serve Auto Customer Demand Total Capital Investment: ~$200 Million (FY12 CapEx ~$80M) Increase Total North America Capacity to ~1,360kt Long-Term Demand (CY10-15) Source: Novelis Estimates and March 2011 CRU |
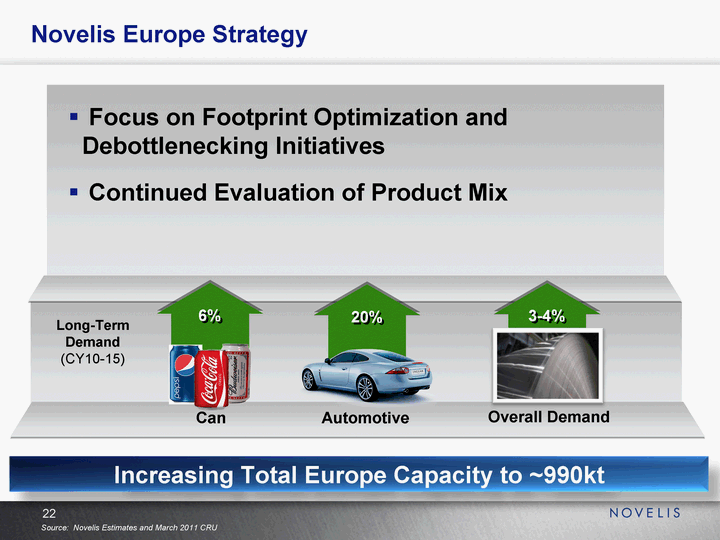
| Novelis Europe Strategy Focus on Footprint Optimization and Debottlenecking Initiatives Continued Evaluation of Product Mix Increasing Total Europe Capacity to ~990kt Automotive Can Overall Demand 20% 6% 3-4% Long-Term Demand (CY10-15) Source: Novelis Estimates and March 2011 CRU |
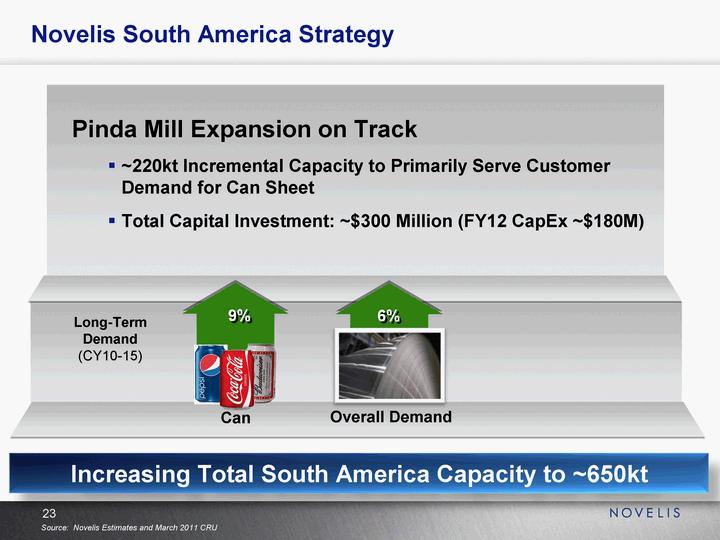
| Novelis South America Strategy Can Overall Demand 9% 6% Long-Term Demand (CY10-15) Pinda Mill Expansion on Track ~220kt Incremental Capacity to Primarily Serve Customer Demand for Can Sheet Total Capital Investment: ~$300 Million (FY12 CapEx ~$180M) Increasing Total South America Capacity to ~650kt Source: Novelis Estimates and March 2011 CRU |
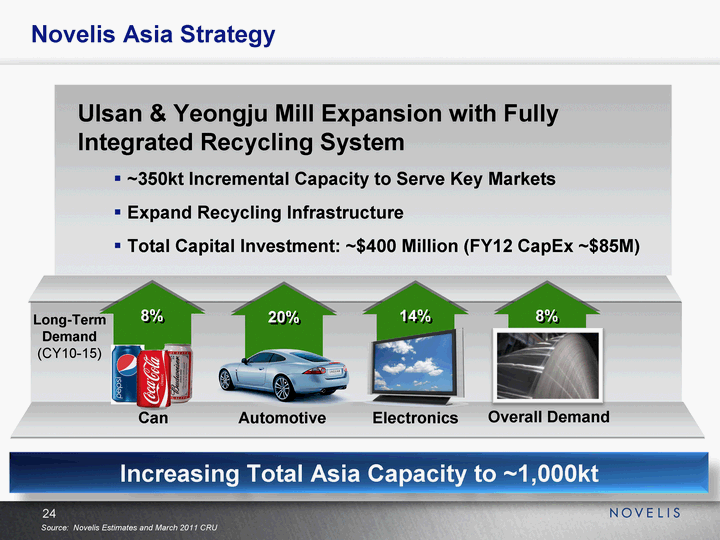
| Novelis Asia Strategy Electronics Automotive Can Overall Demand 20% 8% 8% Long-Term Demand (CY10-15) 14% Ulsan & Yeongju Mill Expansion with Fully Integrated Recycling System ~350kt Incremental Capacity to Serve Key Markets Expand Recycling Infrastructure Total Capital Investment: ~$400 Million (FY12 CapEx ~$85M) Increasing Total Asia Capacity to ~1,000kt Source: Novelis Estimates and March 2011 CRU |
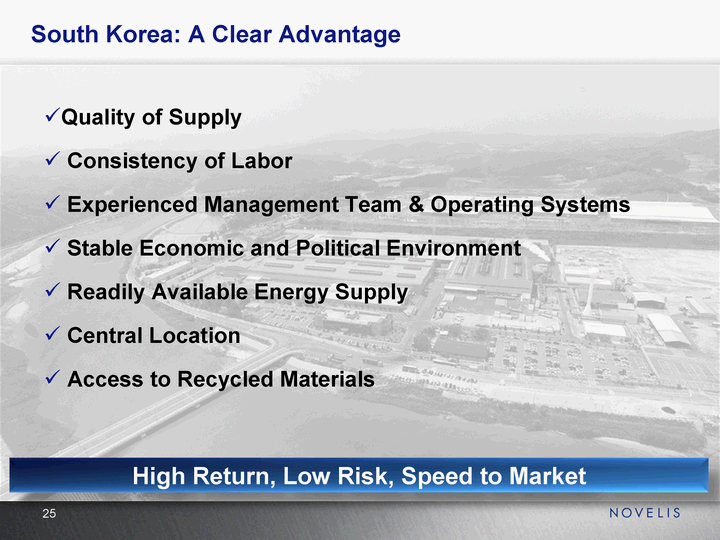
| South Korea: A Clear Advantage Quality of Supply Consistency of Labor Experienced Management Team & Operating Systems Stable Economic and Political Environment Readily Available Energy Supply Central Location Access to Recycled Materials High Return, Low Risk, Speed to Market |
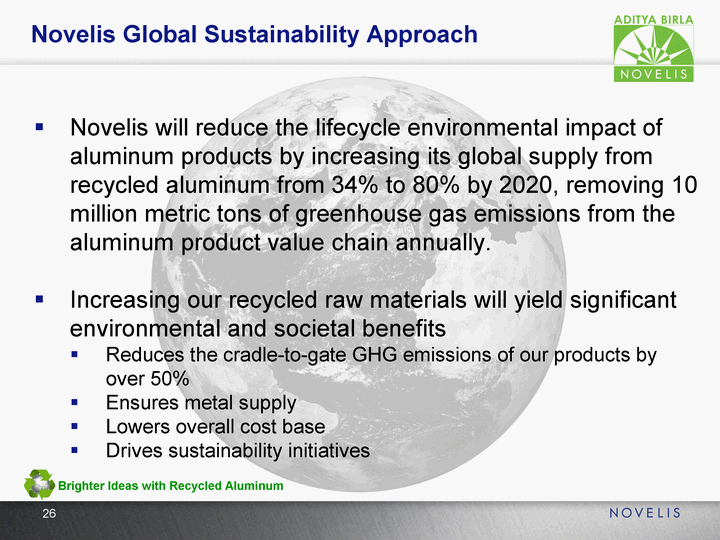
| Novelis Global Sustainability Approach Novelis will reduce the lifecycle environmental impact of aluminum products by increasing its global supply from recycled aluminum from 34% to 80% by 2020, removing 10 million metric tons of greenhouse gas emissions from the aluminum product value chain annually. Increasing our recycled raw materials will yield significant environmental and societal benefits Reduces the cradle-to-gate GHG emissions of our products by over 50% Ensures metal supply Lowers overall cost base Drives sustainability initiatives Brighter Ideas with Recycled Aluminum |
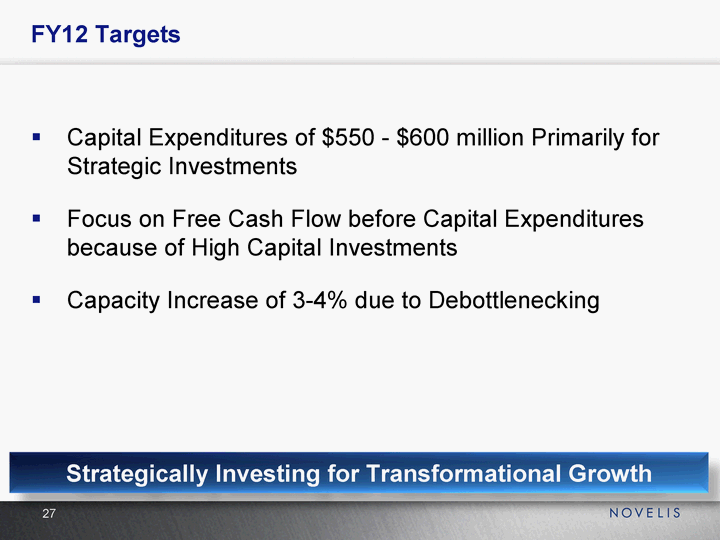
| FY12 Targets Capital Expenditures of $550 - $600 million Primarily for Strategic Investments Focus on Free Cash Flow before Capital Expenditures because of High Capital Investments Capacity Increase of 3-4% due to Debottlenecking Strategically Investing for Transformational Growth |

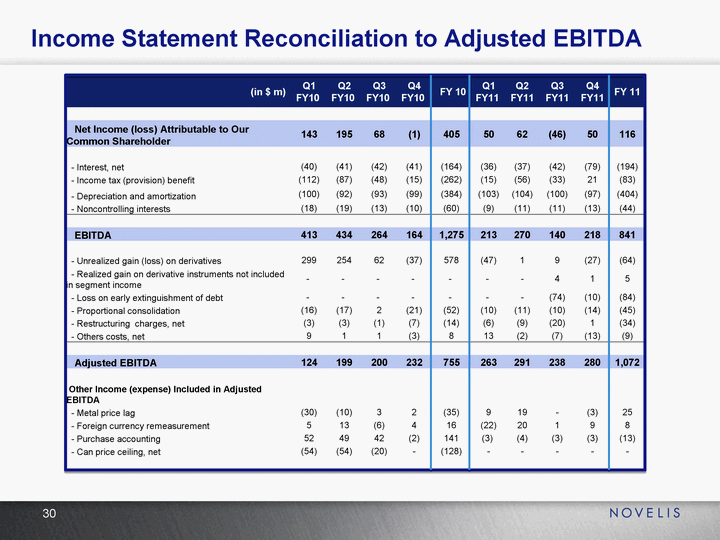
| (in $ m) Q1 FY10 Q2 FY10 Q3 FY10 Q4 FY10 FY 10 Q1 FY11 Q2 FY11 Q3 FY11 Q4 FY11 FY 11 Net Income (loss) Attributable to Our Common Shareholder 143 195 68 (1) 405 50 62 (46) 50 116 - Interest, net (40) (41) (42) (41) (164) (36) (37) (42) (79) (194) - Income tax (provision) benefit (112) (87) (48) (15) (262) (15) (56) (33) 21 (83) - Depreciation and amortization (100) (92) (93) (99) (384) (103) (104) (100) (97) (404) - Noncontrolling interests (18) (19) (13) (10) (60) (9) (11) (11) (13) (44) EBITDA 413 434 264 164 1,275 213 270 140 218 841 - Unrealized gain (loss) on derivatives 299 254 62 (37) 578 (47) 1 9 (27) (64) - Realized gain on derivative instruments not included in segment income - - - - - - - 4 1 5 - Loss on early extinguishment of debt - - - - - - - (74) (10) (84) - Proportional consolidation (16) (17) 2 (21) (52) (10) (11) (10) (14) (45) - Restructuring charges, net (3) (3) (1) (7) (14) (6) (9) (20) 1 (34) - Others costs, net 9 1 1 (3) 8 13 (2) (7) (13) (9) Adjusted EBITDA 124 199 200 232 755 263 291 238 280 1,072 Other Income (expense) Included in Adjusted EBITDA - Metal price lag (30) (10) 3 2 (35) 9 19 - (3) 25 - Foreign currency remeasurement 5 13 (6) 4 16 (22) 20 1 9 8 - Purchase accounting 52 49 42 (2) 141 (3) (4) (3) (3) (13) - Can price ceiling, net (54) (54) (20) - (128) - - - - - Income Statement Reconciliation to Adjusted EBITDA |
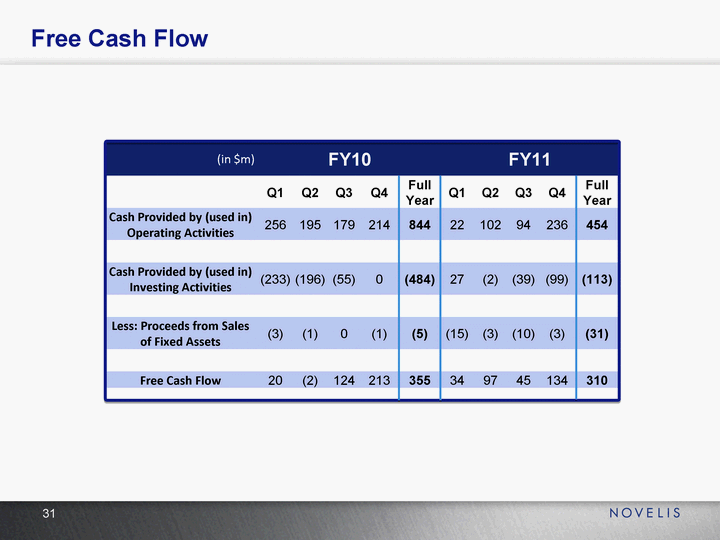
| (in $m) FY10 FY10 FY10 FY10 FY10 FY11 FY11 FY11 FY11 FY11 Q1 Q2 Q3 Q4 Full Year Q1 Q2 Q3 Q4 Full Year Cash Provided by (used in) Operating Activities 256 195 179 214 844 22 102 94 236 454 Cash Provided by (used in) Investing Activities (233) (196) (55) 0 (484) 27 (2) (39) (99) (113) Less: Proceeds from Sales of Fixed Assets (3) (1) 0 (1) (5) (15) (3) (10) (3) (31) Free Cash Flow 20 (2) 124 213 355 34 97 45 134 310 Free Cash Flow |
| Explanation of Other Income (Expenses) Included in our Adjusted EBITDA 1) Metal Price Lag Net of Related Hedges: On certain sales contracts we experience timing differences on the pass through of changing aluminum prices from our suppliers to our customers. Additional timing differences occur in the flow of metal costs through moving average inventory cost values and cost of goods sold. This timing difference is referred to as Metal Price Lag. We have a risk management program in place to minimize impact of this "lag". 2) Foreign Currency Remeasurement Net of Related Hedges: All non-functional currency denominated Working Capital and Debt gets remeasured every period by the period end exchange rates. This impacts our profitability. Like Metal Price Lag, we have a risk management program in place to minimize impact of such Remeasurement. 3) Purchase Accounting: Following our acquisition, the consideration and transaction costs paid by Hindalco in connection with the transaction were "pushed down" to us and were allocated to the assets acquired and the liabilities assumed. These allocations are amortized over periods, impacting our profitability. A significant portion of such amortizations pertain to ceiling contracts. 4) Can Price Ceilings: Some sales contracts contained a ceiling over which metal prices could not be contractually passed through to certain customers. This negatively impacted our margins and cash flows when the price we paid for metal was above the ceiling price contained in these contracts. These contracts expired December 31, 2009. |