Attached files
| file | filename |
|---|---|
| 8-K - CURRENT REPORT OF MATERIAL EVENTS OR CORPORATE CHANGES - CUBIC ENERGY INC | a11-13227_18k.htm |
Exhibit 99.1
|
|
NYSE Amex: QBC www.CubicEnergyInc.com May 25, 2011 Annual Shareholder Meeting Management Presentation |
|
|
2 Calvin A. Wallen III has served as the President and Chief Executive Officer of the Company since 1997. Mr. Wallen has over 30 years of experience in the oil and gas industry working as a drilling and petroleum engineer, including tours with Superior Oil, Resource Drilling, Tom Brown and Rowan International. Mr. Wallen has considerable experience in drilling vertical, high-angle directional and horizontal wells in North and South American oil and gas fields, as well as in the North Sea and Gulf of Mexico. Mr. Wallen did his undergraduate engineering studies at Texas A&M. Larry Badgley has been Chief Financial Officer for Cubic since October, 2008. Prior to joining Cubic, Mr. Badgley worked over 11 years in the venture capital market and has been responsible for Financial Planning and Analysis, SEC, SOX technical training and practice development, and served as the national practice leader for merger and acquisitions with a heavy focus on due diligence and post acquisition integration. Larry Badgley received a BBA in Finance from Hardin-Simmons University in 1978, and is a Certified Public Accountant. Jon S. Ross has served in the office of Secretary of Cubic Energy since 1998. Mr. Ross is a practicing attorney in Dallas, Texas representing over 80 business entities. He has served on several community and non-profit committees and boards and has been asked to speak to corporate and civic leaders on a variety of corporate law topics. Mr. Ross graduated from St. Mark's School of Texas with honors in 1982 and graduated from the University of Texas at Austin in 1986 with a B.B.A. in Accounting. He then graduated from the University of Texas School of Law in 1989 attaining a Juris Doctorate degree. Richard M. Sepulvado has been the chief exploration geologist for Cubic Energy, Inc. since 1997 and serves as Vice President of Exploration and Production. He received his undergraduate training at Trinity University, earning his Bachelor’s degree in geology in 1974. Mr. Sepulvado spent the following eight years developing strong management and engineering skills as an officer in the U.S. Army Corps of Engineers. Following his tour of duty, he returned to school and earned his Master of Science Degree in Geology at Louisiana Tech University in 1985. Mr. Sepulvado has worked as an exploration geologist for Mobil Oil, Placid Oil, Phillips Oil, and various independent oil companies. Management Team |
|
|
Company Snapshot Acreage located in Caddo Parish & DeSoto Parish of northwest Louisiana: Cotton Valley acreage approx 24,000 gross/5,400 net Haynesville & Bossier acreage approx 21, 760 gross/4,236 net. Cubic’s acreage position is in the core of the Haynesville Shale, North America’s most economic and prolific natural gas shale play. All acreage is 100% Held By Production (HBP) Resource Potential (Bcf/BOE): 44 Bcf / 2.00 MMBOE – Cotton Valley 276 Bcf / 12.26 MMBOE – Haynesville Shale Cubic’s Current Net Horizontal Haynesville Shale Production: 225,000 Mcf per month / 9,990 BOE per month Shares Haynesville Shale Ownership with: Joint Venture with EXCO Operating Company LP and BG Group Chesapeake Energy Corp. Goodrich Petroleum Company El Paso Current Haynesville Shale Well Activity: 20 Gross Haynesville Shale wells now on-stream Producing 1 Gross Haynesville Shale well Waiting on Completion 3 = Cubic’s Haynesville Shale Acreage Position in Caddo Parish and Desoto Parish, Louisiana Bcf = Billion Cubic Feet Mcf = Million Cubic Feet BOE = Barrels of Oil Equivalent (using $4 gas and $90 oil) MMBOE = Million Barrels of Oil Equivalent |
|
|
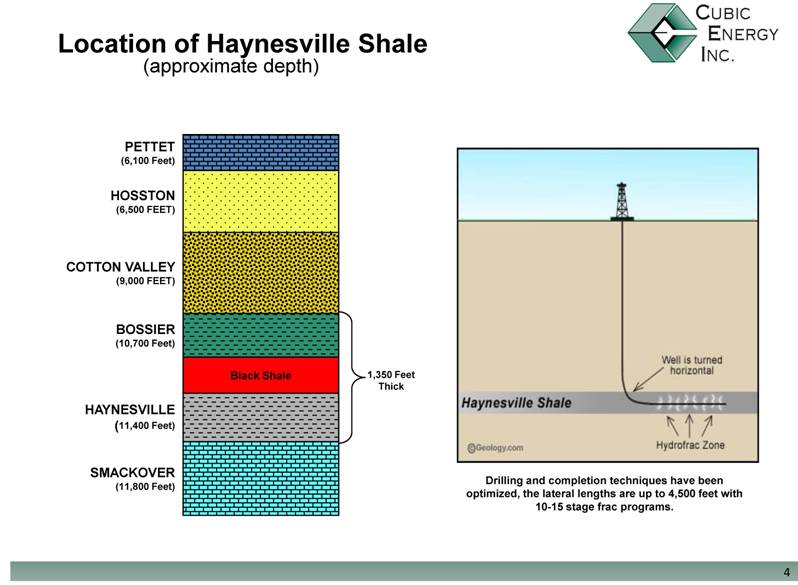
Location of Haynesville Shale 4 SMACKOVER (11,800 Feet) HAYNESVILLE (11,400 Feet) Black Shale BOSSIER (10,700 Feet) COTTON VALLEY (9,000 FEET) HOSSTON (6,500 FEET) PETTET (6,100 Feet) (approximate depth) Drilling and completion techniques have been optimized, the lateral lengths are up to 4,500 feet with 10-15 stage frac programs. 1,350 Feet Thick |
|
|
5 Haynesville Shale Resource Potential Cubic has 300 gross / 54 net drilling locations... with an Estimated Ultimate Recovery (EUR) of 6.5 Bcf / .29 MMBOE per well and an average 79% NRI, we estimate our Haynesville Shale Resource Potential at over 276 Bcf / 12.26MMBOE. Bossier Shale Other operators have announced plans to further test the Bossier Shale. While we will refrain from quantifying the resource potential from the Bossier Shale for now, it could add meaningful reserves and production. 14.26 MMBOE 320 Bcf Total Resource Potential 2.0 MMBOE 44 Bcf Horizontal Cotton Valley ???? ???? Bossier Shale 12.26 MMBOE 276 Bcf Haynesville Shale Total Proved + Resource Potential 12.26 MMBOE 276 Bcf Haynesville Shale 79% NRI % 289 MBOE 6.5 Bcf EUR Per Well (BCF) 54 Net Drilling Locations Haynesville Shale Proven Plus Resource Potential Note: Both SEC reserve report and SPE reserve report are based on 4.4 Bcf EUR/well **Society of Petroleum Engineers (SPE) reserve report based on four Horizontal Haynesville Shale wells per unit and is used for Banking & Financial Institutions *Securities and Exchange Commission (SEC) reserve report is based on predominantly one Horizontal Haynesville Shale well per unit and is used for Audited Financial of Public Companies $193M 4.09 MMBOE 92 Bcf **SPE Proven (PDP, PDNP, PUD) Reserves as of June 30, 2010 $65M 1.3 MMBOE 30 Bcf *SEC Proven (PDP, PDNP, PUD) Reserves as of June 30, 2010 PV10 Value BOE Bcf Cubic's Proven Reserves NRI Reserves RESOURCE POTENTIAL (Bcf / BOE) Bcf = Billion Cubic Feet BOE = Barrels of Oil Equivalent (using $4 gas and $90 oil) MMBOE = Million Barrels of Oil Equivalent |
|
|
6 Resource Value of Recoverable Gas per Share Price Analysis EUR = Estimated Ultimate Recovery $2 Million due to related party $35 Million due to Wells Fargo (3) $ 52,000,000 Total Development Costs $ 6,500,000 $$/well 8 #wells 5,500,000 5.5 EUR (2) $ 405,000,000 Total Development Costs $ 7,500,000 $$/well 54 #wells 6,500,000 6.5 EUR (1) $ 7.59 103,603,157 Valuation Per Share - fully diluted $ 10.23 76,815,908 Valuation Per Share - basic $ 786,000,000 Valuation $ (37,000,000) (3) Total Debt $ 823,000,000 Total Value $ (457,000,000) Total Development Costs $ (52,000,000) Cotton Valley Development Costs $ (405,000,000) Haynesville Development Costs $ 1,280,000,000 Total Revenue $ 4.00 Price/MCF 320,000,000 Total Resource Gas Recoverable 44,000,000 (2) Cotton Valley 44 BCF : 5.5 EUR 276,000,000 (1) Haynesville 276 BCF : 6.5 EUR |
|
|
7 Capital Table Cubic has the liquidity required to fund its share of capital expenditures. Strategic Transaction in 2009 Cubic swapped QBC Common and Preferred Stock priced at a premium and without warrant coverage, and a small override, with an affiliate to acquire $30.9 million of Drilling Credits from EXCO Operating Company LP. Positioned For Haynesville Driven Growth $31.6 million current liquidity available for Capital Expenditures. $ 31.6 CURRENT LIQUIDITY $ 19.1 Drilling Credit $ 2.5 Working Capital $ 10.0 Funds Available on Revolver (30.0) Less: Drawn 30.0 Borrowing Base $ 40.0 Senior Credit Facility FUNDS AVAILABLE FOR CAPITAL EXPENDITURES $ 21.6 Total Working Capital & Drilling Credit - Warrant Proceeds 19.1 Drilling Credit $ 2.5 Working Capital Working Capital & Drilling Credit $ 37.0 Total Debt 2.0 Other 5.0 Term Loan $ 30.0 Revolver Total Debt 03/31/2011 ($MM) |
|
|
Horizontal Haynesville Well Status Summary 8 09/27/10 EXCO 29.0% Red Oak Timber 7-1 ALT P) TD Date Operator Working Interest Well Name WAITING ON COMPLETION 1,033 15,301 02/01/09 Chesapeake 1.4% Clingman Acres 12H U) 458 14,751 11/08/08 Chesapeake 6.1% Soaring Ridge 15H T) 7,764 11,538 12/21/10 EXCO 32.5% Crow 5-1 ALT S) 5,797 8,764 12/28/10 El Paso 0.6% Fisher 20 1H R) n/a 14,136 3/18/2011 Chesapeake 4.4% Burford 21-14-15H Q) n/a 11,170 12/21/10 EXCO 24.0% Crow 8-1 O) 4,139 10,328 07/15/10 EXCO 37.0% Thomas 36-1 N) 5183 13,346 9/21/2010 Chesapeake 0.6% Slaughter 6-15-15H M) 4,508 12,288 09/07/10 Chesapeake 0.7% Western D 18H L) 2,408 15,938 03/14/10 Goodrich 6.3% Garland 24-1H K) 2,028 10,750 04/13/10 Chesapeake 1.1% Saddler 9H J) 829 4,390 03/07/10 EXCO 35.0% Red Oak Timber 6-1 I) 1,866 14,520 12/21/09 Chesapeake 2.4% SLRT 33H H) 2,294 15,134 10/20/09 Goodrich 10.2% Plants 26-1H G) 5,037 16,757 01/25/10 Chesapeake 4.6% Muslow 5H F) 2,340 18,826 11/10/09 Goodrich 10.2% Garland 25-1H E) 1,493 10,487 05/12/09 Chesapeake 5.0% Clingman Acres 2H D) 1,135 10,656 05/30/09 Chesapeake 1.5% Woolworth 15H C) 911 8,112 04/02/09 Chesapeake 2.2% Mitchell 12H B) 1,476 17,040 02/20/09 Chesapeake 2.5% Clingman Acres 11H A) Current Rate MCF/D IP Rate MCF/D IP Date Operator Working Interest Well Name |
|
|
Horizontal Cotton Valley Wells in Surrounding Area 9 Company posting 44 Bcf / 2.00 MMBOE Cotton Valley potential developed horizontally in Bethany Longstreet ONLY. However, will monitor Indigo well results for Johnson Branch. Indigo Minerals Walton 23 H-1 Alt Section 23, T15N-R15W Well Status: Waiting on Completion Goodrich Petroleum (two wells in same section) Champe Graham 3-Alt Section 14, T14N-R16W IP Rate: 3,824 MCF/D Champe Graham 5-Alt Section 14, T14N-R16W IP Rate: 1,948 MCF/D |
|
|
Cubic Is Financially Prepared To Move Forward The drilling credit plus cash flow from operators should carry Cubic for most of its capital expenditures in calendar 2011, with capacity under the revolver filling the remaining gap, if needed. By the end of calendar 2011 we expect to have enough wells online to meaningfully increase the borrowing base on our Senior Facility, enabling us to fill any remaining gaps in our capital budget. Cubic has created significant liquidity well below market cost to the Company via its Drilling Credit with EXCO and its Credit Facility with Wells Fargo Energy Capital. Depending on the drilling program utilized by the primary operator on our acreage, production could average 15-25 MMcf/day in FY 2012 – up from less than 1 MMcf/day in FY 2009. 30-day initial production rates have climbed from 4-6 MMcf/day in early 2008 to 8-12 MMcf/day through 2009. In 2010, wells reported 24 hour flow rates in excess of 20 MMcf/day and 30 day initial production rates between 10-15 MMcf/day on a control flow basis. We estimate our Type Well will generate returns exceeding 20% at $4.00 NYMEX. FREE CASH FLOW ANALYSIS: ONE HAYNESVILLE SHALE WELL NET TO CUBIC 10 $2,654,443 0 79,200 $2,733,643 $4.00 643,210 Year 1 $3,780,060 Free Cash Flow 0 Prod. Taxes - .075% - 2yr waiver 79,200 LOE - $6,600/mo. $3,859,260 Revenue $6.00 Natural Gas Price 643,210 Mcf/Year Year 1 |
|
|
11 Statement of Operations Quarter over Quarter and Year over Year Growth $702,392 $367,885 $252,905 EBITDA 21% 35% 6% General and administrative expenses 34% 49% 46% Oil and gas production, operating and development costs Operating Costs and Expenses: 139% 152% 124% Oil and gas sales Revenues: YTD 2011-2010 3rd Qtr-o-Qtr 2011 - 2010 2nd Qtr-o-Qtr 2011 - 2010 |
|
|
12 Ownership (as of 03-31-11) 8.69% 9 Calvin A. Wallen III - Preferred stock, if-converted 8.20% 8.5 Wells Fargo Energy Capital - Warrants 74.13% 76.8 Outstanding Common Shares 100.0% 103.6 Fully-Diluted Shares 4.15% 4.3 Other Warrants (includes affiliates and 5% owners) 4.83% 5 Wells Fargo Energy Capital - Convertible Term Loan 32.53% 33.7 Public Float 38.80% 40.2 Officers and Directors (8) 2.80% 2.9 5% Owners % of F-D Shares Shares (millions) |
|
|
13 Natural Gas News Events May 24, 2011: First US LNG export project receives DOE approval..... with other projects in the queue.... Cheniere Energy has received approval to export 2.2 Bcf per day of domestic gas volumes from its Sabine Pass LNG Terminal. Over 7.4 Bcf per day of US liquefaction capacity could come online by 2016. Southern Union and BG submitted a joint application to construct a 2 Bcf per day liquefaction facility at Lake Charles. Freeport LNG submitted and application to construct a 1.4 Bcf per day terminal. Other projects under consideration include a 1.8 Bcf per day facility at Cove Point, Maryland and a plant at Jordon Cove, Oregon with unquantified capacity. May 9, 2011: BG, Southern Union Apply for LNG Export Permit for Louisiana BG and Southern Union Co. set up a joint venture and applied for permission from the U.S. government to export liquefied natural gas (LNG and plan to ship LNG from a gas terminal facility in Lake Charles, Louisiana and the companies will need to modify the terminal to have a capacity to liquefy about 2 billion cubic feet a day. This project is one of nine North American LNG export projects awaiting approval from regulators. April 6, 2011: Clean Energy Supports Proposed Federal Legislation that Would Expand the Use of Natural Gas Fuel for Transportation and Increase Natural Vehicle Deployment in America The Nat Gas Act of 2011, a bill introduced to the U.S. House of Representatives would provide increased support for the critical movement to deploy large numbers of natural gas vehicles in the U.S. April 5, 2011: Heckmann Corporation Teams Up with Encana Natural Gas Inc., Westport Innovations Inc. and Peterbilt Motors Company to Employ the Largest Transport Fleet of Liquefied Natural Gas Powered Trucks in North America Heckmann Corporation places single largest order for liquefied natural gas trucks by a U.S. customer (200) First major exploration and production company’s supply chain transition to natural gas NGV fleet to reduce Heckmann Water Resources’ carbon footprint in Haynesville Shale area by up to 30% and dramatically reduce fuel cost April 4, 2011: EXCO Resources, Inc. Announces Redetermination of Borrowing Base and Other Changes to Credit Agreement Lenders under its revolving credit agreement completed their regular semi-annual redetermination of the borrowing base, resulting in an increase of the borrowing base from $1.0 billion to $1.5 billion. March 30, 2011: The White House Blueprint for a Secure Energy Future This 44 page document outlines a three part strategy: 1. Develop and Secure America’s Energy Supplies. 2. Provide Consumers with Choices to Reduce Costs and Save Energy. 3. Innovate our Way to a Clean Energy Future. March 30, 2011: President Obama Speaks at Georgetown University – Securing America’s Energy Future Excerpts from President Obama’s speech: “And today, I want to announce a new goal, one that is reasonable , one that is achievable, and one that is necessary. When I was elected to this office, America imported 11 million barrels of oil a day. By a little more than a decade from now, we will have cut that by one-third. That is something we can achieve. We can cut our oil dependence – we can cut our oil dependence........... by a third.” “....So the only way for America’s energy supply to be truly secure is by permanently reducing our dependence on oilthe potential for natural gas is enormous. And this is an area where there’s actually been some broad bipartisan agreement. Last year, more than 150 members of Congress from both sides of the aisle produced legislation providing incentives to use clean-burning natural gas in our vehicles instead of oil. And that’s a big deal.” NOTE: Each of the above mentioned news events can be found in their entirety on Cubic’s website located at: www.CubicEnergyInc.com and click on the Presentation tab in the header. |
|
|
14 Disclaimer This presentation material contains forward-looking statements within the meaning of Section 27A of the Securities Act of 1933, as amended, and Section 21E of the Securities Exchange Act of 1934, as amended. The opinions, forecasts, projections or other statements, other than statements of historical fact, are forward-looking statements. Although Cubic Energy Inc. (the “Company”) believes that the expectations reflected in such forward-looking statements are reasonable, they do involve a number of risks and uncertainties. Among the important factors that could cause actual results to differ materially from those indicated by such forward-looking statements are delays and difficulties in developing currently owned properties, the failure of exploratory drilling to result in commercial wells, delays due to the limited availability of drilling equipment and personnel, the availability of capital, fluctuations in oil and gas prices, dependency on third party operators, sufficient pipeline capacity, general economic conditions and the other risk factors detailed in the Company’s Annual Report on Form 10-K for the fiscal year ending June 30, 2010, filed with the Securities and Exchange Commission. NYSE Amex: QBC Website: www.CubicEnergyInc.com 9870 Plano Road, Dallas, TX 75238 Phone: 972-686-0369 Donna Luedtke, Investor Relations Email: donna@cubicenergyinc.com |