Attached files
| file | filename |
|---|---|
| 8-K - 8-K - Bridge Capital Holdings | v224288_8k.htm |
|
Daniel P. Myers
|
Allan C. Kramer, M.D.
|
|
President
|
Chairman
|
|
Chief Executive Officer
|
10th Annual Shareholders Meeting
May 26, 2011
Forward Looking Statements
Certain matters discussed herein constitute forward -looking statements within the meaning of the Private Securities Litigation Reform Act of 1995, and are subject to the safe harbors created by that Act. Forward -looking statements describe future plans, strategies, and expectations, and are based on currently available information, expectations, assumptions, projections, and management's judgment about the Bank, the banking industry and general economic conditions . These forward looking statements are subject to certain risks and uncertainties that could cause the actual results, performance or achievements to differ materially from those expressed, suggested or implied by the forward looking statements . These risks and uncertainties include, but are not limited to: (1) competitive pressures in the banking industry; (2) changes in interest rate environment; (3) general economic conditions, nationally, regionally, and in operating markets; (4) changes in the regulatory environment; (5) changes in business conditions and inflation; (6) changes in securities markets; (7) future credit loss experience; (8) the ability to satisfy requirements related to the Sarbanes -Oxley Act and other regulation on internal control; (9) civil disturbances or terrorist threats or acts, or apprehension about the possible future occurrences of acts of this type; and (10) the involvement of the United States in war or other hostilities . The reader should refer to the more complete discussion of such risks in Bridge Capital Holdings reports on Forms 10-K and 10-Q on file with the SEC.

CHAIRMAN’S COMMENTS
Allan C. Kramer, M.D. Chairman

Board of Directors
|
Allan C. Kramer, M.D.
|
Daniel P. Myers
|
Thomas M. Quigg
|
|
Chairman
|
President & CEO
|
Vice Chairman
|
|
Investor
|
Bridge Bank, N.A.
|
Investor
|
|
Bridge Capital Holdings
|
||
|
Owen Brown
|
Howard N. Gould
|
Dr. Francis J. Harvey
|
|
Owen Brown Enterprises, Ltd.
|
Carpenter Community BancFund
|
19th Secretary of the Army
|
|
Robert P. Latta
|
Terry Schwakopf
|
Barry A. Turkus
|
|
Wilson Sonsini Goodrich & Rosati
|
Consultant
|
B.T. Commercial
|


SHAREHOLDER BRIEFING

Overview
|
n
|
Changing Environment
|
|
n
|
Highlights 2010-Q1’11
|
|
n
|
Looking Ahead
|

|
Managing Through the Financial Crisis
|
||||
|
2
|
||||
|
0
|
n
|
Proactive credit risk recognition and management driven by key operating
|
||
|
0
|
philosophies
|
|||
|
8
|
l
|
‘Early Action – Early Out’
|
||
|
-
|
l
|
‘First Loss – Best Loss’
|
||
|
2
|
n
|
Supplemented capital for endurance and opportunity
|
||
|
0
|
l
|
$
|
30 M private capital raise (CCBF preferred)
|
|
|
0
|
l
|
Accepted $23.8 M UST CPP capital
|
||
|
9
|
||||
|
n
|
Enhanced credit risk analytics, SAG, ERM
|
|||
|
n
|
Recognized conservative marks on NPA’s
|
|||
|
2
|
n 70% reduction in L&C exposures; overall CRE reduction of 59%
|
|
0
|
|
1
|
n 40% decrease in classified asset portfolio
|
|
0
|
n NCO’s reduced 50% per year between 2008 and 2010
|
|
n Q1 Converted $30M Preferred to Common; Q4 $30M common equity raised
|
2011 n TARP repaid in full; warrant repurchased

The Changing Environment
INCREASING STABILITY:
|
i
|
Residential Real Estate
|
|
i
|
Commercial Real Estate
|
SIGNS OF OPPORTUNITY :
|
i
|
Technology Sector
|
|
i
|
Venture Capital Funding / IPO
|
|
i
|
Increasing Business Activity
|
CHALLENGES REMAIN:
|
i
|
Fragile Recovery
|
|
i
|
Weak Loan Demand / Deleveraging
|
|
i
|
Revenue
|
|
i
|
Government / Industry Regulation
|
BBNK 2010 Summary
|
n
|
Operating profit of $2.6 million
|
|
i
|
54% growth from 2009 to 2010
|
|
n
|
Surpassed $1.0 billion in total assets
|
|
n
|
Substantially improved TCE ratio
|
|
i
|
$3M savings per year from preferred-to-common conversion
|
|
i
|
Secured $30M private placement
|
|
n
|
Continued strong growth in core deposits
|
|
n
|
Improving credit quality
|
|
i
|
NCOs reduced 56% from prior year
|
|
i
|
NPA’s including TDR’s reduced by 31%
|
|
n
|
NIM expanded to 4.99% from 4.58% in 2009
|
|
n
|
Robust new business activity
|
Capital Raise at Favorable Terms
2010 – 2011 YTD Bank Public Common Equity Offerings < $200 million
|
Market
|
Shares
|
Shares
|
Offer Price /
|
Offer Price /
|
||||||||
|
Cap
|
Deal
|
Issued vs.
|
Issued
|
Stated
|
Pro Forma
|
Discount to
|
% Change Offer to
|
|||||
|
Price
|
At Pricing
|
Pricing
|
Value
|
Pre-Deal
|
vs.
|
Tang. Book
|
Tang. Book
|
Filing
|
Last
|
|||
|
Issuer
|
Ticker
|
05/20/11
|
($mm)
|
Date
|
($mm)
|
o/s (%)
|
ADTV
|
(x)
|
(x)
|
Price
|
Trade
|
1 day 1 week Current
|
|
Sub $200 million pre-deal market cap
|
||||||||||||
|
1
|
Wilshire Bancorp, Inc.
|
|
2
|
Xenith Bankshares Inc.
|
|
3
|
First Defiance Financial Corp
|
|
4
|
Sun Bancorp, Inc.
|
|
5
|
1st United Bancorp Inc.
|
|
6
|
Financial Institutions, Inc.
|
|
7
|
United Bancorp Inc.
|
|
8
|
Heritage Financial Corporation
|
|
9
|
The Bank of Kentucky Financial Corp
|
|
10
|
Intervest Bancshares Corp
|
|
11
|
Tennessee Commerce Bancorp
|
|
12
|
Riverview Bancorp Inc.
|
|
13
|
The First of Long Island Corp
|
|
14
|
Banner Corporation
|
|
15
|
Republic First Bancorp
|
|
16
|
Hopfed Bancorp, Inc.
|
|
17
|
CNB Financial Corporation
|
|
18
|
Ameris Bancorp
|
|
19
|
Bank of Commerce Holdings
|
|
20
|
Orrstow n Financial Services
|
|
21
|
First California Financial Group
|
|
22
|
Sterling Bancorp
|
|
Median
|
|
Bridge Capital Holdings
|
|
WIBC
|
3.24
|
90.18
|
05/11/11
|
115.00
|
141.9
|
%
|
136.13
|
x
|
0.74
|
0.89
|
(24.86
|
)
|
(10.13
|
)
|
16.00
|
na
|
17.82
|
||||
|
XBKS
|
4.26
|
25.14
|
03/29/11
|
19.55
|
78.7
|
%
|
9163.35
|
x
|
0.72
|
0.83
|
(26.09
|
)
|
(1.16
|
)
|
0.24
|
5.88
|
0.24
|
||||
|
FDEF
|
14.02
|
114.14
|
03/23/11
|
21.21
|
19.7
|
%
|
170.33
|
x
|
0.77
|
0.80
|
(5.76
|
)
|
(5.76
|
)
|
7.17
|
6.79
|
5.81
|
||||
|
SNBC
|
3.75
|
165.28
|
03/16/11
|
84.74
|
57.1
|
%
|
552.33
|
x
|
0.69
|
0.78
|
(22.68
|
)
|
(8.54
|
)
|
1.67
|
9.67
|
25.00
|
||||
|
FUBC
|
6.21
|
174.65
|
03/16/11
|
32.50
|
20.2
|
%
|
63.39
|
x
|
1.28
|
1.24 Among(7.67) All(7.67) Recent 1.54
|
3.69
|
(4.46
|
)
|
||||||||
|
FISI
|
16.11
|
184.35
|
03/09/11
|
46.00
|
25.7
|
%
|
86.14
|
x
|
1.48
|
1.38
|
(9.87
|
)
|
(2.62
|
)
|
4.83
|
2.94
|
(1.47
|
)
|
|||
|
UBMI
|
3.50
|
13.98
|
12/13/10
|
17.00
|
133.8
|
%
|
3439.55
|
x
|
0.22
|
Public0.41
|
Common(35.06) (9.09)
|
Raises:12.00 24.00
|
40.00
|
||||||||
|
HFWA
|
12.83
|
153.23
|
12/09/10
|
57.56
|
39.8
|
%
|
338.83
|
x
|
1.16
|
1.13
|
$30M BBNK (9.91) (5.32) Capital 2.62
|
3.62
|
(1.31
|
)
|
|||||||
|
BKYF
|
24.39
|
104.78
|
11/16/10
|
30.01
|
31.2
|
%
|
582.89
|
x
|
1.11
|
1.10
|
(8.06
|
)
|
(8.06
|
)
|
3.47
|
4.12
|
43.47
|
||||
|
IBCA
|
2.94
|
17.59
|
10/14/10
|
22.79
|
128.1
|
%
|
551.45
|
x
|
0.13
|
Raised 0.24 (64.22) at 138%(5.34) 0.00 of
|
2.56
|
50.77
|
|||||||||
|
TNCC
|
2.36
|
24.74
|
08/05/10
|
26.19
|
115.9
|
%
|
646.25
|
x
|
0.32
|
0.49
|
(54.80
|
)
|
(11.11
|
)
|
0.00
|
0.00
|
(41.00
|
)
|
|||
|
RVSB
|
3.03
|
21.85
|
07/29/10
|
20.79
|
105.7
|
%
|
575.82
|
x
|
0.34
|
0.50Median(21.74)of (10.00)the Offer11.11
|
14.44
|
68.33
|
|||||||||
|
FLIC
|
26.80
|
178.18
|
07/14/10
|
34.50
|
19.8
|
%
|
84.04
|
x
|
1.36
|
1.31
|
(6.47
|
)
|
(2.28
|
)
|
5.21
|
2.04
|
11.67
|
||||
|
BANR
|
2.73
|
50.13
|
06/24/10
|
171.28
|
370.7
|
%
|
189.13
|
x
|
0.17
|
Price/TBV0.47 (43.50)
|
of
|
(2.44)Similar(1.00)
|
1.50
|
36.50
|
|||||||
|
FRBK
|
2.60
|
21.32
|
06/21/10
|
30.82
|
144.5
|
%
|
304.53
|
x
|
0.33
|
0.55 Bank(49.11)Offerings(0.99) (10.00)
|
(2.50
|
)
|
30.00
|
||||||||
|
HFBC
|
7.95
|
35.27
|
06/15/10
|
32.25
|
99.6
|
%
|
561.83
|
x
|
0.51
|
0.68
|
(21.53
|
)
|
(8.16
|
)
|
0.11
|
0.22
|
(11.67
|
)
|
|||
|
CCNE
|
13.27
|
93.82
|
06/14/10
|
34.50
|
38.2
|
%
|
296.39
|
x
|
1.48
|
1.35
|
(10.64
|
)
|
(3.76
|
)
|
7.61
|
11.61
|
29.46
|
||||
|
ABCB
|
8.98
|
140.80
|
04/14/10
|
89.99
|
67.5
|
%
|
247.54
|
x
|
0.95
|
0.99
|
(1.45
|
)
|
(6.03
|
)
|
9.68
|
12.95
|
(5.47
|
)
|
|||
|
BOCH
|
4.41
|
43.12
|
03/23/10
|
35.19
|
95.0
|
%
|
2668.39
|
x
|
0.80
|
0.89
|
(19.05
|
)
|
(14.14
|
)
|
10.12
|
11.53
|
3.76
|
||||
|
ORRF
|
25.20
|
196.85
|
03/23/10
|
40.00
|
23.0
|
%
|
189.45
|
x
|
1.93
|
1.67
|
(24.33
|
)
|
(11.48
|
)
|
(2.22
|
)
|
(3.04
|
)
|
(6.67
|
)
|
|
|
FCAL
|
3.68
|
32.08
|
03/18/10
|
41.40
|
142.5
|
%
|
678.97
|
x
|
0.48
|
0.69
|
(18.57
|
)
|
(9.42
|
)
|
7.20
|
14.00
|
47.20
|
||||
|
STL
|
9.35
|
148.19
|
03/15/10
|
69.00
|
47.6
|
%
|
103.33
|
x
|
1.46
|
1.31
|
(10.11
|
)
|
(2.20
|
)
|
3.88
|
9.62
|
16.88
|
||||
|
92.00
|
34.50
|
73.1
|
%
|
321.68
|
x
|
0.76
|
0.86
|
(20.29
|
)
|
(6.85
|
)
|
3.68
|
4.12
|
14.27
|
|||||||
|
BBNK
|
11.50
|
92.11
|
11/19/10
|
30.00
|
32.0
|
%
|
914.46
|
x
|
1.05
|
1.04
|
N/A
|
0.00
|
(1.87
|
)
|
(5.96
|
)
|
34.35
|
||||
|
SOURCE: KBW
|
|||||||||||||||||||||
Capital Raise at Favorable Terms
2008 – 2011YTD Bank Private Placement Offerings < $750 million
|
Offer
|
|||||||||||||||
|
Financials at Announcement
|
Price to
|
Total
|
New
|
||||||||||||
|
TCE/
|
NPAs/
|
TBV at
|
Deal
|
Shareholder
|
Legacy
|
||||||||||
|
Annc.
|
Compl.
|
Assets
|
TA
|
Lns + OREO
|
Annc.
|
Size
|
Ownership
|
Ownership
|
|||||||
|
Issuer
|
Ticker
|
Date
|
Date
|
State
|
($M)
|
(%)
|
(%)
|
(%)
|
($M)
|
(%)
|
(%)
|
||||
|
1
|
Green Bankshares, Inc.
|
GRNB
|
5/5/2011
|
Pending
|
TN
|
2,393
|
2.45
|
14.3
|
41.0
|
217.0
|
90
|
10
|
|||
|
2
|
FNB United Corp.
|
FNBN
|
4/27/2011
|
Pending
|
NC
|
1,921
|
(3.68
|
)
|
28.1
|
NM
|
310.0
|
99
|
1
|
||
|
3
|
United Community Banks, Inc.
|
UCBI
|
3/16/2011
|
Pending
|
GA
|
7,443
|
6.03
|
8.5
|
40.2
|
380.0
|
68
|
32
|
|||
|
4
|
Crescent Financial Corporation
|
CRFN
|
2/23/2011
|
Pending
|
NC
|
973
|
5.65
|
7.7
|
70.3
|
75.0
|
66
|
34
|
|||
|
5
|
Cascade Bancorp
|
CACB
|
11/17/2010
|
1/28/2011
|
OR
|
1,829
|
0.20
|
11.7
|
NM
|
176.8
|
94
|
6
|
|||
|
6
|
Capital Bank Corporation
|
CBKN
|
11/4/2010
|
1/28/2011
|
NC
|
1,694
|
4.90
|
7.1
|
39.6
|
185.2
|
83
|
17
|
|||
|
7
|
Central Pacific Financial Corp.
|
CPF
|
11/4/2010
|
Pending
|
AmongHI 4,173All Recent(1.74)
|
15.6
|
NM
|
345.0
|
92
|
8
|
|||||
|
8
|
National Penn Bancshares, Inc.
|
NPBC
|
10/6/2010
|
1/7/2111
|
PA
|
9,222
|
7.04
|
1.8
|
118.4
|
150.0
|
16
|
84
|
|||
|
9
|
Sun Bancorp, Inc.
|
SNBC
|
7/8/2010
|
9/22/2010 PrivateNJ 3,532Placements:6.34
|
3.8
|
42.2
|
106.7
|
53
|
47
|
||||||
|
10
|
Porter Bancorp, Inc.
|
PBIB
|
6/30/2010
|
6/30/2010
|
$30MKY
|
1,757BBNK Capital6.45
|
9.7
|
90.8
|
27.0
|
21
|
79
|
||||
|
11
|
TIB Financial Corp.
|
TIBB
|
6/29/2010
|
9/30/2010
|
FL
|
1,691
|
0.59
|
10.3
|
22.4
|
183.0
|
94
|
6
|
|||
|
12
|
Heritage Commerce Corp
|
HTBK
|
6/21/2010
|
6/21/2010 RaisedCA 1,337at 245%6.44
|
of
|
6.6
|
53.3
|
75.0
|
63
|
37
|
|||||
|
13
|
BNC Bancorp
|
1 BNCN
|
6/14/2010
|
6/14/2010
|
MedianNC 1,629of the4.17Offer
|
3.4
|
110.0
|
35.0
|
32
|
68
|
|||||
|
14
|
Palmetto Bancshares, Inc.
|
PLMT
|
5/26/2010
|
10/7/2010
|
SC
|
1,348
|
5.00
|
14.7
|
25.1
|
103.9
|
86
|
14
|
|||
|
15
|
Hampton Roads Bankshares, Inc.
|
HMPR
|
5/24/2010
|
12/28/2010Price/TBVVA 2,946
|
of Similar(2.10)
|
11.6
|
NM
|
295.0
|
94
|
6
|
|||||
|
16
|
Jacksonville Bancorp, Inc.
|
JAXB
|
5/10/2010
|
5/10/2010
|
FLBank452Offerings5.79
|
7.1
|
60.0
|
35.0
|
69
|
31
|
|||||
|
17
|
Pacific Capital Bancorp
|
PCBC
|
4/29/2010
|
8/31/2010
|
CA
|
7,369
|
1.33
|
9.2
|
9.6
|
576.4
|
87
|
13
|
|||
|
18
|
Sterling Financial Corporation
|
STSA
|
4/27/2010
|
8/26/2010
|
WA
|
10,555
|
(0.66
|
)
|
14.7
|
NM
|
730.0
|
99
|
1
|
||
|
19
|
Heritage Oaks Bancorp
|
HEOP
|
3/10/2010
|
3/12/2010
|
CA
|
945
|
5.44
|
6.6
|
53.0
|
60.0
|
70
|
30
|
|||
|
20
|
West Coast Bancorp
|
WCBO
|
10/26/2009
|
10/23/2009
|
OR
|
2,653
|
6.07
|
11.6
|
19.4
|
155.0
|
83
|
17
|
|||
|
21
|
Seacoast Banking Corp. of Florida
|
2 SBCF
|
8/10/2009
|
12/17/2009
|
FL
|
2,140
|
6.14
|
12.8
|
43.4
|
139.3
|
79
|
21
|
|||
|
Average
|
3.42
|
10.3
|
52.4
|
73
|
27
|
||||||||||
|
Median
|
5.00
|
9.7
|
42.8
|
83
|
17
|
||||||||||
|
Bridge Capital Holdings
|
BBNK 11/19/2010 11/23/2010
|
CA
|
939
|
9.48
|
5.4
|
105.2
|
30.0
|
24
|
76
|
||||||
|
SOURCE: KBW
|
|||||||||||||||
BBNK Q1 2011 Summary
|
n
|
Operating profit of $1.6 million
|
|
i
|
+330% from Q1, 2010
|
|
n
|
Consistent high quality deposit growth
|
|
i
|
95% core
|
|
i
|
57% DDA
|
|
n
|
Continued credit quality improvement
|
|
i
|
ALLL Provision reduced to pre-financial crisis level
|
|
n
|
Exceptionally well capitalized
|
|
i
|
TCE of 12.26%
|
|
i
|
Redeemed $24.0 million of TARP preferred stock
|
|
i
|
Repurchased TARP warrant
|
|
n
|
Continued robust new client acquisition
|
Capital for Growth and Opportunity
|
TCE
|
Leverage
|
Tier 1 RBC
|
Total RBC
|
|||
|
BBNK
|
Peer*
|
BBNK
|
||||
|
Tangible common equity ratio
|
12.26
|
%
|
8.15
|
%
|
Peer*
|
|
|
Leverage
|
13.68
|
%
|
10.39
|
%
|
Regulatory
|
|
|
Tier 1 capital ratio
|
16.98
|
%
|
15.15
|
%
|
Minimum
|
|
|
Total risk based capital
|
18.23
|
%
|
15.99
|
%
|
||
|
*Peer = US Public Banks $500M-$1.5B TA; SNL, as of March 31, 2011
|
||||||
BBNK Capital Structure
Expanding Market Presence
Average Total Assets ($M)
Focus on Core Deposits
True Loan Portfolio Diversification
|
March 31, 2011
|
BBNK % RE = 39% (61% Non-RE)
|
|
Peer* % RE = 62% (38% Non-RE)
|
*US Public Banks $500M-$1.5B TA; SNL as of December 31, 2011
Ranked #1 for Largest C&I Portfolio
Source: American Banker magazine, American Bankers Association, Independent banks with less than $1 billion of assets.
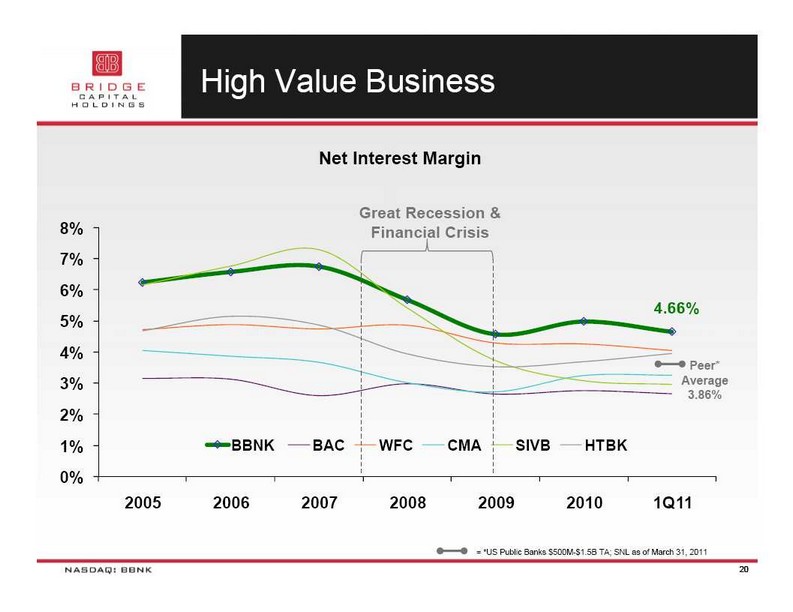
High Value Business
Net Interest Margin
Effective Revenue Generation

Improving Operating Leverage
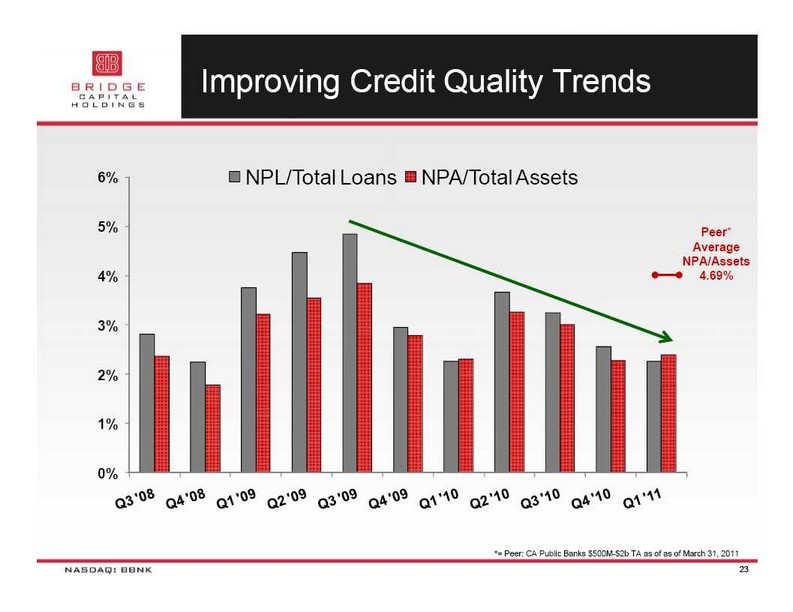
Improving Credit Quality Trends
*= Peer: CA Public Banks $500M-$2b TA as of as of March 31, 2011

= SNL Data: US Public Banks Total Assets $0.5B to $1.5M as of March 31, 2011
24
Holding Robust Reserves as Credit Stress Eases


Positioned for Improved Earnings
|
n
|
Lower levels of credit stress
|
|
i
|
Potential recoveries
|
|
i
|
Normalizing of credit costs
|
|
n
|
Utilization rates on LOC at low ebb
|
|
i
|
Have continued to add new commitments
|
|
i
|
Utilization currently in the low 30%range
|
|
i
|
As economy improves rate could move up to 40%+
|
|
n
|
Natural asset-sensitivity
|
|
i
|
Positioned for rising rate environment
|
|
i
|
Ready funding source for increased loan demand
|
|
n
|
Continued organic growth
|

Core Market
Core Region – Silicon Valley*
|
n
|
San Jose 10th largest US city1
|
|
n
|
5 million regional population
|
|
n
|
Among highest median family and per capita incomes in US2
|
|
n
|
$111 billion deposit market3
|
|
n
|
Largest concentration of technology company formation and finance in the world1
|
|
n
|
Silicon Valley received 42% of US venture capital investment ($5.8b Q1, 2011)4
|
*:Silicon Valley Region = Santa Clara, San Mateo, San Francisco, and Alameda Counties
|
|
1 San Jose/Silicon Valley Chamber of Commerce January 2011
|
|
|
2 US Census/HUD CRA/HMDA Report 2010
|
|
|
3 FDIC data at June 30, 2010
|
|
|
4 National Venture Capital Association/PricewaterhouseCoopers Money Tree Survey as of March 31, 2011
|

Strong Value Proposition
|
Competitive
|
||
|
Highly
|
PRODUCTS and
|
|
|
EXPERIENCED
|
SERVICES through
|
|
|
credentialed and
|
||
|
disciplined BANKERS
|
SIMPLIFIED
|
channel partner
|
|
customer
|
relationships
|
|
|
experience.
|
||
|
SOPHISTICATED
|
||
|
business banking.
|
Outsourced BANKING
TECHNOLOGY
comparable to large
national mega banks
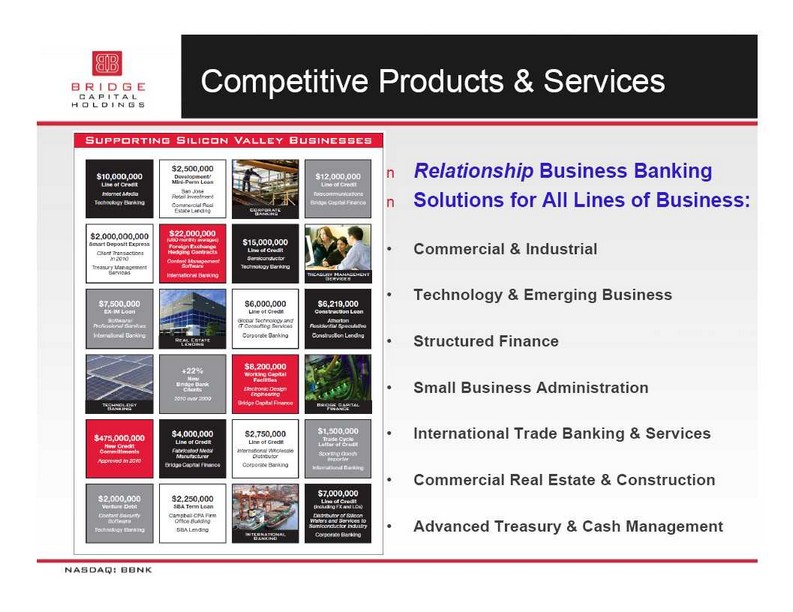
Competitive Products & Services
|
n
|
Relationship Business Banking
|
|
n
|
Solutions for All Lines of Business:
|
|
•
|
Commercial & Industrial
|
|
•
|
Technology & Emerging Business
|
|
•
|
Structured Finance
|
|
•
|
Small Business Administration
|
|
•
|
International Trade Banking & Services
|
|
•
|
Commercial Real Estate & Construction
|
|
•
|
Advanced Treasury & Cash Management
|

|
Ralph W. Barnett
|
Lori Edwards
|
Michael J. Field
|
Jeannie Kao
|
Sasha Kipkalov
|
Emily Ruvalcaba
|
|
Executive Vice President
|
Executive Vice President
|
Executive Vice President
|
Executive Vice President
|
Executive Vice President
|
Executive Vice President
|
|
Manager,
|
Special Assets Manager
|
Technology Banking
|
Manager,
|
Chief Financial Officer
|
Manager,
|
|
SBA & Real Estate Lending
|
Division Manager
|
International Banking
|
Corporate Banking Division
|
With the Industry’s BEST Professional Business Bankers

Straightforward Growth Strategy
|
n
|
FOCUS ON BUSINESS BANKING markets and lines of business we know well
|
|
n
|
Maintain COMPETITIVE value proposition
|
|
n
|
Attract & ACQUIRE NEW CLIENTS
|
|
n
|
Generate CORE DEPOSIT balances
|
|
n
|
LEND to creditworthy borrowers
|
|
n
|
Maintain EXCELLENT ASSET QUALITY
|
|
n
|
Aggressively MANAGE EXPENSES
|
|
n
|
Leverage CAPITAL TO GROW
|

Market Response to Strategy


Thank You / Q & A