Attached files
| file | filename |
|---|---|
| 8-K - FORM 8-K - United Financial Bancorp, Inc. | y91465e8vk.htm |
Exhibit 99.1

| Transition • Values • Success Transition • Values • Success NASDAQ Global Select Market RCKB Investor Presentation May 2011 |

| 2 This Presentation contains forward-looking statements that are within the meaning of the Private Securities Litigation Reform Act of 1995. Such statements are based upon the current beliefs and expectations of our management and are subject to significant risks and uncertainties. These risks and uncertainties could cause our results to differ materially from those set forth in such forward-looking statements. Forward-looking statements can be identified by the fact that they do not relate strictly to historical or current facts. Words such as "believes," "anticipates," "expects," "intends," "plans," "estimates," "targeted" and similar expressions, and future or conditional verbs, such as "will," "would," "should," "could" or "may" are intended to identify forward-looking statements but are not the only means to identify these statements. Forward-looking statements involve risks and uncertainties. Actual conditions, events or results may differ materially from those contemplated by a forward-looking statement. Factors that could cause this difference - many of which are beyond our control - include without limitation the following: Any forward-looking statements made by or on behalf of us in this Presentation speak only as of the date of this Presentation. We do not undertake to update forward-looking statements to reflect the impact of circumstances or events that arise after the date the forward-looking statement was made. The reader should; however, consult any further disclosures of a forward-looking nature we may make in future filings. • Local, regional and national business or economic conditions may differ from those expected. • The effects of and changes in trade, monetary and fiscal policies and laws, including the U.S. Federal Reserve Board's interest rate policies, may adversely affect our business. • The ability to increase market share and control expenses may be more difficult than anticipated. • Changes in laws and regulatory requirements (including those concerning taxes, banking, securities and insurance) may adversely affect us or our businesses. • Changes in accounting policies and practices, as may be adopted by regulatory agencies, the Public Company Accounting Oversight Board or the Financial Accounting Standards Board, may affect expected financial reporting. • Future changes in interest rates may reduce our profits which could have a negative impact on the value of our stock. • We are subject to lending risk and could incur losses in our loan portfolio despite our underwriting practices. Changes in real estate values could also increase our lending risk. • Changes in demand for loan products, financial products and deposit flow could impact our financial performance. • Strong competition within our market area may limit our growth and profitability. • We may not manage the risks involved in the foregoing as well as anticipated. • If our allowance for loan losses is not sufficient to cover actual loan losses, our earnings could decrease. • Our stock value may be negatively affected by federal regulations restricting takeovers and our mutual holding company structure. • Further implementation of our stock benefit plans could increase our costs, which will reduce our income. • Because we intend to continue to increase our commercial real estate and commercial business loan originations, our lending risk may increase, and downturns in the real estate market or local economy could adversely affect our earnings. • The Emergency Economic Stabilization Act ("EESA") of 2008 has and may continue to have a significant impact on the banking industry. The Dodd-Frank Wall Street Reform and Consumer Protection Act was signed into law on July 21, 2010 and is expected to result in dramatic regulatory changes that will affect the industry in general, and impact the Company's competitive position in ways that can't be predicted at this time. Throughout this presentation, the peer companies include: PBNY, BRKL, DNBK, OCFC, ESBF, UBNK, WFD, ESSA, BFED, NHTB, HIFS, HARL, and THRD. The data presented in this presentation relating to the peer companies is based on the calendar year, not RCKB's fiscal year. Data for peers is sourced from SNL Financial LLC. Forward Looking Statements |

| 3 Table of Contents Page Corporate Overview 4 Market Profile 6 Financial Performance 10 Strategic Outlook 12 Loans 17 Deposits 21 Asset Quality 24 Appendix 27 |

| 4 Corporate Contacts William H. W. Crawford, IV President & Chief Executive Officer John T. Lund Senior Vice President, Chief Financial Officer & Treasurer Mark A. Kucia Senior Vice President, Commercial Banking Officer Investor Information: Marliese L. Shaw Vice President, Investor Relations Officer 860-291-3622 or mshaw@rockvillebank.com |

| 5 William H. W. Crawford, IV President & Chief Executive Officer Mr. Crawford (45), President and Chief Executive Officer since April 26, 2011, joined Rockville Financial, Inc. on January 3, 2011 from Wells Fargo Bank, N.A. where he headed middle market commercial banking in Eastern Virginia. Crawford's other key roles with Wells Fargo Bank, N.A. predecessors, Wachovia Bank N.A. and SouthTrust Bank, N.A. included: Regional President, Eastern Virginia; Regional President, Piedmont Triad, North Carolina; Regional President, Southeast Florida and Regional President, Raleigh/Durham, North Carolina. In these roles, he led all major lines of business within the geography, Crawford has 23 years industry experience. |

| 6 We Operate in an Attractive Market We have an attractive branch network in the suburban communities east and north of Hartford, CT. Tolland County has experienced rapid growth from 2000 - 2010 (10.26% vs. 3.82% for Connecticut) and is projected to continue to outpace Connecticut in population growth over the next four years. Hartford County, home of the state capitol, is a large market that offers strong future growth prospects. University of Connecticut plays a large role in the local community. Commercial growth has been strong and real estate values have compared favorably to the rest of the country. |

| 7 Market Area Hartford, New London and Tolland counties, Connecticut 21.5 branches (including 3 supermarket branches) Lending area also includes the adjacent Windham and Middlesex counties, Connecticut Out of state regional commercial real estate lending program Average branch size: $57 million in deposits as of March 31, 2011 |

| 8 Strong Branch Franchise Strong Branch Franchise Main Office: 25 Park Street Rockville, Connecticut 06066 |
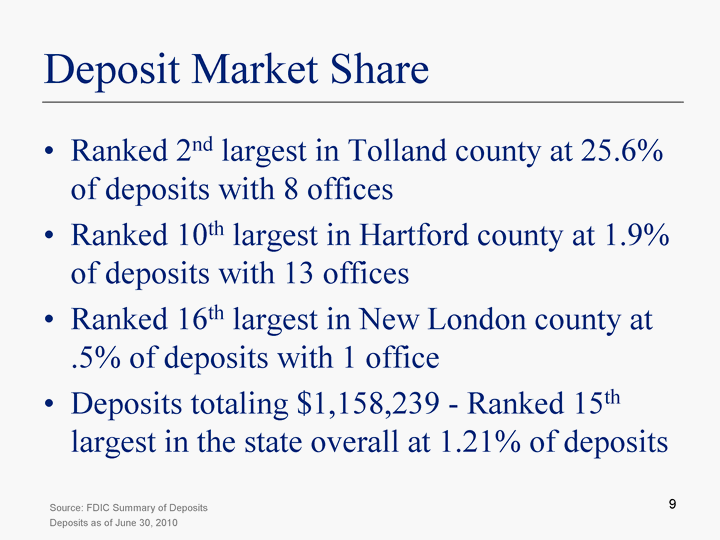
| 9 Deposit Market Share Ranked 2nd largest in Tolland county at 25.6% of deposits with 8 offices Ranked 10th largest in Hartford county at 1.9% of deposits with 13 offices Ranked 16th largest in New London county at .5% of deposits with 1 office Deposits totaling $1,158,239 - Ranked 15th largest in the state overall at 1.21% of deposits Source: FDIC Summary of Deposits Deposits as of June 30, 2010 |

| 10 Q1 - 2011 Highlights Net earnings of $2.4 million when excluding $5.0 million (pre- tax) shareholder approved, one-time cash contribution to the Rockville Bank Foundation, Inc. compared to $2.9 million for the same period in the prior year Assets increased $221.8 million, or 13.2%, to $1.90 billion from $1.68 billion at December 31, 2010 Deposits increased $29.8 million, or 2.4%, to $1.25 billion from $1.22 billion at December 31, 2010 Stockholders' equity increased $169.6 million, or 101.9%, to $336.1 million from $166.4 million at December 31, 2010 Total non-performing assets to total assets decreased to 0.72% from 0.80% |

| 11 Q1 - 2011 Results |

| 12 Strategic Priorities Enhancing operations/IT, risk management and compliance infrastructure to support accelerated growth, capital deployment and regulatory environment Evaluating retail, mortgage and commercial banking business models Recruiting highly experienced in-market commercial bankers/teams Maintain excellent asset quality and fortress balance sheet Evaluate efficiency and effectiveness of existing branch network and evaluate de novo branching opportunities in select markets Focus on reducing total cost of funds, growing low cost core deposits Continue growing regional CRE portfolio within acceptable risk and concentration limits Explore options for non-interest income growth Accelerating Profitable Risk Adjusted Organic Revenue Growth |

| 13 Strategic Priorities (continued) Focused on driving organic growth and exercising patience with acquisitions, especially given current market multiples Building organizational capacity to execute acquisition strategy Acquisitions must meet strategic rationale with high probability to create shareholder value With Dodd Frank implementation and continued tough economy, positioning Company for potential attractive opportunities Management understands the potential for value destruction via excessive tangible book dilution and extended tangible book dilution payback periods Acquisitions Stock Buyback Will become available as an option end of Q1/2012 |

| 14 Despite a difficult operating environment, we were able to grow assets at a CAGR of 10.7% through a disciplined growth strategy. Total Assets CAGR = 10.7% |

| 15 Capital Ratios After completing the offering, we continue to be well capitalized. At March 31, 2011, our core capital ratio was 18.20% of total adjusted tangible assets In addition, our Tier 1 Capital to Risk-Weighted Assets and Total Capital to Risk-Weighted Assets were 24.50% and 25.70%, respectively. |

| 16 Solid Performance Since 2006 Efficiency Ratio vs Peers: Net Interest Margin vs Peers: Return on Average Assets vs Peers: Non-Performing Loans / Total Loans vs Peers: Note: ROAA has been annualized for 2011Q1 |
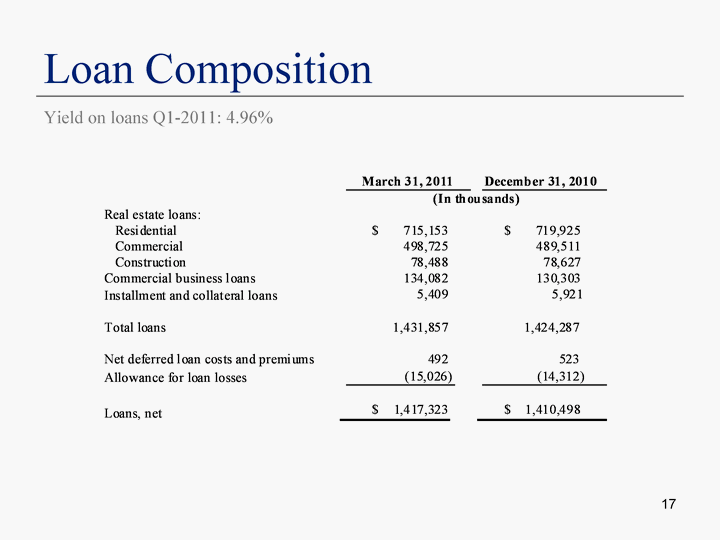
| 17 Loan Composition Loan Composition Yield on loans Q1-2011: 4.96% |

| 18 Loan Growth 5 Year Organic Growth History |

| 19 Loan Mix - 3 Year Comparison |

| 20 Commercial Real Estate (Q1 2011) Note: Data for quarter ended 3/31/11 * Not including Connecticut |

| 21 Deposit Composition Deposit Portfolio Total deposits: $1.2 billion Cost of total interest-bearing deposits Q1-2011: 1.09% |

| 22 Deposit Growth 5 Year Organic Growth History |
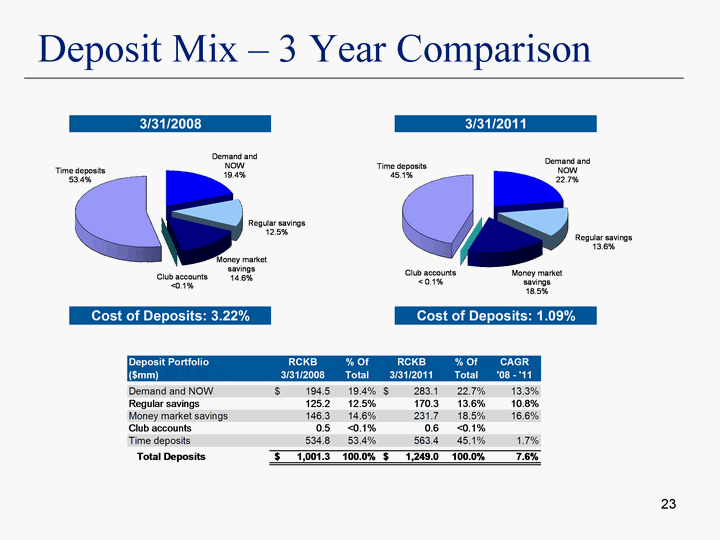
| 23 Deposit Mix - 3 Year Comparison |
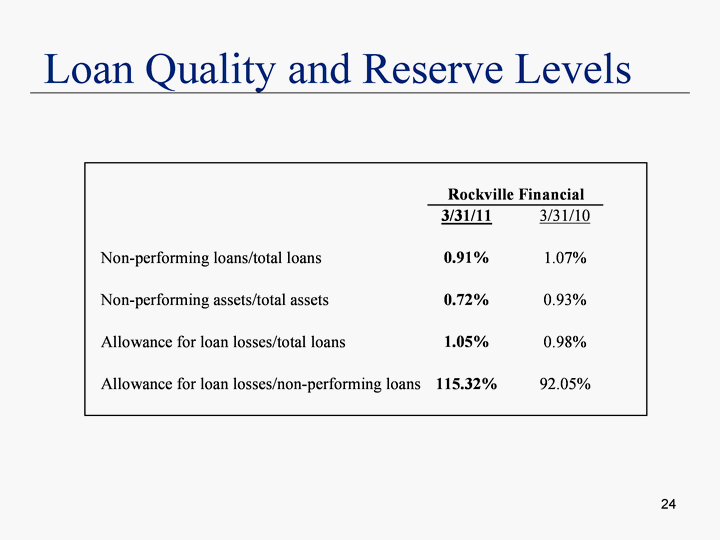
| 24 Loan Quality and Reserve Levels |

| 25 Solid Asset Quality Despite Tough Environment Loan Loss Reserves / Loans vs Peers: NCOs / Avg Loans vs Peers: Compares Favorably to Peers(1) (1) See Appendix for Peer group data |

| 26 Why Rockville Financial Experienced Management Team Strengthened capital and liquidity Strong Asset Quality Sustained performance even in a tough economic environment Strong core deposit base Attractive market area Organic growth potential due to competitive advantage provided by community bank service coupled with commercial bank products and expertise Positioned to capitalize on growth opportunities Performance compares favorably to peers in many categories Paid a dividend to shareholders for 20 consecutive quarters |

| 27 APPENDIX |

| 28 Peer Comparison(1) * DNBK is the target of an announced merger with PBCT Note: Data for the quarter ended March 31, 2011. Pricing data as of May 17, 2011. Data at bank level where information was unavailable at parent level (1) Peer group companies selected by independent appraisal firm during second step conversion (2) Core income excludes extraordinary items, non-recurring items and gains/losses on sale of securities. |

| 29 Recently Converted Second Step Conversions Note: Charter Financial Corp. (MHC) not included in above analysis due to unique structure as an incremental MHC offering Source: SNL Financial, pricing as of 5/13/11 Second step conversions since January 1, 2010 with gross proceeds greater than $20mm |
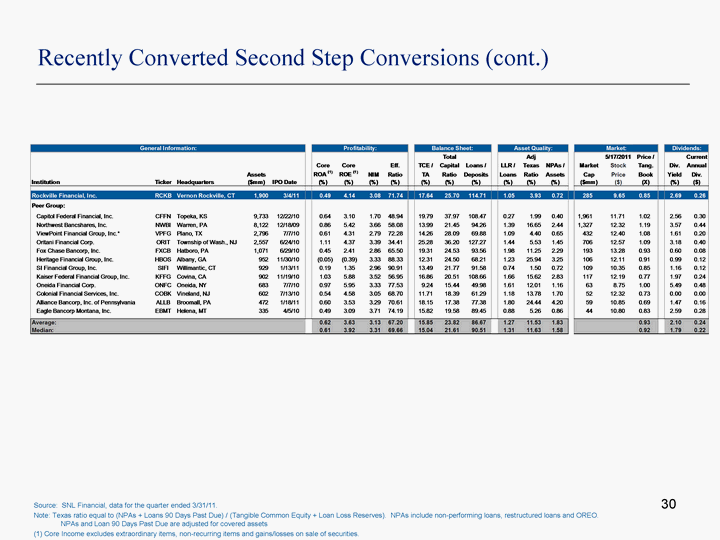
| 30 Recently Converted Second Step Conversions (cont.) Source: SNL Financial, data for the quarter ended 3/31/11. Note: Texas ratio equal to (NPAs + Loans 90 Days Past Due) / (Tangible Common Equity + Loan Loss Reserves). NPAs include non-performing loans, restructured loans and OREO. NPAs and Loan 90 Days Past Due are adjusted for covered assets (1) Core Income excludes extraordinary items, non-recurring items and gains/losses on sale of securities. |
