Attached files
| file | filename |
|---|---|
| 8-K - FORM 8-K - SELECTIVE INSURANCE GROUP INC | f8k_052311.htm |
EXHIBIT 99.1

INVESTOR PRESENTATION
MAY 2011
FINANCIAL STRENGTH
- SELECTIVE INSURANCE GROUP, INC. -

Pricing
Success
Success
Pricing
Success
Success
Personal
Lines
Lines
Personal
Lines
Lines
Prepared for
Tomorrow
Tomorrow
Prepared for
Tomorrow
Tomorrow
Financial
Strength
Strength
Financial
Strength
Strength
Commercial
Lines
Lines
Commercial
Lines
Lines
Forward Looking Statement
Certain statements in this report, including information incorporated by reference, are “forward-
looking statements” as that term is defined in the Private Securities Litigation Reform Act of 1995
(“PSLRA”). The PSLRA provides a safe harbor under the Securities Act of 1933 and the Securities
Exchange Act of 1934 for forward-looking statements. These statements relate to our intentions,
beliefs, projections, estimations or forecasts of future events or our future financial performance
and involve known and unknown risks, uncertainties and other factors that may cause our or our
industry's actual results, levels of activity, or performance to be materially different from those
expressed or implied by the forward-looking statements. In some cases, you can identify forward-
looking statements by use of words such as "may," "will," "could," "would," "should," "expect,"
"plan," "anticipate," "target," "project," "intend," "believe," "estimate," "predict," "potential," "pro
forma," "seek," "likely" or "continue" or other comparable terminology. These statements are only
predictions, and we can give no assurance that such expectations will prove to be correct. We
undertake no obligation, other than as may be required under the federal securities laws, to
publicly update or revise any forward-looking statements, whether as a result of new information,
future events or otherwise.
Factors, that could cause our actual results to differ materially from those projected, forecasted or
estimated by us in forward-looking statements are discussed in further detail in Selective’s public
filings with the United States Securities and Exchange Commission. These risk factors may not be
exhaustive. We operate in a continually changing business environment, and new risk factors
emerge from time-to-time. We can neither predict such new risk factors nor can we assess the
impact, if any, of such new risk factors on our businesses or the extent to which any factor or
combination of factors may cause actual results to differ materially from those expressed or
implied in any forward-looking statements in this report. In light of these risks, uncertainties and
assumptions, the forward-looking events discussed in this report might not occur.

Pricing
Success
Success
Pricing
Success
Success
Personal
Lines
Lines
Personal
Lines
Lines
Prepared for
Tomorrow
Tomorrow
Prepared for
Tomorrow
Tomorrow
Commercial
Lines
Lines
Commercial
Lines
Lines
MN
IA
MO
WI
IL
IN
MI
MI
PA
NY
NJ
DE
CT
MA
TN
• 22-state super-regional
• 2010: $1.4B NPW
• 82% commercial lines
• 18% personal lines
• High tech, high touch business model
• Partner of choice - 980 independent
agents
• Focus on enterprise risk management
• Rated A+ by A.M. Best for 49 years
Who We Are
Financial
Strength
Strength

Pricing
Success
Success
Pricing
Success
Success
Personal
Lines
Lines
Personal
Lines
Lines
Prepared for
Tomorrow
Tomorrow
Prepared for
Tomorrow
Tomorrow
Commercial
Lines
Lines
Commercial
Lines
Lines
Focus on Enterprise Risk Management
• Historically strong capital position
• Business model generates more earnings stability
• Sophisticated underwriting and granular pricing
• Strong reserving practices
• Conservative reinsurance program
• Deep investment management talent
Financial
Strength
Strength

Pricing
Success
Success
Pricing
Success
Success
Personal
Lines
Lines
Personal
Lines
Lines
Prepared for
Tomorrow
Tomorrow
Prepared for
Tomorrow
Tomorrow
Commercial
Lines
Lines
Commercial
Lines
Lines
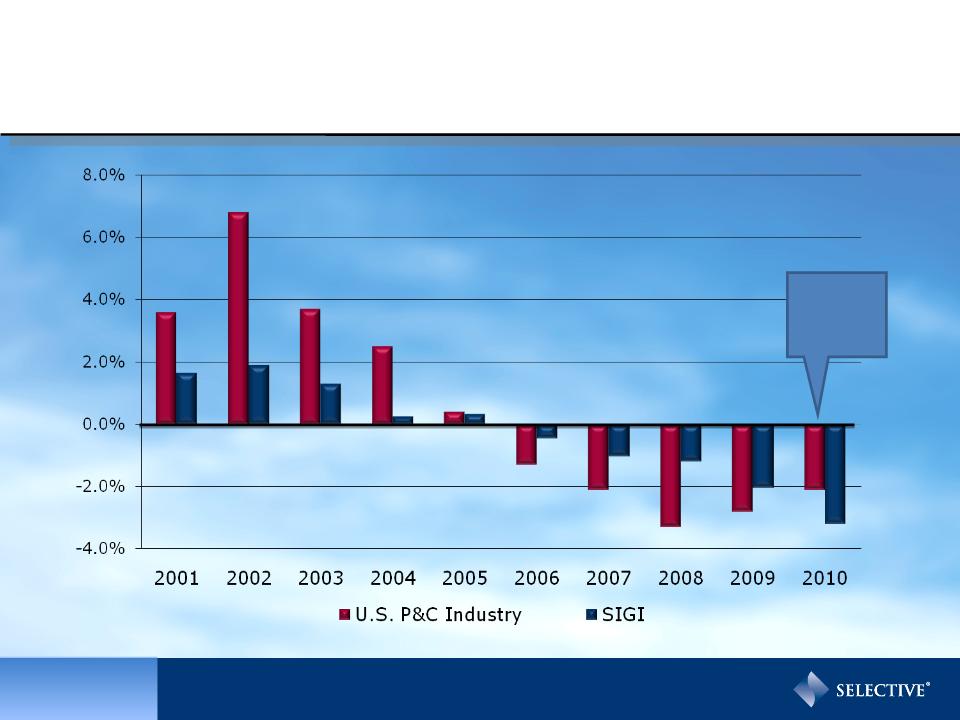
More Earnings Stability
Source: A.M. Best, III
Financial
Strength
Strength

Pricing
Success
Success
Pricing
Success
Success
Personal
Lines
Lines
Personal
Lines
Lines
Prepared for
Tomorrow
Tomorrow
Prepared for
Tomorrow
Tomorrow
Commercial
Lines
Lines
Commercial
Lines
Lines
More Earnings Stability
Note: National Peers include CNA, CB, HIG, TRV and WRB
Financial
Strength
Strength
Source: SNL Financial

Pricing
Success
Success
Pricing
Success
Success
Personal
Lines
Lines
Personal
Lines
Lines
Prepared for
Tomorrow
Tomorrow
Prepared for
Tomorrow
Tomorrow
Commercial
Lines
Lines
Commercial
Lines
Lines
More Earnings Stability
Source: SNL Financial
Note: Regional Peers include CINF, THG, HGIC, STFC and UFCS
(STD. DEV 4.3)
(STD. DEV 5.1)
Financial
Strength
Strength
Pricing
Success
Success
Pricing
Success
Success
Personal
Lines
Lines
Personal
Lines
Lines
Prepared for
Tomorrow
Tomorrow
Prepared for
Tomorrow
Tomorrow
Commercial
Lines
Lines
Commercial
Lines
Lines
Source: AM Best, 2010 Estimate
Adverse/ (Favorable) Points of
Calendar Year Development
Calendar Year Development
Financial
Strength
Strength
AIG takes
$4B
charge
$4B
charge

Pricing
Success
Success
Pricing
Success
Success
Personal
Lines
Lines
Personal
Lines
Lines
Prepared for
Tomorrow
Tomorrow
Prepared for
Tomorrow
Tomorrow
Commercial
Lines
Lines
Commercial
Lines
Lines
Premium-to-Surplus
Financial
Strength
Strength
1 point of Combined Ratio = 1 point of ROE
Sources: ISO, AM Best, III; 2010 AM Best Estimate

Pricing
Success
Success
Pricing
Success
Success
Personal
Lines
Lines
Personal
Lines
Lines
Prepared for
Tomorrow
Tomorrow
Prepared for
Tomorrow
Tomorrow
Commercial
Lines
Lines
Commercial
Lines
Lines
High Quality Investment Portfolio
• Average “AA” bond quality
• Approximately 3.4 year
average duration, including
short-term & cash
• Laddered maturity schedule
– 34% matures within 3 years
– 68% matures within 5 years
• Outsourcing provides access
to broader market expertise
$4.0B Invested Assets
March 31, 2011
March 31, 2011
Financial
Strength
Strength
30 bps of Yield = 1 point of ROE

Pricing
Success
Success
Pricing
Success
Success
Personal
Lines
Lines
Personal
Lines
Lines
Prepared for
Tomorrow
Tomorrow
Prepared for
Tomorrow
Tomorrow
Commercial
Lines
Lines
Commercial
Lines
Lines
Strong Natural Catastrophe
Reinsurance Program
Reinsurance Program
Percentages are net of tax, reinsurance and reinstatement premium.
Data as of 7/10; Equity data as of 3/31/11.
% of Equity at Risk (Near-term basis)
CAT cover: $435M in excess of $40M
Financial
Strength
Strength
RMS v9.0
RMS v11.0
AIR v12
RMS v9.0
RMS v11.0
AIR v12
1% Probability
0.4% Probability
Blended RMS v11.0 and AIR
1% Probability = 5%
0.4% Probability = 18%

PREPARED FOR TOMORROW
- SELECTIVE INSURANCE GROUP, INC. -

Personal
Lines
Lines
Personal
Lines
Lines
Prepared for
Tomorrow
Tomorrow
Prepared for
Tomorrow
Tomorrow
Financial
Strength
Strength
Financial
Strength
Strength
Commercial
Lines
Lines
Commercial
Lines
Lines
Selective’s Commercial Lines
Renewal Pricing Success
Renewal Pricing Success
1Q:09
2Q:09
3Q:09
4Q:09
1Q:10
2Q:10
8 consecutive quarters of positive price
3Q:10
4Q:10
1Q:11
Pricing
Success
Success

Pricing
Success
Personal
Lines
Lines
Personal
Lines
Lines
Prepared for
Tomorrow
Tomorrow
Prepared for
Tomorrow
Tomorrow
Financial
Strength
Strength
Financial
Strength
Strength
Commercial
Lines
Lines
Commercial
Lines
Lines
Why Are We Successful?
• Agency relationships
• Field model
• Sophisticated underwriting tools and granular pricing
– Aggregate quality score by account
– Targeted pricing
– Agency profitability
– Segment performance
– Hazard grade
– System calculated pure price change
• The courage to walk away
Pricing
Success
Success

Pricing
Success
Success
Pricing
Success
Success
Personal
Lines
Lines
Personal
Lines
Lines
Prepared for
Tomorrow
Tomorrow
Prepared for
Tomorrow
Tomorrow
Financial
Strength
Strength
Financial
Strength
Strength
Mix of Business
$1.4B Net Premium Written in 2010
Small Business
Personal Lines

Pricing
Success
Success
Pricing
Success
Success
Personal
Lines
Lines
Personal
Lines
Lines
Prepared for
Tomorrow
Tomorrow
Prepared for
Tomorrow
Tomorrow
Financial
Strength
Strength
Financial
Strength
Strength
Middle Market
• Agency relationships
are key
• Agents act as risk
manager for insureds
• Safety Management
• Field underwriting and
claims model
Commercial
Lines
Lines

Pricing
Success
Success
Pricing
Success
Success
Personal
Lines
Lines
Personal
Lines
Lines
Prepared for
Tomorrow
Tomorrow
Prepared for
Tomorrow
Tomorrow
Financial
Strength
Strength
Financial
Strength
Strength
Commercial
Lines
Field Model
• Local knowledge of insureds
• Full claims/underwriting
authority
• Supported by sophisticated
underwriting tools
• Safety management services
lowers frequency and
increases retention
Over 300 Field Personnel

Pricing
Success
Success
Pricing
Success
Success
Personal
Lines
Lines
Personal
Lines
Lines
Prepared for
Tomorrow
Tomorrow
Prepared for
Tomorrow
Tomorrow
Financial
Strength
Strength
Financial
Strength
Strength
Commercial
Lines
Lines
Agency Focus
• 980 Agents
• 2,000 Storefronts
• Number 1, 2 or 3 in 60% of
agencies appointed for 5 or
more years
• Ease of doing business
• Online agency marketing
portal

Pricing
Success
Success
Pricing
Success
Success
Personal
Lines
Lines
Personal
Lines
Lines
Prepared for
Tomorrow
Tomorrow
Prepared for
Tomorrow
Tomorrow
Financial
Strength
Strength
Financial
Strength
Strength
Commercial
Lines
Lines
Middle Market Product Expansion
• Added 20 new and enhanced products in 2009
• Introduced another 11 in 2010
• New products
• Aging Services, Identity Theft, Cyber Security,
Technology
• Enhanced products
• Resort Endorsement, Contractors GL, Property
Coverage for Municipalities

Pricing
Success
Success
Pricing
Success
Success
Personal
Lines
Lines
Personal
Lines
Lines
Prepared for
Tomorrow
Tomorrow
Prepared for
Tomorrow
Tomorrow
Financial
Strength
Strength
Financial
Strength
Strength
Commercial
Lines
Lines
Small Business
• Less price sensitive
• Better profitability
• Stronger retention
• Straight through
processing

Pricing
Success
Success
Pricing
Success
Success
Personal
Lines
Lines
Personal
Lines
Lines
Prepared for
Tomorrow
Tomorrow
Prepared for
Tomorrow
Tomorrow
Financial
Strength
Strength
Financial
Strength
Strength
Commercial
Lines
Lines
Small Business Growth
$ thousands

Pricing
Success
Success
Pricing
Success
Success
Personal
Lines
Lines
Personal
Lines
Lines
Prepared for
Tomorrow
Tomorrow
Prepared for
Tomorrow
Tomorrow
Financial
Strength
Strength
Financial
Strength
Strength
Commercial
Lines
Lines
Small Business Product Expansion
Expanded Special Contractors &
Merchants PRO BOP
Merchants PRO BOP
Special Contractors
Merchants PRO BOP
2000
2010

Pricing
Success
Success
Pricing
Success
Success
Personal
Lines
Lines
Prepared for
Tomorrow
Tomorrow
Prepared for
Tomorrow
Tomorrow
Financial
Strength
Strength
Financial
Strength
Strength
Commercial
Lines
Lines
Commercial
Lines
Lines
Personal Lines
• Smoothes performance
over the long-term
• Significant source of
agent revenue
• Improving mix of business
and ability to get rate

Pricing
Success
Success
Pricing
Success
Success
Personal
Lines
Lines
Prepared for
Tomorrow
Tomorrow
Prepared for
Tomorrow
Tomorrow
Financial
Strength
Strength
Financial
Strength
Strength
Commercial
Lines
Lines
Commercial
Lines
Lines
Personal Lines Rate Success

Pricing
Success
Success
Pricing
Success
Success
Personal
Lines
Lines
Personal
Lines
Lines
Prepared for
Tomorrow
Tomorrow
Financial
Strength
Strength
Financial
Strength
Strength
Commercial
Lines
Lines
Commercial
Lines
Lines
Driving Down Cost of Goods Sold
• 3 point reduction in loss costs expected over 3 years
– Specialized claims handling model
– Improved workers compensation medical management
– Staff counsel expansion
– Vendor management
– Fraud analytics
– Recovery and subrogation
Anticipate $6M savings from 2011 initiatives

Pricing
Success
Success
Pricing
Success
Success
Personal
Lines
Lines
Personal
Lines
Lines
Prepared for
Tomorrow
Tomorrow
Financial
Strength
Strength
Financial
Strength
Strength
Commercial
Lines
Lines
Commercial
Lines
Lines
Customer Focus to Improve Retention
• Continue to build relationships with end
customers
• 24/7 online access for customer service needs
• Improving customer experience through high
frequency touch points
• Online interactive safety training resources
• Safety management strengthens Selective
brand

Pricing
Success
Success
Pricing
Success
Success
Personal
Lines
Lines
Personal
Lines
Lines
Prepared for
Tomorrow
Tomorrow
Financial
Strength
Strength
Financial
Strength
Strength
Commercial
Lines
Lines
Commercial
Lines
Lines
Long-Term Shareholder Value Creation
Current Dividend Yield: 3.0%
*
*Annualized Indicated Dividend

Financial Highlights 2006 - Q1 2011
|
|
Q1:2011
|
2010
|
2009
|
2008
|
2007
|
2006
|
|
NPW Growth
|
(1.7)%
|
(2.3)%
|
(4.7)%
|
(4.5)%
|
1.4%
|
5.3%
|
|
Operating EPS
|
$0.32
|
$1.35
|
$1.39
|
$1.43
|
$2.16
|
$2.23
|
|
Net Income per Share
|
$0.39
|
$1.20
|
$0.68
|
$0.82
|
$2.59
|
$2.65
|
|
Dividend per Share
|
$0.13
|
$0.52
|
$0.52
|
$0.52
|
$0.49
|
$0.44
|
|
Book Value
|
$20.06
|
$19.95
|
$18.83
|
$16.84
|
$19.81
|
$18.81
|
|
Return on Equity
|
8.0%
|
6.3%
|
3.8%
|
4.5%
|
13.6%
|
15.9%
|
|
Operating Return on Equity
|
6.6%
|
7.1%
|
7.9%
|
7.8%
|
11.3%
|
13.3%
|
|
Statutory Combined Ratio -
Total |
102.6%
|
101.6%
|
100.5%
|
99.2%
|
97.5%
|
95.4%
|
|
- Commercial Lines
|
100.6%
|
100.8%
|
99.8%
|
98.5%
|
95.9%
|
95.0%
|
|
- Personal Lines
|
111.5%
|
106.4%
|
104.4%
|
103.7%
|
107.9%
|
98.2%
|
|
GAAP Combined Ratio - Total
|
103.2%
|
101.6%
|
99.8%
|
100.0%
|
98.0%
|
95.3%
|
|
- Commercial Lines
|
101.7%
|
100.1%
|
98.8%
|
99.2%
|
96.5%
|
94.9%
|
|
- Personal Lines
|
109.7%
|
108.5%
|
105.6%
|
105.1%
|
107.7%
|
97.8%
|

Net Operating Cash Flow
($ in millions)
YTD March 2011: $28M
26%
25%
16%
16%
11%
Cash Flow as % of NPW

Investment Income - After-tax
($ in millions)
YTD March 2011: $32M

Diversified Municipal Portfolio
• $1.4 billion portfolio
• Average “AA” rated
• 36% of portfolio matures
within 3 years
• Diversified among 291
issuers
• NY, CA, NJ, IL represent
$34M or 2.4% of portfolio

Reported Expense Ratio*
SIGI vs. National Peers
SIGI vs. National Peers
*Expense Ratio including Dividends
Note: National Peers include CNA, CB, HIG, TRV and WRB
Source: SNL Financial

Reported Expense Ratio*
SIGI vs. Regional Peers
SIGI vs. Regional Peers
*Expense Ratio including Dividends
Source: SNL Financial
Note: Regional Peers include CINF, THG, HGIC, STFC and UFCS

Insurance Operations Productivity
($ in 000s)
%

%
100.6
104.5
102.2
100.9
Impact of Catastrophe
Combined Ratio excluding Cats
95.4
Statutory Combined Ratios
93.6
95.0
95.9
98.5
99.8
100.8
Commercial Lines Profitability

Granular Pricing Capabilities
4 & 5
Diamond
3
Diamond
1 & 2
Diamond
Quarterly Pricing by Diamond
Higher
Lower
Quality

For lines < $50,000
Percent of Total New Premium Diamond Distribution
WC, BOP, CPP, CA
Commercial Lines New Business Quality
Improvement
Improvement
Higher
Lower
Quality

Retaining our Best Commercial
Business
Business
1 & 2 Diamond
3 Diamond
4 & 5 Diamond
Retention at point of renewal as of March 31, 2011
Higher
Lower
Quality

Commercial Lines Premium by Line of
Business
2010 Statutory Net Premium Written
Business
2010 Statutory Net Premium Written

Premium by Strategic Business Unit
2010 Direct Premium Written
2010 Direct Premium Written