Attached files
| file | filename |
|---|---|
| 8-K - FORM 8-K - POWERSECURE INTERNATIONAL, INC. | c17674e8vk.htm |
| EX-99.1 - EXHIBIT 99.1 - POWERSECURE INTERNATIONAL, INC. | c17674exv99w1.htm |
Exhibit 99.2
| May 24, 2011 |
| Forward Looking Statements Safe Harbor All forward-looking statements made in this presentation are made under the safe harbor provisions of the Private Securities Litigation Reform Act of 1995. Forward-looking statements, which are all statements other than statements of historical facts and include beliefs, opinions, estimates, and projections about future business developments and opportunities and financial guidance, are not guarantees of future performance or events but are subject to risks, uncertainties and other factors that could cause actual results to differ materially from those expressed, projected or implied, including risks and uncertainties set forth in the Company's SEC filings, including but not limited to the Company's most recent Form 10-K and subsequent filings on Form 8-K and 10-Q. Any forward- looking statements in this presentation speak only as of the date hereof, and the Company assumes no duty or obligation to update or revise any forward-looking statements. 2 |
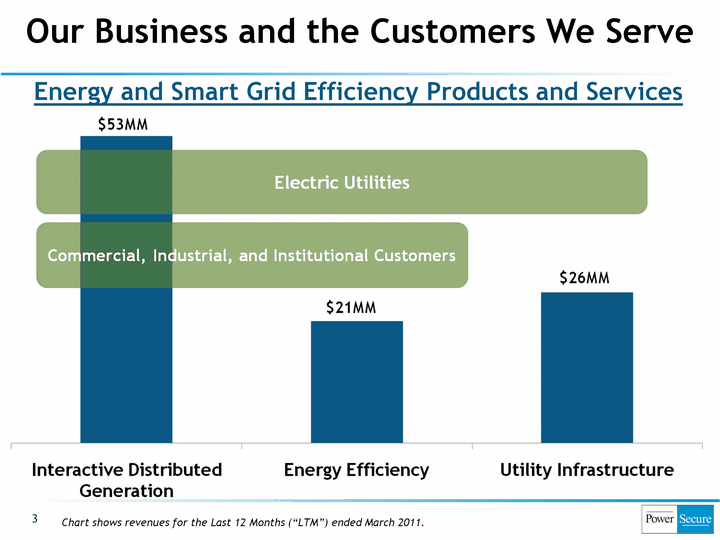
| 3 Our Business and the Customers We Serve Chart shows revenues for the Last 12 Months ("LTM") ended March 2011. Energy and Smart Grid Efficiency Products and Services |
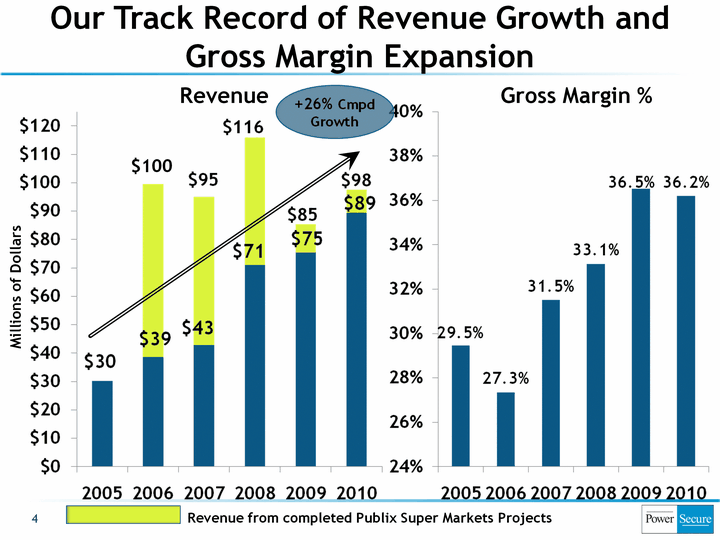
| 4 Revenue Gross Margin % Millions of Dollars Our Track Record of Revenue Growth and Gross Margin Expansion $100 Revenue from completed Publix Super Markets Projects |
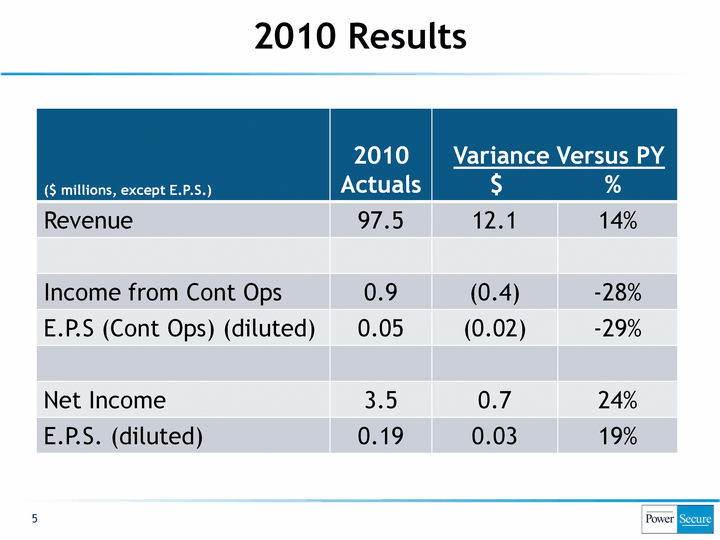
| 5 2010 Results ($ millions, except E.P.S.) 2010Actuals Variance Versus PY $ % Variance Versus PY $ % Revenue 97.5 12.1 14% Income from Cont Ops 0.9 (0.4) -28% E.P.S (Cont Ops) (diluted) 0.05 (0.02) -29% Net Income 3.5 0.7 24% E.P.S. (diluted) 0.19 0.03 19% |
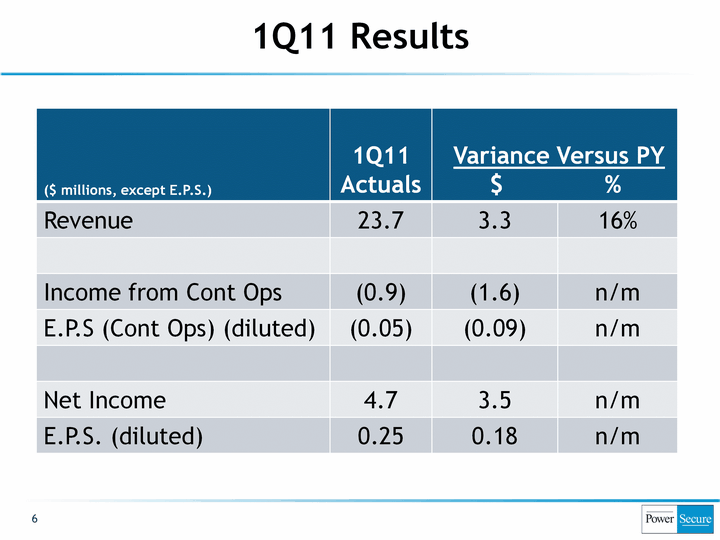
| 6 1Q11 Results ($ millions, except E.P.S.) 1Q11Actuals Variance Versus PY $ % Variance Versus PY $ % Revenue 23.7 3.3 16% Income from Cont Ops (0.9) (1.6) n/m E.P.S (Cont Ops) (diluted) (0.05) (0.09) n/m Net Income 4.7 3.5 n/m E.P.S. (diluted) 0.25 0.18 n/m |
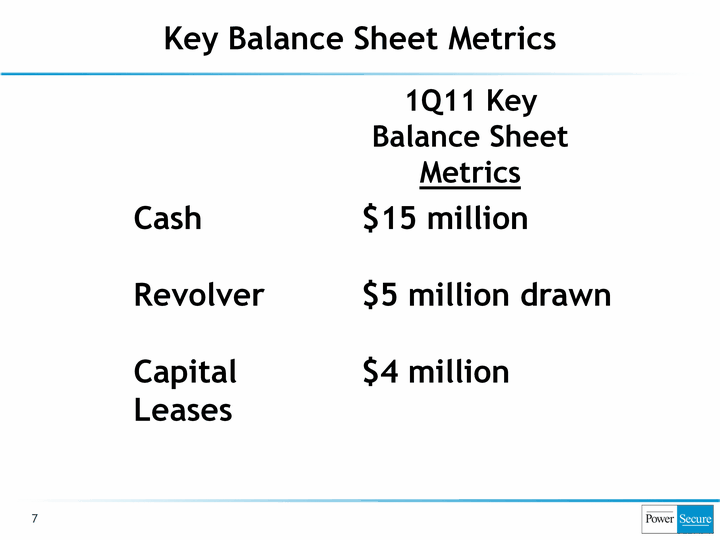
| 7 Key Balance Sheet Metrics CashRevolverCapital Leases $15 million$5 million drawn$4 million 1Q11 KeyBalance SheetMetrics |

| 8 Interactive Distributed Generation: Smart Grid Efficiencies + Standby Power = ROI Electric Utility Customer Site PowerSecure Smart Grid Monitoring Center Interactive Distributed Generation(r) System Monitoring Grid and Peak Load Forecasting Monitoring Utility Power Monitoring Generating System Dispatching Power Monitoring On-Site Power 24/7 Monitoring for Standby and Peak Shaving Proprietary Internet-based Monitoring, Dispatch, and Control "No Pain" Demand Response Utility Tariff and Interconnect Experts |

| 9 Wholesale Price per kWh % of Time Price Level Exists 1. Top Figure -- Source: SP 15 California Price for Day Ahead Power, January 2001-March 2008, as reported by EconStats.com.2. Bottom Figure -- Source: PowerSecure data, utility demand curve for a winter day. Our DG Systems Ran 12,745 Times in 2010, +56% over prior year Optimizing Cost During 200-250 Hours Annually of Highest Peak Demand Peak Shaving Savings Electricity Demand |
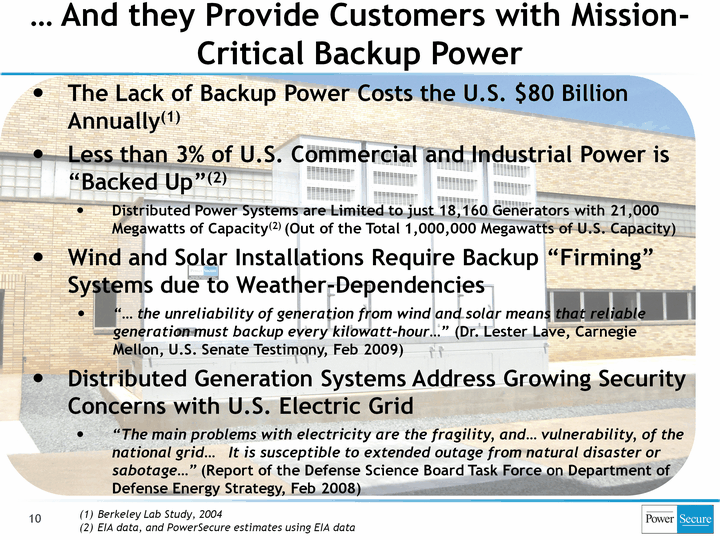
| The Lack of Backup Power Costs the U.S. $80 Billion Annually(1)Less than 3% of U.S. Commercial and Industrial Power is "Backed Up"(2) Distributed Power Systems are Limited to just 18,160 Generators with 21,000 Megawatts of Capacity(2) (Out of the Total 1,000,000 Megawatts of U.S. Capacity)Wind and Solar Installations Require Backup "Firming" Systems due to Weather-Dependencies"... the unreliability of generation from wind and solar means that reliable generation must backup every kilowatt-hour..." (Dr. Lester Lave, Carnegie Mellon, U.S. Senate Testimony, Feb 2009)Distributed Generation Systems Address Growing Security Concerns with U.S. Electric Grid"The main problems with electricity are the fragility, and... vulnerability, of the national grid... It is susceptible to extended outage from natural disaster or sabotage..." (Report of the Defense Science Board Task Force on Department of Defense Energy Strategy, Feb 2008) ... And they Provide Customers with Mission- Critical Backup Power 10 Berkeley Lab Study, 2004EIA data, and PowerSecure estimates using EIA data |
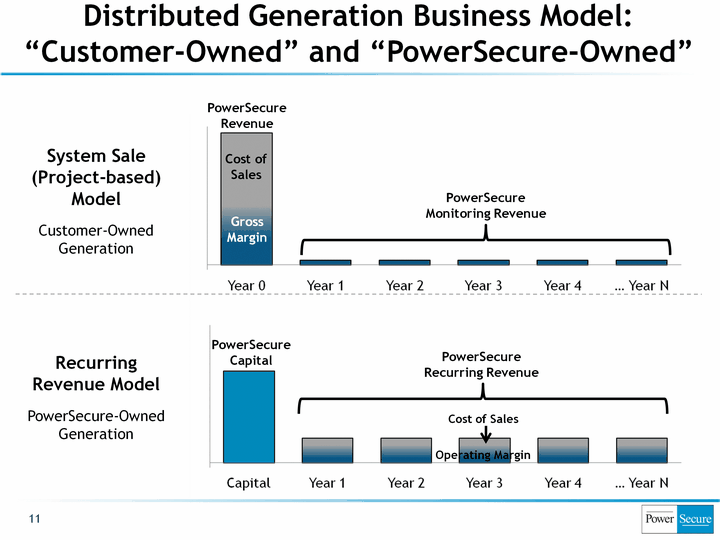
| 11 Recurring Revenue ModelPowerSecure-Owned Generation PowerSecureMonitoring Revenue Distributed Generation Business Model: "Customer-Owned" and "PowerSecure-Owned" System Sale (Project-based) ModelCustomer-Owned Generation PowerSecureRecurring Revenue PowerSecureRevenue Cost ofSales GrossMargin PowerSecureCapital Cost of Sales Operating Margin |
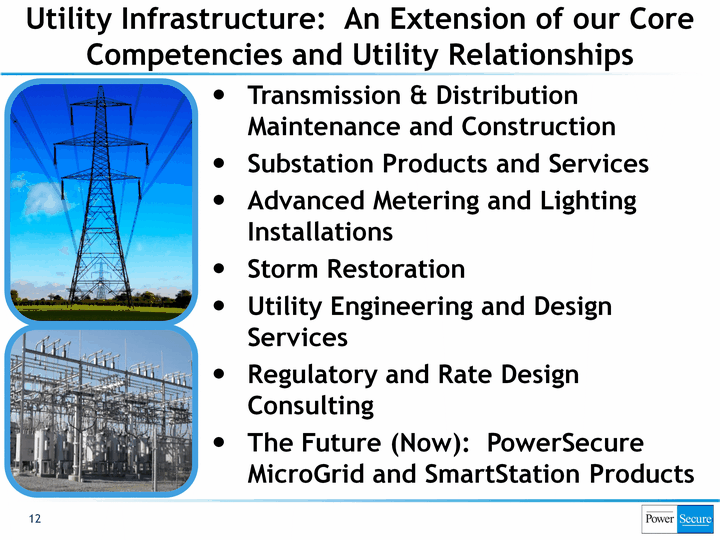
| Utility Infrastructure: An Extension of our Core Competencies and Utility Relationships 12 12 Transmission & Distribution Maintenance and ConstructionSubstation Products and ServicesAdvanced Metering and Lighting InstallationsStorm RestorationUtility Engineering and Design ServicesRegulatory and Rate Design ConsultingThe Future (Now): PowerSecure MicroGrid and SmartStation Products |

| Utility Infrastructure: Business Progression and Growth 13 Our Utility Infrastructure Investment and Progression2005 - Launched Utility Engineering Business2006 - Initiated Larger Scale Infrastructure Projects for Utility Partners and their Federal Customers2007 - Launched Utility Services Business2009 - 3 Major Investor-Owned Utilities Initiate PowerSecure UtilityServices Crews2010 - $30 Million, 3-Year Award to Serve Major IOU2011 - 2 More Investor-Owned Utilities Hire PowerSecureOur Goal: $100 Million Business in 5 YearsIndustry Transmission & Distribution Investment is Estimated to be $890 Billion from 2010-2030(1) (Average of over $40 Billion/Year)Capitalize on our "People Advantage"Investing in "Technology Advantage" - PowerSecure "SmartStation" and "MicroGrid" The Brattle Group, November 2008 - "Transforming America's Power Industry - The Investment Challenge 2010-2030" |
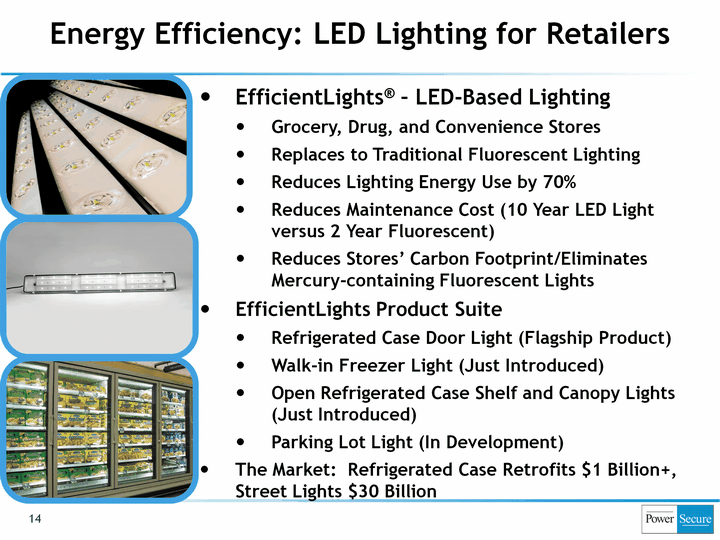
| Energy Efficiency: LED Lighting for Retailers 14 EfficientLights(r) - LED-Based Lighting Grocery, Drug, and Convenience StoresReplaces to Traditional Fluorescent LightingReduces Lighting Energy Use by 70%Reduces Maintenance Cost (10 Year LED Light versus 2 Year Fluorescent)Reduces Stores' Carbon Footprint/Eliminates Mercury-containing Fluorescent LightsEfficientLights Product SuiteRefrigerated Case Door Light (Flagship Product)Walk-in Freezer Light (Just Introduced)Open Refrigerated Case Shelf and Canopy Lights (Just Introduced)Parking Lot Light (In Development)The Market: Refrigerated Case Retrofits $1 Billion+, Street Lights $30 Billion |
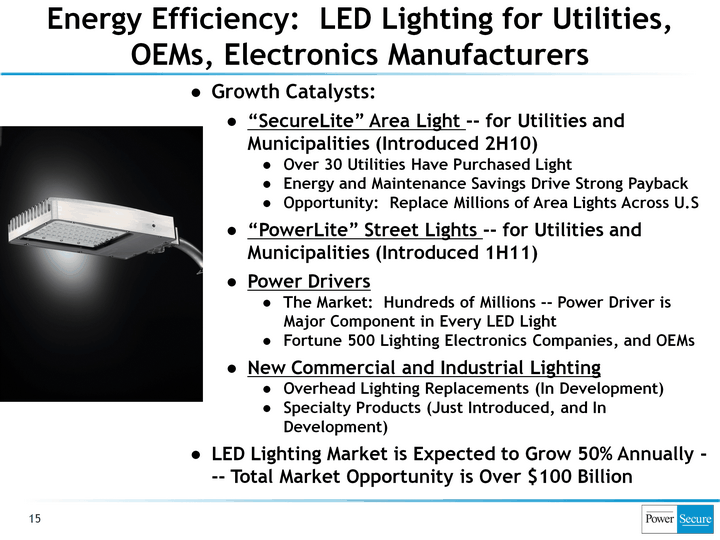
| Growth Catalysts:"SecureLite" Area Light -- for Utilities and Municipalities (Introduced 2H10)Over 30 Utilities Have Purchased Light Energy and Maintenance Savings Drive Strong PaybackOpportunity: Replace Millions of Area Lights Across U.S"PowerLite" Street Lights -- for Utilities and Municipalities (Introduced 1H11)Power DriversThe Market: Hundreds of Millions -- Power Driver is Major Component in Every LED LightFortune 500 Lighting Electronics Companies, and OEMsNew Commercial and Industrial LightingOverhead Lighting Replacements (In Development)Specialty Products (Just Introduced, and In Development)LED Lighting Market is Expected to Grow 50% Annually - -- Total Market Opportunity is Over $100 Billion Energy Efficiency: LED Lighting for Utilities, OEMs, Electronics Manufacturers 15 |
| 16 ...As Our Energy Solutions Deliver Value to a Growing List of Utility Partners and Customers |
| NASDAQ: POWRwww.PowerSecure.com 17 Questions? |
