Attached files
| file | filename |
|---|---|
| 8-K - CURRENT REPORT - FIFTH THIRD BANCORP | d8k.htm |
 Fifth Third Bank | All Rights Reserved
Investor Update
May 2011
Please refer to earnings release dated April 21, 2011 and
10-Q dated May 9, 2011 for further information
Exhibit 99.1 |
 2
Fifth Third Bank | All Rights Reserved
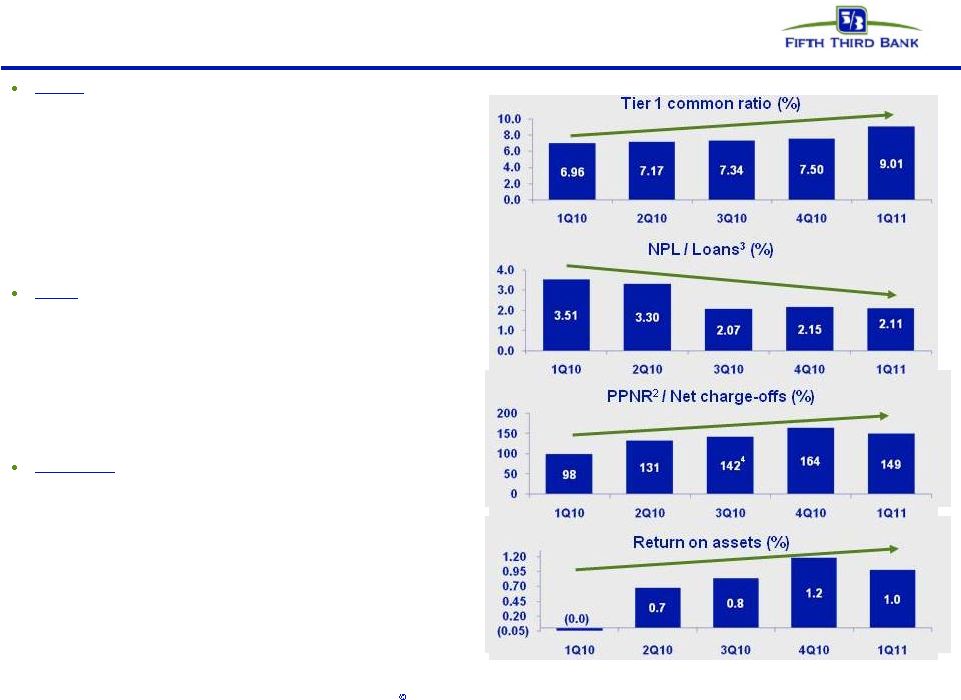
A foundation of continued growth
Capital
–
foundation for continued growth
—
Tier 1 common capital has increased 464bps or $4.0bn¹
—
9.0% Tier 1 common ratio is $1.0bn in excess of internal ~8.0%
target
—
Capital base transformed through series of capital actions
–
$1.7bn common equity offering; $1.0bn senior notes issued;
$3.408bn TARP redemption; $280mm warrant repurchase
—
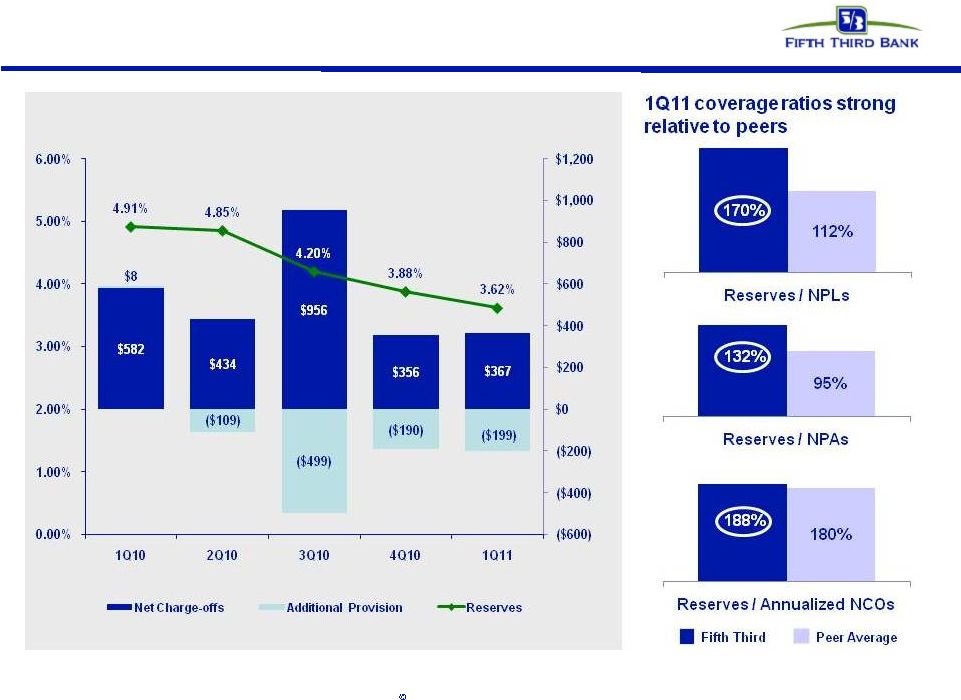
Capital levels supplemented by strong reserve levels
–
Loan loss reserves 3.62% of loans and 170% of NPLs
Credit
–
ongoing discipline driving steady improvement
—
Broad-based improvements in problem loans
–
73% reduction in 90+ day delinquent loans since 3Q09
–
NCO ratio of 1.92%, down 51% (-191 bps) since 3Q09
–
149% PPNR²
/ NCOs in 1Q11
—
Balance sheet risk lowered through asset sales, resolutions
–
$1.3bn (44%) decline in NPLs since 4Q09
Profitability
–
recent results support positive momentum
—
PPNR²
remained stable throughout cycle
—
Profitability metrics have improved significantly from crisis-era
levels, with 4 consecutive profitable quarters
—
Return on assets at or above 1.0% for last two quarters and
exceeds most peers
1
Since December 31, 2008
2
Pre-provision net revenue (PPNR): net interest income plus noninterest income
minus noninterest expense
3
Nonperforming
loans
and
leases
as
a
percent
of
portfolio
loans,
leases
and
other
assets,
including other real estate owned (excludes nonaccrual loans
held-for-sale) 4
Excluding $510mm net charge-offs attributable to credit actions and $127mm in
net BOLI settlement gains |
 3
Fifth Third Bank | All Rights Reserved
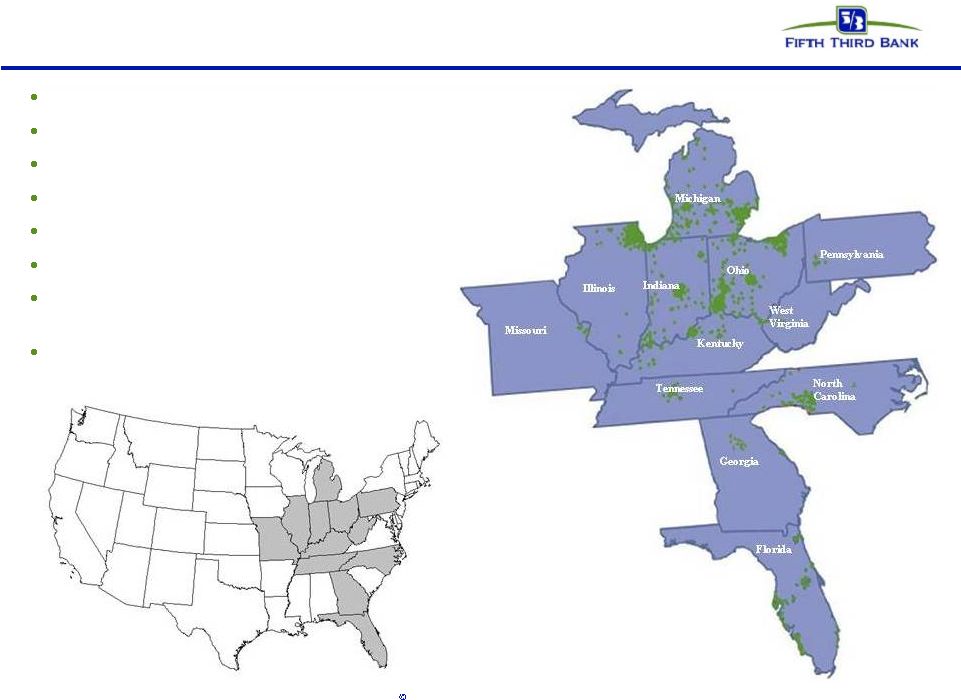
Fifth Third franchise
$110 billion assets
$84 billion deposits
$13 billion market cap
15 affiliates in 12 states
1,310 banking centers
2,453 ATMs
Leading market share in mature Midwest
market
Built strong presence in higher growth
Southeastern markets over past 5 years |
 4
Fifth Third Bank | All Rights Reserved
1Q11 in review
Credit continuing to improve
•
Net charge-offs of $367mm (1.92% of loans and leases) vs. 4Q10
NCOs of $356mm (1.86% of loans and leases)
•
Total
NPAs
of
$2.3B
including
held-for-sale
declined
$126mm
or
5%
sequentially
to
lowest
level
since
2Q08
–
Total
delinquencies
down
12%
sequentially
(lowest
level
since 2006)
•
Provision expense of $168mm, reduction in allowance of $199mm
•
Loan loss allowance of 3.62%; coverage 132% of NPAs and 170% of
NPLs and 1.9x annualized first quarter net charge-offs
Actions driving progress
•
Focusing on credit quality, portfolio management, and loss mitigation
strategies
•
Executing on customer experience and employee engagement
initiatives
•
Enhancing breadth and profitability of offerings and relationships
•
Exit from all crisis-era government programs
Continued strong operating results
•
Net income available to common shareholders of $88mm, or $0.10 per
diluted share
–
Net income reduced by $153mm of discount accretion recorded
in preferred dividends accelerated by February repurchase of
$3.4B in TARP CPP Preferred Stock; $0.17 per share impact
•
Average loan and lease balances excluding held-for-sale up 2%
sequentially; period end loans and leases flat sequentially
•
Return on average assets of 1.0%
•
Strong capital ratios: Tier 1 common 9.0%, Tier 1 capital ratio 12.2%,
Total capital ratio 16.3% |
 5
Fifth Third Bank | All Rights Reserved
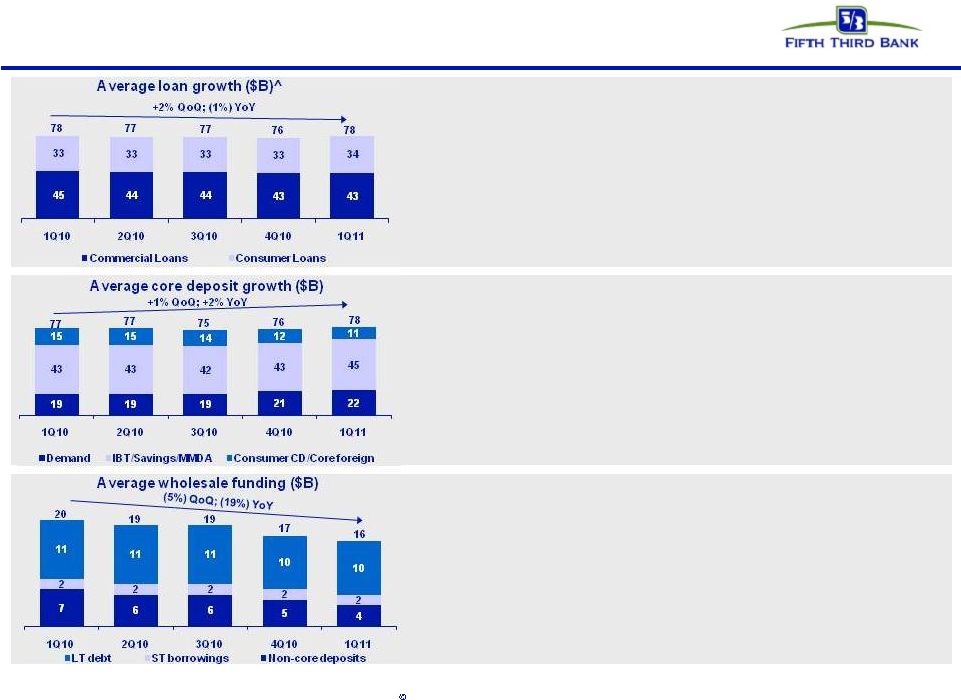
Balance sheet
•
C&I loans up 4% sequentially and 4% from the previous year
•
CRE loans down 3% sequentially and 17% from the previous year
•
Consumer loans up 2% sequentially and 3% from the previous year
•
Warehoused residential mortgage loans held-for-sale were $1.5B at
quarter end versus $2.3B at year-end
•
Core deposit to loan ratio of 100%, up from 97% in 1Q10
•
DDAs up 2% sequentially and 15% year-over-year
•
Retail average transaction deposits up 3% sequentially and 14% from
the previous year, driven by growth in demand deposit, savings, and
interest checking account balances
•
Commercial average transaction deposits up 3% sequentially, driven by
growth in demand deposit and interest checking account balances
–
Excluding public funds balances, commercial average transaction
deposits increased 1% sequentially and 17% over prior year
•
Reduced
wholesale
funding
by
$3.8
billion
from
the
first
quarter
of
2010
–
Non-core deposits down 13% sequentially and 40% from the
previous year
–
Short term borrowings down 8% sequentially and up 16% from the
previous year
–
Long-term debt flat sequentially and down 11% from the previous
year
^ Excludes loans held-for-sale
Note: Numbers may not sum due to rounding |
 6
Fifth Third Bank | All Rights Reserved
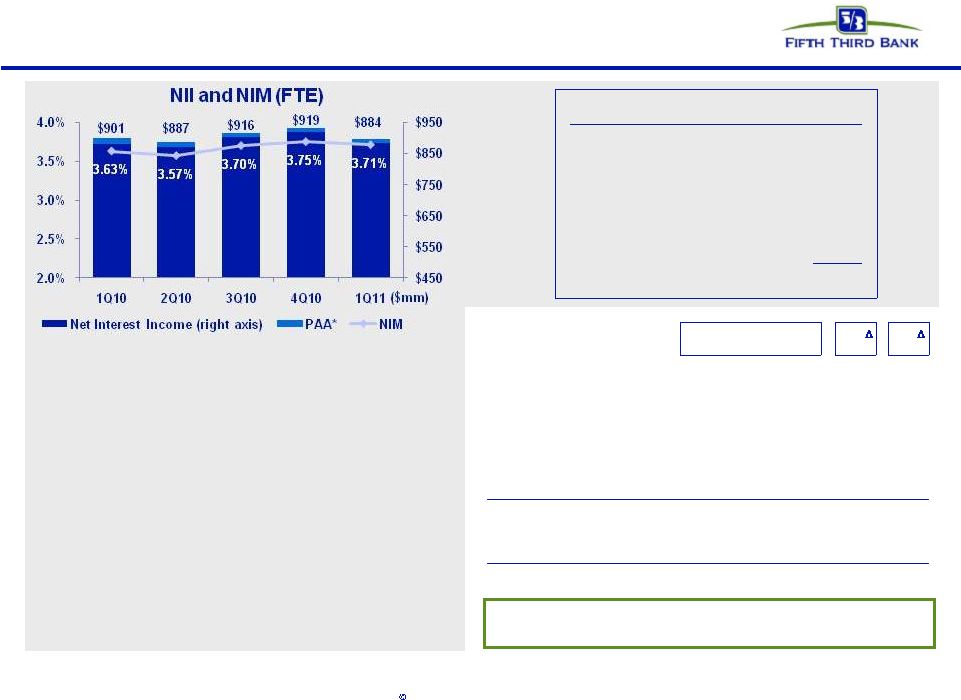
Net interest income
•
Sequential net interest income and net interest
margin (FTE) performance driven by lower
daycount, debt issuance for TARP repayment,
lower mortgage warehouse HFS balances, 4Q10
FTPS, LLC loan refinancing, and lower yields,
partially offset by deposit mix shift and pricing as
well as higher average total loan balances
–
NII down $35mm, or 4%, sequentially and
down $17mm, or 2%, year-over-year
–
NIM down 4 bps sequentially and up 8 bps
year-over-year
•
4Q10 FTPS, LLC loan refinancing represented
nearly half of decline in C&I loan yields
* Represents purchase accounting adjustments included in net interest income.
Yield Analysis
Interest-earning assets
1Q10
4Q10
1Q11
Seq.
(bps)
YoY
(bps)
Commercial and industrial loans
4.61%
4.64%
4.45%
(19)
(16)
Commercial mortgage loans
4.20%
4.17%
4.11%
(6)
(9)
Commercial construction loans
2.92%
2.90%
3.15%
25
23
Commercial leases
4.54%
4.21%
4.17%
(4)
(37)
Residential mortgage loans
5.18%
4.64%
4.67%
3
(51)
Home equity
4.02%
3.98%
3.96%
(2)
(6)
Automobile loans
6.24%
5.41%
5.10%
(31)
(114)
Credit card
10.76%
10.55%
10.43%
(12)
(33)
Other consumer loans and leases
11.87%
18.68%
18.54%
(14)
667
Total loans and leases
4.87%
4.78%
4.67%
(11)
(20)
Taxable securities
4.28%
3.88%
3.96%
8
(32)
Tax exempt securities
3.65%
4.27%
4.77%
50
112
Other short-term investments
0.18%
0.25%
0.25%
-
7
Total interest-earning assets
4.62%
4.52%
4.47%
(5)
(15)
•
Yield on interest-earning assets declined 5 bps
sequentially and 15 bps year-over-year
Net Interest Income Reconciliation
($ in millions)
4Q10 NII (FTE)
$919
Daycount
(12)
FTPS loan restructuring
(8)
Lower mortgage warehouse
(8)
$1B debt issuance
(7)
1Q11 NII (FTE)
$884 |
 7
Fifth Third Bank | All Rights Reserved
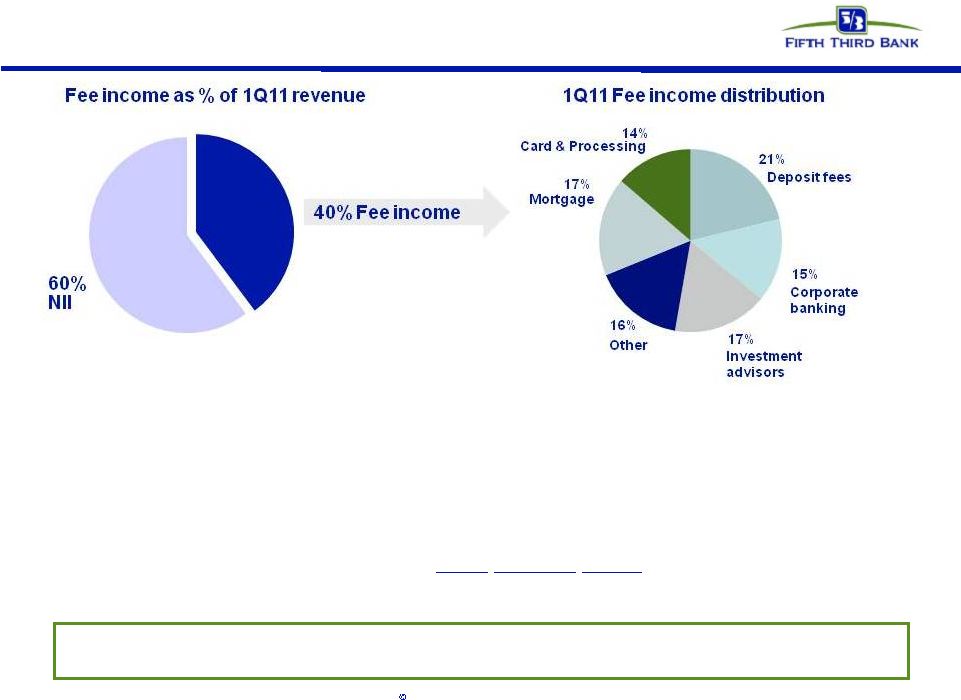
Diverse revenue stream
•
Improving economy supportive of underlying revenue growth from loan growth and
business fee income –
Higher market interest rates in future should add further benefit
•
Negative impact of Reg E fully absorbed into results in 4Q10
•
Timing and initial impact of debit interchange legislation currently unknown
–
Legislative changes possible
–
Timing
of
implementation
2H11,
unless
timeline
altered
–
~3%
of
revenue
at
risk
from
initial
impact
before
mitigating
actions
–
Valuable
product
and
service;
expect
to
mitigate
through
adjustments
to
product
and
service
offerings
Economic trends should support long-term improvement in results through
balance sheet growth and higher business activity |
 8
Fifth Third Bank | All Rights Reserved
Strong relative credit trends
Peer average includes: BBT, CMA, HBAN, KEY, MTB, MI, PNC, RF,STI, USB, WFC, and
ZION Source: SNL Financial and company filings. NPA and NCO ratios exclude
loans held-for-sale and covered assets for peers where appropriate.
*
4Q08
NCOs
included
$800mm
in
NCOs
related
to
commercial
loans
moved
to
held-for-sale;
3Q10
NCOs
included
$510mm
in
NCOs
related
to
loans
sold
or
moved
to
held-for-sale
FITB credit metrics are now generally better than peers
|
 9
Fifth Third Bank | All Rights Reserved
Industry leading reserve levels
Source: SNL and company reports. NPAs/NPLs exclude held-for-sale portion
for all banks as well as covered assets for BBT, USB, and ZION. |
 10
Fifth Third Bank | All Rights Reserved
Strong capital position
Source: SNL Financial and Company reports. HFI NPAs exclude loans
held-for-sale and also exclude covered assets for BBT, USB, and ZION
Capital ratios strong and reflect TARP CPP redemption |
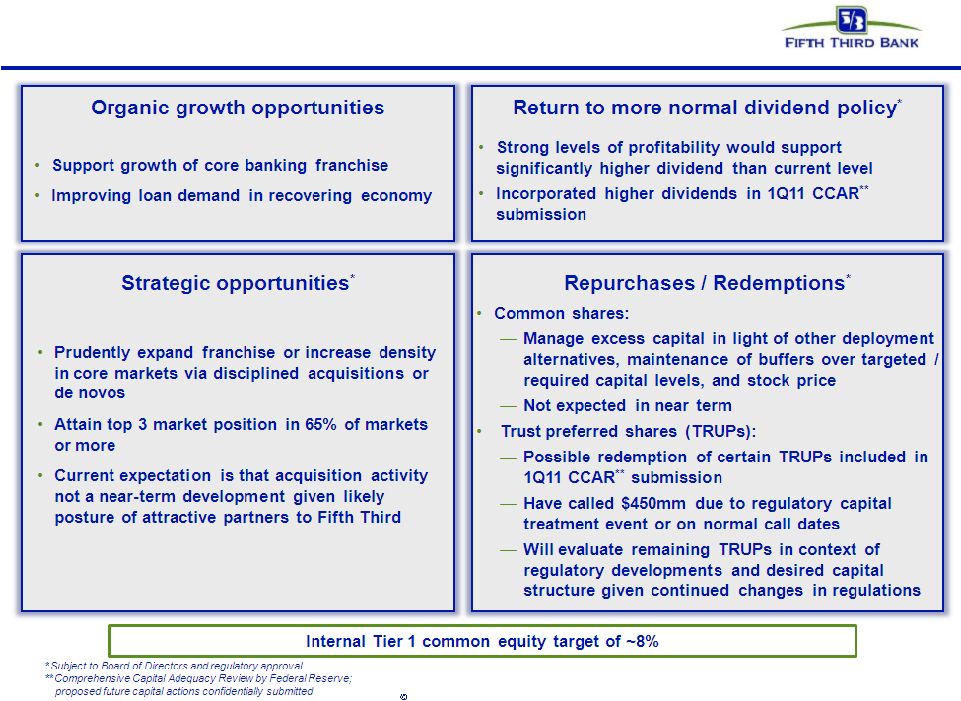 Capital management philosophy
11
FifthThird Bank | All Rights Reserved |
 12
Fifth Third Bank | All Rights Reserved
Customer-centric traditional banking model:
well-positioned for changed financial landscape
Fifth Third’s business model is driven by traditional banking activities
—
Largest bank headquartered within Fifth Third’s core Midwest footprint
—
Focus on expansion and development of businesses where regional leadership
matters –
Retail, small business, and mid-market commercial
–
Select national lines where the bank has a distinctive element (i.e., Fifth Third
Processing Solutions, Indirect Auto, Healthcare)
No significant business at Fifth Third impaired during crisis; traditional banking
focus consistent with direction of financial reform
—
Didn’t / don’t originate or sell CDOs or securitize loans on behalf of
others; no mortgage securitizations outstanding (except ~$100mm HELOC from
2003) —
Didn’t / don’t originate or sell subprime mortgages or Option ARMs
—
Low level of financial system “interconnectedness”
(e.g., Fifth Third loss in Lehman
bankruptcy should be less than $2mm)
—
Little to no impact from Volcker rule (de minimis market maker in derivatives,
proprietary trading);
—
Daily VaR less than $500 thousand
–
Small private equity portfolio ~$100mm (holding company subsidiary)
Fifth Third’s businesses have performed well through the crisis -
expect reintermediation
and the landscape to evolve further toward our traditional strengths
|
 13
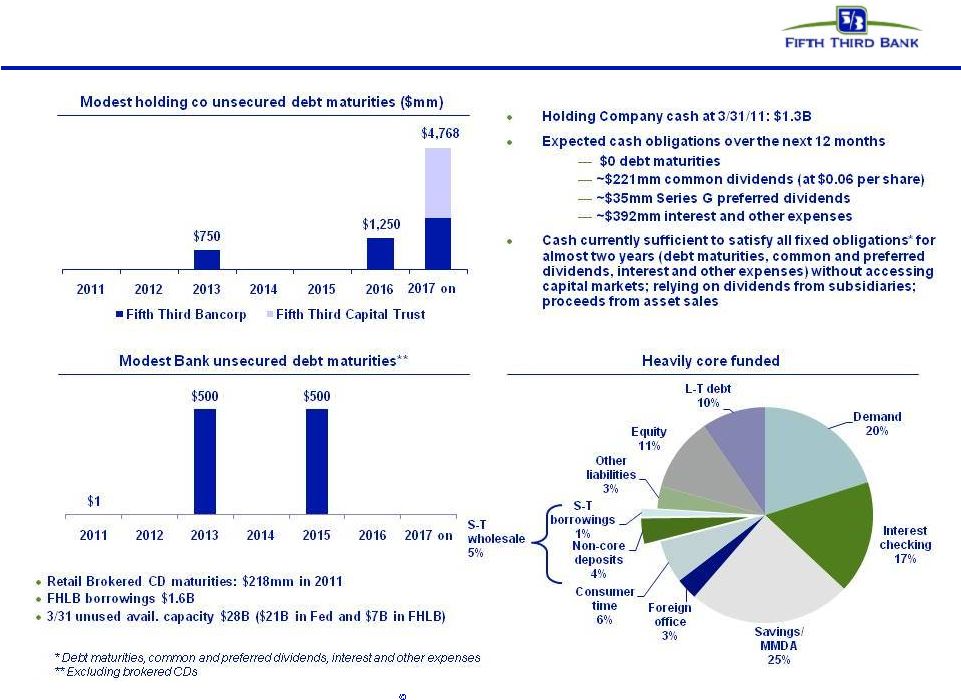
Fifth Third Bank | All Rights Reserved
Well-positioned for the future
•
Holding company cash currently sufficient for approximately 2 years of obligations;
no holding company or Bank debt maturities until 2013
•
Fifth Third has completely exited all crisis-era government support
programs –
Fifth Third is one of the few large banks that have no TLGP-guaranteed
debt Superior capital and liquidity position
•
NCOs below 2%; 1.9x reserves / annualized NCOs
•
$1.2B problem assets addressed through loan sales and transfer to HFS in 3Q10
•
Substantial reduction in exposure to CRE since 1Q09; relatively low CRE exposure
versus peers Proactive approach to risk management
•
Traditional commercial banking franchise built on customer-oriented localized
operating model •
Strong market share in key markets with focus on further improving density
•
Fee income ~40% of total revenues
Diversified traditional banking platform
•
PPNR has remained strong throughout the credit cycle
•
PPNR substantially exceeds annual net charge-offs (149% PPNR / NCOs in
1Q11) •
1.0% ROAA in 1Q11
Strong industry leader in earnings power |
 14
Fifth Third Bank | All Rights Reserved
Cautionary statement
This report contains statements that we believe are “forward-looking statements” within
the meaning of Section 27A of the Securities Act of 1933, as amended, and Rule 175 promulgated
thereunder, and Section 21E of the Securities Exchange Act of 1934, as amended, and Rule 3b-6 promulgated
thereunder. These statements relate to our financial condition, results of operations, plans,
objectives, future performance or business. They usually can be identified by the use of
forward-looking language such as “will likely result,” “may,” “are expected to,” “is anticipated,” “estimate,” “forecast,”
“projected,” “intends to,” or may include other similar words or phrases such as
“believes,” “plans,” “trend,” “objective,” “continue,” “remain,” or similar
expressions, or future or conditional verbs such as “will,” “would,”
“should,” “could,” “might,” “can,” or similar verbs. You should not place undue
reliance on these statements, as they are subject to risks and uncertainties, including but not
limited to the risk factors set forth in our most recent Annual Report on Form 10-K. When
considering these forward-looking statements, you should keep in mind these risks and uncertainties, as well as
any cautionary statements we may make. Moreover, you should treat these statements as speaking only as
of the date they are made and based only on information then actually known to us.
There are a number of important factors that could cause future results to differ materially
from historical performance and these forward-looking statements. Factors that might cause
such a difference include, but are not limited to: (1) general economic conditions and weakening in the
economy, specifically the real estate market, either nationally or in the states in which Fifth Third,
one or more acquired entities and/or the combined company do business, are less favorable than
expected; (2) deteriorating credit quality; (3) political developments, wars or other hostilities may
disrupt or increase volatility in securities markets or other economic conditions; (4) changes in the
interest rate environment reduce interest margins; (5) prepayment speeds, loan origination and
sale volumes, charge-offs and loan loss provisions; (6) Fifth Third’s ability to maintain required capital
levels and adequate sources of funding and liquidity; (7) maintaining capital requirements may limit
Fifth Third’s operations and potential growth; (8) changes and trends in capital markets;
(9) problems encountered by larger or similar financial institutions may adversely affect the banking industry
and/or Fifth Third (10) competitive pressures among depository institutions increase significantly;
(11) effects of critical accounting policies and judgments; (12) changes in accounting policies
or procedures as may be required by the Financial Accounting Standards Board (FASB) or other
regulatory agencies; (13) legislative or regulatory changes or actions, or significant litigation,
adversely affect Fifth Third, one or more acquired entities and/or the combined company or the
businesses in which Fifth Third, one or more acquired entities and/or the combined company are
engaged, including the recently enacted Dodd-Frank Wall Street Reform and Consumer Protection Act;
(14) ability to maintain favorable ratings from rating agencies; (15) fluctuation of Fifth
Third’s stock price; (16) ability to attract and retain key personnel; (17) ability to receive dividends from its
subsidiaries; (18) potentially dilutive effect of future acquisitions on current shareholders’
ownership of Fifth Third; (19) effects of accounting or financial results of one or more
acquired entities; (20) difficulties in separating Fifth Third Processing Solutions from Fifth Third; (21) loss of income
from any sale or potential sale of businesses that could have an adverse effect on Fifth Third’s
earnings and future growth;(22) ability to secure confidential information through the use of
computer systems and telecommunications networks; and (23) the impact of reputational risk created by
these developments on such matters as business generation and retention, funding and liquidity.
You should refer to our periodic and current reports filed with the Securities and Exchange
Commission, or “SEC,” for further information on other factors, which could cause
actual results to be significantly different from those expressed or implied by these forward-looking statements. |
 Fifth Third Bank | All Rights Reserved
Appendix |
 16
Fifth Third Bank | All Rights Reserved
Financial summary
•
1Q11 earnings of $0.10 per diluted share reduced by $153mm ($0.17 per share) of
discount accretion recorded in preferred dividends accelerated by February
repurchase of $3.4B in TARP CPP Preferred Stock •
Return on average assets of 1.0%
•
Decline
in
net
interest
income
and
net
interest
margin
driven
by
two
fewer
days
in
quarter;
debt
issuance
for
TARP
repayment;
lower
mortgage
warehouse
HFS
balances;
and
4Q10
FTPS,
LLC
loan
refinancing
–
Average
core
deposits
up
1%
sequentially,
reflecting
higher
DDA
balances
and
decline
in
consumer
CDs
–
Average
loans
up
2%
sequentially,
reflecting
strength
in
C&I
and
auto
loans
Actual
Seq.
YOY
($ in millions)
1Q10
4Q10
1Q11
$
%
$
%
Average Balances
Commercial loans
$45,169
$42,808
$43,410
$602
1%
($1,759)
(4%)
Consumer loans
33,212
33,428
34,226
798
2%
1,014
3%
Total loans & leases (excl. held-for-sale)
$78,381
$76,236
$77,636
$1,400
2%
($745)
(1%)
Core deposits
$76,262
$76,454
$77,524
$1,070
1%
$1,262
2%
Income Statement Data
Net interest income (taxable equivalent)
$901
$919
$884
($35)
(4%)
($17)
(2%)
Provision for loan and lease losses
590
166
168
2
1%
(422)
(72%)
Noninterest income
627
656
584
(71)
(11%)
(43)
(7%)
Noninterest expense
956
987
918
(69)
(7%)
(38)
(4%)
Net Income (loss)
($10)
$334
$265
($69)
(20%)
$275
NM
Preferred dividends
(62)
(63)
(177)
114
181%
115
184%
Diluted earnings after preferred dividends
($72)
$270
$88
($182)
(67%)
$161
NM
Pre-provision net revenue
$568
$583
$545
($38)
(7%)
($23)
(4%)
Earnings per share, basic
($0.09)
$0.34
$0.10
($0.24)
(71%)
$0.19
NM
Earnings per share, diluted
($0.09)
$0.33
$0.10
($0.23)
(70%)
$0.19
NM
Net interest margin
3.63%
3.75%
3.71%
(4bps)
(1%)
8bps
2%
Return on average assets
(0.04%)
1.18%
0.97%
(21bps)
(18%)
101bps
NM |
 17
Fifth Third Bank | All Rights Reserved
Potential impact of key elements of Dodd-Frank Act
and other recent financial legislation*
Scope of activity
Potential impact**
Volcker Rule /
Derivatives
•
Vast majority of derivatives activities are exempted
(FITB generally not a market maker)
•
Any proprietary trading de minimis
•
“P/E”
fund investments ~$100mm (<1% of Tier 1
capital)
•
Expect minimal financial impact from loss of existing
revenue
•
Potentially higher compliance costs despite small levels
of non-exempt activities
Debit
Interchange
(Durbin
Amendment)
•
1Q11 debit interchange revenue of $54mm
•
1Q11 debit interchange $ volume: $4.1B
–
Signature $3.3B, PIN $.8B
–
Signature 89mm, PIN 20mm
•
Fed has proposed limits on debt interchange; proposal
currently out for comment
•
Proposals would apply caps of $0.12 or $0.07 per transaction
(e.g., on volume which in 1Q11 was 109
million transactions)
•
If proposal implemented as written, we would expect
substantial mitigation of any reduction in revenue through
actions by FITB and competitors to recapture costs of providing
this service to customers and merchants
Deposit
Insurance
•
Current assessed base (Deposits): ~$78B
•
Proposed assessed base (Assets-TE): ~$96B
•
FITB rate under new industry assessment, based
upon large bank scorecard, less than rate under old
assessment
•
Lower due to reduced share of assessed base
Reg. E
•
Requires
customers
to
“opt-in”
to
allow
non-recurring
electronic overdrafts (e.g. debit, ATM) from accounts
•
Impact fully absorbed in run-rate
Potential impact of these and other elements of financial regulatory reform, such as
CFPA activities and many other aspects, are unknown at this time
TRUPs exclusion
(Collins
Amendment)
•
~280 bps of non-common Tier 1 capital in capital
structure
•
>300 bps of non-common Tier 1 currently
–
Expected to be more than needed post-Basel III
•
3-year transition period begins 2013
•
Will manage capital structure to desired composition
* Based on current understanding of legislation. ** Potential impact, as noted
above, is not intended to be inclusive of all potential impacts that may result from implementation
of legislation and does not include benefit of mitigation activities. Please refer
also to cautionary statement. •
1Q11 debit interchange transaction volume: 109mm |
 18
Fifth Third Bank | All Rights Reserved
Liquidity position |
 19
Fifth Third Bank | All Rights Reserved
Mortgage repurchase overview
Demand requests and repurchase losses remain volatile
and near-term repurchase losses are expected to remain
elevated
Virtually all sold loans and new claims relate to GSEs or
GNMA
—
98% of outstanding balance of loans sold
—
92% of outstanding claims
Losses remain focused in 2006 thru 2008 vintages.
Majority of outstanding balances of the serviced for others
portfolio relates to origination activity in 2009 and later
Claims and exposure related to whole loan sales (no
outstanding first mortgage securitizations)
Repurchase Reserves* ($ in millions)
1Q10
2Q10
3Q10
4Q10
1Q11
Beginning balance
$58
$84
$85
$103
$101
Net reserve additions
39
19
47
21
10
Repurchase losses
(13)
(18)
(29)
(23)
(23)
Ending balance
$84
$85
$103
$101
$88
Outstanding Counterparty Claims ($ in millions)
Outstanding Balance of Sold Loans ($ in millions)
2005 and prior
GSE
GNMA
Private
Total
$8,876
$325
$648
$9,850
2006
2,036
69
309
2,414
2007
3,331
101
272
3,705
2008
3,460
802
3
4,262
2009 and later
27,432
7,782
1
32,214
Total
$45,135
$9,079
$1,233
$55,447
*
Includes reps and warranty reserve ($73mm) and reserve for loans
sold with recourse ($14mm). |
 20
Fifth Third Bank | All Rights Reserved
Troubled debt restructurings (TDR) overview
* Fifth Third data includes changes made to align with OCC/OTS methodology (i.e.
excludes government loans, closed loans and OREO from calculations) |
 21
Fifth Third Bank | All Rights Reserved
NPL HFI Rollforward
Commercial
1Q09
2Q09
3Q09
4Q09
1Q10
2Q10
3Q10
4Q10
1Q11
Beginning NPL Amount
1,406
1,937
2,110
2,430
2,392
2,172
1,980
1,261
1,214
New nonaccrual loans
799
544
832
602
405
310
290
224
299
Paydowns, payoffs, sales and net other activity
(157)
(190)
(246)
(332)
(425)
(402)
(630)
(168)
(199)
Charge-offs
(111)
(181)
(266)
(308)
(200)
(100)
(379)
(103)
(103)
Ending Commercial NPL
1,937
2,110
2,430
2,392
2,172
1,980
1,261
1,214
1,211
Consumer
1Q09
2Q09
3Q09
4Q09
1Q10
2Q10
3Q10
4Q10
1Q11
Beginning NPL Amount
457
459
477
517
555
561
550
323
466
New nonaccrual loans
157
125
160
152
137
205
157
243
113
Net other activity
(155)
(107)
(120)
(114)
(131)
(216)
(384)
(100)
(145)
Ending Consumer NPL
459
477
517
555
561
550
323
466
434
Total NPL
2,396
2,587
2,947
2,947
2,733
2,530
1,584
1,680
1,645
Total new nonaccrual loans - HFI
956
669
992
754
542
515
447
467
412
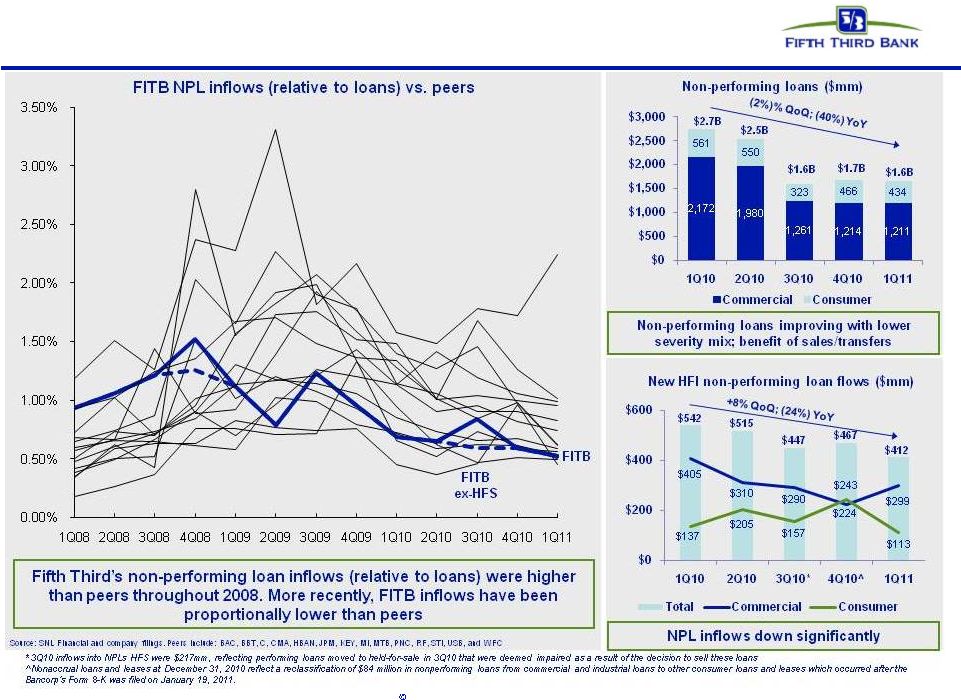
NPL Rollforward
Significant improvement in NPL inflows over past two years
Nonaccrual loans and leases at December 31, 2010 reflect a reclassification of $84
million in nonperforming loans from commercial and industrial loans to other consumer loans and leases
which occurred after the Bancorp's Form 8-K was filed on January 19, 2011.
|
 22
Fifth Third Bank | All Rights Reserved
Non-performing loans |
 23
Fifth Third Bank | All Rights Reserved
Commercial & industrial* |
 24
Fifth Third Bank | All Rights Reserved
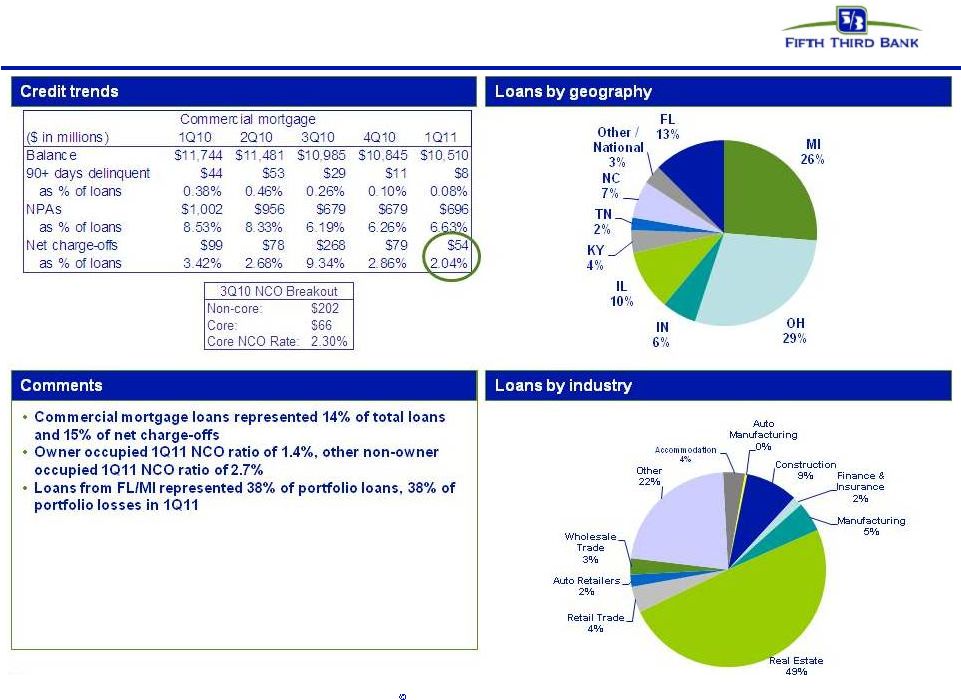
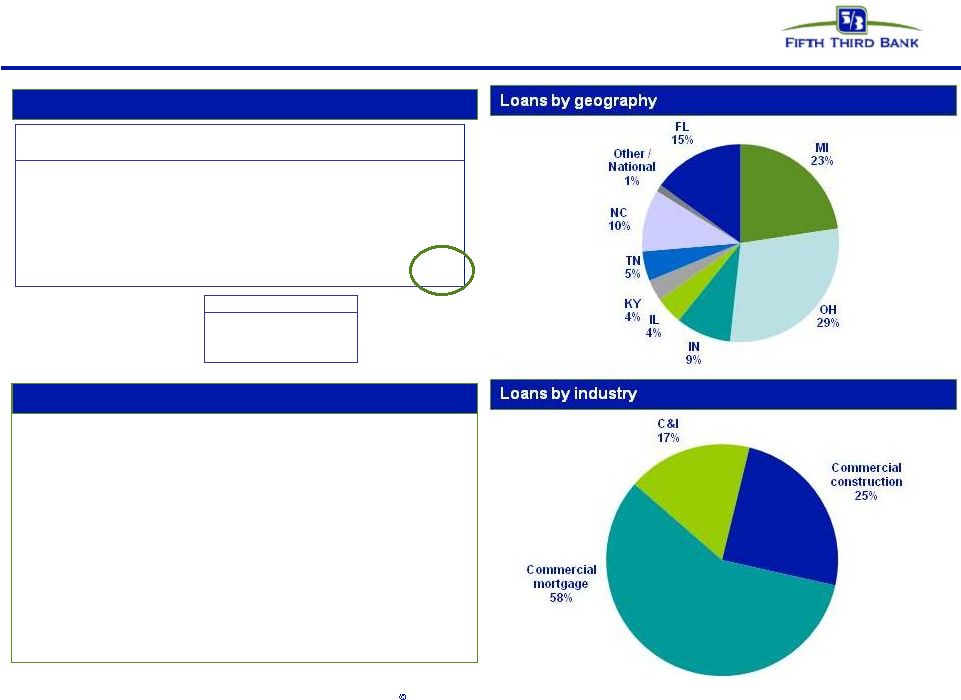
Commercial mortgage*
* NPAs exclude loans held-for-sale.
3Q10 includes losses on loans transferred to held-for-sale
|
 25
Fifth Third Bank | All Rights Reserved
($ in millions)
1Q10
2Q10
3Q10
4Q10
1Q11
Balance
$3,277
$2,965
$2,349
$2,048
$1,980
90+ days delinquent
$9
$37
$5
$3
$23
as % of loans
0.28%
1.24%
0.21%
0.13%
1.16%
NPAs
$569
$482
$291
$259
$248
as % of loans
17.36%
16.26%
12.40%
12.65%
12.53%
Net charge-offs
$78
$43
$121
$10
$26
as % of loans
8.57%
5.46%
16.58%
1.88%
5.24%
Commercial construction
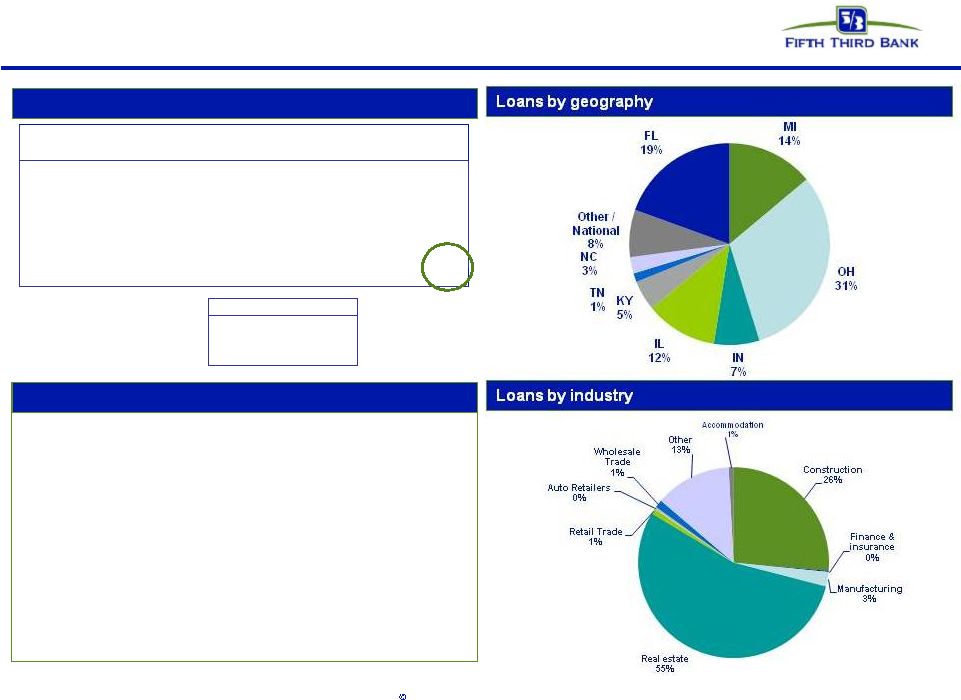
Commercial construction*
Credit trends
Comments
* NPAs exclude loans held-for-sale.
3Q10 includes losses on loans transferred to held-for-sale
•
Commercial construction loans represented 3% of total loans
and 7% of net charge-offs
•
Loans from FL/MI represented 32% of portfolio loans, 17% of
portfolio losses in 1Q11
Non-core:
$77
Core:
$44
Core NCO Rate:
5.99%
3Q10 NCO Breakout |
 26
Fifth Third Bank | All Rights Reserved
($ in millions)
1Q10
2Q10
3Q10
4Q10
1Q11
Balance
$1,324
$1,207
$824
$699
$651
90+ days delinquent
$6
$12
$3
$1
$1
as % of loans
0.43%
1.03%
0.37%
0.12%
0.16%
NPAs
$520
$431
$280
$259
$249
as % of loans
39.28%
35.68%
33.97%
37.12%
38.30%
Net charge-offs
$81
$48
$127
$19
$22
as % of loans
22.89%
15.01%
48.74%
10.08%
13.04%
Homebuilders/developers
Homebuilders/developers*
Credit trends
Comments
•
Originations of builder/developer loans suspended in 2007
•
Remaining portfolio balance of $651mm, down 80% from peak
of $3.3B in 2Q08; represents approximately 1% of total loans
and 1.5% of commercial loans
•
$22mm of NCOs (27% commercial mortgage, 67% commercial
construction, 6% C&I)
•
$249mm of NPAs (65% commercial mortgage, 30%
commercial construction, 5% C&I), down $10mm sequentially
* NPAs exclude loans held-for-sale.
3Q10 includes losses on loans transferred to held-for-sale
Non-core:
$95
Core:
$32
Core NCO Rate:
12.25%
3Q10 NCO Breakout |
 27
Fifth Third Bank | All Rights Reserved
($ in millions)
1Q10
2Q10
3Q10
4Q10
1Q11
Balance
$7,918
$7,707
$7,975
$8,956
$9,530
90+ days delinquent
$157
$107
$111
$100
$98
as % of loans
1.98%
1.38%
1.39%
1.12%
1.03%
NPAs
$521
$549
$328
$368
$338
as % of loans
6.57%
7.12%
4.11%
4.11%
3.55%
Net charge-offs
$88
$85
$204
$62
$65
as % of loans
4.46%
4.35%
10.37%
2.93%
2.82%
Residential mortgage
Residential mortgage
Credit trends
Comments
^ Includes acquired loans where FICO at origination is not available
3Q10 includes losses on loans sold
During 1Q09 the Bancorp modified its nonaccrual policy to exclude TDR loans less
than 90 days past due because they were performing in accordance with restructured terms. For
comparability purposes, prior periods were adjusted to reflect this
reclassification. •
Residential
mortgage
loans
represented
12%
of
total
loans
and
18% of net charge-offs
•
FL portfolio 19% of residential mortgage loans driving 57% of
portfolio losses
•
FL lots ($184mm) running at 32% annualized loss rate (YTD)
Non-core:
$123
Core:
$81
Core NCO Rate:
4.10%
3Q10 NCO Breakout |
 28
Fifth Third Bank | All Rights Reserved
($ in millions)
1Q10
2Q10
3Q10
4Q10
1Q11
Balance
$10,280
$10,149
$10,004
$9,815
9,585
90+ days delinquent
$60
$61
$61
$59
$59
as % of loans
0.58%
0.60%
0.61%
0.60%
0.62%
Net charge-offs
$43
$37
$40
$40
$39
as % of loans
1.68%
1.45%
1.57%
1.61%
1.64%
Home equity - direct
($ in millions)
1Q10
2Q10
3Q10
4Q10
1Q11
Balance
$1,906
$1,838
$1,770
$1,698
1,637
90+ days delinquent
$29
$29
$26
$25
$25
as % of loans
1.53%
1.57%
1.46%
1.46%
1.51%
Net charge-offs
$30
$24
$26
$25
$24
as % of loans
6.45%
5.29%
5.87%
5.74%
5.88%
Home equity - brokered
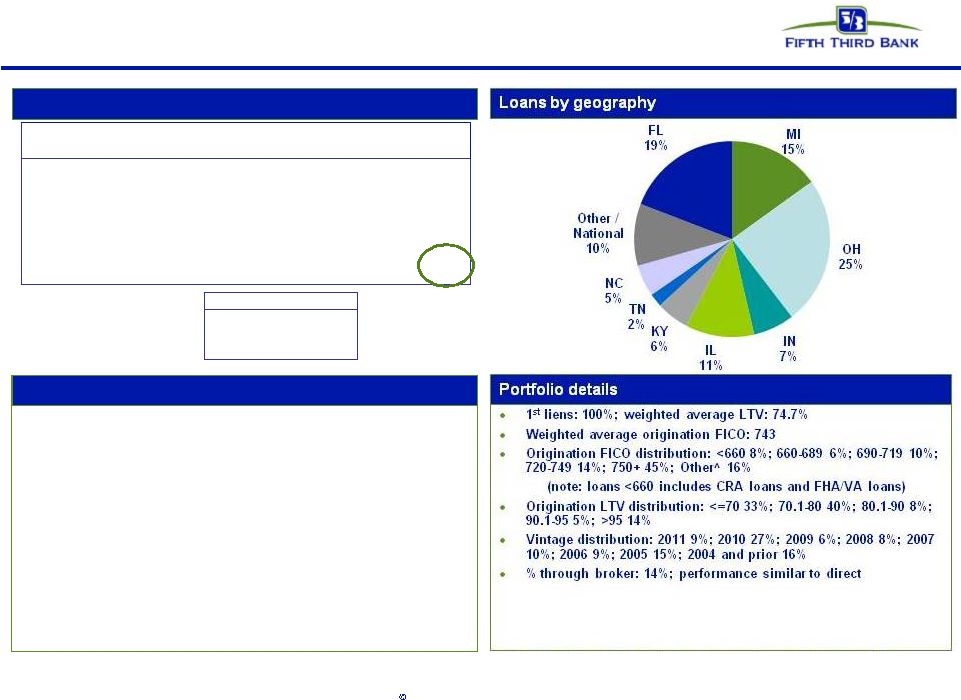
Home equity
1
st
liens: 30%; 2
nd
liens: 70%
Weighted average origination FICO: 749
Origination FICO distribution^: <660 4%; 660-689 7%; 690-719 13%;
720-749 17%; 750+ 50%; Other 9%
Average CLTV: 74% Origination CLTV distribution: <=70 39%; 70.1-80 22%;
80.1-90 18%; 90.1-95 7%; >95 14%
Vintage distribution: 2011 1%; 2010 3%; 2009 4%; 2008 11%; 2007 11%; 2006
15%; 2005 14%; 2004 and prior 40%
% through broker channels: 15% WA FICO: 735 brokered, 751 direct; WA
CLTV: 88% brokered; 72% direct
Portfolio details
Comments
Credit trends
Home equity loans represented 15% of total loans and 17% of net
charge-offs
Approximately 15% of portfolio in broker product driving 38% total
loss
Approximately
one
third
of
Fifth
Third
2
nd
liens
are
behind
Fifth
Third
1
st
liens
2005/2006 vintages represent approximately 30% of portfolio; account
for 52% of losses
Aggressive home equity line management strategies in place
Note: Brokered and direct home equity net charge-off ratios are calculated
based on end of period loan balances ^ Includes acquired loans where FICO at
origination is not available |
 29
Fifth Third Bank | All Rights Reserved
Loans ($B)
% of
FITB
NPAs ($M)
% of
FITB
NCOs
($M)
% of
FITB
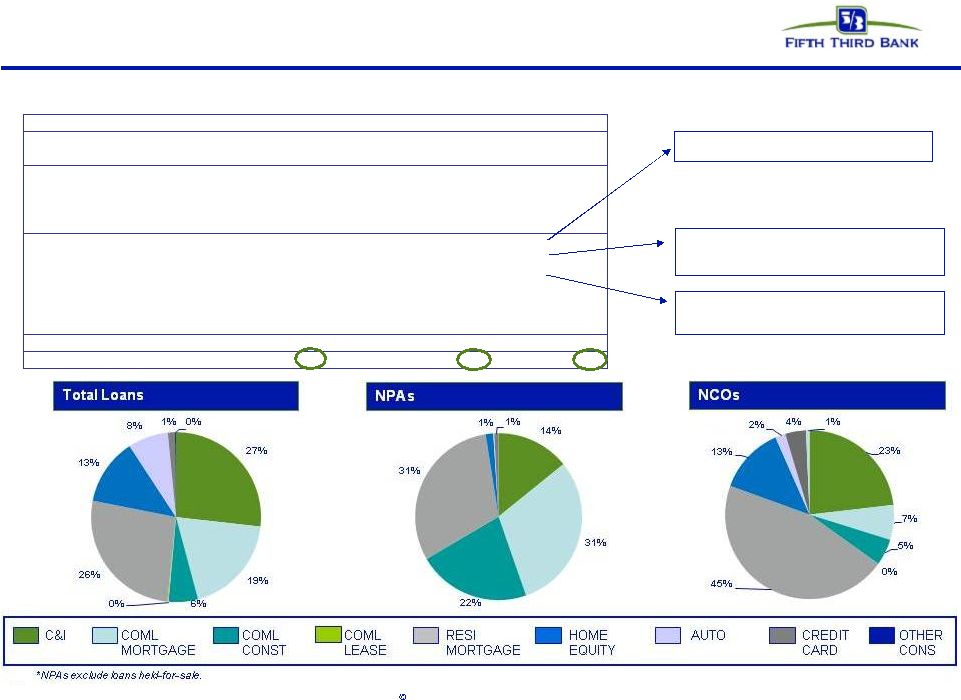
Commercial loans
1.8
7%
73
12%
19
23%
Commercial mortgage
1.3
13%
157
22%
5
10%
Commercial construction
0.4
19%
112
45%
4
16%
Commercial lease
0.0
0%
0
0%
-
0%
Commercial
3.6
8%
342
21%
29
18%
Mortgage
1.8
19%
95
28%
37
58%
Home equity
0.9
8%
8
11%
11
17%
Auto
0.5
5%
1
7%
2
8%
Credit card
0.1
5%
4
8%
3
11%
Other consumer
0.0
2%
0
0%
1
2%
Consumer
3.3
10%
108
20%
53
26%
Total
6.9
9%
450
21%
82
22%
Florida
Florida market*
Deterioration in real estate values having effect on credit trends as evidenced by
increased NPA/NCOs in real estate related products Weak commercial real
estate market Losses due to significant declines in
valuations
Valuations; relatively small home
equity portfolio |
 30
Fifth Third Bank | All Rights Reserved
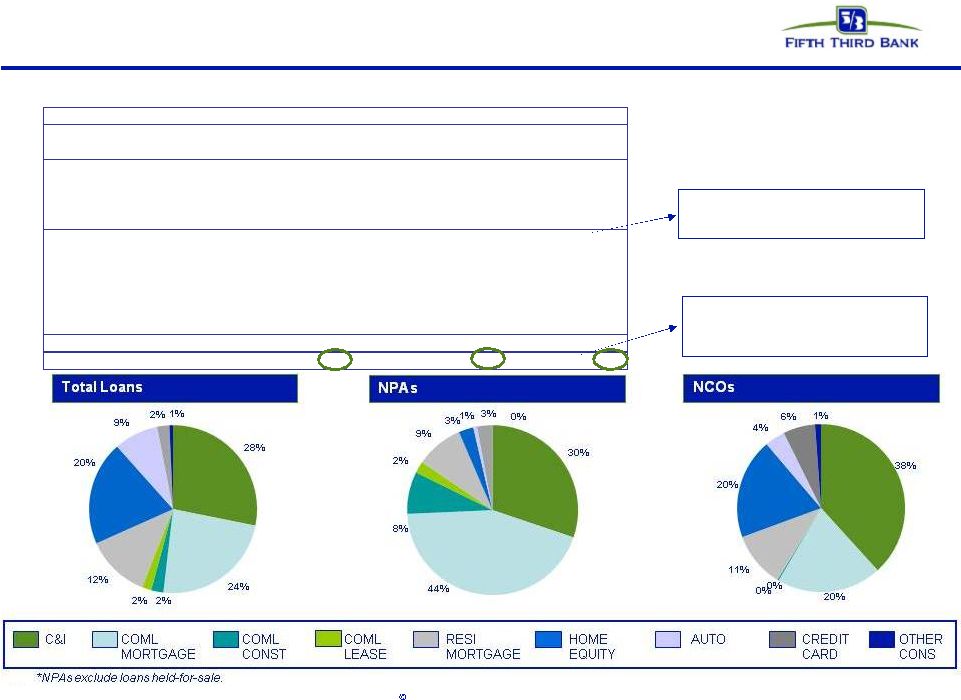
Loans ($B)
% of
FITB
NPAs ($M)
% of
FITB
NCOs
($M)
% of
FITB
Commercial loans
3.3
12%
109
18%
28
34%
Commercial mortgage
2.8
26%
160
23%
15
28%
Commercial construction
0.3
14%
29
12%
0
1%
Commercial lease
0.2
6%
8
35%
0
0%
Commercial
6.5
15%
307
19%
44
27%
Mortgage
1.4
15%
33
10%
8
12%
Home equity
2.3
21%
10
14%
14
23%
Auto
1.0
9%
3
17%
3
14%
Credit card
0.3
15%
11
20%
5
15%
Other consumer
0.1
14%
0
0%
1
3%
Consumer
5.1
15%
56
10%
31
15%
Total
11.7
15%
363
17%
74
20%
Michigan
Michigan market*
Deterioration in home price values coupled with weak economy impacting credit trends
due to frequency of defaults and severity Negative impact from housing
valuations, economy,
unemployment
Economic weakness impacts
commercial real estate market |