Attached files
Exhibit 13
Providing personal, prompt, efficient service is the goal of Bank of Walterboro. We are committed to the concept of “Hometown Banking” and hope we can be of service to you. “Strong roots – strong branches.”
Contents:
| Shareholder Letter |
2 | |||
| Summary of Selected Financial Data |
3 | |||
| Financial Charts |
4-7 | |||
| Management’s Discussion and Analysis |
8-24 | |||
| Management’s Annual Report on Internal Control Over Financial Reporting |
25 | |||
| Report of Independent Registered Public Accounting Firms |
26-27 | |||
| Consolidated Balance Sheets |
28 | |||
| Consolidated Statements of Operations |
29 | |||
| Consolidated Statements of Changes in Shareholders’ Equity and Comprehensive Income |
30 | |||
| Consolidated Statements of Cash Flows |
31 | |||
| Notes to Consolidated Financial Statements |
32-52 | |||
| Directors, Officers and Staff |
53 | |||
| Corporate Data |
54 | |||
| Services |
55 |
Member FDIC
COMMUNITYCORP AND SUBSIDIARY
Dear Shareholder,
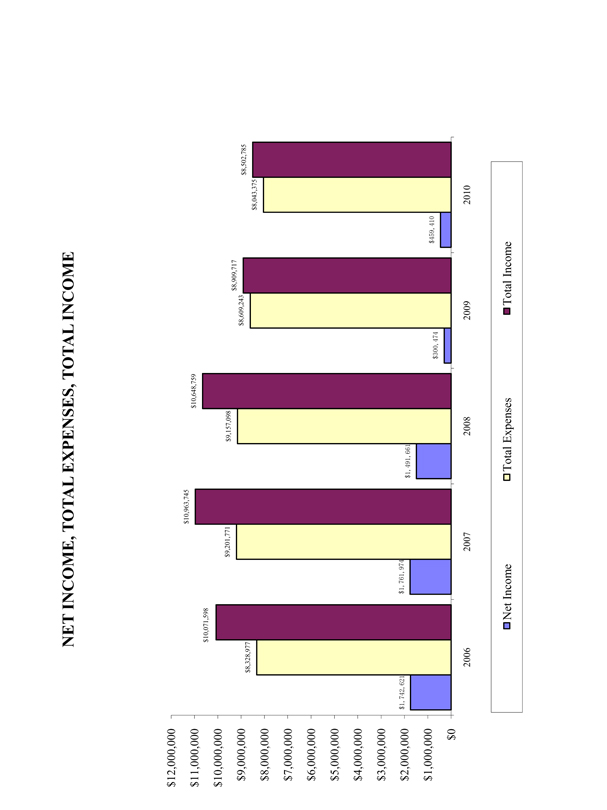
It is a pleasure to report the progress of Communitycorp and its subsidiary, the Bank of Walterboro, during 2010. As you are aware, our local and national economy has been significantly depressed over the past several years and it has been a challenging time for the banking industry. For 2010 and 2009, many South Carolina banks reported operating losses for the first time. In spite of the difficult challenges we faced during 2010, we were able to generate a net income of $459,410, or $1.97 per share for 2010, compared to a net income of $300,474, or a $1.28 per share for 2009. This represents an increase of $158,936, or 52.90%. Additionally, by decreasing our total assets and liabilities, we were able to increase our capital to asset ratio to 11.32% as of year-end 2010 from 10.73% as of year-end 2009.
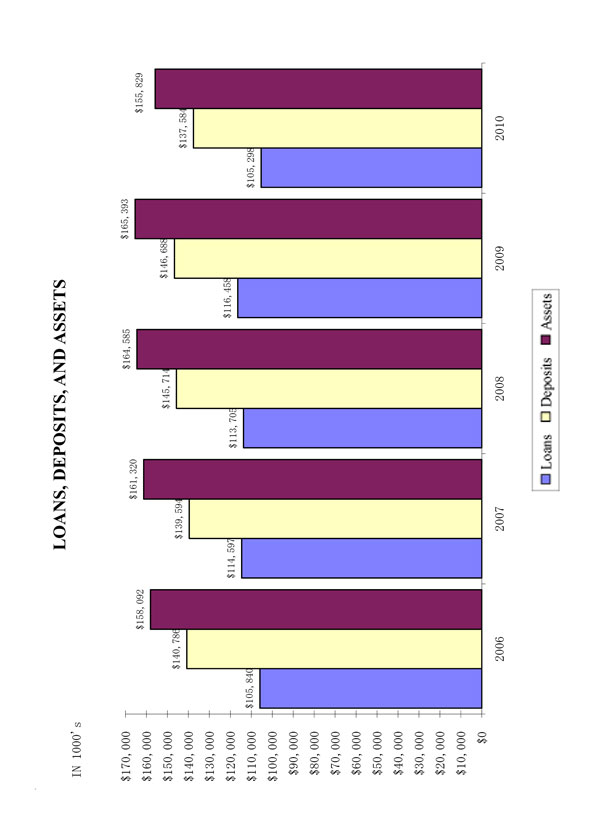
Our total assets decreased from $165,393,055 to a December 31, 2010 total of $155,828,675, a decrease of $9,564,380, or 5.78%.
Net loans decreased from $114,405,140 to $103,278,187, a decrease of $11,126,953, or 9.73%. The allowance for loan losses was 1.92% and 1.76% of gross loans at December 31, 2010 and 2009, respectively.
Deposits at year-end 2010 were $137,583,821, compared to $146,687,996, for year-end 2009, representing a decrease of $9,104,175, or 6.21%, from 2009 year-end.
Our net interest margin decreased slightly from 3.67% in 2009 to 3.57% in 2010.
Please read the following financial information so you may become aware of your Company’s progress. We believe the information contained in this Annual Report shows that a local, well-managed independent bank can compete successfully in a deregulated market against national, regional, and state-wide banking institutions. Our success can be attributed to the teamwork of our shareholders, directors, officers, and employees. Most importantly, we want to thank our customers for allowing us to be of service to them.
The Board of Directors, officers, and employees thank you for your past support and solicit your ongoing support as we continue our efforts to provide prompt, efficient, and courteous service to our customers. We welcome any suggestions you may have.
We invite and encourage you to attend our Annual Meeting on Wednesday, April 27, 2011.
Very truly yours,
| /s/ W. Roger Crook |
/s/ Peden B. McLeod | |||
| W. Roger Crook |
Peden B. McLeod | |||
| President and CEO |
Chairman of the Board | |||
2
COMMUNITYCORP AND SUBSIDIARY
SELECTED FINANCIAL DATA
The following selected consolidated financial data for the five years ended December 31, 2010 are derived from our consolidated financial statements and other data. The selected consolidated financial data should be read in conjunction with our consolidated financial statements, including the accompanying notes, and Management’s Discussion and Analysis of Financial Condition and Results of Operations, included elsewhere herein.
| Year Ended December 31, |
2010 | 2009 | 2008 | 2007 | 2006 | |||||||||||||||
| (Dollars in thousands, except per share) |
||||||||||||||||||||
| Results of Operations: |
||||||||||||||||||||
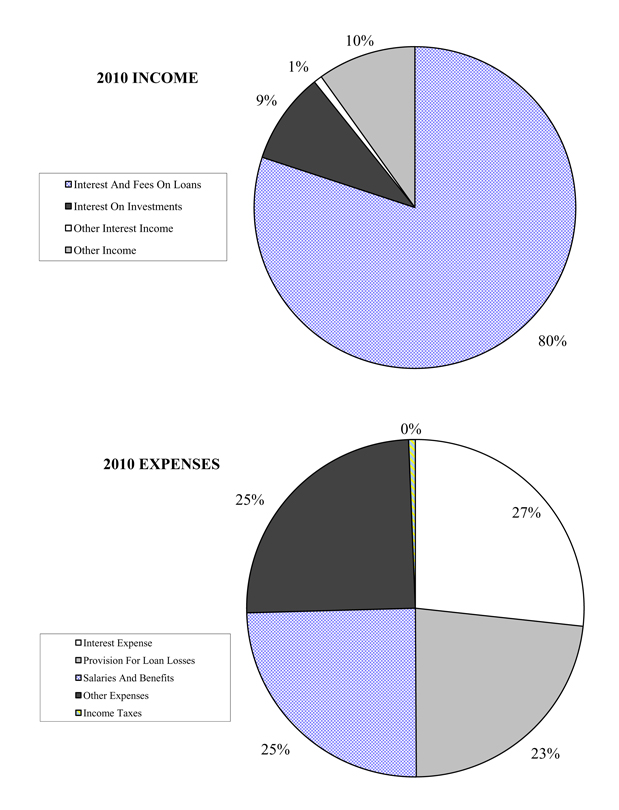
| Interest income |
$ | 7,661 | $ | 8,753 | $ | 9,958 | $ | 10,392 | $ | 9,358 | ||||||||||
| Interest expense |
2,148 | 3,290 | 4,213 | 4,767 | 3,871 | |||||||||||||||
| Net interest income |
5,513 | 5,463 | 5,745 | 5,625 | 5,487 | |||||||||||||||
| Provision for loan losses |
1,866 | 1,083 | 400 | 202 | 225 | |||||||||||||||
| Net interest income after provision for loan losses |
3,647 | 4,380 | 5,345 | 5,423 | 5,262 | |||||||||||||||
| Noninterest income |
841 | 157 | 691 | 666 | 713 | |||||||||||||||
| Noninterest expense |
3,977 | 4,067 | 3,845 | 3,533 | 3,411 | |||||||||||||||
| Income before income taxes |
512 | 469 | 2,191 | 2,556 | 2,565 | |||||||||||||||
| Income tax expense |
52 | 169 | 699 | 794 | 823 | |||||||||||||||
| Net income |
$ | 459 | $ | 300 | $ | 1,492 | $ | 1,762 | $ | 1,742 | ||||||||||
| Balance Sheet Data: |
||||||||||||||||||||
| Securities available-for-sale |
$ | 26,955 | $ | 24,620 | $ | 27,815 | $ | 34,585 | $ | 32,468 | ||||||||||
| Securities held-to-maturity |
300 | 565 | 1,320 | 1,819 | 1,574 | |||||||||||||||
| Allowance for loan losses |
2,019 | 2,053 | 1,982 | 1,929 | 1,857 | |||||||||||||||
| Net loans |
103,278 | 114,405 | 111,723 | 112,668 | 103,983 | |||||||||||||||
| Premises and equipment, net |
2,903 | 3,090 | 3,029 | 2,989 | 3,131 | |||||||||||||||
| Total assets |
155,829 | 165,393 | 164,585 | 161,320 | 158,092 | |||||||||||||||
| Noninterest-bearing deposits |
14,078 | 14,163 | 15,652 | 16,461 | 19,765 | |||||||||||||||
| Interest-bearing deposits |
123,506 | 132,525 | 130,062 | 123,133 | 121,021 | |||||||||||||||
| Total deposits |
137,584 | 146,688 | 145,714 | 139,594 | 140,786 | |||||||||||||||
| Short-term borrowings |
— | — | — | 3,068 | 250 | |||||||||||||||
| Total liabilities |
138,190 | 147,647 | 146,892 | 144,583 | 142,955 | |||||||||||||||
| Total shareholders’ equity |
17,639 | 17,746 | 17,693 | 16,736 | 15,137 | |||||||||||||||
| Per Share Data: |
||||||||||||||||||||
| Weighted-average common shares outstanding |
233,251 | 234,849 | 239,634 | 240,708 | 242,636 | |||||||||||||||
| Net income |
$ | 1.97 | $ | 1.28 | $ | 6.22 | $ | 7.32 | $ | 7.18 | ||||||||||
| Cash dividends paid |
$ | 0.50 | $ | 1.07 | $ | 1.05 | $ | 1.00 | $ | 0.90 | ||||||||||
| Period end book value |
$ | 75.70 | $ | 75.74 | $ | 74.69 | $ | 69.60 | $ | 62.62 | ||||||||||
| Equity and Assets Ratios: |
||||||||||||||||||||
| Return on average assets |
0.28 | % | 0.18 | % | 0.91 | % | 1.08 | % | 1.11 | % | ||||||||||
| Return on average equity |
2.58 | % | 1.68 | % | 8.70 | % | 11.24 | % | 12.35 | % | ||||||||||
| Equity to assets ratio |
11.32 | % | 10.73 | % | 10.75 | % | 10.37 | % | 9.58 | % | ||||||||||
| Dividend payout ratio |
25.47 | % | 84.10 | % | 16.93 | % | 13.65 | % | 12.57 | % | ||||||||||
3
4
5
6
7
COMMUNITYCORP AND SUBSIDIARY
Management’s Discussion and Analysis of
Financial Condition and Results of Operations
GENERAL
Communitycorp is a South Carolina corporation organized on March 13, 1995 to be a bank holding company (the “Company”). The Company’s subsidiary, Bank of Walterboro, (the “Bank”) is a state-chartered commercial bank with four banking locations. The Bank’s main office and operations center is in Walterboro, South Carolina. In addition, the Bank has branches in Ravenel and Ridgeland, South Carolina. The Company’s primary market area includes Colleton, Jasper and Charleston Counties. Depository accounts are insured by the Federal Deposit Insurance Corporation up to the maximum amount permitted by law. The Bank, which received its charter on October 11, 1988, and opened for business on May 1, 1989, is dedicated to providing prompt, efficient, personal service to its customers. The Bank offers a full range of deposit services for individuals and businesses. Deposit products include checking accounts, savings accounts, certificates of deposit, money market accounts, and IRAs.
The Company primarily is engaged in the business of attracting deposits from the general public and using these deposits with other funds to make commercial, consumer, and real estate loans. The Company’s operating results depend to a substantial extent on the difference between interest and fees earned on loans, investments, and services and the Company’s interest expense, consisting principally of interest paid on deposits. Unlike most industrial companies, virtually all of the assets and liabilities of financial institutions are monetary. As a result, interest rates have a greater effect on the financial institution’s performance. In addition to competing with other traditional financial institutions, the Company also competes for savings dollars with nontraditional financial intermediaries such as mutual funds. This has resulted in a highly competitive market area, which demands the type of personal service and attention provided by the Bank.
The earnings and growth of the banking industry and the Company are and will be affected by general conditions of the economy and by the fiscal and monetary policies of the federal government and its agencies, including the Board of Governors of the Federal Reserve System (the “Board”). The Board regulates money and credit conditions and, as a result, has a strong influence on interest rates and on general economic conditions. The effect of such policies in the future on the business and earnings of the Company cannot be predicted with certainty.
As of December 31, 2010, the Company had forty-four full-time employees and two part-time employees.
This discussion and analysis is intended to assist the reader in understanding the financial condition and results of operations of the Company and its subsidiary, the Bank. This commentary should be read in conjunction with the consolidated financial statements and the related notes and the other statistical information in this report.
FORWARD-LOOKING STATEMENTS
Statements included in Management’s Discussion and Analysis which are not historical in nature are intended to be, and are hereby, identified as “forward-looking statements” for purposes of the safe harbor provided by Section 21E of the Securities Exchange Act of 1934, as amended. Forward-looking statements include statements concerning plans, objectives, goals, strategies, future events or performance and underlying assumptions and other statements which are other than statements of historical fact. Such forward-looking statements may be identified, without limitation, by the use of the words “anticipates,” “believes,” “estimates,” “expects,” “intends,” “plans,” “predicts,” “projects,” and similar expressions. The Company’s expectations, beliefs and projections are expressed in good faith and are believed by the Company to have a reasonable basis including, without limitation, management’s examination of historical operating trends, data contained in the Company’s records and other data available from third parties, but there can be no assurance that management’s expectations, beliefs or projections will result or be achieved or accomplished. The Company cautions readers that forward-looking statements, including without limitation, those relating to future business prospects, revenues, working capital, liquidity, capital needs, interest costs, and income, are subject to certain risks and uncertainties that could cause actual results to differ materially from those indicated in the forward-looking statements, due to several important factors herein identified, among others, and other risks and factors identified from time to time in the Company’s reports filed with the Securities and Exchange Commission.
8
RESULTS OF OPERATIONS
OVERVIEW
Net income for the year ended December 31, 2010 was $459,410, or $1.97 per share, compared to $300,474, or $1.28 per share, for the year ended December 31, 2009, resulting in an increase of $158,936, 52.90%.
Our 2010 operating results, compared to 2009, were favorably impacted by the increase in our noninterest income of $684,650 and the reduction of our total noninterest expenses of $207,205. However, for 2010 our earnings continued to be negatively impacted by borrowers defaulting on their loans. As a result of the significant increase in our charged-off loans during 2010, we recorded a provision for loan losses for 2010 that was $684,650 more than our 2009 provision.
NET INTEREST INCOME
General - The largest component of total income is net interest income, the difference between the income earned on assets and the interest accrued or paid on deposits and borrowings used to support such assets. The volume and mix of assets and liabilities and their sensitivity to interest rate movement determine changes in net interest income. Net interest margin is determined by dividing annualized net interest income by average earning assets. Net interest spread is derived from determining the weighted-average rate of interest paid on deposits and borrowings and subtracting it from the weighted-average yield on average assets.
Net interest income for 2010 was $5,512,853 compared to $5,462,772 for 2009, an increase of $50,081, or 0.92%.
This slight increase is attributable to the high volume of fixed rate loans that we have traditionally maintained in our loan portfolio. Fixed rate loans tend to minimize the negative effect of a falling interest rate market such as we experienced during 2010. The prevailing interest rates for 2010 were lower than for 2009.
For 2010, average earning assets totaled $154,385,250, with an annualized average yield of 4.96% compared to $148,954,149 and 5.88%, respectively, for 2009. Average interest-bearing liabilities totaled $129,279,114 with an annualized average cost of 1.66% for 2010 compared to $131,579,436 and 2.50%, respectively, for 2009.
Our net interest margin and net interest spread were 3.57% and 3.30%, respectively, for 2010 compared to 3.67% and 3.38%, respectively, for 2009.
Our annualized yield on average earning assets decreased 52 basis points for 2010 compared to 2009, while our annualized average cost of our interest-bearing liabilities decreased 76 basis points for 2010 compared to 2009. These decreases were reflective of the decreasing interest rate environment during 2010.
Details of certain components of our average assets and interest-bearing liabilities are discussed in the following paragraphs.
Because loans often provide a higher yield than other types of average assets, one of our goals is to maintain our loan portfolio as the largest component of total average assets. Loans comprised 72.41% and 77.65% of average earning assets for December 31, 2010 and 2009, respectively. Loan interest income for the years ended December 31, 2010 and 2009 was $6,806,911 and $7,668,804, respectively. The annualized average yield on loans was 6.09% and 6.63% for 2010 and 2009, respectively. Average balances of loans decreased to $111,796,785 during 2010, a decrease of $3,861,904 from the average of $115,658,689 during 2009. The decrease in the annualized yield on loans is mainly attributable to the decline in market interest rates, the significant increase in net loans charged off, and the significant increase in our nonaccruing loans. Fixed rate loans averaged approximately 98% and 97% of our loan portfolio during 2010 and 2009, respectively.
Investment securities averaged $23,329,772, or 15.11% of average earning assets, for December 31, 2010, compared to $27,322,011, or 18.34% of average earning assets, for 2009. Interest earned on investment securities amounted to $782,633 for the year ended December 31, 2010, compared to $1,012,570 for the same period last year. Investment securities yielded 3.35% and 3.71% for the period ended December 31, 2010 and 2009, respectively.
9
Practically the only interest expense we have is interest on deposit accounts. Interest expense on deposit accounts was $2,148,411 and $3,290,068, for the years ended December 31, 2010 and 2009, respectively. The average balance of interest-bearing deposits decreased to $129,279,114 for 2010 from $131,578,477 during the same period last year. The annualized average cost of deposits was 1.66% for the year ended December 31, 2010, compared to 2.50% for the same period in 2009. The decline in the annualized cost of deposits is due to our decision to lower the rates we paid for deposit accounts. Previously, we were paying competitive rates in our market area.
Average Balances, Income, Expenses, Yields, and Rates - The following table sets forth, for the periods indicated, the weighted average yields earned, the weighted average rates paid, the net interest spread, and the net interest margin on average assets. The table also indicates the average balance during the year and the interest income or expense by specific categories.
Average Balances, Income, Expenses, and Rates
| 2010 | 2009 | |||||||||||||||||||||||
| Average Balance |
Income/ Expense |
Yield/ Rate |
Average Balance |
Income/ Expense |
Yield/ Rate |
|||||||||||||||||||
| Assets: |
||||||||||||||||||||||||
| Average earning assets: |
||||||||||||||||||||||||
| Loans (2) |
$ | 111,796,785 | $ | 6,806,911 | 6.09 | % | $ | 115,658,689 | $ | 7,668,804 | 6.63 | % | ||||||||||||
| Securities, taxable (1) |
10,708,457 | 330,358 | 3.09 | 14,589,666 | 549,383 | 3.77 | ||||||||||||||||||
| Securities, tax-exempt (1) |
12,324,879 | 451,266 | 3.66 | 12,370,484 | 462,881 | 3.74 | ||||||||||||||||||
| Nonmarketable equity securities |
296,436 | 1,009 | 0.34 | 361,861 | 306 | 0.08 | ||||||||||||||||||
| Other |
19,258,693 | 71,721 | 0.37 | 5,973,449 | 71,473 | 0.13 | ||||||||||||||||||
| Total average earning assets |
154,385,250 | 7,661,265 | 4.96 | 148,954,149 | 8,752,847 | 5.88 | ||||||||||||||||||
| Cash and due from banks |
4,139,960 | 12,828,752 | ||||||||||||||||||||||
| Allowance for loan losses |
(2,089,796 | ) | (2,025,013 | ) | ||||||||||||||||||||
| Premises and equipment |
3,005,074 | 3,028,163 | ||||||||||||||||||||||
| Other real estate owned |
919,435 | 104,176 | ||||||||||||||||||||||
| Accrued interest |
686,231 | 1,137,478 | ||||||||||||||||||||||
| Other assets |
1,440,787 | 1,052,138 | ||||||||||||||||||||||
| Total average assets |
$ | 162,486,941 | $ | 164,975,667 | ||||||||||||||||||||
| Liabilities and Shareholders’ Equity: |
||||||||||||||||||||||||
| Interest-bearing liabilities: |
||||||||||||||||||||||||
| Interest-bearing deposits |
$ | 129,279,114 | 2,148,411 | 1.66 | % | 131,578,477 | $ | 3,290,068 | 2.50 | % | ||||||||||||||
| Short-term borrowings |
1 | 959 | 7 | 0.73 | ||||||||||||||||||||
| Total interest-bearing liabilities |
129,279,114 | 2,148,412 | 1.66 | 131,579,436 | 3,290,075 | 2.50 | ||||||||||||||||||
| Noninterest-bearing deposits |
14,718,863 | 14,225,344 | ||||||||||||||||||||||
| Accrued interest |
592,311 | 915,074 | ||||||||||||||||||||||
| Other liabilities |
79,489 | 372,698 | ||||||||||||||||||||||
| Shareholders’ equity |
17,817,164 | 17,883,115 | ||||||||||||||||||||||
| Total liabilities and shareholders’ equity |
$ | 162,486,941 | $ | 164,975,667 | ||||||||||||||||||||
| Net interest spread |
3.30 | % | 3.38 | % | ||||||||||||||||||||
| Net interest income |
$ | 5,512,853 | $ | 5,462,772 | ||||||||||||||||||||
| Net interest margin |
3.57 | % | 3.67 | % | ||||||||||||||||||||
| (1) |
Averages for securities are stated at their carrying amount. |
| (2) |
The effect of loans in nonaccrual status and fees collected is not significant to the computations. All loans and deposits are |
domestic.
10
Analysis of Changes in Net Interest Income—Net interest income can also be analyzed in terms of the impact of changing rates and changing volume. The following table describes the extent to which changes in interest rates and changes in the volume of average assets and interest-bearing liabilities have affected the Company’s interest income and interest expense during the periods indicated. Information on changes in each category attributable to (i) changes due to volume (change in volume multiplied by prior period rate), (ii) changes due to rates (changes in rates multiplied by prior period volume) and (iii) changes in rate and volume (change in rate multiplied by the change in volume) is provided as follows:
Analysis of Changes in Net Interest Income
| 2010 Compared With 2009 | 2009 Compared With 2008 | |||||||||||||||||||||||||||||||
| Variance Due to Changes in | Variance Due to Changes in | |||||||||||||||||||||||||||||||
| (Dollars in thousands) |
Volume | Rate | Volume/ Rate |
Total | Volume | Rate | Volume/ Rate |
Total | ||||||||||||||||||||||||
| Earning assets |
||||||||||||||||||||||||||||||||
| Loans |
$ | (256 | ) | $ | (627 | ) | $ | 21 | $ | (862 | ) | $ | 226 | $ | (857 | ) | $ | (23 | ) | $ | (654 | ) | ||||||||||
| Securities, taxable |
(146 | ) | (99 | ) | 26 | (219 | ) | (425 | ) | (188 | ) | 76 | (537 | ) | ||||||||||||||||||
| Securities, tax-exempt |
(2 | ) | (10 | ) | 0 | (12 | ) | 117 | (5 | ) | (2 | ) | 110 | |||||||||||||||||||
| Nonmarketable equity securities |
0 | 1 | 0 | 1 | (8 | ) | 5 | (1 | ) | (4 | ) | |||||||||||||||||||||
| Other |
32 | (22 | ) | (10 | ) | 0 | 49 | (1 | ) | (10 | ) | 38 | ||||||||||||||||||||
| Total interest income |
(372 | ) | (757 | ) | 38 | (1,092 | ) | (125 | ) | (1,198 | ) | 117 | (1,206 | ) | ||||||||||||||||||
| Interest-Bearing Liabilities |
||||||||||||||||||||||||||||||||
| Interest-bearing deposits |
(57 | ) | (1,103 | ) | 18 | (1,142 | ) | 88 | (985 | ) | (21 | ) | (918 | ) | ||||||||||||||||||
| Short-term borrowings |
0 | 0 | 0 | 0 | (6 | ) | (4 | ) | 4 | (6 | ) | |||||||||||||||||||||
| Total interest expense |
(57 | ) | (1,103 | ) | 18 | (1,142 | ) | 82 | (989 | ) | (17 | ) | (924 | ) | ||||||||||||||||||
| Net interest income |
$ | (315 | ) | $ | 346 | $ | 19 | $ | 50 | $ | (207 | ) | $ | (209 | ) | $ | 134 | $ | (282 | ) | ||||||||||||
Interest Sensitivity - The Company monitors and manages the pricing and maturity of its assets and liabilities in order to diminish the potential adverse impact that changes in interest rates could have on its net interest income. The principal monitoring technique employed by the Company is the measurement of the Company’s interest sensitivity “gap,” which is the positive or negative dollar difference between assets and liabilities that are subject to interest rate repricing within a given period of time. Interest rate sensitivity can be managed by repricing assets or liabilities, selling securities available-for-sale, replacing an asset or liability at maturity, or adjusting the interest rate during the life of an asset or liability. Managing the amount of assets and liabilities repricing in this same time interval helps to manage the risk and minimize the impact on net interest income of rising or falling interest rates.
The following table presents the Company’s rate sensitivity at each of the time intervals indicated as of December 31, 2010. The table may not be indicative of the Company’s rate sensitivity position at other points in time.
Interest Sensitivity Analysis
| (Dollars in thousands) |
Within Three Months |
After Three Through Twelve Months |
After One Through Five Years |
Greater Than Five Years |
Total | |||||||||||||||
| Assets |
||||||||||||||||||||
| Earning assets: |
||||||||||||||||||||
| Federal funds sold |
$ | 2,004 | $ | — | $ | — | $ | — | $ | 2,004 | ||||||||||
| Interest bearing deposits |
9,967 | 9,967 | ||||||||||||||||||
| Time deposits in other banks |
750 | 250 | — | 1,000 | ||||||||||||||||
| Investment securities |
302 | 402 | 2,628 | 24,225 | 27,557 | |||||||||||||||
| Loans (1) |
9,098 | 27,293 | 54,962 | 9,140 | 100,493 | |||||||||||||||
| Total earning assets |
12,154 | 27,945 | 57,590 | 33,365 | 131,054 | |||||||||||||||
11
| (Dollars in thousands) |
Within Three Months |
After Three Through Twelve Months |
After One Through Five Years |
Greater Than Five Years |
Total | |||||||||||||||
| Liabilities |
||||||||||||||||||||
| Interest-bearing liabilities: |
||||||||||||||||||||
| Interest-bearing deposits: |
||||||||||||||||||||
| Demand |
$ | 21,295 | $ | — | $ | — | $ | — | $ | 21,295 | ||||||||||
| Savings and money market |
18,569 | — | — | — | 18,569 | |||||||||||||||
| Time |
24,537 | 48,715 | 10,390 | — | 83,642 | |||||||||||||||
| Total interest-bearing deposits and |
64,401 | 48,715 | 10,390 | — | 123,506 | |||||||||||||||
| Period gap |
$ | (52,247 | ) | $ | (20,770 | ) | $ | 47,200 | $ | 33,365 | ||||||||||
| Cumulative gap |
$ | (52,247 | ) | $ | (73,017 | ) | $ | (25,817 | ) | $ | 7,548 | |||||||||
| Ratio of cumulative gap to total earning assets |
(39.87 | )% | (55.72 | )% | (19.70 | )% | 5.76 | % | ||||||||||||
| (1) |
Excludes nonaccrual loans. |
The above table reflects the balances of average assets and interest-bearing liabilities at the earlier of their repricing or maturity dates. Interest-bearing deposits and overnight federal funds are reflected at the earliest pricing interval due to the immediately available nature of these instruments. Time deposits in other banks are reflected at their contractual maturity date. Scheduled payment amounts of fixed rate amortizing loans are reflected at each scheduled payment date. Scheduled payment amounts of variable rate amortizing loans are reflected at each scheduled payment date until the loan may be repriced contractually; the unamortized balance is reflected at that point. Interest-bearing liabilities with no contractual maturity, such as savings deposits and interest-bearing transaction accounts, are reflected in the earliest repricing period due to contractual arrangements which give us the opportunity to vary the rates paid on those deposits within a thirty-day or shorter period. Fixed rate time deposits, principally certificates of deposit, are reflected at their contractual maturity date. Short-term borrowings are reflected in the earliest repricing period since these borrowings mature daily.
We would generally benefit from increasing market rates of interest when it has an asset-sensitive gap and generally would benefit from decreasing market rates of interest when it is liability sensitive. We are currently liability-sensitive over periods with maturity dates of less than twelve months. However, our gap analysis is not a precise indicator of its interest sensitive position. The analysis presents a static view of the timing of maturities and repricing opportunities, without taking into consideration that changes in interest rates do not affect all assets and liabilities equally. Net interest income is also impacted by other significant factors, including changes in the volume and mix of average assets and interest-bearing liabilities.
PROVISION AND ALLOWANCE FOR LOAN LOSSES
We have developed policies and procedures for evaluating the overall quality of our credit portfolio and the timely identification of potential problem credits. On a quarterly basis, our Board of Directors reviews and approves the appropriate level for the allowance for loan losses based upon management’s recommendations, the results of our internal monitoring and reporting system, and an analysis of economic conditions in our market. The objective of management has been to fund the allowance for loan losses at a level greater than or equal to our internal risk measurement system for loan risk.
Additions to the allowance for loan losses, which are expensed as the provision for loan losses on our statement of operations, are made periodically to maintain the allowance at an appropriate level based on management’s analysis of the potential risk in the loan portfolio. Loan losses and recoveries are charged or credited directly to the allowance. The amount of the provision is a function of the level of loans outstanding, the level of nonperforming
12
loans, historical loan loss experience, the amount of loan losses actually charged against the reserve during a given period, and current and anticipated economic conditions.
The allowance represents an amount which management believes will be adequate to absorb inherent losses on existing loans that may become uncollectible. Our judgment as to the adequacy of the allowance for loan losses is based on a number of assumptions about future events, which we believe to be reasonable, but which may or may not prove to be accurate. Our determination of the allowance for loan losses is based on regular evaluations of the collectability of loans, including consideration of factors such as the balance of impaired loans, the quality, mix, and size of our overall loan portfolio, economic conditions that may affect the borrower’s ability to repay, the amount and quality of collateral securing the loans, our historical loan loss experience, and a review of specific problem loans. We also consider subjective issues such as changes in our lending policies and procedures, changes in the local and national economy, changes in volume or type of credits, changes in the volume or severity of problem loans, quality of loan review and board of director oversight, concentrations of credit, and peer group comparisons.
More specifically, in determining our allowance for loan losses, we regularly review loans for specific and impaired reserves based on the appropriate impairment assessment methodology. Pooled reserves are determined using historical loss trends measured over a five-year average, adjusted for environmental risk, which is then applied to risk rated loans grouped by Federal Financial Examination Council (“FFIEC”) call code and segmented by impairment status. The pooled reserves are calculated by applying the appropriate historical loss ratio to the loan categories. Impaired loans greater than a minimum threshold established by management are excluded from this analysis. The sum of all such amounts determines our pooled reserves.
We track our portfolio and analyze loans grouped by FFIEC call code categories. The first step in this process is to risk grade each and every loan in the portfolio based on one common set of parameters. These parameters include items like debt-to-worth ratio, liquidity of the borrower, net worth, experience in a particular field and other factors such as underwriting exceptions. Weight is also given to the relative strength of any guarantors on the loan.
After risk grading each loan, we then segment the portfolio by FFIEC call code groupings, separating out substandard or impaired loans. The remaining loans are grouped into “performing loan pools.” The loss history for each performing loan pool is measured over a specific period of time to create a loss factor. The relevant look back period is determined by the Bank, regulatory guidance, and current market events. The loss factor is then applied to the pool balance and the reserve per pool calculated. Loans deemed to be substandard but not impaired are segregated and a loss factor is applied to this pool as well. Finally, impaired loans are segmented based upon size; smaller impaired loans are pooled and a loss factor applied, while larger impaired loans are assessed individually using the appropriate impairment measuring methodology. Finally, certain qualitative factors are utilized to assess economic and other trends not currently reflected in the loss history. These factors include concentration of credit across the portfolio, the experience level of management and staff, effects of changes in risk selection and underwriting practice, industry conditions and the current economic and business environment. A quantitative value is assigned to each of the factors, which is then applied to the performing loan pools. Negative trends in the loan portfolio increase the quantitative values assigned to each of the qualitative factors and, therefore, increase the reserve. For example, as general economic and business conditions decline, this qualitative factor’s quantitative value will increase, which will increase reserve requirement for this factor. Similarly, positive trends in the loan portfolio, such as improvement in general economic and business conditions, will decrease the quantitative value assigned to this qualitative factor, thereby decreasing the reserve requirement for this factor. These factors are reviewed and updated by our risk management committee on a regular basis to arrive at a consensus for our qualitative adjustments.
Periodically, we adjust the amount of the allowance based on changing circumstances. We recognize loan losses to the allowance and add subsequent recoveries back to the allowance for loan losses. In addition, on a quarterly basis we informally compare our allowance for loan losses to various peer institutions; however, we recognize that allowances will vary as financial institutions are unique in the make-up of their loan portfolios and customers, which necessarily creates different risk profiles for the institutions. If our allowance was significantly different from our peer group, we would carefully review our assessment procedures again to ensure that all procedures were completed accurately and all environmental risk factors were thoroughly considered. There can be no assurance that charge-offs of loans in future periods will not exceed the allowance for loan losses as estimated at any point in time
13
or that provisions for loan losses will not be significant to a particular accounting period, especially considering the overall weakness in the economic environment in our market areas.
Various regulatory agencies review our allowance for loan losses through their periodic examinations, and they may require additions to the allowance for loan losses based on their judgment about information available to them at the time of their examinations. Our losses will undoubtedly vary from our estimates, and it is possible that charge-offs in future periods will exceed the allowance for loan losses as estimated at any point in time.
As of December 31, 2010 and 2009, the allowance for loan losses was $2,019,497 and $2,053,340, respectively, a decrease of $33,843, or 1.65%, from the 2009 allowance. However, as a percentage of total loans, the allowance for loan losses was 1.92% and 1.76% at December 31, 2010 and 2009, respectively. The decrease in the dollar amount of our allowance for loan losses was driven by the significant reduction of our loan portfolio, while we continue to charge off loan losses once they are identified.
For the years 2010 and 2009, the provision for loan losses was $1,866,000 and $1,083,000, respectively. This represents an increase of $783,000, or 72.30%, which is primarily attributable to the increase in the number of our borrowers defaulting on their loans due to the current depressed economy of our local market.
We believe the allowance for loan losses at December 31, 2010, is adequate to meet potential loan losses inherent in the loan portfolio, and, as described earlier, maintain the flexibility to adjust the allowance should our local economy and loan portfolio either improve or decline in the future.
The following table sets forth certain information with respect to the Company’s allowance for loan losses and the composition of charge-offs and recoveries for the years ended December 31, 2010 and 2009.
Allowance for Loan Losses
| Year ended December 31, | ||||||||
| 2010 | 2009 | |||||||
| Total loans outstanding at end of year |
$ | 105,297,684 | $ | 116,458,480 | ||||
| Average loans outstanding |
$ | 111,796,785 | $ | 115,658,689 | ||||
| Balance of allowance for loan losses at beginning of |
$ | 2,053,340 | $ | 1,981,637 | ||||
| Loan losses: |
||||||||
| Real estate - construction |
24,867 | 104,327 | ||||||
| Real estate - mortgage |
57,334 | 48,043 | ||||||
| Commercial and industrial |
1,772,072 | 791,786 | ||||||
| Consumer |
57,502 | 108,907 | ||||||
| Total loan losses |
1,911,775 | 1,053,063 | ||||||
| Recoveries of previous loan losses: |
||||||||
| Real estate - construction |
— | — | ||||||
| Real estate - mortgage |
— | — | ||||||
| Commercial and industrial |
3,753 | 17,048 | ||||||
| Consumer |
8,179 | 24,718 | ||||||
| Total recoveries |
11,932 | 41,766 | ||||||
| Net charge-offs |
(1,899,843 | ) | (1,011,297 | ) | ||||
| Provision charged to operations |
1,866,000 | 1,083,000 | ||||||
| Balance of allowance for loan losses at end of year |
$ | 2,019,497 | $ | 2,053,340 | ||||
| Ratios: |
||||||||
| Net charge-offs to average loans outstanding |
1.70 | % | 0.87 | % | ||||
| Net charge-offs to loans at end of year |
1.80 | % | 0.87 | % | ||||
| Allowance for loan losses to average loans |
1.81 | % | 1.78 | % | ||||
| Allowance for loan losses to loans at end of year |
1.92 | % | 1.76 | % | ||||
| Net charge-offs to allowance for loan losses |
94.08 | % | 49.25 | % | ||||
| Net charge-offs to provisions for loan losses |
101.81 | % | 93.38 | % | ||||
14
NONPERFORMING ASSETS
Nonperforming Assets - At December 31, 2010 and 2009, loans totaling $4,805,658 and $2,710,494, respectively, were in nonaccrual status and total loans of $0 and $2,480, respectively, were ninety days or more overdue and still accruing interest.
The following table shows the nonperforming assets, percentages of net charge-offs, and the related percentage of allowance for loan losses for the years ended December 31, 2010 and 2009.
| 2010 | 2009 | |||||||
| Nonaccrual loans |
$ | 4,805,658 | $ | 2,710,494 | ||||
| Total loans impaired not in nonaccrual |
2,897,583 | 6,047,778 | ||||||
| Total impaired loans |
7,703,241 | 8,758,272 | ||||||
| Loans 90 days or more past due and still accruing interest |
— | 2,480 | ||||||
| Total impaired and nonperforming loans |
7,703,241 | 8,760,752 | ||||||
| Other real estate owned |
2,764,189 | 340,000 | ||||||
| Total impaired and nonperforming assets |
$ | 10,467,430 | $ | 9,100,752 | ||||
| Percentage of nonperforming loans to total loans |
7.32 | % | 7.52 | % | ||||
| Allowance for loan losses as a percentage of impaired and nonperforming loans |
26.22 | % | 23.44 | % | ||||
| Percentage of nonperforming assets to total assets |
6.72 | % | 5.50 | % | ||||
Generally, loans are placed on nonaccrual status if principal or interest payments become 90 days past due and/or we deem the collectibility of the principal and/or interest to be doubtful. Once a loan is placed in nonaccrual status, all previously accrued and uncollected interest is reversed against interest income. Interest income on nonaccrual loans is recognized on a cash basis when the ultimate collectability is no longer considered doubtful. Loans are returned to accrual status when the principal and interest amounts contractually due are brought current and future payments are reasonably assured. During 2010 and 2009, interest income recognized on nonaccrual loans was $30,654 and $18,687, respectively. If the nonaccrual loans had been accruing interest at their original contracted rates, related income would have been $275,415 and $167,968 for 2010 and 2009, respectively. All nonaccruing loans at December 31, 2010 and 2009 were included in our classification of impaired loans at those dates.
We consider a loan to be impaired when, based upon current information and events, we believe it is probable that we will be unable to collect all amounts due according to the contractual terms of the loan agreement. Our impaired loans include loans identified as impaired through review of the nonhomogeneous portfolio and troubled debt restructurings. Specific allowances are established on impaired loans, if deemed necessary, for the difference between the loan amount and the fair market value less estimated selling costs. Impaired loans may be left on accrual status during the period we are pursuing repayment of the loan. Impairment losses are recognized through an increase in the allowance for loan losses and a corresponding charge to the provision for loan losses. Adjustments to impairment losses due to changes in the fair market value of the collateral properties for impaired loans are also recognized through an increase in the allowance for loan losses and a corresponding charge to the provision for loan losses. When an impaired loan is sold, transferred to other real estate owned, or written-down, the loan is removed from the portfolio through a charge-off to the allowance for loan losses.
On a quarterly basis, we analyze each loan that is classified as impaired to determine the potential for possible loan losses. This analysis is focused upon determining the then current estimated value of the collateral, local market condition, and estimated costs to foreclose, repair and resell the property. The net realizable value of the property is then computed and compared to the loan balance to determine the appropriate amount of specific reserve for each loan.
The following tables summarize information on our impaired loans at and for the years ended December 31, 2010 and 2009.
15
| 2010 | 2009 | |||||||
| Impaired loans with specific allowance |
$ | 2,134,648 | $ | 2,426,363 | ||||
| Impaired loans with no specific allowance |
5,568,593 | 6,331,909 | ||||||
| Total impaired loans |
$ | 7,703,241 | $ | 8,041,962 | ||||
| Related specific allowance |
$ | 373,484 | $ | 760,103 | ||||
| Average recorded investment in impaired loans |
$ | 8,512,074 | $ | 6,475,817 | ||||
At December 31, 2010 real estate or other collateral secured practically all of the loans that were considered impaired. The depressed economy of our local market has resulted in an increase in loan delinquencies, defaults and foreclosures. In some cases, this depression has resulted in a significant impairment to the value of our collateral and ability to sell the collateral upon foreclosure at its appraised value. If collateral values further decline, it is also more likely that we would be required to increase our allowance for loan losses.
Included in the impaired loans at December 31, 2010, were 10 borrowers that accounted for 69% of the total amount of the impaired loans at that date.
The results of our internal review process and applying the allowance model methodology are the primary determining factors in management’s assessment of the adequacy of the allowance for loan losses.
NONINTEREST INCOME AND EXPENSE
Noninterest Income - Noninterest income for 2010 was $841,520 compared to $156,870 for 2009. The increase of $684,650 is mostly attributable to the $461,935 write down of certain investment securities for being other than temporarily impaired during 2009 and to the $262,011 gain realized on the sale of available-for-sale securities during 2010.
Noninterest Expense - Total noninterest expense for 2010 and 2009 was $3,976,833 and $4,067,863, respectively. This represented a decrease of $91,030, or 2.24%. Salaries and employee benefits increased $72,219, or 3.78%, from $1,910,476 for 2010 compared to $1,982,695 for 2009. Net occupancy and equipment expense was $7,044 higher for 2010 compared to 2009. These increases in expenses were offset by the $170,293 reduction in our other operating expenses for 2010 compared to 2009. This reduction is mainly due to the decrease of $103,370 in our federal deposit insurance premiums and to the decrease of $51,674 in our professional fees. During 2010, like all federally insured banks, the Federal Deposit Insurance Corporation levied a special premium assessment for our deposit insurance in 2009, while lowering the premium rates for 2010. The increase in our professional fees is due the cost of having consultants train our staff in how to use the new software and computer equipment we installed during 2010. Finally, our ATM surcharges decreased by $50,695 as a result of receiving an abatement for being over charged for ATM surcharges over the last five years.
Income Taxes - Our income tax expense for 2010 was $52,130, a decrease of $116,175 from the 2009 income tax expense of $168,305. The effective tax rates for the years ended December 31, 2010 and 2009 were 10.19% and 35.90%, respectively. The decrease in the effective rates is due mainly to the establishment of a valuation allowance for our deferred tax asset relating to the capital loss incurred during 2009 and the relationship of the 2010 tax exempt income to our pre-tax income.
EARNING ASSETS
Loans - Loans are the largest category of average assets and typically provide higher yields than other types of average assets. Associated with the higher loan yields are the inherent credit and liquidity risks which management attempts to control and counterbalance. Loans averaged $111,796,785 in 2010 compared to $115,658,689 in 2009, a decrease of $3,861,904, or 3.34%. Total loans were $105,297,684 and $116,458,480 at December 31, 2010 and 2009, respectively, a decrease of $11,160,796, 9.58%. Fixed rate loans comprised 98% and 97% of our loan portfolio at December 31, 2010 and 2009, respectively.
16
Our ratio of loans to deposits was 76.53% at December 31, 2010 as compared to 79.39% at December 31, 2010. The loan to deposit ratio is used to monitor a financial institution’s potential profitability and efficiency of asset distribution and utilization. Generally, a higher loan to deposit ratio is indicative of higher interest income since loans yield a higher return than alternative investment vehicles. We have concentrated on maintaining quality in the loan portfolio while continuing to increase the deposit base.
We extend credit primarily to consumers and small businesses in Walterboro, Ravenel and Ridgeland, South Carolina, and to customers in surrounding areas. Our service area is mixed in nature. Walterboro is a regional business center whose economy contains elements of medium and light manufacturing, higher education, regional health care, and distribution facilities. Outside the incorporated city limits of Walterboro, the economy includes manufacturing, agriculture, timber, and recreational activities. Loan growth in the Ravenel and Ridgeland area is expected to come primarily from consumer loans and small businesses in neighboring Charleston and Jasper Counties. No particular category or segment of the economies previously described is expected to grow or contract disproportionately in 2011. We believe that the loan portfolio is adequately diversified. There are no significant concentrations of loans in any particular individuals, industry, or group of related individuals or industries. We expect the area to remain stable; however due to the currently depressed markets, we do not expect any material growth in the near future.
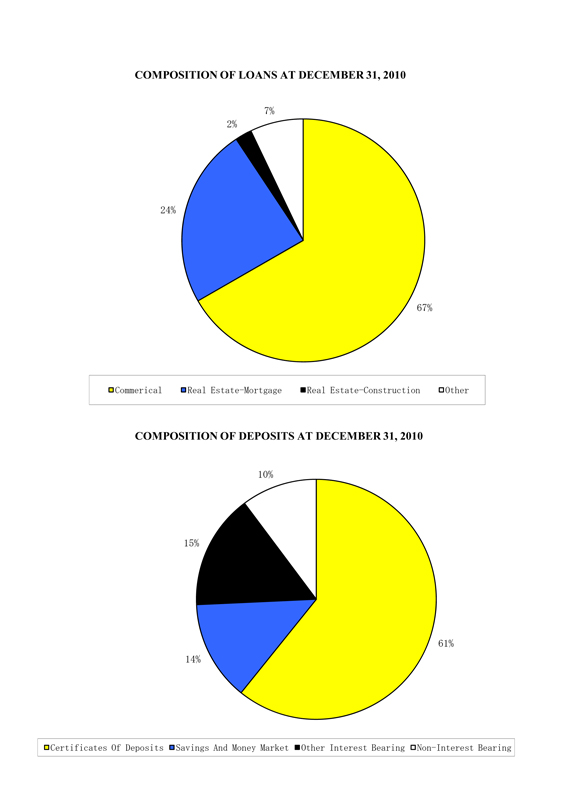
The following table sets forth the composition of the loan portfolio by category at December 31, 2010 and 2009 and highlights our general emphasis on commercial and mortgage lending.
Loan Portfolio Composition
| 2010 | 2009 | |||||||||||||||
| Amount | Percent of Total |
Amount | Percent of Total |
|||||||||||||
| Commercial and industrial |
$ | 70,230,829 | 66.70 | % | $ | 71,750,588 | 61.60 | % | ||||||||
| Real estate |
||||||||||||||||
| Construction |
2,326,588 | 2.21 | 3,256,857 | 2.80 | ||||||||||||
| Mortgage |
25,251,991 | 23.98 | 31,601,663 | 27.14 | ||||||||||||
| Consumer and other loans |
7,488,276 | 7.11 | 9,849,372 | 8.46 | ||||||||||||
| Total loans |
105,297,684 | 100.00 | % | 116,458,480 | 100.00 | % | ||||||||||
| Allowance for loan losses |
(2,019,497 | ) | (2,053,340 | ) | ||||||||||||
| Net loans |
$ | 103,278,187 | $ | 114,405,140 | ||||||||||||
Commercial and industrial loans decreased $1,519,759, or 2.12%, to $70,230,829 at December 31, 2010, from $71,750,588 at December 31, 2009. The decrease is mainly due to the economic downturn in our markets that caused the demand for these types of loans to decrease. At December 31, 2010 and 2009, commercial and industrial loans represented 66.70% and 61.60%, respectively, of the total loan portfolio.
Real estate mortgage loans totaled $25,251,991 at December 31, 2010, and represented 23.98% of the total loan portfolio, compared to $31,601,663 and 27.14%, respectively, at December 31, 2009. Real estate mortgage loans consist of first and second mortgages on single or multi-family residential dwellings and nonresidential mortgage loans, which include commercial loans and other loans secured by multi-family properties and farmland. Real estate construction loans were $2,326,588 and $3,256,857 at December 31, 2010 and 2009, respectively, and represented 2.21% and 2.80% of the total loan portfolio, respectively. Comparing 2010 with 2009, our real estate mortgage and construction loans declined by $6,349,672, or 20.09% and $930,269, or 28.56%, respectively. Currently, the demand for all types of real estate loans in our market area is very weak because of the economic downturn in our markets.
Consumer and other loans decreased $2,361,096, or 23.97%, to $7,488,276 at December 31, 2010, from $9,849,372 at December 31, 2009. At December 31, 2010 and 2009, consumer and other loans represented 7.11% and 8.46%, respectively, of the total loan portfolio. The decrease in the volume in consumer loans is due to the sharp decline in our consumers’ spending during 2010 due to the economic downturn in our markets
17
Maturities and Sensitivity of Loans to Changes in Interest Rates
The following table summarizes the loan maturity distribution, by type, at December 31, 2010 and related interest rate characteristics:
| One Year or Less |
Over One Year Through Five Years |
Over Five Years |
Total | |||||||||||||
| Real estate - construction |
$ | 1,535,555 | $ | 348,956 | $ | 442,076 | $ | 2,326,588 | ||||||||
| Real estate – mortgage |
4,766,841 | 17,394,969 | 3,090,180 | 25,251,991 | ||||||||||||
| Commercial and industrial |
29,519,311 | 35,227,934 | 5,483,584 | 70,230,829 | ||||||||||||
| Consumer and other |
2,308,875 | 4,618,184 | 561,217 | 7,488,276 | ||||||||||||
| $ | 38,130,583 | $ | 57,590,043 | $ | 9,577,058 | $ | 105,297,684 | |||||||||
| Loans maturing after one year with: |
||||||||||||||||
| Fixed interest rates |
$ | 66,207,249 | ||||||||||||||
| Floating interest rates |
959,851 | |||||||||||||||
| $ | 67,167,101 | |||||||||||||||
The information presented in the above table is based on the contractual maturities of the individual loans, including loans that may be subject to renewal at their contractual maturity. Renewal of such loans is subject to review and credit approval as well as modification of terms upon their maturity. Consequently, management believes the treatment shown in the above table presents fairly the maturity and repricing structure of the loan portfolio.
Investment Securities - The investment securities portfolio is a significant component of the Company’s total average assets. Total investment securities, stated at carrying amount, averaged $23,329,772 in 2010, compared to $27,322,011 in 2009. At December 31, 2010, the carrying value of the securities portfolio was $27,557,535. Securities designated as available-for-sale totaled $26,955,350 and were recorded at estimated fair value. Securities designated as held-to-maturity totaled $299,885 and were recorded at amortized cost. Securities designated as nonmarketable equity securities totaled $302,300 and were recorded at cost. Our investment objectives include maintaining and investing in a portfolio of high quality and highly liquid investments with competitive returns. Based on these objectives, our investments primarily consist of obligations of government-sponsored enterprises and obligations of states and local governments.
Investment Securities Portfolio Composition
The following tables summarize the carrying value of investment securities at December 31, 2010 and 2009 and the weighted average yields of those securities at December 31, 2010.
| 2010 | 2009 | |||||||
| Available-for-Sale (at estimated fair value) |
||||||||
| Government-sponsored enterprises |
$ | 13,591,442 | $ | 4,947,534 | ||||
| Obligations of states and local governments |
11,312,642 | 12,653,121 | ||||||
| Other |
200,000 | 200,000 | ||||||
| 25,104,084 | 17,800,655 | |||||||
| Mortgage-backed securities |
1,851,266 | 6,819,521 | ||||||
| Total available-for-sale securities |
$ | 26,955,350 | $ | 24,620,177 | ||||
| Held-to-Maturity (at amortized cost) |
||||||||
| Obligations of states and local governments |
$ | 299,885 | $ | 564,821 | ||||
18
| Nonmarketable Equity Securities (at cost) |
||||||||
| Federal Home Loan Bank |
$ | 296,300 | $ | 296,300 | ||||
| Investments in Community Banks |
6,000 | 6,000 | ||||||
| Total |
$ | 302,300 | $ | 302,300 | ||||
The stocks are carried at cost because they have no quoted market value and no ready market exists; however, redemption of this stock has historically been at par value. Investment in Federal Home Loan Bank stock is a condition of borrowing from the Federal Home Loan Bank, and the stock is pledged to collateralize the borrowings.
Investment Securities Maturity Distribution and Yields
Available-for-Sale
| December 31, 2010 |
Within One Year | After One But Within Five Years |
After Five But Within Ten Years |
Over Ten Years | ||||||||||||||||||||||||||||
| (Dollars in thousands) |
Amount | Yield | Amount | Yield | Amount | Yield | Amount | Yield | ||||||||||||||||||||||||
| Government-sponsored enterprises (1) |
$ | — | — | % | $ | 1,893 | 1.27 | % | $ | 6,456 | 2.16 | % | $ | 5,243 | 2.29 | % | ||||||||||||||||
| Obligations of states and local governments |
402 | 3.30 | % | 435 | 3.67 | % | 7,991 | 3.60 | % | 2,484 | 3.90 | % | ||||||||||||||||||||
| Other |
— | — | % | 200 | 6.25 | % | — | — | % | — | — | % | ||||||||||||||||||||
| Total available-for-sale securities |
$ | 402 | 3.30 | % | $ | 2,528 | 2,10 | % | $ | 14,447 | 2.97 | % | $ | 7,727 | 2.75 | % | ||||||||||||||||
| (1) |
Excludes mortgage-backed securities totaling $1,851,266 with a yield of 3.43%. |
Held-to-Maturity
| December 31, 2010 |
Within One Year | After One But Within Five Years |
After Five But Within Ten Years |
Over Ten Years | ||||||||||||||||||||||||||||
| (Dollars in thousands) |
Amount | Yield (1) | Amount | Yield (1) | Amount | Yield (1) | Amount | Yield (1) | ||||||||||||||||||||||||
| Obligations of states and local governments |
$ | — | — | % | $ | 100 | 4.45 | % | $ | 200 | 4.00 | % | $ | — | — | |||||||||||||||||
Federal Funds Sold - Federal funds sold averaged $2,521,088 in 2010, compared to $4,473,449 in 2009. At December 31, 2010 and 2009, federal funds sold were $2,004,000 and $2,030,000, respectively. These funds are a source of our liquidity and are generally invested in an earning capacity on an overnight basis.
DEPOSITS AND OTHER INTEREST-BEARING LIABILITIES
Deposits - Deposits account for practically all of our interest bearing liabilities. Total average deposits decreased from $145,803,821 in 2009 to $143,997,977 in 2010. This represents a decrease of $1,805,844, or 1.24% from the 2009 amount.
The following table summarizes our average deposits for the years ended December 31, 2010 and 2009.
| 2010 | 2009 | |||||||||||||||
| Amount | Percent of Deposits |
Amount | Percent of Deposits |
|||||||||||||
| Noninterest-bearing demand |
$ | 14,718,863 | 10.22 | % | $ | 14,225,344 | 9.75 | % | ||||||||
| Interest-bearing demand |
21,563,711 | 14.98 | 21,941,597 | 15.05 | ||||||||||||
| Savings accounts |
17,249,906 | 11.98 | 17,830,612 | 12.23 | ||||||||||||
| Time deposits |
90,465,497 | 62.82 | 91,806,268 | 62.97 | ||||||||||||
| Total deposits |
$ | 143,997,977 | 100.00 | % | $ | 145,803,821 | 100.00 | % | ||||||||
Our actual deposits at December 31, 2010 and 2009 were $137,583,821 and $146,687,996, respectively, representing a decrease of $9,104,175, or 6.21%.
19
Core deposits, which exclude certificates of deposit of $100,000 or more, provide a relatively stable funding source for our loan portfolio and other earning assets. Our core deposits were $91,441,658 and $95,566,620 at December 31, 2010 and 2009, respectively. A stable base of deposits is expected to be our primary source of funding to meet both our short-term and long-term liquidity needs in the future.
As our loan demand declined, we concurrently lowered our rates for all types of deposits, especially for time deposits. This is the primary reason why our total time deposits declined by $8,886,699, or 9.60%, from December 31, 2009 to December 31, 2010.
Deposits, and particularly core deposits, have been our primary source of funding and have enabled us to meet successfully both our short-term and long-term liquidity needs. We anticipate that such deposits will continue to be our primary source of funding in the future. Our loan-to-deposit ratio was 76.53% and 79.39% on December 31, 2010 and 2009, respectively.
Maturities of Certificates of Deposit of $100,000 or More
The maturity distribution of our time deposits of $100,000 or more at December 31, 2010, is shown in the following table.
| Within Three Months |
After Three Through Six Months |
After Six Through Twelve Months |
After Twelve Months |
Total | ||||||||||||||||
| Certificates of deposit of $100,000 or more |
$ | 13,744,335 | $ | 10,648,190 | $ | 15,546,554 | $ | 6,203,074 | $ | 46,142,153 | ||||||||||
Approximately 87.00% of our time deposits of $100,000 or more had scheduled maturities within one year. Large certificate of deposit customers tend to be extremely sensitive to interest rate levels, making these deposits less reliable sources of funding for liquidity planning purposes than core deposits. We expect most certificates of deposits with maturities less than one year to be renewed upon maturity. However, there is the possibility that some certificates may not be renewed. We believe that, should that occur, the impact would be minimal on our operations and liquidity due to the availability of other funding sources.
We had no broker deposits at December 31, 2010 or 2009.
Short-term Borrowings - We did not have any short-term borrowings at December 31, 2010. Since securities sold under agreements to repurchase, which are classified as secured borrowings and generally mature within a one to seven-day period. Either party may cancel the arrangement without penalty. Information concerning securities sold under agreements to repurchase for the year 2009 is summarized as follows:
| 2009 | ||||
| Average balance during the year |
$ | 308,449 | ||
| Average interest rate during the year |
1.81 | % | ||
| Maximum month-end balance during the year |
$ | 515,000 | ||
| End of period average interest rate |
0.25 | % | ||
CAPITAL
Total shareholders’ equity decreased by $106,816 from $17,745,653 at December 31, 2009 to $17,638,837 at December 31, 2010. The decrease is attributable to the purchase of treasury stock of $98,401, the decrease in other comprehensive income of $350,824 and the payment of dividends of $117,001. These decreases were offset by our net income of $459,410 for 2010.
20
The Bank is subject to various regulatory capital requirements administered by the federal banking agencies. Failure to meet minimum capital requirements can initiate certain mandatory and, possibly, additional discretionary actions by regulators that, if undertaken, could have a direct material effect on the Bank’s financial statements. Under capital adequacy guidelines and the regulatory framework for prompt corrective action, the Bank must meet specific capital guidelines that involve quantitative measures of the Bank’s assets, liabilities, and certain off-balance-sheet items as calculated under regulatory accounting practices. The Bank’s capital amounts and classification are also subject to qualitative judgments by the regulators about components, risk weightings, and other factors.
Quantitative measures established by regulation to ensure capital adequacy require the Bank to maintain minimum ratios of Tier 1 and total capital as a percentage of assets and off-balance-sheet exposures, adjusted for risk weights ranging from 0% to 100%. Tier 1 capital consists of common shareholders’ equity, excluding the unrealized gain or loss on securities available for sale, minus certain intangible assets. Tier 2 capital consists of the allowance for loan losses subject to certain limitations. Total capital for purposes of computing the capital ratios consists of the sum of Tier 1 and Tier 2 capital. Total regulatory minimum requirements are 4% for Tier 1 and 8% for total risk-based capital.
As of December 31, 2010, management believes that the Bank is well capitalized under the regulatory framework for prompt corrective action.
The following table summarizes the capital amounts and ratios of the Bank and the regulatory minimum requirements.
| Actual | For Capital Adequacy Purposes |
To Be Well- Capitalized Under Prompt Corrective Action Provisions |
||||||||||||||||||||||
| Amount | Ratio | Minimum | Minimum | |||||||||||||||||||||
| Amount | Ratio | Amount | Ratio | |||||||||||||||||||||
| December 31, 2010 |
||||||||||||||||||||||||
| Total capital (to risk-weighted assets) |
$ | 19,128,571 | 16.49 | % | $ | 9,283,040 | 8.00 | % | $ | 11,603,800 | 10.00 | % | ||||||||||||
| Tier 1 capital (to risk-weighted assets) |
17,678,096 | 15.23 | 4,641,520 | 4.00 | 6,962,280 | 6.00 | ||||||||||||||||||
| Tier 1 average ratio |
17,678,096 | 11.15 | 6,340,280 | 4.00 | 7,925,350 | 5.00 | ||||||||||||||||||
| December 31, 2009 |
||||||||||||||||||||||||
| Total capital (to risk-weighted assets) |
$ | 18,956,794 | 14.92 | % | $ | 10,165,600 | 8.00 | % | $ | 12,707,000 | 10.00 | % | ||||||||||||
| Tier 1 capital (to risk-weighted assets) |
17,368,419 | 13.67 | 5,082,800 | 4.00 | 7,624,200 | 6.00 | ||||||||||||||||||
| Tier 1 capital (to average assets) |
17,368,419 | 10.48 | 6,627,400 | 4.00 | 8,284,250 | 5.00 | ||||||||||||||||||
The Federal Reserve Board has similar requirements for bank holding companies. The Company is currently not subject to these requirements because the Federal Reserve guidelines contain an exemption for bank holding companies with less than $500,000,000 in consolidated assets.
LIQUIDITY MANAGEMENT
Liquidity is the ability to meet current and future obligations through liquidation or maturity of existing assets or the acquisition of additional liabilities. Adequate liquidity is necessary to meet the requirements of customers for loans and deposit withdrawals in the most timely and economical manner. Some liquidity is ensured by maintaining assets, which may be immediately converted into cash at minimal cost (amounts due from banks and federal funds sold). However, the most manageable sources of liquidity are composed of liabilities, with the primary focus of liquidity management being the ability to obtain deposits within our market area. Core deposits (total deposits, less time deposits of $100,000 and over) provide a relatively stable funding base. At December 31, 2010 and 2009 core deposits represented 66.46% and 65.15%, respectively of total deposits.
The Bank had available at the end of 2010 unused short-term lines of credit to purchase up to $10,000,000 of federal funds from unrelated correspondent institutions. The Bank also has a credit availability agreement with the Federal Home Loan Bank totaling 15 percent of the Bank’s qualifying assets as of any quarter end. As of December 31,
21
2010, the available credit totaled $24,373,000 and there were no borrowings outstanding. Any borrowings from the FHLB will be secured by a blanket lien on all of the Bank’s 1-4 family residential first lien mortgage loans and or investment securities.
Asset liquidity is provided from several sources, including amounts due from banks and federal funds sold. Available-for- sale securities, particularly those maturing within one year, provide a secondary source of liquidity. In addition, funds from maturing loans are a source of liquidity.
Our ability to meet our cash obligations or to pay any possible future cash dividends to shareholders is dependent primarily on the successful operation of the Bank and its ability to pay cash dividends to us. Any of the Bank’s cash dividends in an amount exceeding current year-to-date earnings are subject to the prior approval of the South Carolina Commissioner of Banking and are generally allowable only from its undivided profits. In addition, dividends paid by the Bank to us would be prohibited if such payment would cause the Bank’s capital to be reduced below applicable minimum regulatory requirements. At December 31, 2010, the Bank’s available undivided profits totaled $14,446,388. Under Federal Reserve Board regulations, the amounts of loans or advances from the Bank to us are also restricted.
We believe that our overall liquidity sources for us and the Bank are adequate to meet our operating needs in the ordinary course of business.
IMPACT OF OFF-BALANCE-SHEET INSTRUMENTS
We are a party to financial instruments with off-balance-sheet risk in the normal course of business to meet the financing needs of our customers. These financial instruments consist of commitments to extend credit and standby letters of credit. Commitments to extend credit are legally binding agreements to lend to a customer at predetermined interest rates as long as there is no violation of any condition established in the contract. Commitments generally have fixed expiration dates or other termination clauses and may require payment of a fee. A commitment involves, to varying degrees, elements of credit and interest rate risk in excess of the amount recognized in the balance sheet. Our exposure to credit loss in the event of nonperformance by the other party to the instrument is represented by the contractual notional amount of the instrument. Since certain commitments are expected to expire without being drawn upon, the total commitment amounts do not necessarily represent future cash requirements. Letters of credit are conditional commitments issued to guarantee a customer’s performance to a third party and have essentially the same credit risk as other lending facilities. Standby letters of credit often expire without being used. We believe that through various sources of liquidity, they have the necessary resources to meet obligations arising from these financial instruments.
We use the same credit underwriting procedures for commitments to extend credit and standby letters of credit as we do for our on-balance-sheet instruments. The credit worthiness of each borrower is evaluated and the amount of collateral, if deemed necessary, is based on the credit evaluation. Collateral held for commitments to extend credit and standby letters of credit varies but may include accounts receivable, inventory, property, plant, equipment, and income-producing commercial properties.
There are no off-balance-sheet contractual relationships, other than those disclosed in this report, that could result in liquidity needs or other commitments or that could significantly impact earnings.
Through its operations, the Bank has made contractual commitments to extend credit in the ordinary course of its business activities. These commitments are legally binding agreements to lend money to the Bank’s customers at predetermined interest rates for a specified period of time. At December 31, 2010, the Bank had issued commitments to extend credit of $5,855,857 and standby letters of credit of $850,000 through various types of commercial lending arrangements. Approximately $99,000 of these commitments to extend credit had variable rates.
22
The following table sets forth the length of time until maturity for unused commitments to extend credit and standby letters of credit at December 31, 2010.
| Within One Month |
After One Through Three Months |
After Three Through Twelve Months |
Within One Year |
Greater Than One Year |
Total | |||||||||||||||||||
| Unused commitments to extend credit |
$ | 455,146 | $ | 1,438,046 | $ | 3,858,762 | $ | 5,751,954 | $ | 103,903 | $ | 5,855,857 | ||||||||||||
| Standby letters of credit |
— | 53,000 | 697,000 | 750,000 | 100,000 | 850,000 | ||||||||||||||||||
| Totals |
$ | 455,146 | $ | 1,491,046 | $ | 4,555,762 | $ | 6,501,954 | $ | 203,903 | $ | 6,705,857 | ||||||||||||
The Bank evaluates each customer’s credit worthiness on a case-by-case basis. The amount of collateral obtained, if deemed necessary by the Bank upon extension of credit, is based on its credit evaluation of the borrower. Collateral varies but may include accounts receivable, inventory, property, plant and equipment, commercial and residential real estate.
IMPACT OF INFLATION
The consolidated financial statements and related financial data presented herein have been prepared in accordance with accounting principles generally accepted in the United States of America which require the measurement of financial position and operating results in terms of historical dollars, without considering changes in relative purchasing power over time due to inflation. Unlike most industrial companies, virtually all of the assets and liabilities of a financial institution are monetary in nature. As a result, interest rates generally have a more significant impact on a financial institution’s performance than does the effect of inflation.
While the effect of inflation on a bank is normally not as significant as its influence on those businesses that have large investments in plant and inventories, it does have an effect. Interest rates generally increase as the rate of inflation increases, but the magnitude of the change in rates may not be the same. While interest rates have traditionally moved with inflation, the effect on income is diminished because both interest earned on assets and interest paid on liabilities, vary directly with each other. Also, increases in the price of goods and services will generally result in increased operating expenses.
ACCOUNTING AND FINANCIAL REPORTING ISSUES
We have adopted various accounting policies, which govern the application of accounting principles generally accepted in the United States in the preparation of its consolidated financial statements. The significant accounting policies are described in the footnotes to the financial statements at December 31, 2010. as filed in the Annual Report on Form 10-K. Certain accounting policies involve significant judgments and assumptions by management which have a material impact on the carrying value of certain assets and liabilities. We consider these accounting policies to be critical accounting policies. The judgments and assumptions used are based on historical experience and other factors, which management believes to be reasonable under the circumstances. Because of the nature of the judgments and assumptions made, actual results could differ from these judgments and estimates which could have a material impact on the carrying values of assets and liabilities and the results of operations.
Of these significant accounting policies, we consider that our policies regarding the allowance for loan losses (the “Allowance”) to be its most critical accounting policy due to the significant degree of our judgment involved in determining the amount of the Allowance. We have developed policies and procedures for assessing the adequacy of the Allowance, recognizing that this process requires a number of assumptions and estimates with respect to its loan portfolio. Our assessments may be impacted in future periods by changes in economic conditions, the impact of regulatory examinations, and the discovery of information with respect to borrowers, which is not known to management at the time of the issuance of the consolidated financial statements. Refer to the discussion under Provision and Allowance for Loan Losses for a detailed description of our estimation process and methodology related to the allowance for loan losses.
23
EFFECT OF GOVERNMENTAL POLICIES
We are affected by the policies of regulatory authorities, including the Federal Reserve Board and the FDIC. An important function of the Federal Reserve Board is to regulate the national money supply. Among the instruments of monetary policy used by the Federal Reserve Board are: purchase and sale of U.S. Government securities in the market place; changes in the discount rate, which is the rate any depository institution must pay to borrow funds from the Federal Reserve; and changes in the reserve requirements of depository institutions. These instruments are effective in influencing the economic and monetary growth, interest rate levels and inflation.
The monetary policies of the Federal Reserve Board and other governmental policies have had a significant effect on the operating results of commercial banks in the past and are expected to continue to do so in the future. Because of changing conditions in the national and international economy and in the money markets, as well as the result of actions by monetary and fiscal authorities, it is not possible to predict with certainty future changes in interest rates, deposit levels or loan demand or whether the changing economic conditions will have a positive or negative effect on operations and earnings.
Legislation from time to time is introduced into the United States Congress and the South Carolina Legislature and other state legislatures, and regulations are proposed by the regulatory agencies that could affect our business. It cannot be predicted whether or in what form any of these proposals will be adopted or the extent to which our business may be affected thereby.
24
MANAGEMENT’S ANNUAL REPORT ON INTERNAL
CONTROL OVER FINANCIAL REPORTING
Our Management is responsible for establishing and maintaining adequate internal control over financial reporting, as defined in Rules 13a-15(f) and 15d-15(f) under the Securities Exchange Act of 1934. Our internal control over financial reporting is a process designed to provide reasonable assurance that assets are safeguarded against loss from unauthorized use or disposition, transactions are executed in accordance with appropriate management authorization and accounting records are reliable for the preparation of financial statements in accordance with generally accepted accounting principles.
Because of its inherent limitations, internal control over financial reporting may not prevent or detect misstatements. Also, projections of any evaluation of effectiveness to future periods are subject to the risk that controls may become inadequate because of changes in conditions, or that the degree of compliance with the policies or procedures may deteriorate.
Management assessed the effectiveness of our internal control over financial reporting as of December 31, 2010. Management based this assessment on criteria for effective internal control over financial reporting described in “Internal Control - Integrated Framework issued by the Committee of Sponsoring Organizations of the Treadway Commission.” Management’s assessment included an evaluation of the design of our internal control over financial reporting and testing of the operational effectiveness of its internal control over financial reporting. Management reviewed the results of its assessment with the Audit Committee of the Board of Directors. Based on this assessment, management believes that Communitycorp maintained effective internal control over financial reporting as of December 31, 2010.
This annual report does not include an attestation report of the Company’s independent registered public accounting firm regarding internal control over financial reporting. Management’s report was not subject to attestation by the Company’s independent registered public accounting firm pursuant to rules of the Securities and Exchange Commission that permit the Company to provide only management’s report in this annual report.
25
REPORT OF INDEPENDENT REGISTERED PUBLIC ACCOUNTING FIRM
To the Shareholders and Board of Directors
Communitycorp and subsidiary
Walterboro, South Carolina
I have audited the accompanying consolidated balance sheet of Communitycorp and subsidiary as of December 31, 2010 and the related consolidated statements of income, changes in shareholders’ equity and comprehensive income and cash flows for the year then ended. These consolidated financial statements are the responsibility of the company’s management. My responsibility is to express an opinion on these consolidated financial statements based on my audit.
I conducted my audit in accordance with the standards of the Public Company Accounting oversight Board (United States). Those standards require that I plan and perform the audit to obtain reasonable assurance about whether the financial statements are free of material misstatement. The Company is not required to have, nor was I engaged to perform an audit of its internal control over financial reporting. My audit included consideration of internal control over financial reporting as a basis for designing audit procedures that are appropriate in the circumstances, but not for the purpose of expressing an opinion on the effectiveness of the Company’s internal control over financial reporting. Accordingly, I express no such opinion. An audit also includes examining, on a test basis, evidence supporting the amounts and disclosures in the financial statements, assessing the accounting principles used and significant estimates made by management, as well as evaluating the overall financial statement presentation. I believe that my audit provides a reasonable basis for my opinion.
In my opinion, the consolidated financial statements referred to above present fairly, in all material respects, the financial position of the Communitycorp and subsidiary as of December 31, 2010 and the results of their operations and their cash flows for the year then ended in conformity with accounting principles generally accepted in the United States of America.
| /s/ Clifton D. Bodiford, CPA |
| Clifton D. Bodiford, CPA Certified Public Accountant |
Columbia, South Carolina
March 18, 2011
26

REPORT OF INDEPENDENT REGISTERED PUBLIC ACCOUNTING FIRM
To the Shareholders and Board of Directors
Communitycorp and subsidiary
Walterboro, South Carolina
We have audited the accompanying consolidated balance sheet of Communitycorp and subsidiary as of December 31, 2009 and the related consolidated statement of income, changes in shareholders’ equity and comprehensive income and cash flows for the year then ended. These consolidated financial statements are the responsibility of the company’s management. Our responsibility is to express an opinion on these consolidated financial statements based on our audit.
We conducted our audit in accordance with the standards of the Public Company Accounting Oversight Board (United States). Those standards require that we plan and perform the audit to obtain reasonable assurance about whether the consolidated financial statements are free of material misstatement. An audit includes examining, on a test basis, evidence supporting the amounts and disclosures in the financial statements. An audit also includes assessing the accounting principles used and significant estimates made by management, as well as evaluating the overall financial statement presentation. We believe that our audit provides a reasonable basis for our opinion. In our opinion, the consolidated financial statements referred to above present fairly, in all material respects, the financial position of Communitycorp and subsidiary as of December 31, 2009 and the results of their operations and their cash flows for the year then ended in conformity with accounting principles generally accepted in the United States of America.
We were not engaged to examine management’s assertion about the effectiveness of Communitycorp and subsidiary’s internal control over financial reporting as of December 31, 2009, included in the accompanying Management’s Annual Report on Internal Control Over Financial Reporting, and, accordingly, we do not express an opinion thereon.

Charleston, South Carolina
March 26, 2010

27
COMMUNITYCORP AND SUBSIDIARY
Consolidated Balance Sheets
| December 31, | ||||||||
| 2010 | 2009 | |||||||
| Assets: |
||||||||
| Cash and cash equivalents: |
||||||||
| Cash and due from banks |
$ | 4,206,974 | $ | 4,141,574 | ||||
| Interest bearing deposits |
9,966,826 | 11,522,692 | ||||||
| Federal funds sold |
2,004,000 | 2,030,000 | ||||||
| Total cash and cash equivalents |
16,177,800 | 17,694,266 | ||||||
| Time deposits with other banks |
1,000,000 | 1,500,000 | ||||||
| Investment securities: |
||||||||
| Securities available-for-sale |
26,955,350 | 24,620,177 | ||||||
| Securities held-to-maturity (estimated fair value of $309,023 in 2010 and $527,115 in 2009) |
299,885 | 564,821 | ||||||
| Nonmarketable equity securities |
302,300 | 302,300 | ||||||
| Total investment securities |
27,557,535 | 25,487,298 | ||||||
| Loans receivable |
105,297,684 | 116,458,480 | ||||||
| Less allowance for loan losses |
(2,019,497 | ) | (2,053,340 | ) | ||||
| Loans receivable, net |
103,278,187 | 114,405,140 | ||||||
| Premises and equipment, net |
2,903,212 | 3,089,929 | ||||||
| Accrued interest receivable |
785,859 | 978,500 | ||||||
| Other real estate owned |
2,764,189 | 340,000 | ||||||
| Other assets |
1,361,893 | 1,897,922 | ||||||
| Total assets |
$ | 155,828,675 | $ | 165,393,055 | ||||
| Liabilities: |
||||||||
| Deposits: |
||||||||
| Noninterest-bearing transaction accounts |
14,077,860 | 14,163,321 | ||||||
| Interest-bearing transaction accounts |
21,295,198 | 23,350,646 | ||||||
| Money market savings accounts |
4,116,167 | 3,234,160 | ||||||
| Savings |
14,452,567 | 13,411,141 | ||||||
| Time deposits $100,000 and over |
46,142,153 | 51,121,376 | ||||||
| Other time deposits |
37,499,876 | 41,407,352 | ||||||
| Total deposits |
137,583,821 | 146,687,996 | ||||||
| Accrued interest payable |
451,331 | 701,979 | ||||||
| Other liabilities |
154,686 | 257,427 | ||||||
| Total liabilities |
138,189,838 | 147,647,402 | ||||||
| Commitments and contingencies - Notes 4 and 10 |
||||||||
| Shareholders’ Equity: |
||||||||
| Preferred stock, $5 par value, 3,000,000 shares authorized and unissued |
— | — | ||||||
| Common stock, $5 par value, 3,000,000 shares authorized; 300,000 shares issued |
1,500,000 | 1,500,000 | ||||||
| Capital surplus |
1,737,924 | 1,737,924 | ||||||
| Retained earnings |
18,782,807 | 18,440,398 | ||||||
| Accumulated other comprehensive income (loss) |
(64,752 | ) | 286,072 | |||||
| Treasury stock (66,997 shares in 2010 and 65,697 shares in 2009) |
(4,317,142 | ) | (4,218,741 | ) | ||||
| Total shareholders’ equity |
17,638,837 | 17,745,653 | ||||||
| Total liabilities and shareholders’ equity |
$ | 155,828,675 | $ | 165,393,055 | ||||
The accompanying notes are an integral part of the consolidated financial statements.
28
COMMUNITYCORP AND SUBSIDIARY
Consolidated Statements of Operations
| Years Ended December 31, | ||||||||
| 2010 | 2009 | |||||||
| Interest income |
||||||||
| Loans, including fees |
$ | 6,806,911 | $ | 7,668,804 | ||||
| Securities |
||||||||
| Taxable Securities |
330,358 | 549,383 | ||||||
| Tax-exempt |
451,266 | 462,881 | ||||||
| Nonmarketable |
1,009 | 306 | ||||||
| Other |
71,721 | 71,473 | ||||||
| Total interest income |
7,661,265 | 8,752,847 | ||||||
| Interest Expense |
||||||||
| Deposit Accounts |
2,148,411 | 3,290,068 | ||||||
| Other Interest Expense |
1 | 7 | ||||||
| 2,148,412 | 3,290,075 | |||||||
| Net Interest Income |
5,512,853 | 5,462,772 | ||||||
| Provision for loan losses |
1,866,000 | 1,083,000 | ||||||
| Net interest income after provision for loan losses |
3,646,853 | 4,379,772 | ||||||
| Other Operating Income |
||||||||
| Service charges on deposit accounts |
448,429 | 485,599 | ||||||
| Commissions on credit life insurance |
8,254 | 8,477 | ||||||
| Other charges, fees, and commissions |
96,017 | 99,809 | ||||||
| Impairment losses on securities available-for-sale |
— | (250,000 | ) | |||||
| Impairment losses on nonmarketable equity securities |
— | (211,935 | ) | |||||
| Gain on sale of available-for-sale securities |
262,011 | — | ||||||
| Other |
26,809 | 24,920 | ||||||
| 841,520 | 156,870 | |||||||
| Non-Interest Expenses |
||||||||
| Salaries and employee benefits |
1,982,695 | 1,910,476 | ||||||
| Net Occupancy Expense |
271,063 | 260,542 | ||||||
| Equipment expense |
357,561 | 361,038 | ||||||
| Other operating |
1,365,514 | 1,535,807 | ||||||
| Total noninterest expenses |
3,976,833 | 4,067,863 | ||||||
| Income Before Income Taxes |
511,540 | 468,779 | ||||||
| Income Tax Expense |
52,130 | 168,305 | ||||||
| Net Income |
$ | 459,410 | $ | 300,474 | ||||
| Earnings per Share |
||||||||
| Weighted average common shares outstanding |
233,251 | 234,849 | ||||||
| Basic earnings per share |
$ | 1.97 | $ | 1.28 | ||||
The accompanying notes are an integral part of the consolidated financial statements.
29
COMMUNITYCORP AND SUBSIDIARY
Consolidated Statements of Changes in Shareholders’ Equity and Comprehensive Income (Loss)
For the years ended December 31, 2010 and 2009
| Accumulated other compre- hensive |
Treasury | Total | ||||||||||||||||||||||||||
| Common stock | Capital | Retained | income | stock, | shareholders’ | |||||||||||||||||||||||
| Shares | Amount | surplus | earnings | (loss) | at cost | equity | ||||||||||||||||||||||
| Balance, December 31, 2008 |
300,000 | $ | 1,500,000 | $ | 1,728,328 | $ | 18,392,614 | $ | 75,701 | $ | (4,003,225 | ) | $ | 17,693,418 | ||||||||||||||
| Net income |
300,474 | 300,474 | ||||||||||||||||||||||||||
| Other comprehensive income, net of tax expense of $110,806 |
210,371 | 210,371 | ||||||||||||||||||||||||||
| Comprehensive income |
510,845 | |||||||||||||||||||||||||||
| Cash dividends paid ($1.07 per share) |
(252,690 | ) | (252,690 | ) | ||||||||||||||||||||||||
| Purchase of treasury stock |
(254,320 | ) | (254,320 | ) | ||||||||||||||||||||||||
| Sale of treasury stock |
9,596 | 38,804 | 48,400 | |||||||||||||||||||||||||
| Balance, December 31, 2009 |
300,000 | 1,500,000 | 1,737,924 | 18,440,398 | 286,072 | (4,218,741 | ) | 17,745,653 | ||||||||||||||||||||
| Net income |
459,410 | 459,410 | ||||||||||||||||||||||||||
| Other comprehensive loss, net of tax benefit of $184,785 |
(350,824 | ) | (350,824 | ) | ||||||||||||||||||||||||
| Comprehensive income |
108,586 | |||||||||||||||||||||||||||
| Cash dividends paid ($0.50 per share) |
(117,001 | ) | (117,001 | ) | ||||||||||||||||||||||||
| Purchase of treasury stock |
(98,401 | ) | (98,401 | ) | ||||||||||||||||||||||||
| Balance, December 31, 2010 |
300,000 | $ | 1,500,000 | $ | 1,737,924 | $ | 18,782,807 | $ | (64,752 | ) | $ | (4,317,142 | ) | $ | 17,638,837 | |||||||||||||
The accompanying notes are an integral part of the consolidated financial statements.
30
COMMUNITYCORP AND SUBSIDIARY
Consolidated Statements of Cash Flows
| Years Ended December 31, | ||||||||
| 2010 | 2009 | |||||||
| Cash flows from operating activities: |
||||||||
| Net income |
$ | 459,410 | $ | 300,474 | ||||
| Adjustments to reconcile net income to net cash provided by operating activities: |
||||||||
| Provision for loan losses |
1,866,000 | 1,083,000 | ||||||
| Depreciation expense |
238,346 | 252,982 | ||||||
| Premium amortization less discount accretion on investment securities |
45,951 | 86,140 | ||||||
| Other than temporary impairment of securities available-for-sale |
— | 250,000 | ||||||
| Other than temporary impairment of nonmarketable equity securities |
— | 211,935 | ||||||
| Gain on sale of securities available-for-sale |
(262,011 | ) | — | |||||
| Loss on sale of other real estate owned |
17,000 | 40,000 | ||||||
| Deferred income tax expense (benefit) |
(153,660 | ) | 22,099 | |||||
| Net amortization of loan fees and costs |
(4,357 | ) | (493 | ) | ||||
| Decrease in accrued interest receivable |
192,641 | 147,214 | ||||||
| Decrease in accrued interest payable |
(250,648 | ) | (251,299 | ) | ||||
| (Increase) decrease in other assets |
723795 | (1,045,206 | ) | |||||
| Increase (decrease) in other liabilities |
47,938 | (77,985 | ) | |||||
| Net cash provided by operating activities |
2,920,405 | 1,018,861 | ||||||
| Cash flows from investing activities: |
||||||||
| Proceeds from maturities of securities available-for-sale |
9,404,344 | 16,763,990 | ||||||
| Proceeds from sale of securities available-for-sale |
4,562,437 | — | ||||||
| Purchases of securities available-for-sale |
(16,621,567 | ) | (13,585,080 | ) | ||||
| Proceeds from maturities of securities held-to-maturity |
265,000 | 756,000 | ||||||
| Purchases of nonmarketable equity securities |
— | (5,800 | ) | |||||
| Proceeds from maturities of time deposits with other banks |
500,000 | — | ||||||
| Proceeds from sale of other real estate owned |
50,000 | 185,000 | ||||||
| Net (increase) decrease in loans to customers |
6,774,121 | (4,254,764 | ) | |||||
| Purchases of premises and equipment |
(51,629 | ) | (314,307 | ) | ||||
| Net cash provided by (used) for investing activities |
4,882,706 | (454,961 | ) | |||||
| Cash flows from financing activities: |
||||||||
| Net increase (decrease) in demand deposits, interest-bearing transaction accounts and savings accounts |
(217,476 | ) | 998,996 | |||||
| Net decrease in time deposits |
(8,886,699 | ) | (24,985 | ) | ||||
| Cash dividends paid |
(117,001 | ) | (252,690 | ) | ||||
| Purchase of treasury stock |
(98,401 | ) | (254,320 | ) | ||||
| Sale of treasury stock |
— | 48,400 | ||||||
| Net cash provided (used) by financing activities |
(9,319,577 | ) | 515,401 | |||||
| Net increase (decrease) in cash and cash equivalents |
(1,516,466 | ) | 1,079,301 | |||||
| Cash and cash equivalents, beginning of year |
17,694,266 | 16,614,965 | ||||||
| Cash and cash equivalents, end of year |
$ | 16,177,800 | $ | 17,694,266 | ||||
| Cash paid during the year for: |
||||||||
| Income taxes |
$ | 13,000 | $ | 357,200 | ||||
| Interest |
2,399,060 | 3,541,374 | ||||||
| Supplemental non cash activities |
||||||||
| Changes in unrealized gains on securities available-for-sale |
$ | (350,824 | ) | $ | 210,371 | |||
| Foreclosures on loans |
2,491,189 | 490,000 | ||||||
The accompanying notes are an integral part of the consolidated financial statements.
31
COMMUNITYCORP AND SUBSIDIARY
Notes to Consolidated Financial Statements
NOTE 1 - SUMMARY OF SIGNIFICANT ACCOUNTING POLICIES
Basis of Presentation - Communitycorp, a bank holding company, (the “Company”), and its subsidiary, Bank of Walterboro (the Bank), provide commercial banking services to domestic markets principally in Colleton, Charleston, and Jasper counties South Carolina. The consolidated financial statements include the accounts of the parent company and its wholly-owned subsidiary after elimination of all significant intercompany balances and transactions.
Disclosure Regarding Segments - The Company reports as one operating segment, as the chief operating decision-maker reviews the results of operations of the Company as a single enterprise.
Management’s Estimates - The preparation of consolidated financial statements in conformity with accounting principles generally accepted in the United States of America requires management to make estimates and assumptions that affect the reported amounts of assets and liabilities and disclosure of contingent assets and liabilities at the date of the financial statements and the reported amounts of income and expenses during the reporting period. Actual results could differ from those estimates.
Material estimates that are particularly susceptible to significant change relate to the determination of the allowance for losses on loans, including valuation allowances for impaired loans, and the valuation of real estate acquired in connection with foreclosures or in satisfaction of loans. In connection with the determination of the value of foreclosed real estate, management obtains independent appraisals for significant properties. Management must also make estimates in determining the estimated useful lives and methods for depreciating premises and equipment.
While management uses available information to recognize losses on loans, future additions to the allowance may be necessary based on changes in local economic conditions. In addition, regulatory agencies, as an integral part of their examination process, periodically review the Company’s allowance for losses on loans. Such agencies may require the Company to recognize additions to the allowance based on their judgments about information available to them at the time of their examination. Because of these factors, it is possible that the allowance for losses on loans and may change in the near term.
Securities Available-for-Sale - Investment securities available-for-sale are carried at amortized cost and adjusted to estimated fair value by recognizing the aggregate unrealized gains or losses in a valuation account. Aggregate market valuation adjustments are recorded in shareholders’ equity net of deferred income taxes. Reductions in fair value considered by management to be other than temporary are reported as a realized loss and a reduction in the cost basis of the security. The adjusted cost basis of securities available-for-sale is determined by specific identification and is used in computing the gain or loss upon sale.
Securities Held-to-Maturity - Investment securities held-to-maturity are stated at cost, adjusted for amortization of premium and accretion of discount computed by the straight-line method. The Company has the ability and management has the intent to hold designated investment securities to maturity. Reductions in market value considered by management to be other than temporary are reported as a realized loss and a reduction in the cost basis of the security.
Nonmarketable Equity Securities – At December 31, 2010 and 2009, non-marketable equity securities consist of the following:
| December 31, | ||||||||
| 2010 | 2009 | |||||||
| Federal Home Loan Bank |
$ | 296,300 | $ | 296,300 | ||||
| Investments in Community Banks |
6,000 | 6,000 | ||||||
| Total |
$ | 302,300 | $ | 302,300 | ||||
32
COMMUNITYCORP AND SUBSIDIARY
Notes to Consolidated Financial Statements
NOTE 1 - SUMMARY OF SIGNIFICANT ACCOUNTING POLICIES - continued
Nonmarketable Equity Securities - continued
The stocks are carried at cost because they have no quoted market value and no ready market exists; however, redemption of this stock has historically been at par value. Investment in Federal Home Loan Bank stock is a condition of borrowing from the Federal Home Loan Bank, and the stock is pledged to collateralize the borrowings. Dividends received on these stocks are included as a separate component of interest income.
Impairment of Investment Securities – Declines in the fair value of individual securities classified as either held-to-maturity or available-for-sale below their amortized cost that are deemed to be other-than-temorary result in write-downs included in operations as realized losses. In estimating other-than temorary impairment, manage considers (1) the length of time and the exten to which the fair value has been less than cost, (2) the financial condition and near-term prospects of the issuer, and (3) the intent and ability of the Company to retain its invesment in the issuer for a period of time sufficient to allow for an anticipated recorvery in fair value.
Loans Receivable and Interest Income – Loans are stated at the amount of unpaid principal reduced by an allowance for loan losses. Interest income on all loans is computed based upon the unpaid principal balance. Interest income is computed using the simple interest method and is recorded in the period earned.
The Company determines a loan to be delinquent when payments have not been made according to contractual terms, typically evidenced by nonpayment of a monthly installment by the due date. The accrual of interest income is discontinued when a loan becomes 90 days past due as to principal or interest. Management may elect to continue the accrual of interest when the estimated net realizable value of collateral exceeds the principal balance and accrued interest.
Loan origination and commitment fees and certain direct loan origination costs (principally salaries and employee benefits) are being deferred and amortized to income over the contractual life of the related loans or commitments, adjusted for prepayments, using the level yield method.
Allowance for Loan Losses - The allowance for loan losses (the “Allowance”) is established as losses are estimated to have occurred through a provision for loan losses charged to earnings. Loan losses are charged against the allowance when management believes the uncollectibility of a loan balance is confirmed. Subsequent recoveries, if any, are credited to the allowance.
The allowance for loan losses is evaluated on a regular basis by management and is based upon management’s periodic review of the collectibility of the loans in light of historical experience, the nature and volume of the loan portfolio, adverse situations that may affect the borrower’s ability to repay, estimated value of any underlying collateral and prevailing economic conditions. This evaluation is inherently subjective as it requires estimates that are susceptible to significant revision as more information becomes available.
The allowance consists of specific, general, and unallocated components. The specific component relates to loans that are classified as either doubtful, substandard or special mention. For such loans that are also classified as impaired, an allowance is established when the discounted cash flows (or collateral value or observable market price) of the impaired loan is lower than the carrying value of that loan. The general component covers non-classified loans and is based on historical loss experience adjusted for qualitative factors. An unallocated component is maintained to cover uncertainties that could affect management’s estimate of probable losses. The unallocated component of the allowance reflects the margin of imprecision inherent in the underlying assumptions used in the methodologies for estimating specific and general losses in the portfolio.
A loan is considered impaired when, based on current information and events, it is probable that the Company will be unable to collect the scheduled payments of principal or interest when due according to the contractual terms of the loan agreement. Factors considered by management in determining impairment include payment status, collateral value, and the probability of collecting scheduled principal and interest payments when due. Loans that experience insignificant payment delays and payment shortfalls generally are not classified as impaired.
33
COMMUNITYCORP AND SUBSIDIARY
Notes to Consolidated Financial Statements
NOTE 1 - SUMMARY OF SIGNIFICANT ACCOUNTING POLICIES - continued
Allowance for Loan Losses - continued
Management determines the significance of payment delays and payment shortfalls on a case-by-case basis, taking into consideration all of the circumstances surrounding the loan and the borrower, including the length of the delay, the reasons for the delay, the borrower’s prior payment record, and the amount of the shortfall in relation to the principal and interest owed. Impairment is measured on a loan by loan basis for commercial and construction loans by either the present value of expected future cash flows discounted at the loan’s effective interest rate, the loan’s obtainable market price, or the fair value of the collateral if the loan is collateral dependent.
Large groups of smaller balance homogeneous loans are collectively evaluated for impairment. Accordingly, the Company does not separately identify individual consumer and residential loans for impairment disclosures, unless such loans are the subject of a restructuring agreement.
All cash receipts on impaired loans are applied to principal until such time as the principal is brought current. After principal has been satisfied, future cash receipts are applied to interest income, to the extent that any interest has been foregone.
Loan Fees and Costs - Nonrefundable fees and certain direct costs associated with the origination of loans are deferred and recognized as a yield adjustment over the contractual life of the related loans, or if the related loan is held for resale, until such time that the loan is sold. As of December 31, 2010 and 2009 the Bank did not have any loans held for sale. Recognition of deferred fees and costs is discontinued on nonaccrual loans until they return to accrual status or are charged-off.
Concentrations of Credit Risk - Financial instruments, which potentially subject the Company to concentrations of credit risk, consist principally of loans receivable, investment securities, federal funds sold and amounts due from banks.
The Company makes loans to individuals and small businesses for various personal and commercial purposes principally in Colleton, Charleston, and Jasper counties South Carolina. The Company’s loan portfolio is not concentrated in loans to any single borrower or a relatively small number of borrowers. Additionally, management is not aware of any concentrations of loans to classes of borrowers or industries that would be similarly affected by economic conditions.
In addition to monitoring potential concentrations of loans to particular borrowers or groups of borrowers, industries and geographic regions, management monitors exposure to credit risk from concentrations of lending products and practices such as loans that subject borrowers to substantial payment increases (e.g. principal deferral periods, loans with initial interest-only periods, etc), and loans with high loan-to-value ratios. Management has determined that there is no concentration of credit risk associated with its lending policies or practices. Additionally, there are industry practices that could subject the Company to increased credit risk should economic conditions change over the course of a loan’s life. For example, the Company makes variable rate loans and fixed rate principal-amortizing loans with maturities prior to the loan being fully paid (i.e. balloon payment loans). These loans are underwritten and monitored to manage the associated risks. Therefore, management believes that these particular practices do not subject the Company to unusual credit risk.
The Company’s investment portfolio consists principally of obligations of the United States, its agencies or its corporations and general obligation municipal securities. In the opinion of management, there is no concentration of credit risk in its investment portfolio. The Company places its deposits and correspondent accounts with and sells its federal funds to high quality institutions. Management believes credit risk associated with correspondent accounts is not significant.
34
COMMUNITYCORP AND SUBSIDIARY
Notes to Consolidated Financial Statements
NOTE 1 - SUMMARY OF SIGNIFICANT ACCOUNTING POLICIES - continued
Premises and Equipment - Premises and equipment are stated at cost, less accumulated depreciation. The provision for depreciation is computed by the straight-line method. Rates of depreciation are generally based on the following estimated useful lives: buildings - 40 years; furniture and equipment - 5 to 10 years. The cost of assets sold or otherwise disposed of, and the related accumulated depreciation are eliminated from the accounts and the resulting gains or losses are reflected in the income statement. Maintenance and repairs are charged to current expense as incurred, and the costs of major renewals and improvements are capitalized.
Other Real Estate Owned - Other real estate owned includes real estate acquired through foreclosure. Other real estate owned is initially recorded at the lower of cost (principal balance of the former loan plus costs of improvements) or estimated fair value. Any write-downs at the dates of acquisition are charged to the allowance for loan losses. Expenses to maintain such assets, subsequent write-downs and gains and losses on disposal are included in other expenses.
FairValue Measurements - The Company follows the guidance for Financial Instruments and Fair Value Measurements and Disclosures. This guidance permits entities to measure many financial instruments and certain other items at fair value. The objective is to improve financial reporting by providing entities with the opportunity to mitigate volatility in reported earnings caused by measuring related assets and liabilities differently without having to apply complex hedge accounting provisions. This guidance clarifies that fair value is an exit price, representing the amount that would be received to sell and asset or paid to transfer a liability in an orderly transaction between market participants. Under this guidance, fair value measurements are not adjusted for transaction costs. This guidance establishes a fair value hierarchy that prioritizes the inputs to valuation techniques used to measure fair value. The hierarchy gives the highest priority to unadjusted quoted prices in active markets for identical assets or liabilities (Level 1 measurements) and the lowest priority to unobservable inputs (Level 3 measurements).
Income and Expense Recognition - The accrual method of accounting is used for all significant categories of income and expense. Immaterial amounts of insurance commissions and other miscellaneous fees are reported when received.
Advertising - Advertising, promotional, and other business development costs generally are expensed as incurred. External costs incurred in producing media advertising are expensed the first time the advertising takes place. External costs relating to direct mailing costs are expensed in the period in which the direct mailings are sent. Expenses charged for advertising were $31,221 and $39,668 at December 31, 2010 and 2009, respectively.
Income Taxes - Provisions for income taxes are based on taxes payable or refundable for the current year and deferred taxes on temporary differences between the amount of taxable income and pretax financial income and between the tax bases of assets and liabilities and their reported amounts in the financial statements. Deferred tax assets and liabilities are included in the financial statements at currently enacted income tax rates applicable to the period in which the deferred tax assets and liabilities are expected to be realized or settled. As changes in tax laws or rates are enacted, deferred tax assets and liabilities are adjusted through the provision for income taxes. In addition, deferred tax assets are reduced by a valuation allowance when, in the opinion of management, it is more likely than not that some portion or all of the deferred tax assets will not be realized. We recognize interest and penalties related to income tax matters in income tax expense.
Retirement and Deferred Compensation Plans - The Company has a trusteed noncontributory profit-sharing plan which provides retirement and other benefits to all full-time employees who have worked 1,000 or more hours during the calendar year and have put in one year of service. All eligible employees must be at least age 21. Contributions are determined annually by the Board of Directors. Expenses charged to earnings for the profit-sharing plan were $67,251 and $87,894 in 2010 and 2009, respectively. The Company’s policy is to fund contributions to the profit-sharing plan in the amount approved by the Board of Directors. In addition, the plan includes a “salary reduction” feature pursuant to Section 401(k) of the Internal Revenue Code. Under the plan and present policies, participants are permitted to make discretionary contributions up to 10% of annual compensation. The Company makes no matching contributions to this plan.
35
COMMUNITYCORP AND SUBSIDIARY
Notes to Consolidated Financial Statements
NOTE 1 - SUMMARY OF SIGNIFICANT ACCOUNTING POLICIES - continued
Retirement and Deferred Compensation Plans - (continued)
Additionally, the Company has a nonqualified voluntary salary deferral plan for certain officers of the Company. Under the plan, these officers may defer up to 25% of their compensation and earn interest on the deferred amount. Upon retirement, the total amount deferred and interest earned is to be paid to each participant over a period not to exceed fifteen years. The total amount deferred and unpaid under this plan was $431,710 and $425,456 at December 31, 2010 and 2009, respectively. Expenses charged to earnings for the salary deferral plan were $0 and $29,000 in 2010 and 2009, respectively. The Company does not provide post employment benefits to employees beyond the plans described above.
Earnings Per Share - Earnings per share is calculated by dividing earnings by the weighted-average number of common shares outstanding during the year. The Company has no instruments which are considered common stock equivalents and therefore, dilutive earnings per share is not presented.
Statement of Cash Flows - For purposes of reporting cash flows, the Company considers certain highly liquid debt instruments purchased with a maturity of three months or less to be cash equivalents. Cash equivalents include amounts due from banks, federal funds sold, and securities purchased under agreements to resell.
Comprehensive Income - Accounting principles generally accepted in the United States of America require that recognized revenue, expenses, gains, and losses be included in net income. Although certain changes in assets and liabilities, such as unrealized gains and losses on available-for-sale securities, are reported as a separate component of the equity section of the balance sheet, such items, along with net income, are components of comprehensive income.
The components of other comprehensive income and related tax effects are as follows:
| Year Ended December 31, | ||||||||
| 2010 | 2009 | |||||||
| Net unrealized gains (losses) on available-for-sale securities arising during the period |
$ | (363,992 | ) | $ | 321,177 | |||
| Reclassification adjustment for gains realized in net income, net of tax |
171,617 | — | ||||||
| Net unrealized gains on securities |
(535,609 | ) | 321,177 | |||||
| Tax expense (benefit) |
(184,785 | ) | 110,806 | |||||
| Net-of-tax amount |
$ | (350,824 | ) | $ | 210,371 | |||
Off-Balance-Sheet Financial Instruments - In the ordinary course of business, the Company has entered into off-balance-sheet financial instruments consisting of commitments to extend credit and standby letters of credit. These financial instruments are recorded in the financial statements when they become payable by the customer.
Recent Accounting Pronouncements - The following is a summary of recent authoritative pronouncements:
In July 2010, the “Receivables” topic of the Accounting Standards Codification (“ASC”) was amended to require expanded disclosures related to a company’s allowance for credit losses and the credit quality of its financing receivables. The amendments will require the allowance disclosures to be provided on a disaggregated basis. The Company is required to comply with the disclosures in its financial statements for the year ended December 31, 2010.
On July 21, 2010, President Obama signed into law the Dodd-Frank Wall Street Reform and Consumer Protection Act (the “Dodd-Frank Act”), which significantly changes the regulation of financial institutions and the financial services industry. The Dodd-Frank Act includes several provisions that will affect how community banks, thrifts, and small bank and thrift holding companies will be regulated in the future. Among other things, these provisions
36
COMMUNITYCORP AND SUBSIDIARY
Notes to Consolidated Financial Statements
NOTE 1 - SUMMARY OF SIGNIFICANT ACCOUNTING POLICIES - continued
Recent Accounting Pronouncements - (continued)
abolish the Office of Thrift Supervision and transfer its functions to the other federal banking agencies, relax rules regarding interstate branching, allow financial institutions to pay interest on business checking accounts, change the scope of federal deposit insurance coverage, and impose new capital requirements on bank and thrift holding companies. The Dodd-Frank Act also establishes the Bureau of Consumer Financial Protection as an independent entity within the Federal Reserve, which will be given the authority to promulgate consumer protection regulations applicable to all entities offering consumer financial services or products, including banks. Additionally, the Dodd-Frank Act includes a series of provisions covering mortgage loan origination standards affecting originator compensation, minimum repayment standards, and pre-payments. Management is actively reviewing the provisions of the Dodd-Frank Act and assessing its probable impact on the Company’s business, financial condition, and results of operations.
In August 2010, two updates were issued to amend various Securities and Exchange Commission (the “SEC”) rules and schedules pursuant to Release No. 33-9026: Technical Amendments to Rules, Forms, Schedules and Codification of Financial Reporting Policies and based on the issuance of SEC Staff Accounting Bulletin 112. The amendments related primarily to business combinations and removed references to “minority interest” and added references to “controlling” and “non-controlling interest(s)”. The updates were effective upon issuance but had no impact on the Company’s financial statements.
Other accounting standards that have been issued or proposed by the Financial Accounting Standards Board (the “FASB”) or other standards-setting bodies are not expected to have a material impact on the Company’s financial position, results of operations or cash flows.
Reclassifications - Certain captions and amounts in the consolidated financial statements of 2009 were reclassified to conform with the 2010 presentation. These reclassifications had no effect on previously reported net income or shareholders’ equity.
NOTE 2 - CASH AND DUE FROM BANKS
The Company is required by regulation to maintain an average cash reserve balance based on a percentage of deposits. The average amounts of the cash reserve balances at December 31, 2010 and 2009 were $623,000 and $648,000, respectively. These requirements were satisfied by vault cash.
NOTE 3 - INVESTMENT SECURITIES
Securities Available-for-Sale
The amortized cost and estimated fair values of securities available-for-sale were:
| Amortized | Gross Unrealized | |||||||||||||||
| Cost | Gains | Losses | Fair Value | |||||||||||||
| December 31, 2010 |
||||||||||||||||
| Government-sponsored enterprises |
$ | 13,891,989 | $ | 11,473 | $ | 312,020 | $ | 13,591,442 | ||||||||
| Mortgage-backed securities |
1,842,249 | 24,286 | 15,269 | 1,851,266 | ||||||||||||
| Obligations of state and local governments |
11,119,970 | 247,905 | 55,233 | 11,312,642 | ||||||||||||
| Other |
200,000 | — | — | 200,000 | ||||||||||||
| Total |
$ | 27,054,208 | $ | 283,664 | $ | 382,522 | $ | 26,955,350 | ||||||||
| December 31, 2009 |
||||||||||||||||
| Government-sponsored enterprises |
$ | 4,963,860 | $ | 11,631 | $ | 27,957 | $ | 4,947,534 | ||||||||
| Mortgage-backed securities |
6,587,104 | 232,420 | 2 | 6,819,522 | ||||||||||||
| Obligations of state and local governments |
12,432,461 | 247,181 | 26,521 | 12,653,121 | ||||||||||||
| Other |
200,000 | — | — | 200,000 | ||||||||||||
| Total |
$ | 24,183,425 | $ | 491,232 | $ | 54,480 | $ | 24,620,177 | ||||||||
37
COMMUNITYCORP AND SUBSIDIARY
Notes to Consolidated Financial Statements
NOTE 3 - INVESTMENT SECURITIES - continued
The following table shows gross unrealized losses and fair value, aggregated by investment category, and length of time that individual securities have been in a continuous unrealized loss position, at December 31, 2010 and December 31, 2009.
| December 31, 2010 | December 31, 2009 | |||||||||||||||
| Fair Value |
Unrealized Losses |
Fair Value |
Unrealized Losses |
|||||||||||||
| Less Than 12 Months |
||||||||||||||||
| Government-sponsored enterprises |
$ | 13,344,043 | $ | 327,289 | $ | 1,874,183 | $ | 27,959 | ||||||||
| Obligations of state and local governments |
2,151,511 | 55,233 | 887,972 | 17,701 | ||||||||||||
| 15,495,554 | 382,522 | 2,762,155 | 45,660 | |||||||||||||
| 12 Months or More |
||||||||||||||||
| Obligations of state and governments |
— | — | 191,180 | 8,820 | ||||||||||||
| $ | 15,495,544 | $ | 382,522 | $ | 2,953,335 | $ | 54,480 | |||||||||
The Company believes that the deterioration in value is attributable to changes in market interest rates and not in credit quality and considers these losses temporary. The Company does not intend to sell these securities and it is more likely than not that the Company will not be required to sell these securities before recovery of their amortized costs. No available-for-sale securities were in a loss position 12 months or more at December 31, 2010. Management evaluates investment securities in a loss position based on length of impairment, severity of impairment and other factors.
Management determined that impairment related to certain securities were not temporary in nature at December 31, 2009. Other then temporary impairment losses were $461,935 for the year ended December 31, 2009. There were no other than temporary impairment losses for 2010.
The amortized cost and estimated fair values of securities available-for-sale based on their contractual maturities are summarized below. Actual maturities may differ from contractual maturities because borrowers may have the right to call or prepay obligations without penalty.
| December 31, 2010 | ||||||||
| Amortized | ||||||||
| Cost | Fair Value | |||||||
| Due in one year or less |
$ | 400,271 | $ | 402,136 | ||||
| Due after one year but within five years |
2,511,396 | 2,528,176 | ||||||
| Due after five years but within ten years |
14,387,735 | 14,446,805 | ||||||
| Due after ten years |
7,912,557 | 7,726,967 | ||||||
| 25,211,959 | 25,104,084 | |||||||
| Mortgage-backed securities |
1,842,249 | 1,851,266 | ||||||
| Total |
$ | 27,054,208 | $ | 26,955,350 | ||||
During 2010 gross proceeds from the sale of available-for-sale securities were $4,562,437 resulting in gains of $262,011. No securities were sold during 2009.
38
COMMUNITYCORP AND SUBSIDIARY
Notes to Consolidated Financial Statements
NOTE 3 - INVESTMENT SECURITIES - continued
Securities Held-To-Maturity
The amortized cost and estimated fair values of securities held-to-maturity were:
| Amortized | Gross Unrealized | |||||||||||||||
| Cost | Gains | Losses | Fair Value | |||||||||||||
| December 31, 2010 - |
||||||||||||||||
| Obligations of state and local governments |
$ | 299,885 | $ | 9,138 | $ | — | $ | 309,023 | ||||||||
| December 31, 2009 - |
||||||||||||||||
| Obligations of state and local governments |
$ | 564,821 | $ | 7,294 | $ | — | $ | 572,115 | ||||||||
The amortized cost and estimated fair values of securities held-to-maturity based on their contractual maturities are summarized below. Actual maturities may differ from contractual maturities because borrowers may have the right to call or prepay obligations without penalty.
| December 31, 2010 | ||||||||
| Amortized | ||||||||
| Cost | Fair Value | |||||||
| Due after one year but within five years |
99,885 | 100,503 | ||||||
| Due after five years but within ten years |
200,000 | 208,520 | ||||||
| Total |
$ | 299,885 | $ | 309,023 | ||||
At December 31, 2010 and 2009, investment securities with an amortized cost of $12,098,918 and $17,599,545, respectively, and a fair value of $12,220,375 and $17,917,819, respectively, were pledged as collateral to secure public deposits and short-term borrowings.
NOTE 4 - LOANS RECEIVABLE
Loans consisted of the following:
| December 31, | ||||||||
| 2010 | 2009 | |||||||
| Real estate – construction |
$ | 2,326,588 | $ | 3,256,857 | ||||
| Real estate – mortgage |
25,251,991 | 31,601,663 | ||||||
| Commercial and industrial |
70,230,829 | 71,750,588 | ||||||
| Consumer and other |
7,488,276 | 9,849,372 | ||||||
| Total gross loans |
$ | 105,297,684 | $ | 116,458,480 | ||||
| The loan portfolio consisted of loans having : |
||||||||
| Variable rates loans |
$ | 1,556,700 | $ | 3,802,991 | ||||
| Fixed rates |
103,740,984 | 112,655,489 | ||||||
| Total gross loans |
$ | 105,297,684 | $ | 116,458,480 | ||||
| Included in the gross loans above are: |
||||||||
| Nonaccrual loans |
$ | 4,805,658 | $ | 2,710,494 | ||||
| Loans past due 90 days still accruing interest |
— | 2,480 | ||||||
39
COMMUNITYCORP AND SUBSIDIARY
Notes to Consolidated Financial Statements
NOTE 4 – LOANS RECEIVABLE - continued
Transactions in the allowance for loan losses are summarized below:
| Years ended December 31, | ||||||||
| 2010 | 2009 | |||||||
| Balance, beginning of year |
$ | 2,053,340 | $ | 1,981,637 | ||||
| Provision charged to operations |
1,866,000 | 1,083,000 | ||||||
| Recoveries on loans previously charged-off |
11,932 | 41,766 | ||||||
| Loans charged-off |
(1,911,775 | ) | (1,053,063 | ) | ||||
| Balance, end of year |
$ | 2,019,497 | $ | 2,053,340 | ||||
The following is an analysis of the allowance for loan losses by class of loans for the year ended December 31, 2010.
| Real Estate Loans | ||||||||||||||||||||||||
| (Dollars in Thousands) |
Total | Construction | Mortgage | Total Real Estate Loans |
Commercial | Consumer and Other |
||||||||||||||||||
| Beginning Balance |
$ | 2,053 | $ | 46 | $ | 486 | $ | 532 | $ | 1,384 | $ | 137 | ||||||||||||
| Charge-offs |
(1,912 | ) | (25 | ) | (57 | ) | (82 | ) | (1,772 | ) | (58 | ) | ||||||||||||
| Recoveries |
12 | — | — | — | 4 | 8 | ||||||||||||||||||
| Provisions |
1,866 | 24 | 56 | 80 | 1,729 | 57 | ||||||||||||||||||
| Ending balance |
$ | 2,019 | $ | 45 | $ | 485 | $ | 530 | $ | 1,345 | $ | 144 | ||||||||||||
At December 31, 2010 the allocation of the allowance for loan losses and the recorded investment in loans summarized on the basis of the Company’s impairment methodology was as follows:
| Real Estate Loans | ||||||||||||||||||||||||
| (Dollars in Thousands) |
Total | Construction | Mortgage | Total Real Estate Loans |
Commercial | Consumer and Other |
||||||||||||||||||
| Allowance for Loan Losses |
||||||||||||||||||||||||
| Examined for Impairment |
||||||||||||||||||||||||
| Individually |
$ | 373 | $ | 30 | $ | — | $ | 30 | $ | 343 | — | |||||||||||||
| Collectively |
1,646 | 15 | 485 | 500 | 1,002 | 144 | ||||||||||||||||||
| Allowance for Loan Losses |
$ | 2,019 | $ | 45 | $ | 485 | $ | 530 | $ | 1,345 | $ | 144 | ||||||||||||
| Total Loans |
||||||||||||||||||||||||
| Examined for Impairment |
||||||||||||||||||||||||
| Individually |
$ | 7,703 | $ | 617 | $ | 643 | $ | 1,260 | $ | 6,192 | 251 | |||||||||||||
| Collectively |
97,595 | 1,710 | 24,609 | 26,939 | 64,039 | 7,237 | ||||||||||||||||||
| Total Loans |
$ | 105,298 | 2,327 | 25,252 | 27,579 | 70,231 | 7,488 | |||||||||||||||||
40
COMMUNITYCORP AND SUBSIDIARY
Notes to Consolidated Financial Statements
NOTE 4 – LOANS RECEIVABLE - continued
The Company identifies impaired loans through its normal internal loan review process. Loans on the Company’s problem loan watch list are considered potentially impaired loans. These loans are evaluated in determining whether all outstanding principal and interest are expected to be collected. Loans are not considered impaired if a minimal delay occurs and all amounts due including accrued interest at the contractual interest rate for the period of delay are expected to be collected.
The following summarizes the Company’s impaired loans by class as of December 31, 2010.
| (Dollars in Thousands) |
Recorded Investment |
Unpaid Principal Balance |
Related Allowance |
|||||||||
| With no related allowance recorded: |
||||||||||||
| Real estate |
||||||||||||
| Construction |
$ | 457 | $ | 457 | $ | — | ||||||
| Mortgage |
643 | 643 | — | |||||||||
| Total real estate loans |
1,100 | 1,100 | — | |||||||||
| Commercial |
4,217 | 4,449 | — | |||||||||
| Consumer and other |
251 | 251 | ||||||||||
| 5,568 | 5,800 | — | ||||||||||
| With an allowance recorded: |
||||||||||||
| Real estate |
||||||||||||
| Construction |
$ | 160 | $ | 185 | $ | 30 | ||||||
| Mortgage |
— | — | ||||||||||
| Total real estate loans |
160 | 185 | 30 | |||||||||
| Commercial |
1,975 | 2,591 | 343 | |||||||||
| Consumer and other |
— | — | ||||||||||
| 2,135 | 2,776 | 373 | ||||||||||
| Total |
||||||||||||
| Real estate |
||||||||||||
| Construction |
$ | 617 | $ | 642 | $ | 30 | ||||||
| Mortgage |
643 | 643 | — | |||||||||
| Total real estate loans |
1,260 | 1,285 | 30 | |||||||||
| Commercial |
6,192 | 7,040 | 343 | |||||||||
| Consumer and other |
251 | 251 | — | |||||||||
| Total |
$ | 7,703 | $ | 8,576 | 373 | |||||||
The following tables summarize information on impaired loans at and for the years ended December 31, 2010 and 2009.
| 2010 | 2009 | |||||||
| Impaired loans with specific allowance |
$ | 2,134,648 | $ | 2,426,363 | ||||
| Impaired loans with no specific allowance |
5,568,593 | 6,331,909 | ||||||
| Total impaired loans – year end |
$ | 7,703,241 | $ | 8,758,272 | ||||
| Related specific allowance – year end |
$ | 373,484 | $ | 760,103 | ||||
| Average recorded investment in impaired loans – year end |
8,512,074 | 6,475,817 | ||||||
| Impaired loans included in nonaccrual |
4,805,658 | 2,710,494 | ||||||
41
COMMUNITYCORP AND SUBSIDIARY
Notes to Consolidated Financial Statements
NOTE 4 – LOANS RECEIVABLE - continued
Interest income on impaired loans other than nonaccrual loans is recognized on an accrual basis. Interest income on nonaccrual loans is recognized only as collected. During 2010 and 2009, interest income recognized on nonaccrual loans was $30,674 and $18,687, respectively. If the nonaccrual loans had been accruing interest at their original contracted rates, related income would have been $275,415 and $167,968 for 2010 and 2009, respectively.
A summary of current, past due and nonaccrual loans as of December 31, 2010 was as follows:
| Past
Due 30-89 Days |
Past Due Over 90 days | Total Past Due |
Current | Total Loans |
||||||||||||||||||||
| (Dollars in Thousands) |
and Accruing |
Non- Accruing |
||||||||||||||||||||||
| Real estate |
||||||||||||||||||||||||
| Construction |
$ | 161 | $ | — | $ | 456 | $ | 617 | $ | 1,710 | $ | 2,327 | ||||||||||||
| Mortgage |
118 | — | 464 | 582 | 24,670 | 25,252 | ||||||||||||||||||
| Total real estate loans |
279 | — | 920 | 1,199 | 26,380 | 27,579 | ||||||||||||||||||
| Commercial |
118 | — | 3,832 | 4,643 | 65,588 | 70,231 | ||||||||||||||||||
| Consumer and other |
237 | — | 54 | 291 | 7,197 | 7,488 | ||||||||||||||||||
| Totals |
$ | 1,327 | $ | — | $ | 4,806 | $ | 6,133 | $ | 99,165 | $ | 105,298 | ||||||||||||
Loans are categorized into risk categories based on relevant information about the ability of borrowers to service their debt, such as: current financial information, historical payment experience, credit documentation, public information, and current economic trends, among other factors. The following definitions are utilized for risk ratings, which are consistent with the definitions used in supervisory guidance:
Special Mention - Loans classified as special mention have a potential weakness that deserves management’s close attention. If left uncorrected, these potential weaknesses may result in deterioration of the repayment prospects for the loan or of the institution’s credit position at some future date.
Substandard - Loans classified as substandard are inadequately protected by the current net worth and paying capacity of the obligor or of the collateral pledged, if any. Loans so classified have a well-defined weakness or weaknesses that jeopardize the liquidation of the debt. They are characterized by the distinct possibility that the institution will sustain some loss if the deficiencies are not corrected.
Doubtful - Loans classified as doubtful have all the weaknesses inherent in those classified as substandard, with the added characteristic that the weaknesses make collection or liquidation in full, on the basis of currently existing facts, conditions, and values, highly questionable and improbable.
Loans not meeting the criteria above that are analyzed individually as part of the above described process are considered to be pass rated loans.
As of December 31, 2010, and based on the most recent analysis performed, the risk category of loans by class of loans is as follows:
| Real Estate Loans | ||||||||||||||||||||||||
| (Dollars in Thousands) |
Total | Construction | Mortgage | Total Real Estate Loans |
Commercial | Consumer and Other |
||||||||||||||||||
| Pass |
$ | 98,620 | $ | 1,871 | $ | 24,697 | $ | 26,568 | $ | 64,792 | $ | 7,259 | ||||||||||||
| Special mention |
1,378 | — | 118 | 118 | 1,035 | 225 | ||||||||||||||||||
| Substandard |
5,300 | 456 | 437 | 893 | 4,403 | 4 | ||||||||||||||||||
| Doubtful |
— | — | — | — | — | — | ||||||||||||||||||
| Total |
$ | 105,298 | $ | 2,327 | $ | 25,252 | $ | 27,579 | $ | 70,231 | $ | 7,488 | ||||||||||||
42
COMMUNITYCORP AND SUBSIDIARY
Notes to Consolidated Financial Statements
NOTE 4 – LOANS RECEIVABLE - continued
The Company is a party to financial instruments with off-balance-sheet risk in the normal course of business to meet the financing needs of its customers. These financial instruments consist of commitments to extend credit and standby letters of credit. Commitments to extend credit are legally binding agreements to lend to a customer at predetermined interest rates as long as there is no violation of any condition established in the contract. Commitments generally have fixed expiration dates or other termination clauses and may require payment of a fee. A commitment involves, to varying degrees, elements of credit and interest rate risk in excess of the amount recognized in the balance sheets. The Company’s exposure to credit loss in the event of nonperformance by the other party to the instrument is represented by the contractual notional amount of the instrument. Since certain commitments are expected to expire without being drawn upon, the total commitment amounts do not necessarily represent future cash requirements. Standby letters of credit are conditional commitments issued to guarantee a customer’s performance to a third party and have essentially the same credit risk as other lending facilities. Standby letters of credit often expire without being used. The Company believes that through various sources of liquidity, it has the necessary resources to meet obligations arising from these financial instruments.
The Company uses the same credit underwriting procedures for commitments to extend credit and standby letters of credit as it does for on-balance sheet instruments. The credit worthiness of each borrower is evaluated and the amount of collateral, if deemed necessary, is based on the credit evaluation. Collateral held for commitments to extend credit and standby letters of credit varies but may include accounts receivable, inventory, property, plant, equipment, and income-producing commercial properties.
The Company is not involved in off-balance-sheet contractual relationships, other than those disclosed in this report that could result in liquidity needs or other commitments or could significantly impact earnings.
The following table summarizes the Company’s off-balance-sheet financial instruments whose contractual amounts represent credit risk:
| December 31, | ||||||||
| 2010 | 2009 | |||||||
| Commitments to extend credit |
$ | 5,855,857 | $ | 7,064,287 | ||||
| Standby letters of credit |
850,000 | 825,000 | ||||||
Management is not aware of any significant concentrations of loans to classes of borrowers or industries that would be affected similarly by economic conditions. At December 31, 2010, the Company was not committed to lend additional funds to borrowers having loans in nonaccrual status.
NOTE 5 - PREMISES AND EQUIPMENT
Premises and equipment consisted of the following:
| December 31, | ||||||||
| 2010 | 2009 | |||||||
| Land |
$ | 710,605 | $ | 710,605 | ||||
| Building and land improvements |
2,581,459 | 2,581,459 | ||||||
| Furniture and equipment |
2,642,455 | 2,642,455 | ||||||
| Total |
5,986,149 | 5,934,519 | ||||||
| Less, accumulated depreciation |
(3,082,937 | ) | (2,844,590 | ) | ||||
| Premises and equipment, net |
$ | 2,903,212 | $ | 3,089,929 | ||||
Depreciation expense totaled $238,346 and $252,982 in 2010 and 2009, respectively.
43
COMMUNITYCORP AND SUBSIDIARY
Notes to Consolidated Financial Statements
NOTE 6 - OTHER REAL ESTATE OWNED
Transactions in other real estate owned for the years ended December 31, 2010 and 2009 are summarized below:
| December 31, | ||||||||
| 2010 | 2009 | |||||||
| Balance, beginning of year |
$ | 340,000 | $ | 75,000 | ||||
| Additions |
2,491,189 | 490,000 | ||||||
| Sales |
(67,000 | ) | (225,000 | ) | ||||
| Balance, end of year |
$ | 2,764,189 | $ | 340,000 | ||||
The Company recognized a net loss of $17,000 and $40,000 on the sale other real estate owned for the year ended December 31, 2010 and 2009, respectively.
NOTE 7 - DEPOSITS
At December 31, 2010, the scheduled maturities of time deposits were as follows:
| Maturing in |
Amount | |||
| 2011 |
$ | 73,251,780 | ||
| 2012 |
8,126,717 | |||
| 2013 |
2,191,336 | |||
| 2014 |
33,184 | |||
| 2015 |
39,012 | |||
| Total |
$ | 83,642,029 | ||
There were no brokered deposits included in time deposits at December 31, 2010 or 2009.
NOTE 8 - RELATED PARTY TRANSACTIONS
Certain parties (principally certain directors and officers of the Company, their immediate families and business interests) were loan customers of, and had other transactions in the normal course of business with the Company. Related party loans are made on substantially the same terms, including interest rates and collateral, as those prevailing at the time for comparable transactions with unrelated persons and do not involve more than normal risk of collectibility. The aggregate dollar amount of loans to related parties was $3,755,550 and $4,530,648 at December 31, 2010 and 2009, respectively. During 2010 and 2009, $380,506 and $608,274 of new loans were made to related parties, respectively, and repayments totaled $1,155,604 and $887,684, respectively.
Legal services were provided to the Company in the ordinary course of business by a law firm in which two of the partners are directors of the Company. The amount paid to this law firm for services rendered during 2010 and 2009 was $40,542 and $1,225, respectively.
NOTE 9 - UNUSED LINES OF CREDIT
The Bank had available at the end of 2010 unused short-term lines of credit to purchase up to $10,000,000 of federal funds from unrelated correspondent institutions. The Bank also has a credit availability agreement with the Federal Home Loan Bank totaling 15 percent of the Bank’s qualifying assets as of any quarter end. As of December 31, 2010, the available credit totaled approximately $24,373,000 and there were no borrowings outstanding. Any borrowings from the FHLB will be secured by a blanket lien on all of the Bank’s 1-4 family residential first lien mortgage loans and/or investment securities and the Federal Home Loan Bank stock that has a carrying value of $296,300 as of December 31, 2010.
44
COMMUNITYCORP AND SUBSIDIARY
Notes to Consolidated Financial Statements
NOTE 10 - COMMITMENTS AND CONTINGENCIES
The Company is subject to claims and lawsuits which arise primarily in the ordinary course of business. At December 31, 2010, management is not aware of any pending or threatened litigation or unasserted claims that could result in losses, if any, that would be material to the financial statements and should be disclosed.
The Company makes loans to individuals and small businesses for various personal and commercial purposes. Although the Company’s loan portfolio is diversified, a substantial portion of its borrowers’ ability to honor the terms of their loans is dependent on business and economic conditions in Colleton, Charleston, and Jasper counties and surrounding areas. The Company’s loan portfolio is not concentrated in loans to any single borrower or in a relatively small number of borrowers. Additionally, management is not aware of any concentrations of loans to classes of borrowers or industries that would be similarly affected by economic conditions.
NOTE 11 - SHAREHOLDERS’ EQUITY
At December 31, 2010 and 2009, the Company had 66,997 and 65,697 shares, respectively held in treasury stock. During 2010 and 2009, the Company purchased 1,300 and 3,179 shares respectively, and sold 0 and 605 shares respectively.
The ability of the Company to pay cash dividends is dependent upon receiving cash in the form of dividends from the Bank. However, certain restrictions exist regarding the ability of the Bank to transfer funds to Communitycorp in the form of cash dividends. Dividends to the Company are payable only from the undivided profits of the Bank. At December 31, 2010, the Bank’s undivided profits were $14,446,388. The Bank is authorized to pay cash dividends up to 100% of net income in any calendar year without obtaining the prior approval of the S.C. Commissioner of Banking provided that the Bank received a composite rating of one or two at the last Federal or State regulatory examination. Under Federal Reserve Board regulations, the amounts of loans or advances from the Bank to the parent company are also restricted.
NOTE 12 - OTHER OPERATING EXPENSES
Other operating expenses are summarized as follows:
| Years ended December, 31 |
2010 | 2009 | ||||||
| Stationary, printing, and postage |
$ | 184,413 | $ | 192,730 | ||||
| Federal deposit insurance premiums |
233,017 | 336,387 | ||||||
| Professional fees |
294,436 | 346,113 | ||||||
| Directors’ fees |
89,600 | 69,300 | ||||||
| Telephone expenses |
79,795 | 74,832 | ||||||
| ATM surcharges |
29,481 | 80,176 | ||||||
| Other real estate owned expenses |
67,666 | 40,000 | ||||||
| Other |
387,106 | 396,269 | ||||||
| Total |
$ | 1,365,514 | $ | 1,535,807 | ||||
45
COMMUNITYCORP AND SUBSIDIARY
Notes to Consolidated Financial Statements
NOTE 13 - INCOME TAXES
Income tax expense included in the consolidated statements of operations is summarized as follows:
| Years ended December, 31 |
2010 | 2009 | ||||||
| Currently payable: |
||||||||
| Federal |
$ | 184,640 | $ | 132,685 | ||||
| State |
21,150 | 13,521 | ||||||
| Total current |
205,790 | 146,206 | ||||||
| Deferred income tax expense (benefit) |
(153,660 | ) | 22,099 | |||||
| Income tax expense |
$ | 52,130 | $ | 168,305 | ||||
The components of deferred tax assets and deferred tax liabilities are as follows:
| December 31, |
2010 | 2009 | ||||||
| Deferred tax assets: |
||||||||
| Allowance for loan losses |
$ | 498,604 | $ | 579,046 | ||||
| Deferred compensation |
146,781 | 144,655 | ||||||
| Capital loss carryforward |
72,058 | 72,058 | ||||||
| Nonaccrual loan interest income |
164,355 | 29,773 | ||||||
| Securities available-for-sale |
34,106 | — | ||||||
| Federal tax credits |
67,403 | — | ||||||
| Other |
9,328 | 11,773 | ||||||
| Total deferred tax assets |
992,635 | 837,305 | ||||||
| Less, valuation allowance |
(70,358 | ) | (70,358 | ) | ||||
| Net deferred tax assets |
922,277 | 766,947 | ||||||
| Deferred tax liabilities: |
||||||||
| Securities available for sale |
— | 150,679 | ||||||
| Accumulated depreciation |
165,537 | 200,272 | ||||||
| Other |
53,539 | 51,240 | ||||||
| Total deferred tax liabilities |
219,076 | 402,191 | ||||||
| Net deferred tax asset recognized |
$ | 703,201 | $ | 364,756 | ||||
Deferred tax assets represent the future tax benefit of deductible differences and, if it is more likely than not that a tax asset will not be realized, a valuation allowance is required to reduce the recorded deferred tax assets to net realizable value. As of December 31, 2010, management has determined that it is more likely than not that the total deferred tax asset will be realized except for the deferred tax asset associated with the capital loss carryforward and, accordingly, has established a valuation allowance only for this item. Net deferred tax assets are included in other assets at December 31, 2010 and 2009.
A reconciliation between the income tax expense and the amount computed by applying the Federal statutory rate of 34% to income before income taxes follows:
| Years ended December, 31 |
2010 | 2009 | ||||||
| Tax expense at statutory rate |
$ | 173,924 | $ | 159,385 | ||||
| State income tax, net of federal income tax benefit |
13,959 | 8,923 | ||||||
| Tax-exempt interest income |
(159,344 | ) | (160,377 | ) | ||||
| Disallowed interest expense |
15,905 | 20,794 | ||||||
| Increase in valuation allowance |
— | 70,358 | ||||||
| Other, net |
7,686 | 69,222 | ||||||
| Total |
$ | 52,130 | $ | 168,305 | ||||
It is the Company’s policy to recognize interest and penalties associated with uncertain tax positions as components of income taxes. The Company had analyzed the tax positions taken or expected to be taken in its tax returns and concluded that it has no liability related to uncertain tax positions. The federal and state tax returns are subject to examination for the years 2007, 2008 and 2009.
46
COMMUNITYCORP AND SUBSIDIARY
Notes to Consolidated Financial Statements
NOTE 14 - FAIR VALUE OF FINANCIAL INSTRUMENTS
Fair Value Measurements
Fair value is the exchange price that would be received for an asset or paid to transfer a liability (an exit price) in the principal or most advantageous market for the asset or liability in an orderly transaction between market participants on the measurement date. The Company utilizes a fair value hierarchy, which maximizes the use of observable inputs and minimizes the use of unobservable inputs when measuring fair value. The three levels of inputs used to measure fair value are as follows:
| Level 1 |
Valuation is based upon quoted prices (unadjusted) in active markets for identical assets or liabilities that the Company has the ability to access. | |
| Level 2 |
Valuation is based upon quoted prices for similar assets and liabilities in active markets, as well as inputs that are observable for the asset or liability (other than quoted prices), such as interest rates, foreign exchange rates, and yield curves that are observable at commonly quoted intervals. | |
| Level 3 |
Valuation is generated from model-based techniques that use at least one significant assumption based on unobservable inputs for the asset or liability, which are typically based on an entity’s own assumptions, as there is little, if any, related market activity. In instances where the determination of the fair value measurement is based on inputs from different levels of the fair value hierarchy, the level in the fair value hierarchy within which the entire fair value measurement falls is based on the lowest level input that is significant to the fair value measurement in its entirety. Company’s assessment of the significance of a particular input to the fair value measurement in its entirety requires judgment, and considers factors specific to the asset or liability. | |
Assets Measured at Fair Value on a Recurring Basis
The following is a description of valuation methodologies used for assets and liabilities recorded at fair value on a recurring basis.
Securities Available-for-Sale - Investment securities available-for-sale are recorded at fair value on a recurring basis. Fair value measurement is based upon quoted prices, if available. If quoted prices are not available, fair values are measured using independent pricing models or other model-based valuation techniques such as the present value of future cash flows, adjusted for the security’s credit rating, prepayment assumptions and other factors such as credit loss assumptions. Level 1 securities include those securities traded on an active exchange, such as the New York Stock Exchange, as well as U.S. Treasury securities that are traded by dealers or brokers in active over-the-counter markets, and money market funds. Level 2 securities include mortgage-backed securities issued by government sponsored entities, municipal bonds, and corporate debt securities. Securities classified as Level 3 include asset-backed securities in less liquid markets.
The table below presents the Company’s assets measured at fair value on a recurring basis as of December 31, 2010, and December 31, 2009, aggregated by the level in the fair value hierarchy within which those measurements fall.
47
COMMUNITYCORP AND SUBSIDIARY
Notes to Consolidated Financial Statements
NOTE 14 - FAIR VALUE OF FINANCIAL INSTRUMENTS - (continued)
Available for Sale Securities:
| Total | Level 1 | Level 2 | Level 3 | |||||||||||||
| December 31, 2010 |
||||||||||||||||
| Government-sponsored enterprises |
$ | 13,591,442 | $ | — | $ | 13,591,442 | $ | — | ||||||||
| Mortgage-backed securities |
1,851,266 | — | 1,851,266 | — | ||||||||||||
| Obligations of state and local governments |
11,312,642 | — | 11,312,642 | — | ||||||||||||
| Other |
200,000 | — | 200,000 | — | ||||||||||||
| Total |
$ | 26,955,350 | $ | — | $ | 26,955,350 | $ | — | ||||||||
| December 31, 2009 |
||||||||||||||||
| Government-sponsored enterprises |
$ | 4,947,534 | $ | — | $ | 4,947,534 | $ | — | ||||||||
| Mortgage-backed securities |
6,819,522 | — | 6,819,522 | — | ||||||||||||
| Obligations of state and local governments |
12,653,121 | — | 12,653,121 | — | ||||||||||||
| Other |
200,000 | — | 200,000 | — | ||||||||||||
| Total |
$ | 24,620,177 | $ | — | $ | 24,620,177 | $ | — | ||||||||
There were no liabilities carried at fair value at December 31, 2010 or December 31, 2009.
Assets Measured at Fair Value on a Nonrecurring Basis
Certain assets and liabilities are measured at fair value on a nonrecurring basis. These instruments are not measured at fair value on an ongoing basis, but subject to fair value in certain circumstances, such as when there is evidence of impairment that may require write-downs. The write-downs of the Company’s more significant assets or liabilities, which are measured on a nonrecurring basis, are based on the lower of amortized or estimated fair value.
The following is a description of valuation methodologies used for assets and liabilities recorded at fair value on a recurring basis.
Impaired Loans - The Company is predominantly an asset-based lender with real estate serving as collateral on a substantial majority of loans. Loans that are deemed impaired are primarily valued on a nonrecurring basis at the fair values of the underlying real estate collateral. Such fair values are obtained using independent appraisals, which the Company considers to be Level 2 inputs.
Other Real Estate Owned - Other real estate owned consists of assets acquired in settlement of loans and is carried at the lower of carrying value or fair value on a non-recurring basis. The fair value is dependent primarily upon independent appraisals, which the Company considers Level 2 inputs.
The table below presents the Company’s assets measured at fair value on a nonrecurring basis as of December 31, 2010, and December 31, 2009, aggregated by the level in the fair value hierarchy within which those measurements fall.
| Total | Level 1 | Level 2 | Level 3 | |||||||||||||
| December 31, 2010 |
||||||||||||||||
| Impaired loans, net of specific allowance |
$ | 7,329,757 | $ | — | $ | 7,329,757 | $ | — | ||||||||
| Other real estate owned |
2,764,189 | — | 2,764,189 | — | ||||||||||||
| Total assets at fair value |
$ | 10,093,946 | $ | — | $ | 10,093,946 | $ | — | ||||||||
| December 31, 2009 |
||||||||||||||||
| Impaired loans, net of specific allowance |
$ | 8,758,272 | $ | — | $ | 8,758,272 | $ | — | ||||||||
| Other real estate owned |
340,000 | — | 340,000 | — | ||||||||||||
| Total assets at fair value |
$ | 9,098,272 | $ | — | $ | 9,098,272 | $ | — | ||||||||
48
COMMUNITYCORP AND SUBSIDIARY
Notes to Consolidated Financial Statements
NOTE 14 - FAIR VALUE OF FINANCIAL INSTRUMENTS - (continued)
There were no liabilities carried at fair value at December 31, 2010 or December 31, 2009.
Fair Value Disclosures
The fair value of a financial instrument is the amount at which the asset or obligation could be exchanged in a current transaction between willing parties, other than in a forced or liquidation sale. Fair value estimates are made at a specific point in time based on relevant market information and information about the financial instruments. Because no market value exists for a significant portion of the financial instruments, fair value estimates are based on judgments regarding future expected loss experience, current economic conditions, risk characteristics of various financial instruments, and other factors. Premise and equipment, accrued interest receivable, other assets, accrued interest payable and other liabilities are not considered financial instruments. The following methods and assumptions were used to estimate the fair value of significant financial instruments:
Cash and Due from Banks - The carrying amount is a reasonable estimate of fair value.
Federal Funds Sold - Federal funds sold are typically for a term of one day, and the carrying amount approximates the fair value.
Time Deposits with Other Banks - The carrying value of these instruments is a reasonable estimate of fair value.
Investment Securities - The fair values of marketable securities held-to-maturity are based on quoted market prices or dealer quotes. For securities available-for-sale, fair value equals the carrying amount, which is the quoted market price. If quoted market prices are not available, fair values are based on quoted market prices of comparable securities. The carrying amount of nonmarketable securities is a reasonable estimate of fair value since no ready market exists for these securities.
Loans Receivable - For certain categories of loans receivable, such as variable rate loans which are repriced frequently and have no significant change in credit risk and credit card receivables, fair values are based on the carrying amounts. The fair value of other types of loans is estimated by discounting the future cash flows using the current rates at which similar loans would be made to the borrowers with similar credit ratings and for the same remaining maturities.
Deposits - The fair value of demand deposits, interest–bearing transaction, savings, and money market accounts is the amount payable on demand at the reporting date. The fair values of time deposits are estimated using a discounted cash flow calculation
The carrying values and estimated fair values of the Company’s financial instruments were as follows:
| December 31 | December 31 | |||||||||||||||
| 2010 | 2009 | |||||||||||||||
| Carrying Amount |
Estimated Fair Value |
Carrying Amount |
Estimated Fair Value |
|||||||||||||
| Financial Assets: |
||||||||||||||||
| Cash and due from banks |
$ | 14,173,800 | $ | 14,173,800 | $ | 15,664,266 | $ | 15,664,266 | ||||||||
| Federal funds sold |
2,004,000 | 2,004,000 | 2,030,000 | 2,030,000 | ||||||||||||
| Time deposits with other banks |
1,000,000 | 1,000,000 | 1,500,000 | 1,500,000 | ||||||||||||
| Securities available-for-sale |
26,955,350 | 26,955,350 | 24,620,177 | 24,620,177 | ||||||||||||
| Securities held-to-maturity |
299,885 | 309,023 | 564,821 | 572,115 | ||||||||||||
| Nonmarketable equity securities |
302,300 | 302,300 | 302,300 | 302,300 | ||||||||||||
| Loans receivable, gross |
105,297,684 | 105,748,184 | 116,458,480 | 115,567,742 | ||||||||||||
49
COMMUNITYCORP AND SUBSIDIARY
Notes to Consolidated Financial Statements
NOTE 14 - FAIR VALUE OF FINANCIAL INSTRUMENTS - (continued)
| Financial Liabilities: |
||||||||||||||||
| Demand deposit, interest-bearing transaction, money market, and savings accounts |
$ | 53,941,792 | $ | 53,941,792 | $ | 54,159,268 | $ | 54,159,268 | ||||||||
| Time deposits |
83,642,029 | 84,001,754 | 92,528,728 | 92,710,544 | ||||||||||||
| Notional Amount |
Notional Amount |
|||||||||||||||
| Off-Balance Sheet Financial Instruments: |
||||||||||||||||
| Commitments |
$ | 5,855,857 | $ | 7,064,287 | ||||||||||||
| Standby letters of credits |
850,000 | 825,000 | ||||||||||||||
NOTE 15 - REGULATORY MATTERS
The Bank is subject to various regulatory capital requirements administered by the federal banking agencies. Failure to meet minimum capital requirements can initiate certain mandatory, and possibly additional discretionary actions by regulators that, if undertaken, could have a direct material effect on the Bank’s financial statements. Under capital adequacy guidelines and the regulatory framework for prompt corrective action, the Bank must meet specific capital guidelines that involve quantitative measures of the Bank’s assets, liabilities, and certain off-balance-sheet items as calculated under regulatory accounting practices. The Bank’s capital amounts and classification are also subject to qualitative judgments by the regulators about components, risk weightings, and other factors.
Quantitative measures established by regulation to ensure capital adequacy require the Bank to maintain minimum ratios of Tier 1 and total capital as a percentage of assets and off-balance-sheet exposures, adjusted for risk weights ranging from 0% to 100%. Tier 1 capital consists of common shareholders’ equity, excluding the unrealized gain or loss on securities available for sale, minus certain intangible assets. Tier 2 capital consists of the allowance for loan losses subject to certain limitations. Total capital for purposes of computing the capital ratios consists of the sum of Tier 1 and Tier 2 capital. Total regulatory minimum requirements are 4% for Tier 1 and 8% for total risk-based capital.
As of December 31, 2010 and 2009, management believes that the Bank is well capitalized under the regulatory framework for prompt-corrective action.
The following table summarizes the capital amounts and ratios of the Bank and the regulatory minimum requirements.
| Actual | For Capital Adequacy Purposes |
To Be Well- Capitalized Under Prompt Corrective Action Provisions |
||||||||||||||||||||||
| Minimum | Minimum | |||||||||||||||||||||||
| Amount | Ratio | Amount | Ratio | Amount | Ratio | |||||||||||||||||||
| December 31, 2010 |
||||||||||||||||||||||||
| Total capital (to risk-weighted assets) |
$ | 19,128,571 | 16.49 | % | $ | 9,283,040 | 8.00 | % | $ | 11,603,800 | 10.00 | % | ||||||||||||
| Tier 1 capital (to risk-weighted assets) |
17,678,096 | 15.23 | 4,641,520 | 4.00 | 6,962,280 | 6.00 | ||||||||||||||||||
| Tier 1 average ratio |
17,678,096 | 11.15 | 6,340,280 | 4.00 | 7,925,350 | 5.00 | ||||||||||||||||||
| December 31, 2009 |
||||||||||||||||||||||||
| Total capital (to risk-weighted assets) |
$ | 18,956,794 | 14.92 | % | $ | 10,165,600 | 8.00 | % | $ | 12,707,000 | 10.00 | % | ||||||||||||
| Tier 1 capital (to risk-weighted assets) |
17,368,419 | 13.67 | 5,082,800 | 4.00 | 7,624,200 | 6.00 | ||||||||||||||||||
| Tier 1 capital (to average assets) |
17,368,419 | 10.48 | 6,627,400 | 4.00 | 8,284,250 | 5.00 | ||||||||||||||||||
The Federal Reserve Board has similar requirements for bank holding companies. The Company is currently not subject to these requirements because the Federal Reserve guidelines contain an exemption for bank holding companies with less than $500,000,000 in consolidated assets.
50
COMMUNITYCORP AND SUBSIDIARY
Notes to Consolidated Financial Statements
NOTE 16 - COMMUNITYCORP (PARENT COMPANY ONLY)
Presented below are the condensed financial statements for Communitycorp (Parent Company Only).
Condensed Balance Sheets
| December 31, | ||||||||
| 2010 | 2009 | |||||||
| Assets |
||||||||
| Cash |
$ | 15,698 | $ | 81,497 | ||||
| Investment in banking subsidiary |
17,613,344 | 17,654,491 | ||||||
| Non-marketable equity securities |
6,000 | 6,000 | ||||||
| Other assets |
3,795 | 3,665 | ||||||
| Total assets |
$ | 17,638,837 | $ | 17,745,653 | ||||
| Shareholders’ equity |
$ | 17,638,837 | $ | 17,745,653 | ||||
Condensed Statements of Income
| Years ended December 31, | ||||||||
| 2010 | 2009 | |||||||
| Income |
||||||||
| Dividends from banking subsidiary |
$ | 150,000 | $ | 496,000 | ||||
| Other income |
13 | 17 | ||||||
| Total income |
150,013 | 496,017 | ||||||
| Expenses |
410 | — | ||||||
| Income before income taxes and equity in undistributed earnings of banking subsidiary |
149,603 | 496,017 | ||||||
| Income tax expense (benefit) |
(130 | ) | 2 | |||||
| Equity in undistributed earnings of banking subsidiary |
309,677 | (195,541 | ) | |||||
| Net income |
$ | 459,410 | $ | 300,474 | ||||
Condensed Statements of Cash Flows
| Years ended December 31, | ||||||||
| 2010 | 2009 | |||||||
| Cash flows from operating activities |
||||||||
| Net income |
$ | 459,410 | $ | 300,474 | ||||
| Adjustments to reconcile net income to net cash provided by operating activities: |
||||||||
| Equity in undistributed earnings of banking subsidiary |
(309,677 | ) | 195,541 | |||||
| (Increase) decrease in other assets |
(130 | ) | 3 | |||||
| Net cash provided by operating activities |
149,603 | 496,018 | ||||||
| Cash flows from financing activities |
||||||||
| Cash dividends paid |
(117,001 | ) | (252,690 | ) | ||||
| Purchases of treasury stock |
(98,401 | ) | (254,320 | ) | ||||
| Sale of treasury stock |
— | 48,400 | ||||||
| Net cash used by financing activities |
(215,402 | ) | (458,610 | ) | ||||
| Increase (decrease) in cash |
(65,799 | ) | 37,408 | |||||
| Cash, beginning of year |
81,497 | 44,089 | ||||||
| Cash, ending of year |
$ | 15,698 | $ | 81,497 | ||||
51
COMMUNITYCORP AND SUBSIDIARY
NOTE 17 – SUBSEQUENT EVENTS
Subsequent events are events or transactions that occur after the balance sheet date but before financial statements are issued. Recognized subsequent events are events or transactions that provide additional evidence about conditions that existed at the date of the balance sheet, including the estimates inherent in the process of preparing financial statements. Nonrecognized subsequent events are events that provide evidence about conditions that did not exist at the date of the balance sheet but arose after that date. Management has reviewed events occurring through the date the financial statements were issued and no subsequent events occurred, requiring accrual or disclosure.
52
COMMUNITYCORP AND SUBSIDIARY
BOARD OF DIRECTORS
| George W. Cone |
J. Barnwell Fishburne | |||
| Attorney |
Owner, Fishburne & Co | |||
| McLeod, Fraser & Cone |
Real Estate | |||
| Steven Murdaugh |
W. Roger Crook | |||
| Attorney |
Chief Executive Officer | |||
| Peters, Murdaugh, Eltzroth & Derrick, PA |
and President | |||
| Bank of Walterboro | ||||
| Harold M. Robertson |
Peden B. McLeod | |||
| Retired |
Chairman of the Board | |||
| Attorney | ||||
| McLeod, Fraser & Cone | ||||
| J. Reaves McLeod |
Harry L. Hill | |||
| Attorney |
Retired | |||
| McLeod, Fraser & Cone |
||||
| OFFICERS | ||||
| W. Roger Crook |
Cynthia Mills |
James M. Bunton Jr. | ||
| Chief Executive Officer |
Branch Manager |
Loan Officer | ||
| and President |
||||
| Gwendolyn P. Bunton |
M. Ellison Young |
Lawton Huggins | ||
| Vice President and Cashier |
Vice President |
Loan Officer | ||
| Lynn H. Murdaugh |
Joanne Herndon | |||
| Assistant Vice President |
Branch Manager | |||
| and Administrative Assistant |
||||
| Bruce Tate |
Marianne Hawkins | |||
| Loan Officer |
Loan Officer | |||
| Dodd Hulsey |
Pamela Nelson | |||
| Loan Officer |
Internal Auditor | |||
| STAFF MEMBERS | ||||
| Annette Lyons |
Joy Koth | |||
| Tanya Hickman |
Sharon Milligan | |||
| Danielle Mock |
Melanie Todd | |||
| Casey Beach |
Debra Bowers | |||
| Carolyn Brant |
Lynn Hiott | |||
| Dorothy Brunson |
Lindsey Turner | |||
| Natalie Powers |
Melinda Tanner | |||
| Jennifer Crosby |
Pam O’Quinn | |||
| Betty Ford |
Kelly Strickland | |||
| Melissa T. Smyly |
Jeanne Raven | |||
| Sarah Herndon |
Tracy Valentine | |||
| Sharon Hillier |
Candice Kubik | |||
| Carolyn Rahn |
Rose Walker | |||
| Stephanie Kelly |
Jessica Pahl | |||
| Kathy Breland |
Erin Leming | |||
| Stephanie Strickland |
Louie Whidden | |||
| Melissa McMillan |
||||
53
COMMUNITYCORP AND SUBSIDIARY
CORPORATE DATA
ANNUAL MEETING:
The Annual Meeting of Shareholders of Communitycorp will be held at 6 p.m. on Wednesday, April 27, 2011 at Bank of Walterboro, 1100 North Jefferies Boulevard, Walterboro, South Carolina.
| CORPORATE OFFICE: |
GENERAL COUNSEL: | |||
| P.O. Box 1707 |
McLeod, Fraser & Cone | |||
| 1100 North Jefferies Blvd. |
P.O. Box 230 | |||
| Walterboro, S.C. 29488 |
Washington Street | |||
| (843) 549-2265 |
Walterboro, S.C. 29488 | |||
| STOCK TRANSFER DEPARTMENT: |
INDEPENDENT REGISTERED PUBLIC ACCOUNTING FIRM: | |||
| Bank of Walterboro |
Clifton D. Bodiford | |||
| P.O. Box 1707 |
Certified Public Accountant | |||
| Walterboro, S.C. 29488 |
4406-B Forest Dr. Suite 301 | |||
| Columbia, S.C. 29260-6556 | ||||
STOCK INFORMATION:
The Common Stock of Communitycorp is not listed on any exchange, nor is there a recognized or established market. There is limited trading in the Company’s shares of Common Stock. Management believes that the Common Stock has traded between $75.35 to $80.00 per share, during the past two years. There were 551 shareholders of record as of December 31, 2010.
The ability of Communitycorp to pay cash dividends is dependent upon receiving cash in the form of dividends from Bank of Walterboro. However, certain restrictions exist regarding the ability of the Bank to transfer funds to Communitycorp in the form of cash dividends. All of the Bank’s dividends to the Company are payable only from the undivided profits of the Bank.
FORM 10-K
The Company will furnish upon request, free of charge, copies of the Annual Report and the Company’s Report to the Securities and Exchange Commission (Form 10-K) by contacting Gwen P. Bunton, Vice President, Communitycorp, P.O. Box 1707, Walterboro, South Carolina 29488.
This Annual Report serves as the ANNUAL FINANCIAL DISCLOSURE STATEMENT furnished pursuant to Part 350 of the Federal Deposit Insurance Corporation’s Rules and Regulations. THIS STATEMENT HAS NOT BEEN REVIEWED OR CONFIRMED FOR ACCURACY OR RELEVANCE BY THE FEDERAL DEPOSIT INSURANCE CORPORATION.
54
COMMUNITYCORP AND SUBSIDIARY
SERVICES
All Day Banking
American Express Travelers Checks
ATM Service
Bank By Mail
Business Checking
Image of Canceled Checks Returned with Statement
Cashiers Checks
Certificates of Deposit
Christmas Clubs
Collection Items
Commercial Loans
Debit Cards
Direct Deposits
Discount Brokerage Service
Drive-In Service
Individual Retirement Accounts
Interest Checking
Internet Banking
Letters of Credit
Money Market Accounts
Mortgage Loans
Night Depository
Overdraft Protection
Personal Checking
Personal Lines of Credit
Personal Loans
Regular Savings
Safe Deposit Boxes
Senior Checking
U.S. Savings Bonds
Visa and Master Card
Wire Transfers
§
110 Forest Hills Road, Walterboro, S.C. 29488
1100 North Jefferies Boulevard, Walterboro, S.C. 29488
6225 Savannah Highway, Ravenel, S.C. 29470
8058 East Main Street, Ridgeland, SC 29936
Member FDIC
55