Attached files
| file | filename |
|---|---|
| 8-K - WESTFIELD FINANCIAL, INC. 8-K - Western New England Bancorp, Inc. | a6729835.htm |
Exhibit 99.1
WESTFIELD FINANCIAL, INC. ANNUAL MEETING OF SHAREHOLDERS MAY 19, 2011

FORWARD – LOOKING STATEMENTS Today’s presentation may contain “forward-looking statements” which may be identified by the use of such words as “believe,” “expect,” “anticipate,” “should,” “planned,” “estimated,” and “potential.” Examples of forward-looking statements include, but are not limited to, estimates with respect to our financial condition and results of operation and business that are subject to various factors which could cause actual results to differ materially from these estimates. These factors include, but are not limited to: general and local economic conditions; changes in interest rates, deposit flows, demand for mortgages and other loans, real estate values, and competition; changes in accounting principles, policies, or guidelines; changes in legislation or regulation; and other economic, competitive, governmental, regulatory, and technological factors affecting our operations, pricing, products, and services. Any or all of our forward-looking statements in today’s presentation or in any other public statements we make may turn out to be wrong. They can be affected by inaccurate assumptions we might make or known or unknown risks and uncertainties. Consequently, no forward-looking statements can be guaranteed. We disclaim any obligation to subsequently revise any forward-looking statements to reflect events or circumstances after the date of such statements, or to reflect the occurrence of anticipated or unanticipated events
Highlights and Achievements James C. Hagan, President and Chief Executive Officer
HIGHLIGHTS Very well capitalized. Tier 1 Capital ratio of 17.32%. We continue to have some of the highest capital ratios in Massachusetts Deposits surpassed $700 million, with an increase of $46 million for the twelve months ended March 31, 2011. Total loans have reached $518 million, representing 13% growth, with residential mortgages increasing by $71 million for the twelve months ended March 31, 2011.
CONSUMER & BUSINESS BANKING Redefined Product Set for Relationship Banking: Benefits customers who do more business with Westfield Bank. Enhanced business development skills of Branch Managers: Business Banking Calling Programs Introduced Bank @ Work program Enhanced the bank-at-college program Resulted in strong growth in 2010 and 2011.
COMMITMENT TO COMMUNITY In 2010, Westfield Bank donated $278,000 through our Future Funds Program We encourage and support employee involvement in community service activities.
ACCESSIBILITY & CONVENIENCE Enhanced electronic banking capabilities including mobile banking and financial management tools. Added payroll and online merchant service processing options for small businesses. Extended branch hours & added coin counting machines.
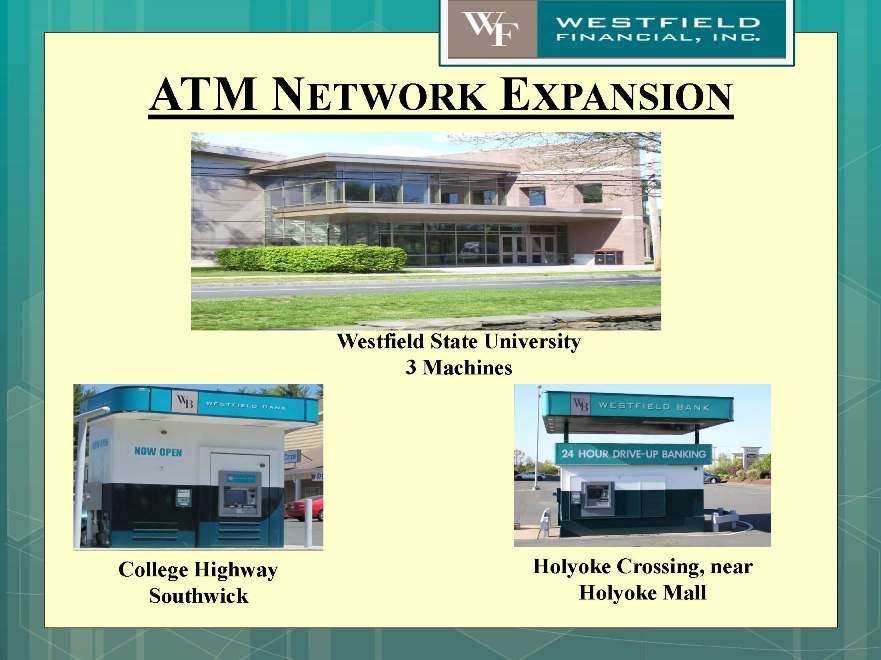
ATM NETWORK EXPANSION College Highway Southwick Holyoke Crossing, near Holyoke Mall Westfield State University 3 Machines
SELECTED FINANCIAL HIGHLIGHTS Leo R. Sagan Jr., Chief Financial Officer
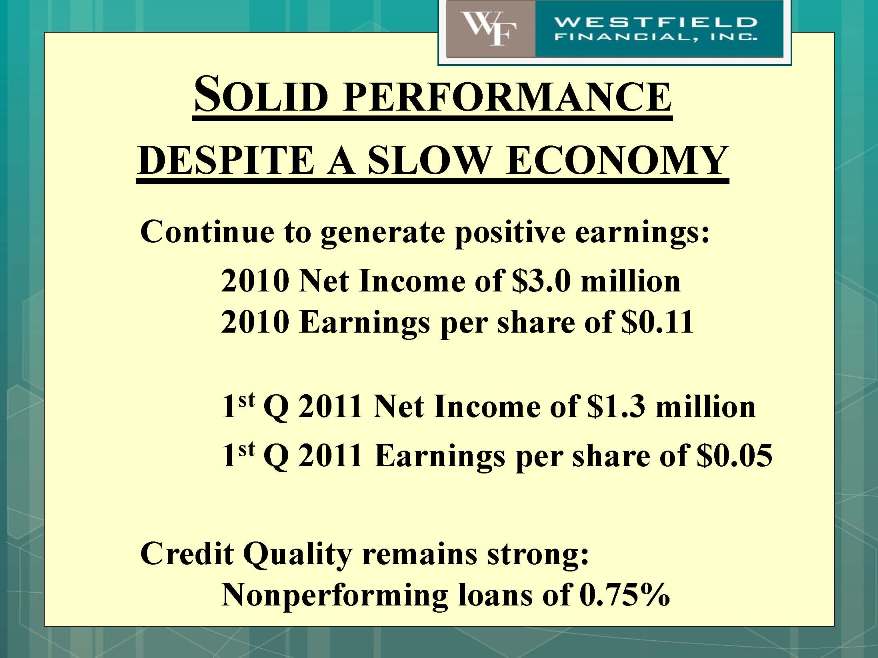
SOLID PERFORMANCE DESPITE A SLOW ECONOMY Continue to generate positive earnings: 2010 Net Income of $3.0 million 2010 Earnings per share of $0.11 1st Q 2011 Net Income of $1.3 million 1st Q 2011 Earnings per share of $0.05 Credit Quality remains strong: Nonperforming loans of 0.75%
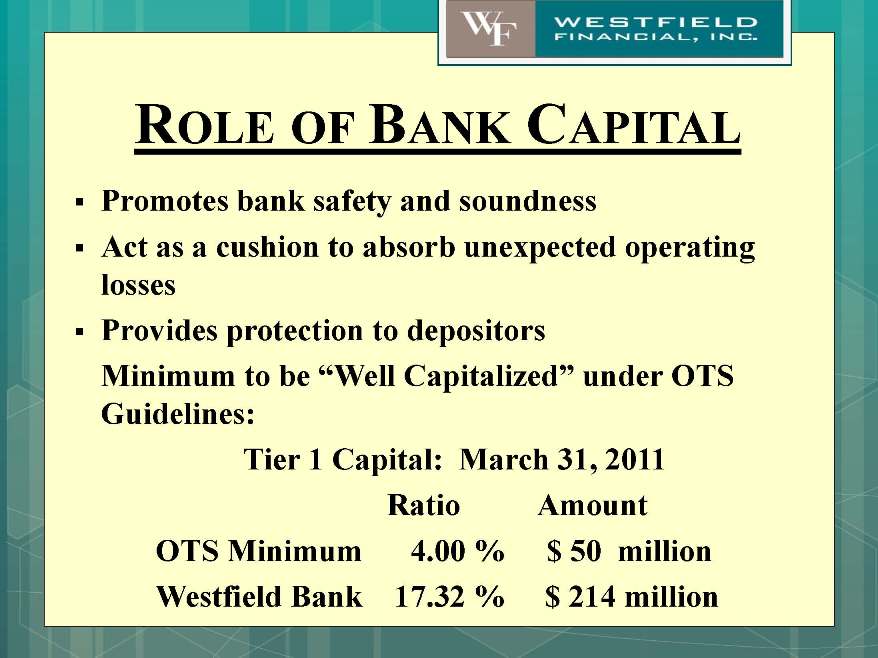
ROLE OF BANK CAPITAL Promotes bank safety and soundness Act as a cushion to absorb unexpected operating losses Provides protection to depositors Minimum to be “Well Capitalized” under OTS Guidelines: Tier 1 Capital: March 31, 2011 Ratio Amount OTS Minimum 4.00 % $ 50 million Westfield Bank 17.32 % $ 214 million
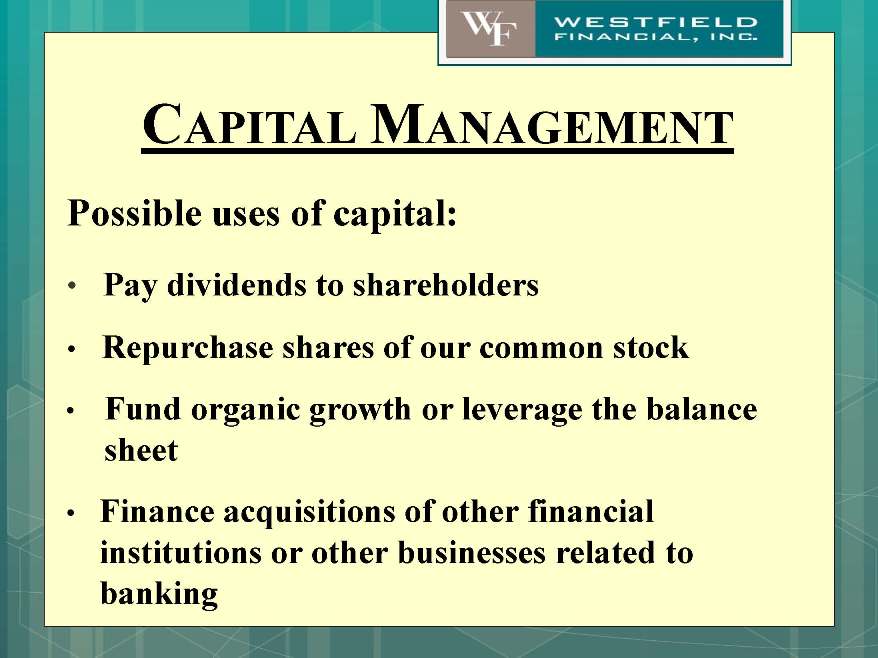
CAPITAL MANAGEMENT Possible uses of capital: Pay dividends to shareholders Repurchase shares of our common stock Fund organic growth or leverage the balance sheet Finance acquisitions of other financial institutions or other businesses related to banking
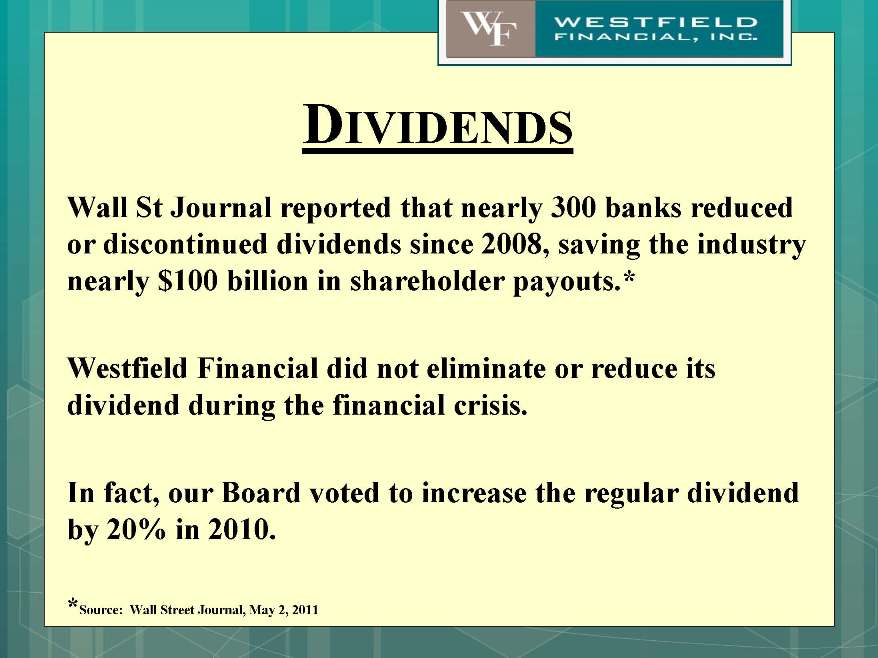
DIVIDENDS Wall St Journal reported that nearly 300 banks reduced or discontinued dividends since 2008, saving the industry nearly $100 billion in shareholder payouts.* Westfield Financial did not eliminate or reduce its dividend during the financial crisis. In fact, our Board voted to increase the regular dividend by 20% in 2010. *Source: Wall Street Journal, May 2, 2011
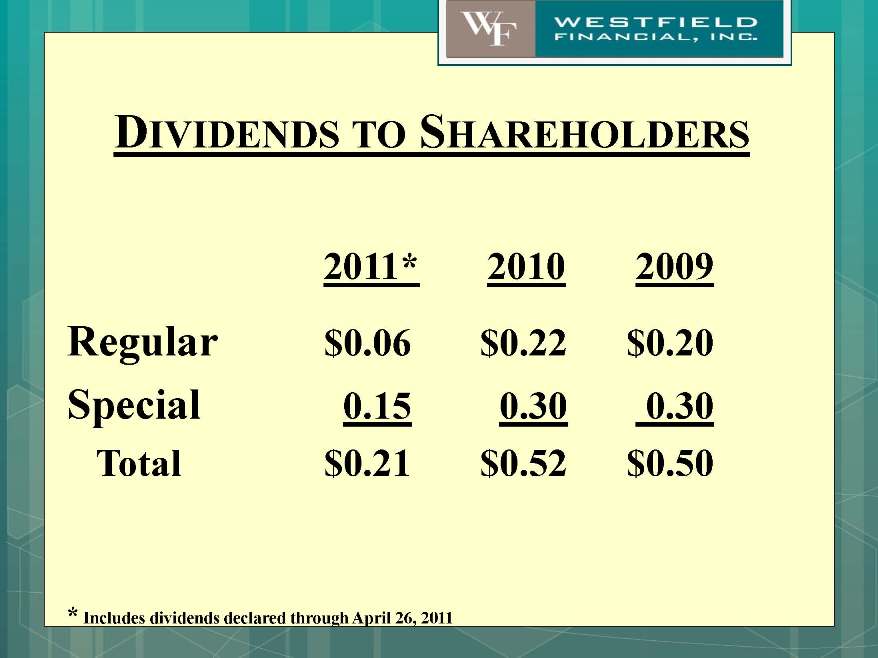
DIVIDENDS TO SHAREHOLDERS 2011* 2010 2009 Regular $0.06 $0.22 $0.20 Special 0.15 0.30 0.30 Total $0.21 $0.52 $0.50 * Includes dividends declared through April 26, 2011
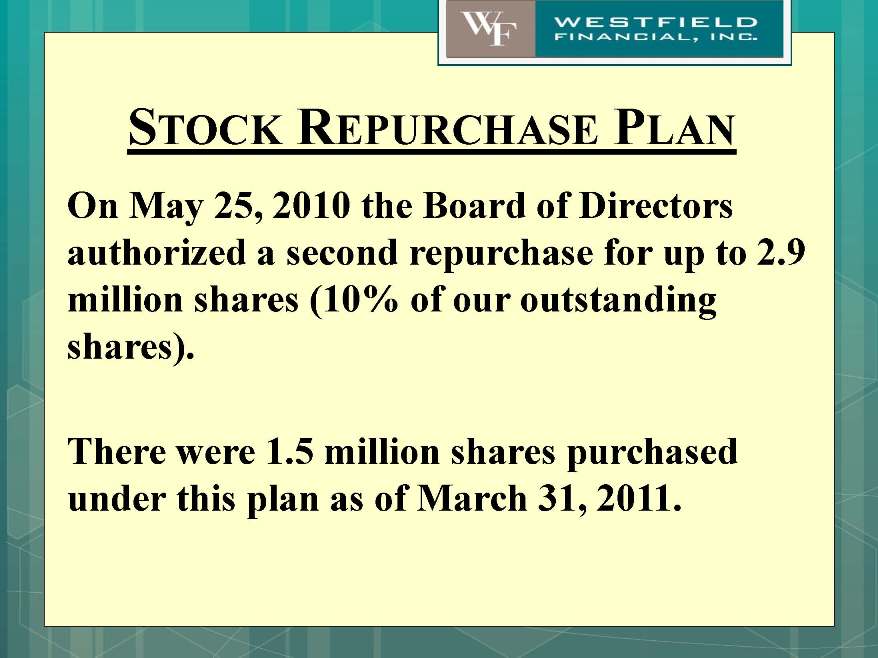
STOCK REPURCHASE PLAN On May 25, 2010 the Board of Directors authorized a second repurchase for up to 2.9 million shares (10% of our outstanding shares). There were 1.5 million shares purchased under this plan as of March 31, 2011.
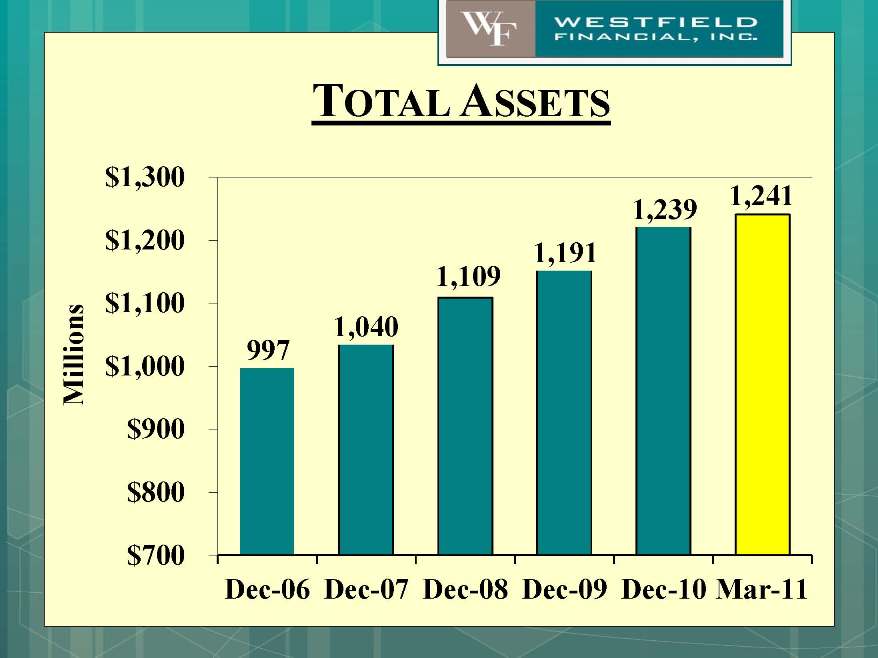
TOTAL ASSETS 997 1,040 1,109 1,191 1,239 1,241 $700 $800 $900 $1,000 $1,100 $1,200 $1,300 Dec-06 Dec-07 Dec-08 Dec-09 Dec-10 Mar-11 Million
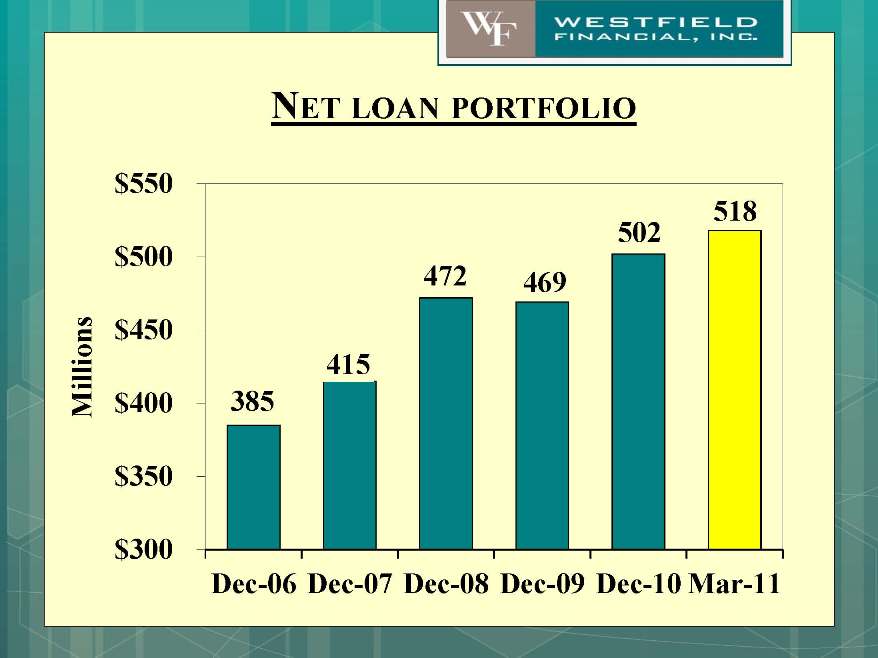
NET LOAN PORTFOLIO 385 415 472 469 502 518 $300 $350 $400 $450 $500 $550 Dec-06 Dec-07 Dec-08 Dec-09 Dec-10 Mar-11 Millions
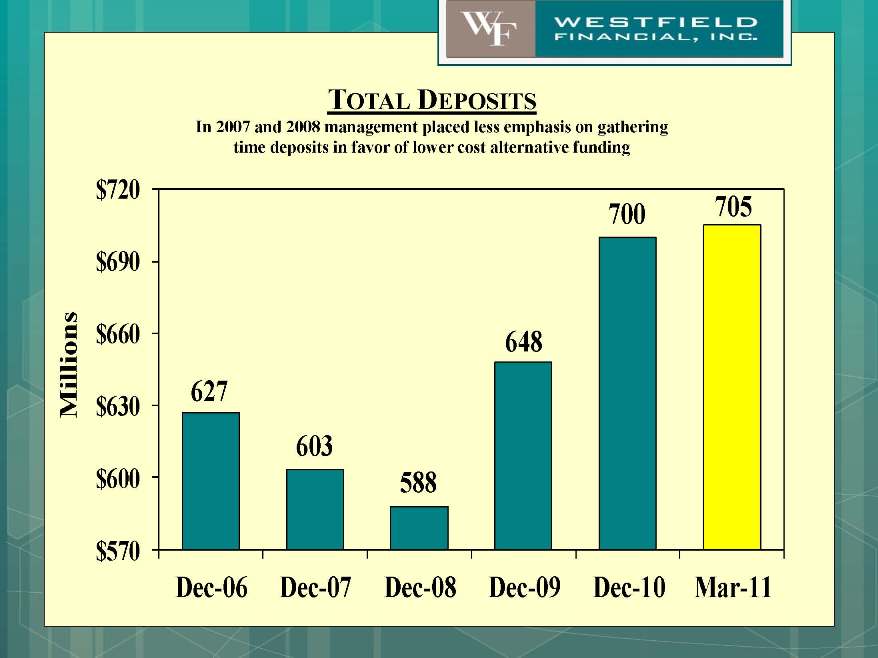
TOTAL DEPOSITS In 2007 and 2008 management placed less emphasis on gathering time deposits in favor of lower cost alternative funding $720 $690 $660 $630 $600 $570 Millions 627 603 588 648 700 705 Dec-06 Dec-07 Dec-08 Dec-09 Dec-10 Mar-1
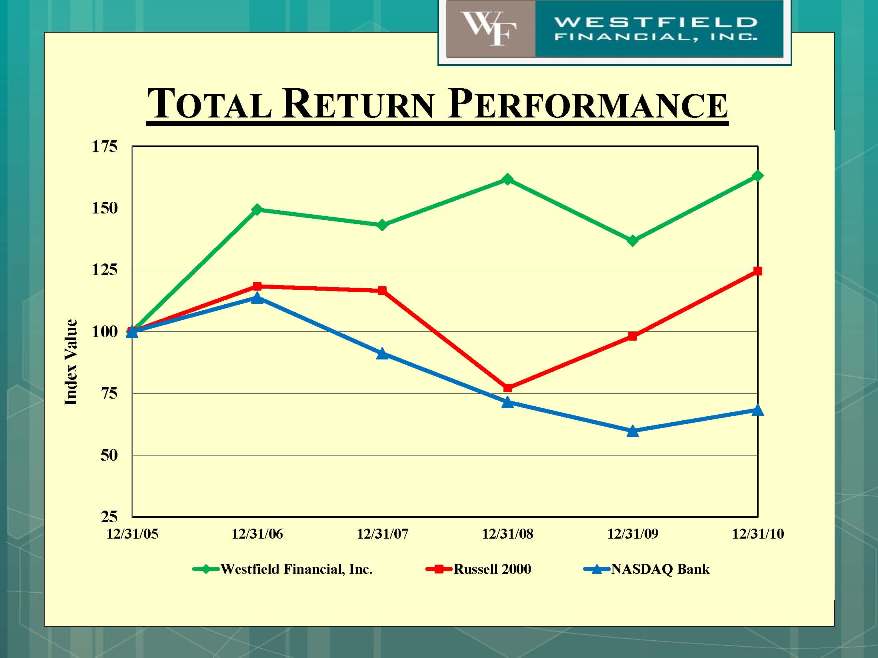
TOTAL RETURN PERFORMANCE 25 50 75 100 125 150 175 12/31/05 12/31/06 12/31/07 12/31/08 12/31/09 12/31/10 Index Value Westfield Financial, Inc. Russell 2000 NASDAQ Bank
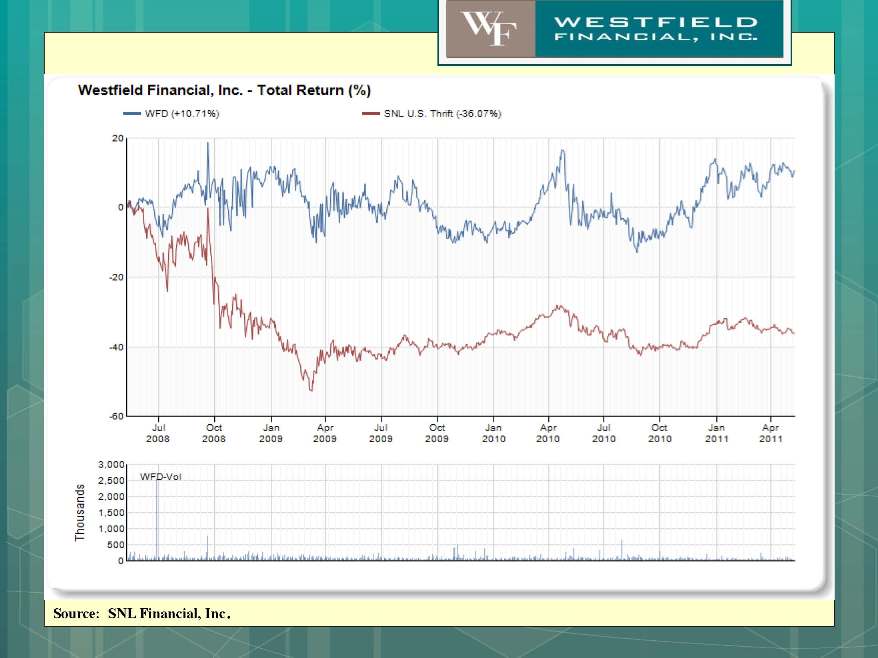
Source: SNL Financial, Inc.

Thank You