Attached files
| file | filename |
|---|---|
| 8-K - CURRENT REPORT - OMNOVA SOLUTIONS INC | d8k.htm |
 May
19, 2011 Exhibit 99 |
 -
2 -
Cautionary
Cautionary
•
This
presentation
and
the
accompanying
oral
remarks
include
“forward-looking
statements,”
as
defined
by
federal
securities
laws.
These
statements,
as
well
as
any
verbal statements by the Company in connection with this presentation, are intended
to qualify for the protections afforded forward-looking statements under the
Private Securities Litigation Reform Act of 1995. Forward-looking
statements reflect management’s current expectation, judgment, belief, assumption, estimate or
forecast about future events, circumstances or results and may address business
conditions and prospects, strategy, capital structure, sales, profits, earnings,
markets, products, technology, operations, customers, raw materials, financial
condition, and accounting policies among other matters. Words such as, but not
limited to, “will,”
“may,”
“should,”
“projects,”
“forecasts,”
“seeks,”
“believes,”
“expects,”
“anticipates,”
“estimates,”
“intends,”
“plans,”
“targets,”
“optimistic,”
“likely,”
“would,”
“could”
and similar expressions or phrases identify forward-looking statements.
•
All forward-looking statements involve risks and uncertainties. Many
risks and uncertainties are inherent in business generally and the markets in which the
Company operates or proposes to operate. Other risks and uncertainties are
more specific to the Company’s businesses, including businesses that the Company
acquires. The occurrence of such risks and uncertainties and the impact of
such occurrence is often not predictable or within the Company’s control. Such impacts
could adversely affect the Company’s results and, in some cases, such effect
could be material. •
All written and verbal forward-looking statements attributable to the Company
or any person acting on the Company’s behalf are expressly qualified in their entirety
by the risks, uncertainties and cautionary statements contained herein. Any
forward looking statement speaks only as of the date on which such statement is made,
and the Company undertakes no obligation, and specifically declines any obligation,
other than that imposed by law, to publicly update or revise any forward-looking
statements whether as a result of new information, future events
or otherwise.
•
Risks and uncertainties that may cause actual results to differ materially from
expected results include, among others: the Company’s ability to successfully integrate
ELIOKEM into its operations; the Company’s ability to achieve fully the
strategic and financial objectives related to the acquisition of ELIOKEM, including the
acquisition becoming accretive to the Company’s earnings; and unexpected costs
or liabilities that may arise from the acquisition, ownership or operation of
ELIOKEM.
•
Additional risk factors include: economic trends affecting the economy in
general and/or the Company’s end-use markets; prices and availability of raw materials
including styrene, butadiene, vinyl acetate monomer, polyvinyl chloride,
acrylonitrile, acrylics and textiles; ability to increase pricing to offset raw material cost
increases;
product
substitution
and/or
demand
destruction
due
to
product
technology,
performance
or
cost
disadvantages;
loss
of
a
significant
customer;
customer
and/or
competitor
consolidation;
customer
bankruptcy;
ability
to
successfully
develop
and
commercialize
new
products;
a
decrease
in
demand
for
domestically
manufactured products due to increased foreign competition and off-shoring of
production; ability to successfully implement productivity enhancement and cost
reduction initiatives; unplanned full or partial suspension of plant operations;
losses from the Company’s strategic alliance, joint venture, acquisition and integration
activities; loss or damage due to acts of war or terrorism, natural disasters or
accidents, including fires, floods, explosions and releases of hazardous substances;
ability to comply, and cost of compliance with, legislative and regulatory changes,
including changes impacting environmental, health and safety compliance and
changes which may restrict or prohibit certain products and raw materials; rapid
inflation in health care costs and assumptions used in determining health care cost
estimates; risks associated with foreign operations including political unrest and
fluctuations in exchange rates of foreign currencies; prolonged work stoppage
resulting from labor disputes with unionized workforce; changes in and compliance
with pension plan funding obligations; stock price volatility; infringement or loss of
the Company’s intellectual property; litigation and claims against the Company
related to products, services, contracts, employment, environmental, safety,
intellectual property and other matters; adverse litigation judgments or
settlements; absence of or inadequacy of insurance coverage for litigation judgments,
settlements or other losses; availability of financing at anticipated rates and
terms; and loan covenant default arising from substantial debt and leverage and the
inability to service that debt, including increases in applicable short-term or
long-term borrowing rates. •
For further information on risks and uncertainties, see the Company’s Form
10-K and Form 10-Q filings with the Securities and Exchange Commission.
Forward-Looking Statements
Non-GAAP Financial Measures
This presentation includes EBITDA, Adjusted EBITDA and Net Debt which are
non-GAAP financial measures as defined by the Securities and Exchange
Commission. For a reconciliation to the most directly comparable
GAAP financial measures, refer to the presentation Appendix.
|
 -
3 -
Creating Value Through A Global Enterprise
Creating Value Through A Global Enterprise
OMNOVA Solutions Today Is A Larger, More Diverse Global
Specialty Chemicals And Functional Surfaces Company With
Significant Potential To Create Shareholder Value
OMNOVA Solutions Today Is A Larger, More Diverse Global
Specialty Chemicals And Functional Surfaces Company With
Significant Potential To Create Shareholder Value
Technology
Innovation
Global
Capability
Frequently
Frequently
#1 or #2 in
#1 or #2 in
Consolidating
Consolidating
Niche Markets
Niche Markets
Leading Market
Positions |
 -
4 -
OMNOVA Overview |
 -
5 -
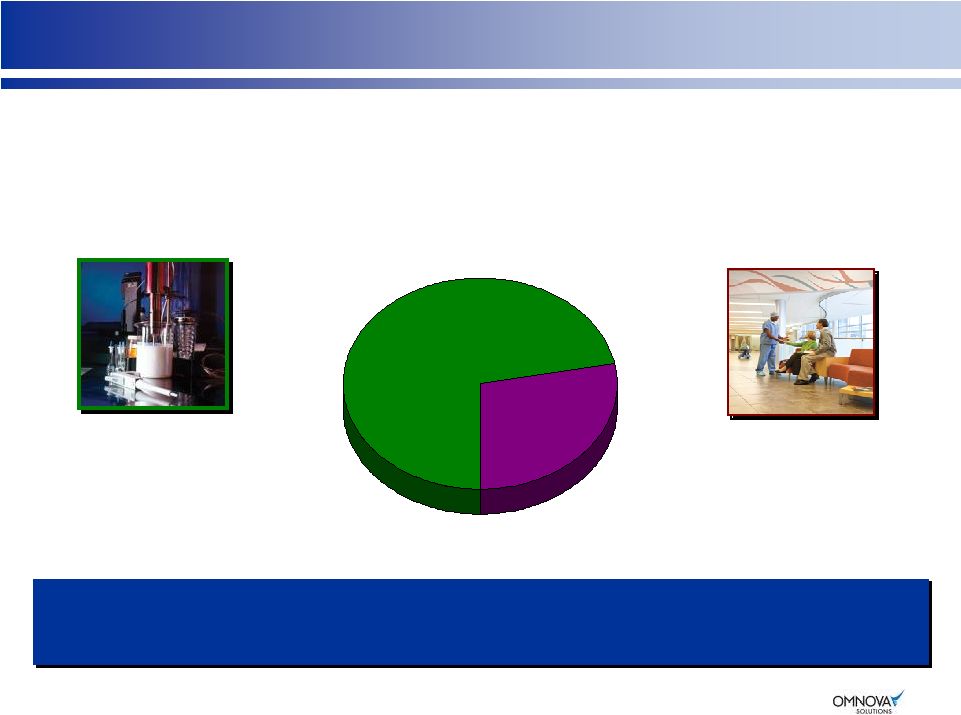
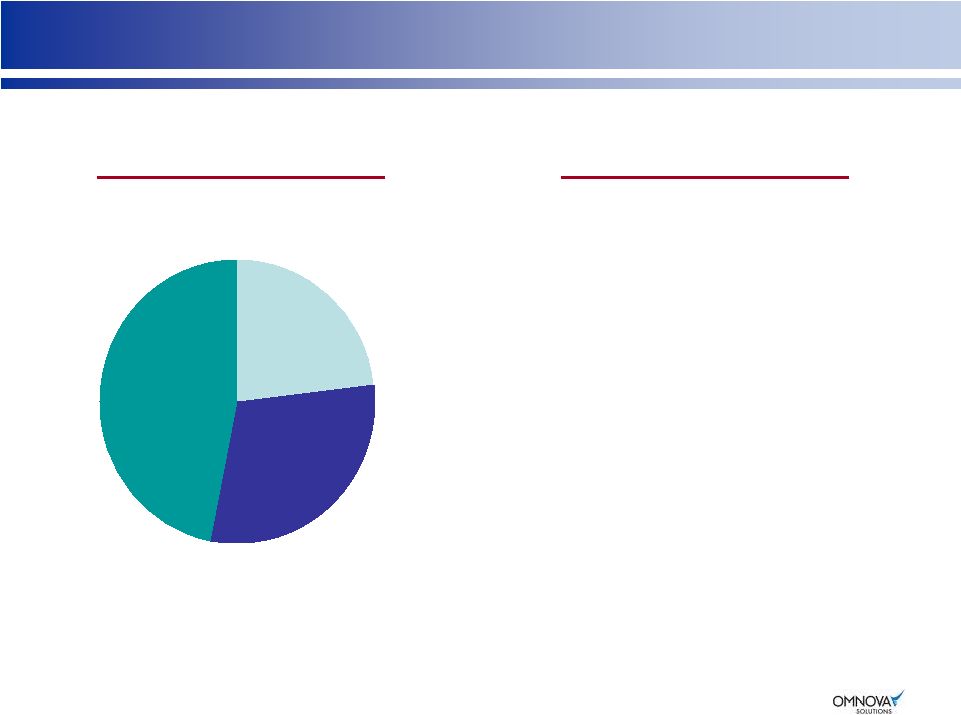
Business Segments At A Glance
Business Segments At A Glance
A Specialty Chemicals And Functional Surfaces
Company With Leadership Positions In Key Categories
A Specialty Chemicals And Functional Surfaces
Company With Leadership Positions In Key Categories
*
LTM:
Last
Twelve
Months
Through
February
28,
2011
including
ELIOKEM
on
a
Pro
Forma
Basis
for
2010;
Adjusted
EBITDA
–
see
Appendix 1
LTM Sales* = $1.2B
LTM Adj. EBITDA* = $121M
Adj. EBITDA Margin = 10.3%
Performance Chemicals
Decorative Products
Value-added emulsion
polymers used for
coatings, adhesives
and binders
Functional &
decorative surfaces
72%
28% |
 -
6 -
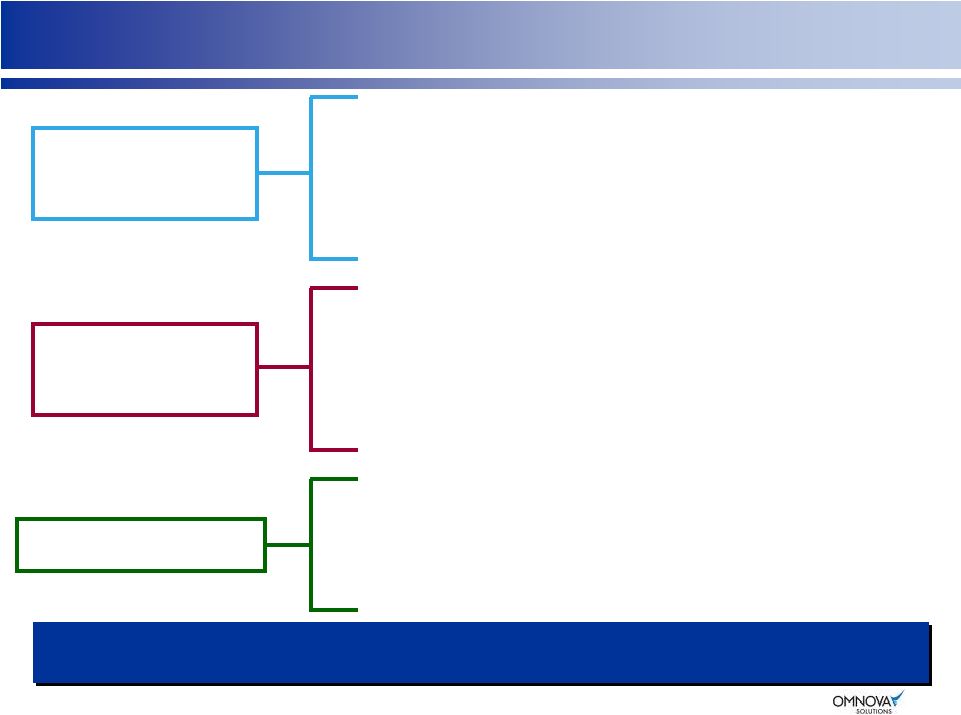
3-Part Strategy To Grow
3-Part Strategy To Grow
•
Technology-Driven Market Share Gains In Core Markets
•
Enter New, Related Markets / Applications
•
Globalization
•
A Culture of Safety
•
LEAN SixSigma
•
SAP Business System
•
Enhanced Global Purchasing/Logistics
•
Reducing OMNOVA’s Environmental Footprint
•
Providing Value-Added Environmentally Preferred
Products
Profitable
Growth
Operational
Excellence
Sustainability
Offer Customers A Distinctive Technology And Service Driven Value Proposition
To Drive Margin Expansion & Profitable Growth
Offer Customers A Distinctive Technology And Service Driven Value Proposition
To Drive Margin Expansion & Profitable Growth |
 -
7 -
Fundamental, Structural Change In The OMNOVA Business Model
Fundamental, Structural Change In The OMNOVA Business Model
•
Introduced numerous industry-leading new products, driving share gain and
adjacent market penetration
–
Industry leading market position (#1 or #2) in many served markets
•
Rapid industry consolidation
–
6 Competitor chemical plants closed in 2008…major competitor sold
–
Exit of 7 decorative product competitors over last 5 years…more likely
–
2 Major competitors consolidated in Europe SB market with several plants closed in
last 3 years •
Implemented index pricing in Performance Chemicals
–
Significant margin improvement
–
Reduced earnings volatility
–
Successful in recent recessionary environment
•
Consolidated Strategic Decorative Products businesses in Asia
–
Purchased JV interest in 2008
–
Upgraded management
–
Unique capability to serve growing local markets and North American customers as
they migrate to Asia •
Productivity
/
cost
reductions
–
lowest
cost
structure
since
1999
spin-off
and
NOL’s
provide significant leverage for cash generation
•
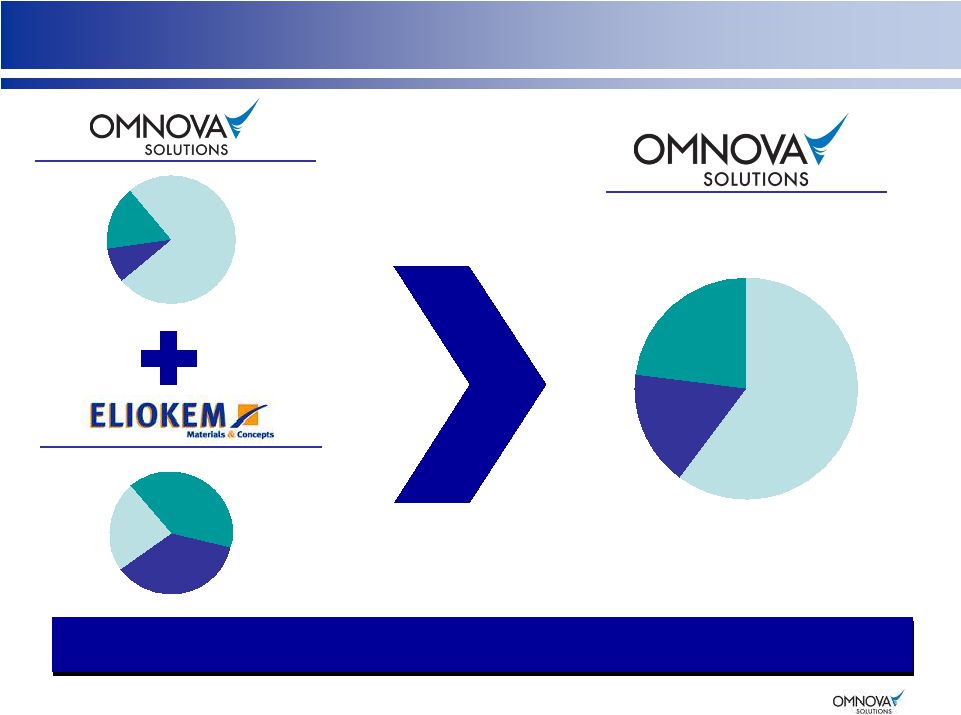
Acquired ELIOKEM specialty chemicals company in December 2010
–
A game changer to accelerate globalization of our chemicals business, diversify
served markets and broaden technology offering
Business Model Changes, Productivity And New Products Driving
Sustainable Performance Improvement
Business Model Changes, Productivity And New Products Driving
Sustainable Performance Improvement |
 -
8 -
ELIOKEM Acquisition Strategic Rationale
ELIOKEM Acquisition Strategic Rationale
1.
Globalization: Manufacturing and sales in China, India and France
•
Enhanced growth opportunities for OMNOVA specialty chemical products in
Europe and in higher growth markets in Asia
•
Grow existing legacy OMNOVA $45M chemical export/toll business in Asia/Europe
•
40% of new Performance Chemicals business outside of North America
2.
Growth: Entry into higher growth products / markets; core market expansion
•
Specialty Coatings (intumescent paint, masonry coatings, stain blocking coatings);
Oil Field Chemicals; Elastomeric Modification
•
Key processes and factors for success similar to OMNOVA’s base business
3.
Diversification: Diversification of OMNOVA product offering
•
75% of ELIOKEM sales in new, complementary markets for OMNOVA
4.
Cost Synergy: Significant sourcing and supply chain, manufacturing and
SG&A cost savings opportunities by leveraging an integrated global team
Compelling Strategic Rationale; Exciting Opportunities
Compelling Strategic Rationale; Exciting Opportunities
|
 -
9 -
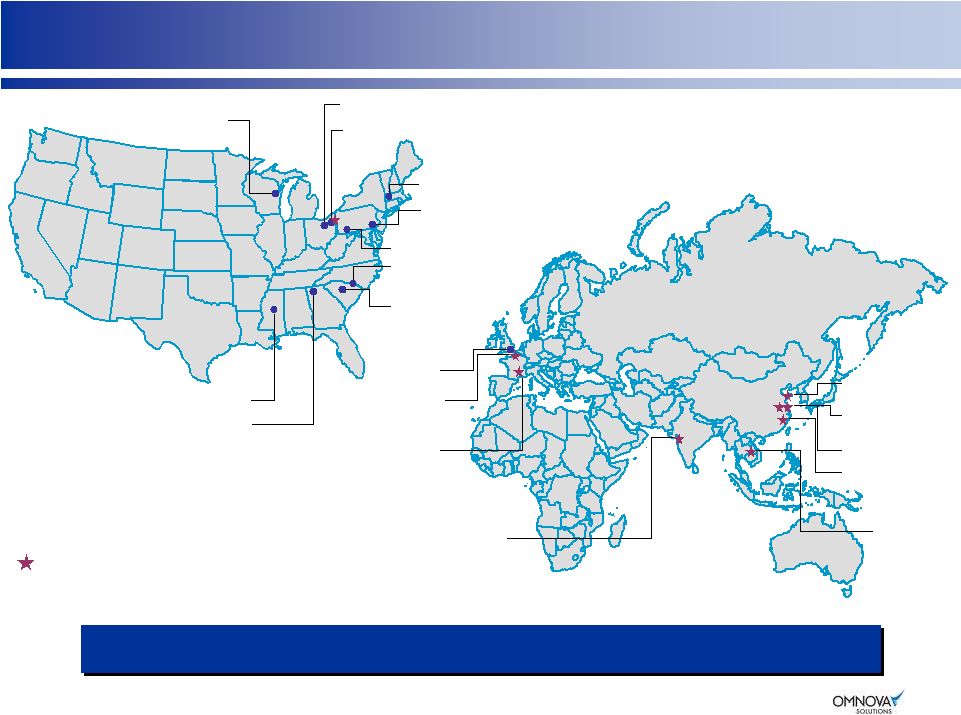
= Added in Last 5 Years
OMNOVA Locations
OMNOVA Locations
9 Global Locations Added In Last Five Years
9 Global Locations Added In Last Five Years
Monroe, NC
Chester, SC
Calhoun, GA
Columbus, MS
Shanghai/
Taicang, China
Rayong,
Thailand
Kent, U.K.
Fitchburg, MA
Auburn, PA
Jeannette, PA
Green Bay, WI
Fairlawn/Akron, OH (World Headquarters)
Mogadore/Akron, OH
Le Havre, France
Villejust, France
Valia, India
Caojing, China
Ningbo, China
Black Text = OMNOVA Manufacturing Sites
Green Text = Headquarters Facilities
Shanghai, China |
 -
10 -
Accelerates OMNOVA’s Global Reach On A Pro Forma Basis
Accelerates OMNOVA’s Global Reach On A Pro Forma Basis
Europe &
Africa
17%
Asia &
Middle East
23%
USA
60%
Europe
9%
USA
75%
Asia
16%
LTM Sales $1.2 Billion*
Positioned For Strong Growth Potential In Asia And Europe
Positioned For Strong Growth Potential In Asia And Europe
Pro Forma Consolidated
* LTM: Last Twelve Months Through February 28, 2011 including ELIOKEM on a Pro
Forma Basis for 2010 Americas
24%
Asia & Middle
East
40%
Europe &
Africa
36% |
 -
11 -
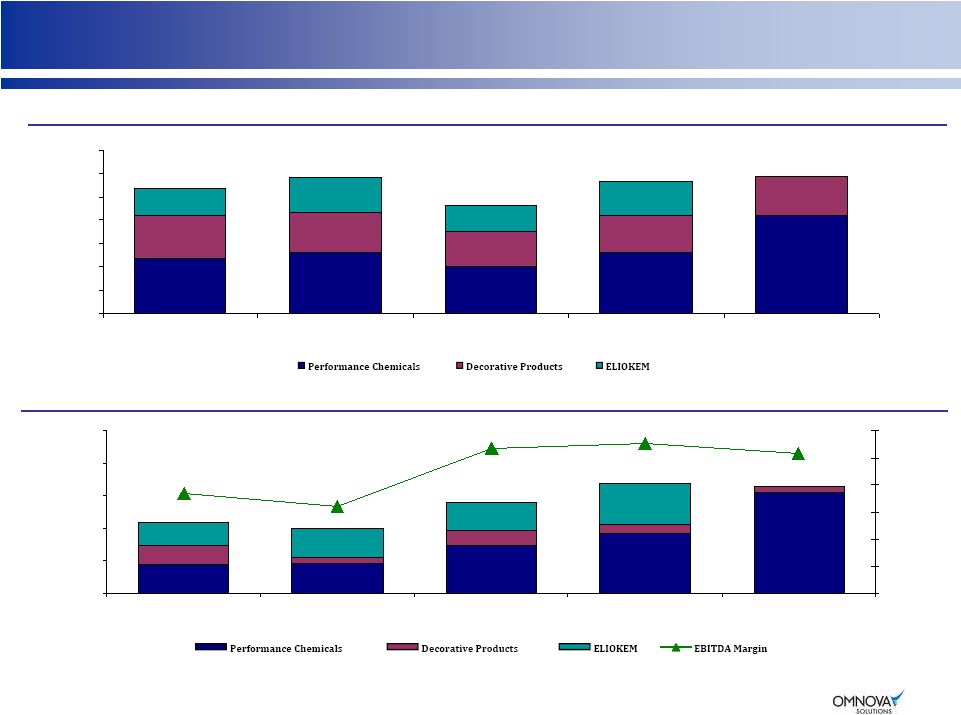
Pro Forma Historical Annual Financials
Pro Forma Historical Annual Financials
Annual Historical Revenue*
Annual Historical Adjusted EBITDA*
*
LTM:
Last
Twelve
Months
Through
February
28,
2011
including
ELIOKEM
on
a
Pro
Forma
Basis
for
2010;
Adjusted
EBITDA
-
see
Appendices
1,
3,
4,
and
5;
Total
Adjusted
EBITDA
includes
OMNOVA
Corporate
Expense
of
$8.9M,
$5.6M,
$12.2M,
$10.3M
and
$10.9M
for
2007,
2008,
2009,
2010
and
2011
LTM,
respectively.
$1,068
$1,159
$926
$1,135
$78.5
$73.7
$99.5
$125.2
$1,170
$120.6
$475.3
$521.6
$396.8
$527.9
$846.8
$364.6
$347.8
$299.6
$318.3
$323.1
$228.1
$289.5
$229.5
$288.4
$0
$200
$400
$600
$800
$1,000
$1,200
$1,400
2007
2008
2009
2010
LTM 02/28/11*
$35.1
$37.5
$59.7
$74.8
123.9
$23.8
$7.2
$28.5
$34.6
$35.1
$16.9
$7.6
$9.8
$50.9
7.4%
6.4%
10.7%
11.0%
10.3%
$0.0
$40.0
$80.0
$120.0
$160.0
$200.0
2007
2008
2009
2010
LTM 02/28/11*
0.0%
2.0%
4.0%
6.0%
8.0%
10.0%
12.0% |
 -
12 -
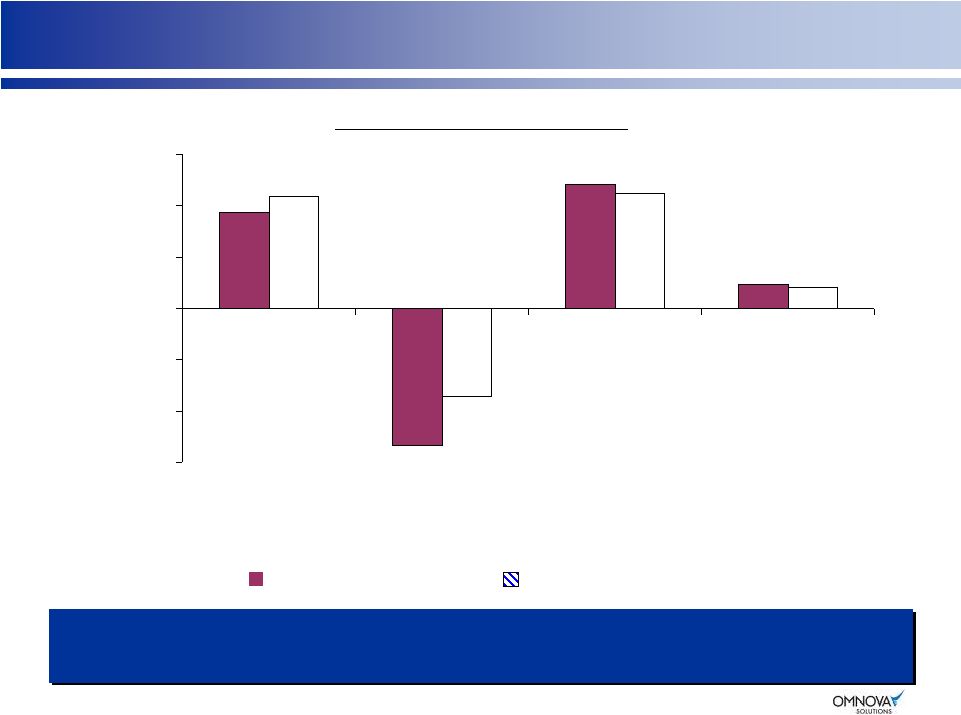
Raw Material Inflation / OMNOVA Pricing Dynamics
Raw Material Inflation / OMNOVA Pricing Dynamics
Success Historically In Recovering Raw Material Costs –
Even With Record RM Inflation In 2008 And 2010
Success Historically In Recovering Raw Material Costs –
Even With Record RM Inflation In 2008 And 2010
($ Millions)
Raw Material Inflation
OMNOVA Pricing Realization
OMNOVA Legacy Operations
87
90
17
19
97
(107)
75
(69)
-$120
-$80
-$40
$0
$40
$80
$120
2008
2009
2010
2011 Q1 |
 -
13 -
Decorative Products |
 -
14 -
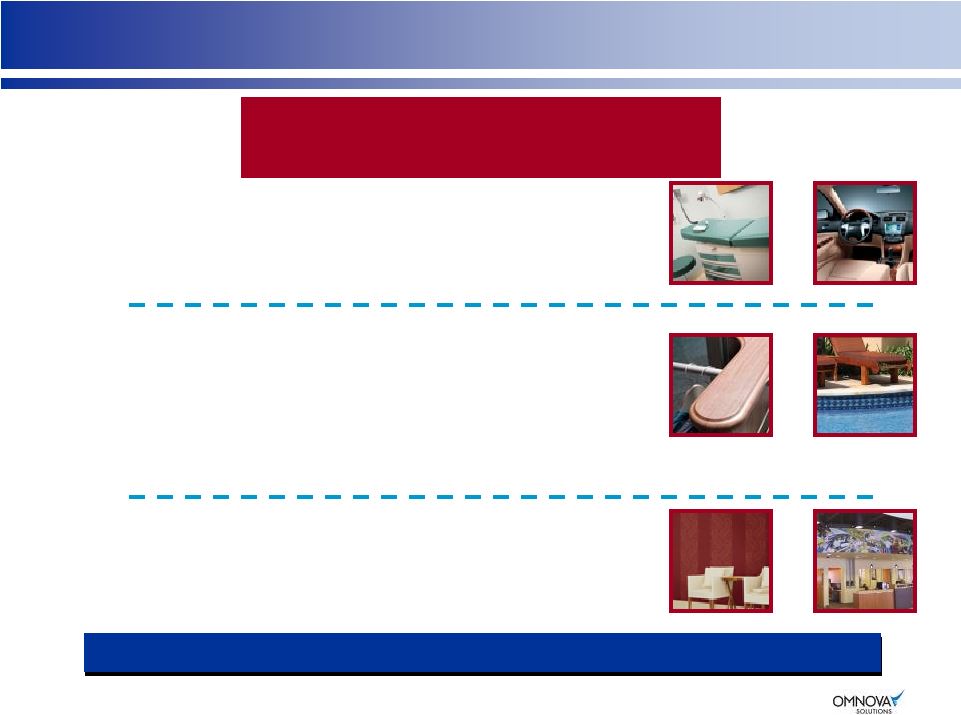
Decorative Products –
Segment Overview
Decorative Products –
Segment Overview
* LTM:
Last
Twelve
Months
Through
February
28,
2011;
Adjusted
EBITDA
see
Appendix
4
Coated Fabrics Products
Laminates & Films Products
Commercial Wallcovering Products
End Markets
End Markets
End Markets
•
Vinyl and urethane fabrics
•
Performance fabrics
•
Vinyl, paper and acrylic laminates
•
Performance films
•
Vinyl wallcoverings
•
Customized wall murals
•
Transportation, marine
•
Health care
•
Furniture and furnishings
•
Kitchen and bath cabinets
•
RV / manufactured housing
•
Furniture
•
Retail store fixtures
•
Healthcare
•
Pool Liner
•
Corporate
•
Hospitality
•
Healthcare
•
Retail
LTM Sales* = $323M
LTM Adj. EBITDA* = $8M
Adj. EBITDA Margin* = 2.4%
A Broad-Based Functional And Decorative Surfaces Business
A Broad-Based Functional And Decorative Surfaces Business
|
 -
15 -
•
Pricing discipline to offset raw material
inflation and expand margins
•
Reduce operating costs
•
Leverage scale in a highly fragmented
but consolidating industry
–
Several recent competitor exits
•
Grow at above-market rates as industry
recovers from cyclical decline
–
Leverage innovation in existing and
adjacent markets
•
Profitably serve global customers with
strategically located global assets
Decorative Products –
Segment Overview
(cont.)
Decorative Products –
Segment Overview
(cont.)
* LTM: Last Twelve Months Through February 28, 2011
Decorative Products
Sales Breakdown*
Commercial
Wallcovering
23%
Laminates
and Films
30%
Coated Fabrics
47%
Strategy |
 -
16 -
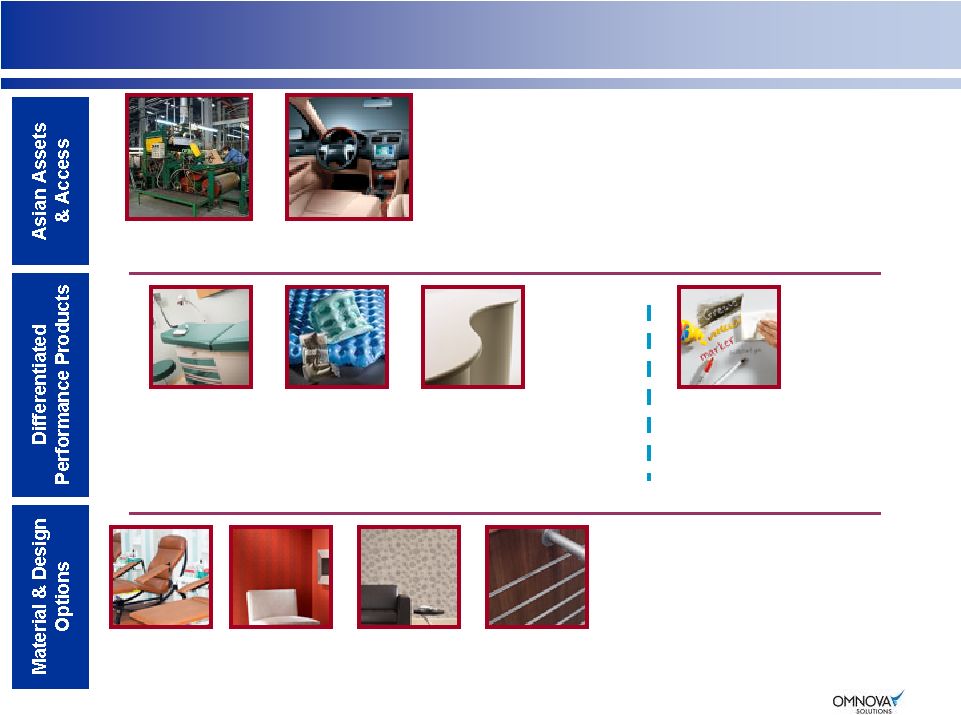
Decorative Products –
Globalization & Innovation
Decorative Products –
Globalization & Innovation
•
Solely-owned plants in China and
Thailand provide strategic advantage
most competitors can’t match
•
A leading position in rapidly growing
Chinese automotive OEM market
•
Environmentally preferred
constructions
•
High performance, cost effective
alternatives to traditional materials
and processes
PreFixx®
Protective
Finish
High performance
barrier coatings resist
stains, abrasions and
scuffing
3 Asian Plants
Automotive
Upholstery
Healthcare / Medical Devices Market
•
Can cover broad array of surfaces
•
Durability, cleanability and design major differentiators
•
3-D Laminates reduce cracks where germs may develop
Increased Designer Choice:
Pinnacle™
Performance
Fabrics
duraMAX™
Flat Laminates
RECORE
®
Recycled Wall
Technology
ECORE
®
Advanced Wall
Technology |
 -
17 -
Performance Chemicals |
 -
18 -
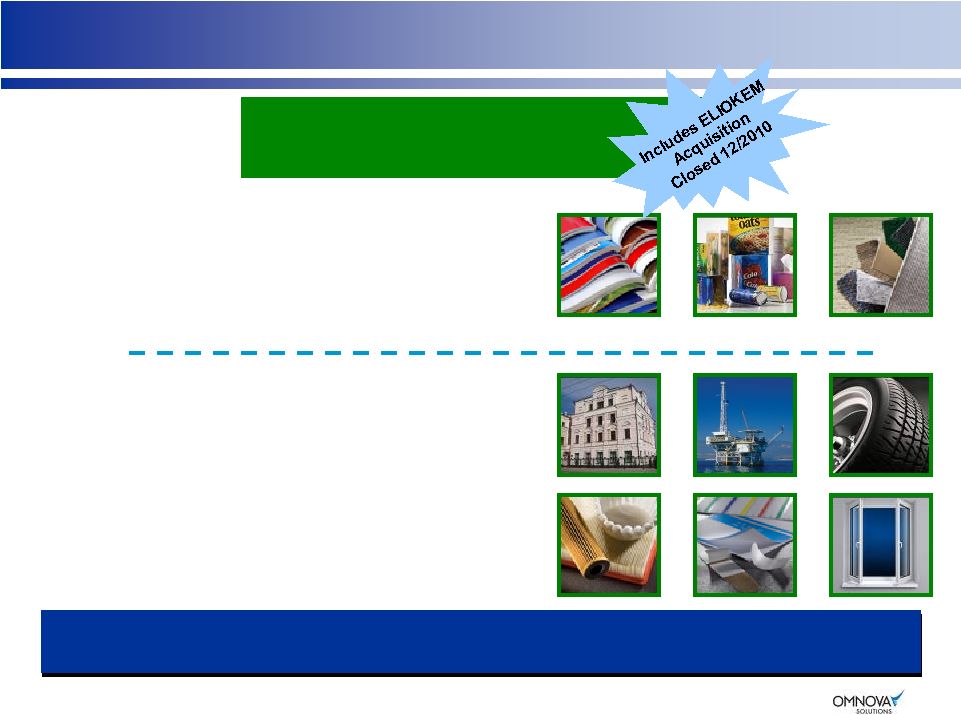
New Performance Chemicals –
Segment Overview
New Performance Chemicals –
Segment Overview
*
LTM:
Last
Twelve
Months
Through
February
28,
2011
including
ELIOKEM
on
a
Pro
Forma
Basis
for
2010;
Adjusted
EBITDA
-
see
Appendix 3
Paper and Carpet Chemicals (LTM Sales = $346M)
Specialty Chemicals (LTM Sales = $501M)
End Markets
End Markets
•
Specialty / architectural
coatings
•
Nonwovens –
consumable
and durable
•
Construction
•
Tires and rubber goods
LTM Sales* = $847M
LTM Adj. EBITDA* = $124M
Adj. EBITDA Margin* = 14.6%
•
Magazines, brochures
•
Catalogs
•
Packaging, paperboard
ELIOKEM Accelerates Globalization Of Our Specialty Chemical Products
ELIOKEM Accelerates Globalization Of Our Specialty Chemical Products
•
Labels, specialty papers
•
Residential and commercial
carpet backing
•
Tapes and release coatings
•
Oil / gas drilling
•
Elastomeric modification
•
Floor care |
 -
19 -
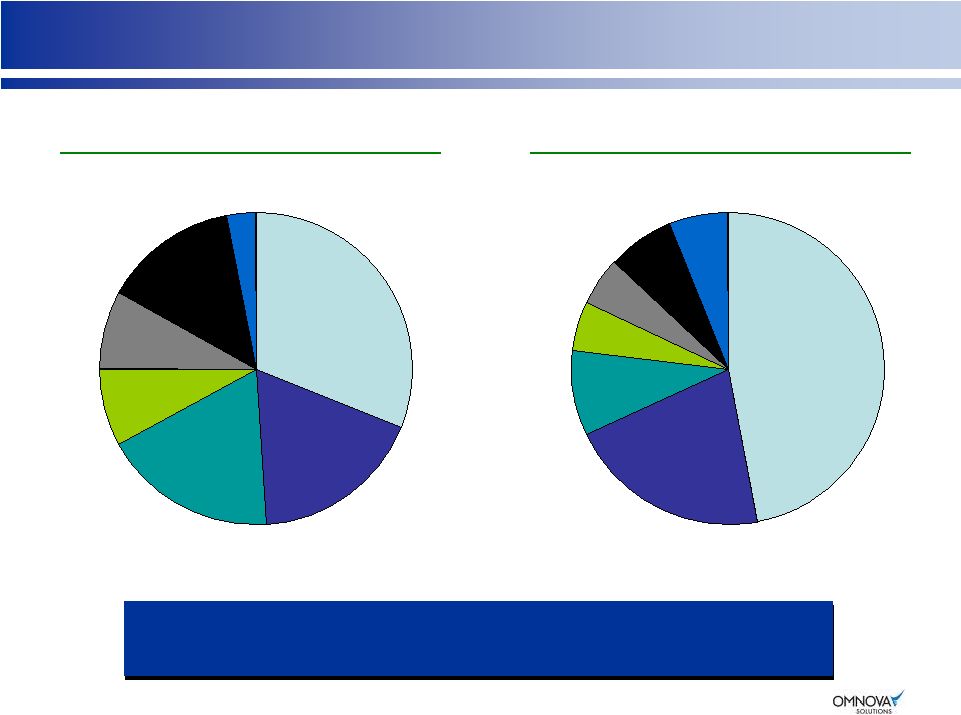
Performance Chemicals
Performance Chemicals
Served Markets*
Chemistries*
Paper and
Packaging
31%
Refurbishment /
Construction
18%
Tire & Rubber
18%
Nonwovens
8%
Specialty /
Architectural
Coatings
8%
Other
Specialty
14%
Oil Field
3%
SB Latex
47%
Acrylics
21%
Vinyl Pyridine
Latex
9%
Nitrile Rubber
Latex
5%
Elastomeric
Modifiers
7%
Antioxidants
6%
ELIOKEM Provides Diversification
Of Markets And Chemistries
ELIOKEM Provides Diversification
Of Markets And Chemistries
High Styrene
Latex
5%
* Sales % for quarter ended February 28, 2011 |
 -
20 -
Leading SB Latex Producer In Disciplined N. American Industry
Leading SB Latex Producer In Disciplined N. American Industry
OMNOVA
BASF
Reichhold
SB Latex N. American Volumes
’02-’10
OMNOVA
+13 pts.
Others
Dow/
Styron
Source: OMNOVA
~
30%
of
North
American
Capacity
Shut
Down
in
2008
Dow-Reichhold Exit
Dow / Styron Closures
Lubrizol Exit
Closed 2 Plants
Closed 1 Plant
4 Plants (3 in N.A.)
Dow / Styron
recently
sold to
Bain Capital
4%
12%
16%
24%
44%
•
Differentiated products
•
Highly customized with high
switching cost
•
Low risk of Asian imports due to high
shipping cost
•
60-70% contracted with index raw
material price escalations
•
OMNOVA manufacturing strategically
located to serve core markets
OMN Share Gain Drivers
OMNOVA Growing Leadership Position
In Consolidating SB Latex Industry
OMNOVA Growing Leadership Position
In Consolidating SB Latex Industry
2002
2005
2010 |
 -
21 -
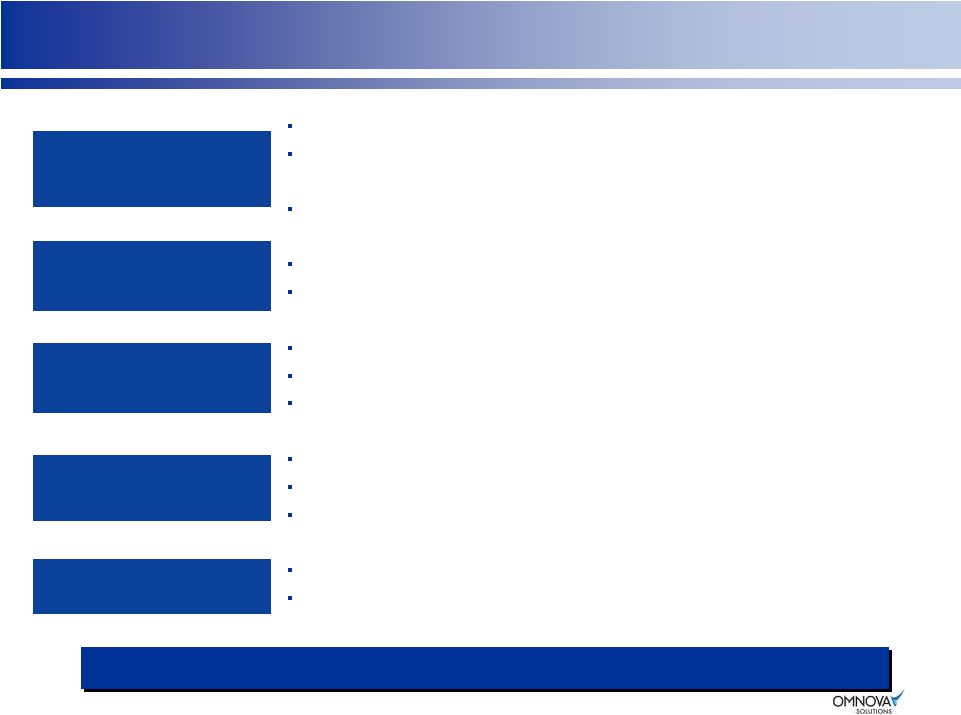
Fit With
OMNOVA
ELIOKEM
OMNOVA
•
Global niche specialty chemicals company owned by AXA Private
Equity (formerly Goodyear Specialty Chemicals)
•
Focused on emulsion polymerization chemistry
•
#1 and #2 market leading positions in targeted specialty segments
•
Strong customer relationships with deep application expertise
•
Manufacturing footprint in China, India, France and USA
•
Headquarters in Villejust, France
–
630 employees worldwide
–
Regional sales teams supported by 85 distributors and agents
in 90 countries
•
$294M in LTM sales* and $50M in LTM EBITDA
ELIOKEM Acquisition –
A Strong Fit
ELIOKEM Acquisition –
A Strong Fit
* LTM: Last Twelve Months Through February 28, 2011
Paper
Carpet
Construction
Tape
Personal Hygiene
Floor Care
Exterior Masonry
Paint
Intumescent
(Fire
Resistant)
Paint
Stain Blocking
Primers
ABS Stabilization
Elastomeric
Modification
Antioxidants
Tires and Rubber
Goods
Oil and Gas
Drilling |
 -
22 -
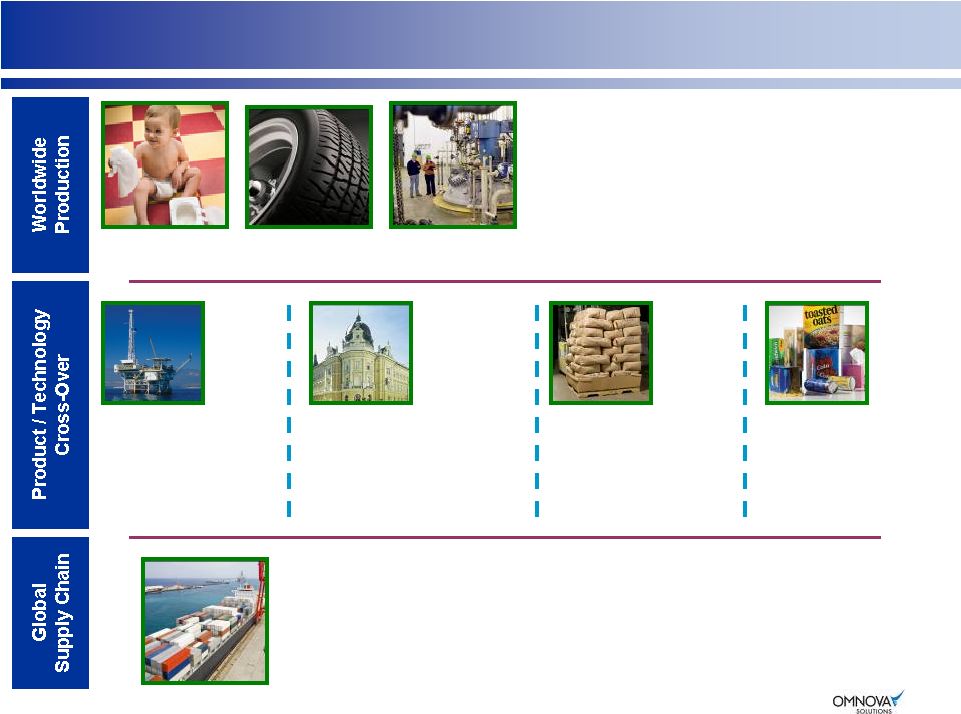
Examples Of Exciting Synergy Potential
Examples Of Exciting Synergy Potential
•
Manufacturing on 3 continents
to serve customers anywhere
in the world
•
Flexibility to manufacture
where profitability can be
maximized
•
Major raw materials are same for both ELIOKEM
and OMNOVA
•
Leverage purchasing and logistics with increased
options and scale
Oil Field
Architectural
Coatings
Powder
Polymers
Hollow
Plastic
Pigment
ELIOKEM products
for oil/synthetic
based drilling fluids
complement
OMNOVA’s for water-
based applications
OMNOVA has new
solutions for advanced
applications in this
ELIOKEM served
market
New capability to
deliver dry polymer
resins for easier
handling / new
applications
(e.g. oil field)
Paper coating
technology acquired
from Dow in 2010 has
broad potential
across several other
served markets
Nonwovens
Tire Cord
SB and
Acrylic Latex |
 -
23 -
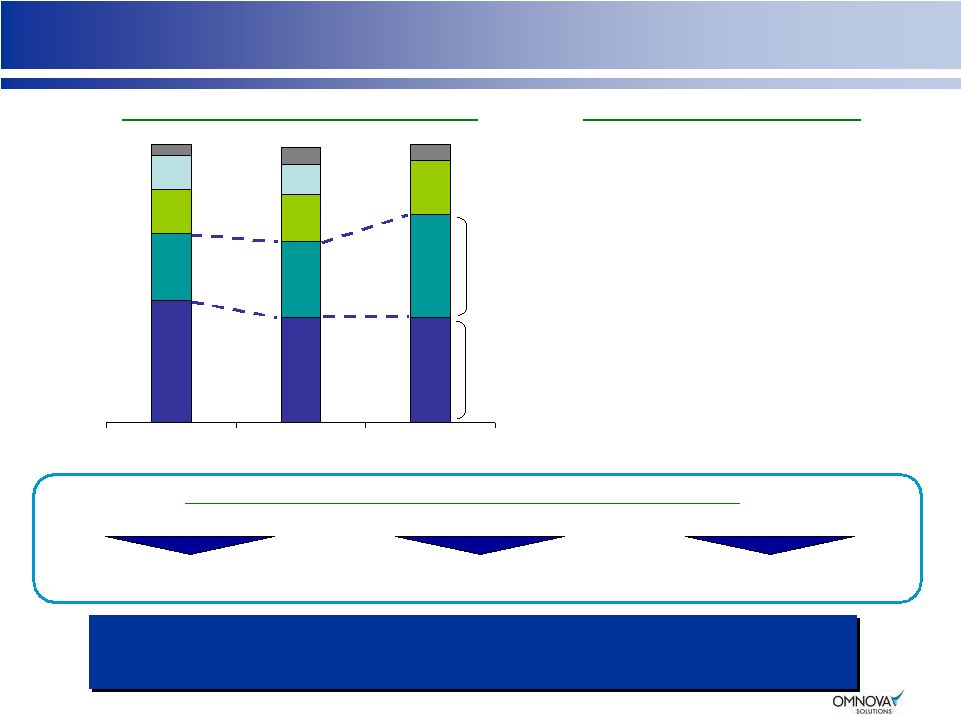
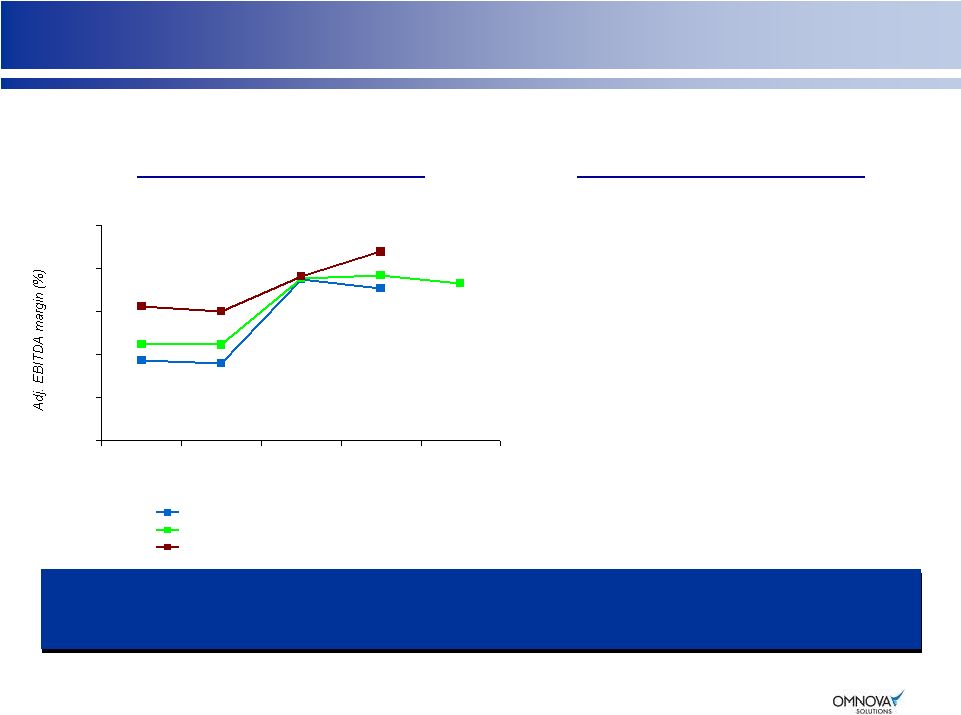
Enhances Performance Chemicals Profitability Profile
Enhances Performance Chemicals Profitability Profile
•
Innovative new products
•
Cost restructuring
•
Volume improvement
•
Increased average unit selling price
Improves Operating Profile Through
Niche / Specialty, High Margin Products
Improves Operating Profile Through
Niche / Specialty, High Margin Products
ELIOKEM’s Drivers of
Profit Improvement
Adj. EBITDA Margins**
Over Time
* LTM: Last Twelve Months Through February 28, 2011 including ELIOKEM on a Pro
Forma Basis for 2010. 2011 LTM margin decline related primarily to index
pricing mechanics (no margin on raw material pass-through). **
Adjusted
EBITDA
Margins
–
see
Appendices
3
and
5
14.6%
7.4%
7.2%
15.0%
14.2%
15.4%
9.0%
8.9%
15.1%
17.6%
15.3%
12.0%
12.5%
0%
4%
8%
12%
16%
20%
2007
2008
2009
2010
2011
LTM*
OMNOVA Performance Chemicals
Pro Forma OMNOVA Performance Chemicals
Eliokem |
 -
24 -
OMNOVA Solutions –
Key Investment Highlights
OMNOVA Solutions –
Key Investment Highlights
30% of SB latex capacity in North America shutdown in 2008
In Europe, BASF acquired Ciba and restructured assets in 2010; Yule Cato acquiring
PolymerLatex
Low risk of imports due to high shipping costs
Leading market positions across many business lines (#1 or #2)
Industry recognized brands, with customer co-branding
OMNOVA has over 1,000 products sold to over 1,500 customers in more than 90
countries 75% of ELIOKEM’s sales to adjacent markets not currently served
by OMNOVA Geographically
diversified
asset
base,
with
significant
emerging
market
presence
Significantly improved Adjusted EBITDA since 2008
~10% Adjusted EBITDA margins (up from ~6% in 2008)
Ability
to
pass
through
raw
material
changes
(indexed
contracts,
disciplined
industry)
Generated $37 million of free cash flow in 2010
Modest capex requirements (maintenance capex <1.5% of revenues)
Stable, Disciplined,
Consolidated Industry
Leading Market
Positions
Diverse Business Model
Strong And Stable
Margins
Strong Free Cash Flow
OMNOVA Is Creating Value Through A Global Enterprise
OMNOVA Is Creating Value Through A Global Enterprise |
 -
25 -
Appendix |
 -
26 -
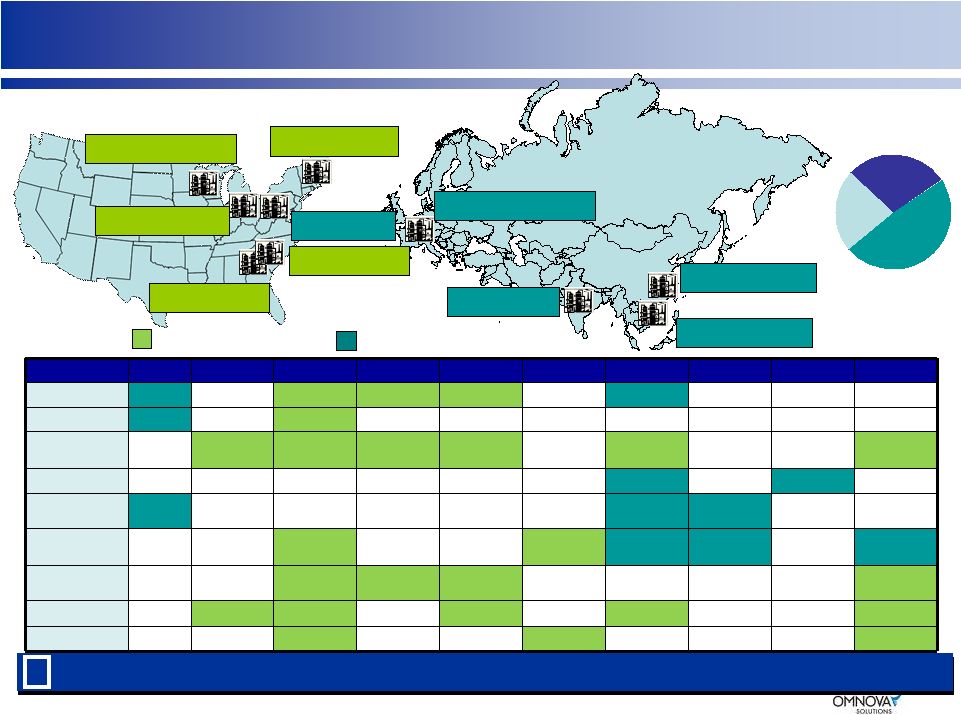
Global Footprint In Performance Chemicals
Global Footprint In Performance Chemicals
Product Focus
Akron
Green Bay
Mogadore
Fitchburg
Chester
Calhoun
Le Havre
Valia
Ningbo
Caojing
Coatings
Oil Field
Nonwovens/
Textiles
X
X
Antioxidants
Elastomers/
Reinforcing
Specialty
Rubbers/Latex
Tape &
Releases
X
Paper
X
X
Carpet
X
Valia, India
Ningbo, China
Caojing, China
Le Havre, France
Fitchburg, MA
Green Bay, WI
Akron, OH
Mogadore, OH
Chester, SC
Calhoun, GA
OMNOVA
ELIOKEM
Leveraging ELIOKEM Manufacturing Infrastructure With OMNOVA
Technology
Leveraging ELIOKEM Manufacturing Infrastructure With OMNOVA
Technology
ELIOKEM Production Capacity
X = Additional
Growth
Opportunities
X
Europe &
Africa
29%
Americas
23%
Asia
48% |
 -
27 -
Appendix –
Non-GAAP Financial Measures
Appendix –
Non-GAAP Financial Measures
This presentation includes EBITDA, Adjusted EBITDA and Net Debt which are
Non-GAAP financial measures as defined by the Securities and Exchange
Commission. OMNOVA’s EBITDA is calculated as income (loss) from continuing
operations less interest expense, amortization of deferred financing costs,
income taxes and depreciation and amortization expense. OMNOVA’s Adjusted EBITDA is
calculated as OMNOVA’s EBITDA less restructuring and severance expenses, asset
impairments, non-cash stock compensation and other items. Segment
EBITDA is calculated as segment operating income (loss) less interest expense,
amortization of deferred financing costs, income taxes and depreciation and amortization expense.
Segment Adjusted EBITDA is calculated as Segment EBITDA less restructuring and
severance expenses, asset impairments, non-cash stock compensation and
other items. For purposes of this presentation, Net Debt is calculated
as total debt less cash. ELIOKEM’s EBITDA is calculated as net
income less interest expense, amortization of deferred financing costs, income
taxes and depreciation and amortization expense. ELIOKEM’s Adjusted EBITDA is calculated as ELIOKEM’s
EBITDA less restructuring and severance expenses, asset impairments and other
items. EBITDA, Adjusted EBITDA and Net Debt are not measures of
financial performance under GAAP. EBITDA, Adjusted EBITDA and Net Debt
are not calculated in the same manner by all companies and, accordingly, are
not necessarily comparable to similarly titled measures of other companies and
may not be appropriate measures for comparing performance relative to other
companies. EBITDA, Adjusted EBITDA and Net Debt should not be construed as
indicators of the Company’s operating performance or liquidity and should not be
considered in isolation from or as a substitute for net income (loss), cash
flows from operations or cash flow data, which are all prepared in accordance
with GAAP. EBITDA, Adjusted EBITDA and Net Debt are not intended to represent, and should not be
considered more meaningful than or as an alternative to, measures of operating
performance as determined in accordance with GAAP. Management believes
that presenting this information is useful to investors because these measures
are commonly used as analytical indicators to evaluate performance and by management to allocate
resources. Set forth below are the reconciliations of these non-GAAP
measures to their most directly comparable GAAP financial measure.
|
 -
28 -
Appendix 1 –
Adjusted EBITDA
Appendix 1 –
Adjusted EBITDA
($ Millions)
LTM
OMNOVA Solutions Consolidated
2007*
2008
2009
2010
Feb 28, 2011
Income (loss) from continuing operations
$
(4.9)
$
(2.2)
$
26.2
$
107.9
$
104.1
Interest expense
15.7
12.3
7.5
8.0
26.6
Amortization of deferred financing costs
0.8
0.7
0.6
0.7
1.6
Income tax
0.1
0.2
1.7
(89.4)
(82.8)
Depreciation & amortization
23.1
23.9
22.9
20.6
33.1
EBITDA
$
34.8
$
34.9
$
58.9
$
47.8
$
82.6
Restructuring & severance
1.0
0.6
2.1
0.6
1.1
Asset impairments
-
-
1.1
6.2
6.2
Non-cash stock compensation
2.9
2.4
2.8
3.5
3.5
Other
11.3
1.2
(0.5)
16.2
27.2
Adjusted EBITDA
$
50.0
$
39.1
$
64.4
$
74.3
$
120.6
OMNOVA Solutions Adjusted EBITDA
$
50.0
$
39.1
$
64.4
$
74.3
$
120.6
Eliokem International Adjusted EBITDA
28.5
34.6
35.1
50.9
Combined Adjusted EBITDA
$
78.5
$
73.7
$
99.5
$
125.2
$
120.6
Combined Sales
$
1,068.0
$
1,158.9
$
925.9
$
1,134.6
$
1,169.9
Percentage of Adjusted EBITDA to Sales
7.4%
6.4%
10.7%
11.0%
10.3%
LTM: Last Twelve Months through February 28, 2011 including ELIOKEM on a Pro Forma
Basis for 2010 * NOTE: 2007 Sales and Adjusted EBITDA have been adjusted by
$94.4 million and $4.8 million, respectively. Pro forma 2007 reflects the
full year results of the Asian businesses acquired during December 2007 as if
the acquisition took place December 1, 2006. |
 -
29 -
Appendix 2 –
Net Debt / Adjusted EBITDA
Appendix 2 –
Net Debt / Adjusted EBITDA
($ Millions)
LTM
OMNOVA Solutions Consolidated
2007
2008
2009
2010*
Feb 28, 2011
Total Debt
$ 149.9
$ 188.3
$ 144.1
$ 394.2
$ 454.7
Less Cash
(12.6)
(17.4)
(41.5)
(328.7)
(74.0)
Net Debt
137.3
$
170.9
$
102.6
$
65.5
$
380.7
$
Adjusted EBITDA (Appendix 1)
$ 50.0
$ 39.1
$ 64.4
$ 74.3
$ 120.6
Net Debt / Adjusted EBITDA
2.7
x
4.4
x
1.6
x
0.9
x
3.2
x
LTM: Last Twelve Months through February 28, 2011 including ELIOKEM on a Pro Forma
Basis for 2010 * 2010 Total Debt includes $250.0M of Senior Notes held in
escrow and 2010 cash includes restricted cash of $253.1M |
 -
30 -
Appendix 3 –
Adjusted EBITDA
Appendix 3 –
Adjusted EBITDA
($ Millions)
LTM
Performance Chemicals Segment
2007
2008
2009
2010
Feb 28, 2011
Segment Operating Profit
$
23.7
$
25.2
$
47.9
$
73.3
$
83.7
Interest Expense
-
-
-
-
11.7
Amortization of deferred financing costs
-
-
-
-
0.3
Income Tax
-
-
-
-
5.1
Depreciation & amortization
11.1
11.0
9.9
9.3
22.6
EBITDA
$
34.8
$
36.2
$
57.8
$
82.6
$
123.4
Restructuring & severance
-
0.1
0.2
0.4
0.9
Asset Impairments
-
-
0.7
-
-
Non-cash stock compensation
1.0
1.1
0.8
1.2
1.2
Other
(0.7)
0.1
0.2
(9.4)
(1.6)
Adjusted EBITDA
$
35.1
$
37.5
$
59.7
$
74.8
$
123.9
Sales
$
475.3
$
521.6
$
396.8
$
527.9
$
846.8
Percentage of Adjusted EBITDA to Sales
7.4%
7.2%
15.0%
14.2%
14.6%
LTM: Last Twelve Months through February 28, 2011 including ELIOKEM on a Pro Forma
Basis for 2010 |
 -
31 -
Appendix 4 –
Adjusted EBITDA
Appendix 4 –
Adjusted EBITDA
($ Millions)
LTM
Decorative Products Segment
2007*
2008
2009
2010
Feb 28, 2011
Segment Operating Profit
$
10.4
$
(6.7)
$
1.6
$
(18.0)
$
(19.7)
Interest Expense
-
-
-
-
-
Amortization of deferred financing costs
-
-
-
-
-
Income Tax
-
-
-
-
-
Depreciation & amortization
11.7
12.5
12.5
11.0
10.4
EBITDA
$
22.1
$
5.8
$
14.1
$
(7.0)
$
(9.3)
Restructuring & severance
0.7
0.5
1.8
0.1
0.1
Asset Impairments
-
-
0.6
6.2
6.2
Non-cash stock compensation
0.8
0.9
0.4
1.1
1.1
Other
0.2
-
-
9.4
9.5
Adjusted EBITDA
$
23.8
$
7.2
$
16.9
$
9.8
$
7.6
Sales
$
364.6
$
347.8
$
299.6
$
318.3
$
323.1
Percentage of Adjusted EBITDA to Sales
6.5%
2.1%
5.6%
3.1%
2.4%
LTM: Last Twelve Months through February 28, 2011
* NOTE: 2007 Sales and Adjusted EBITDA have been adjusted by $94.4 million and $4.8
million, respectively. Pro forma 2007 reflects the full year results of the
Asian businesses acquired during December 2007 as if the acquisition took
place December 1, 2006. |
 -
32 -
Appendix 5 –
Adjusted EBITDA
Appendix 5 –
Adjusted EBITDA
($ Millions)
Eliokem International
2007
2008
2009
2010
Net income
$
5.8
$
(2.5)
$
1.2
$
0.4
Interest expense
15.0
17.5
16.8
16.0
Amortization of deferred financing costs
0.5
0.5
0.5
0.4
Income Tax
2.5
(3.3)
1.3
2.6
Depreciation & amortization
12.5
14.3
13.4
13.2
EBITDA
$
36.3
$
26.5
$
33.2
$
32.6
Restructuring & severance
1.1
1.1
3.9
1.1
Other
(8.9)
7.0
(2.0)
17.2
Adjusted EBITDA
$
28.5
$
34.6
$
35.1
$
50.9
Sales
$
228.1
$
289.5
$
229.5
$
288.4
Percentage of Adjusted EBITDA to Sales
12.5%
12.0%
15.3%
17.6%
Combined Adjusted EBITDA
2007
2008
2009
2010
Performance Chemicals Adjusted EBITDA
$
35.1
$
37.5
$
59.7
$
74.8
Eliokem International Adjusted EBITDA
28.5
34.6
35.1
50.9
Combined Adjusted EBITDA
$
63.6
$
72.1
$
94.8
$
125.7
Combined Sales
Performance Chemicals
$
475.3
$
521.6
$
396.8
$
527.9
Eliokem International
228.1
289.5
229.5
288.4
Combined Sales
$
703.4
$
811.1
$
626.3
$
816.3
Percentage of Adjusted EBITDA to Sales
9.0%
8.9%
15.1%
15.4% |
 *
*
*
*
*
*
*
*
************
************
************
************
************
************ |