Attached files
| file | filename |
|---|---|
| 8-K - AMERIANA BANCORP | v223269_8k.htm |
Ameriana Bancorp Annual Meeting May 19, 2011 CEO Presentation
1
Forward -Looking Statement This presentation contains forward -looking statements, which include statements about Ameriana’s future financial performance, business plans and strategies . Forward -looking statements involve future risks and uncertainties, because of factors that could cause actual results to differ materially from those expressed or implied . Specific risk factors and other uncertainties that could affect the accuracy of forward -looking statements are included in Ameriana’s Form 10-K for the year ended December 31, 2010.
2
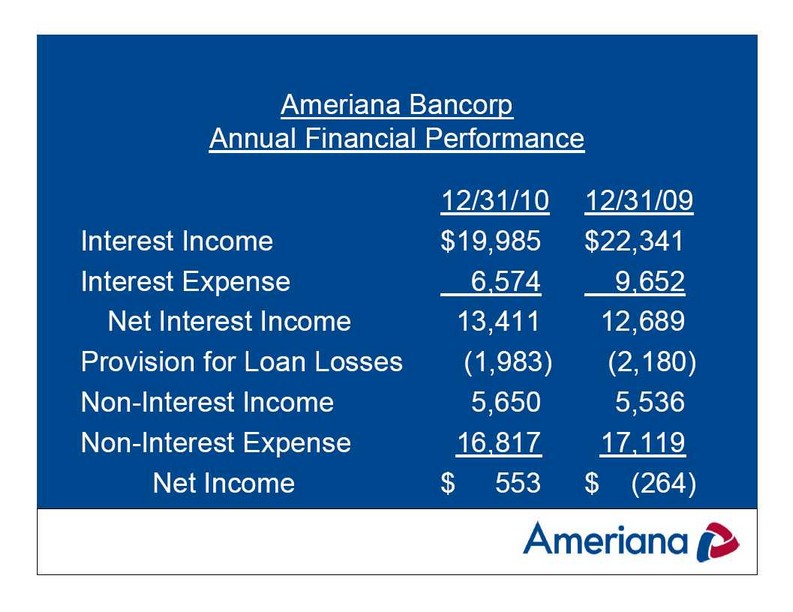
Ameriana Bancorp Annual Financial Performance 12/31/10 12/31/09 Interest Income $19,985 $22,341 Interest Expense 6,574 9,652 Net Interest Income 13,411 12,689 Provision for Loan Losses (1,983 ) (2,180 ) Non-Interest Income 5,650 5,536 Non-Interest Expense 16,817 17,119 Net Income $553 $(264 )
3
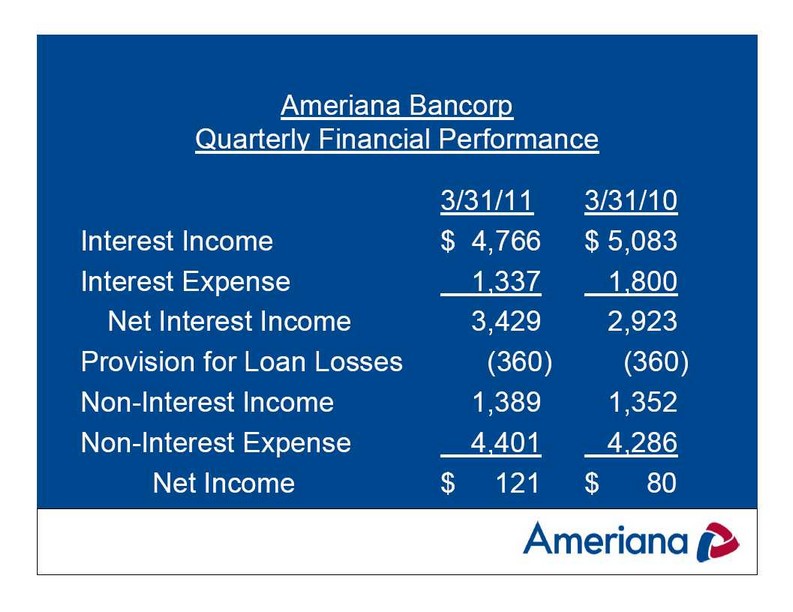
Ameriana Bancorp Quarterly Financial Performance 3/31/11 3/31/10 Interest Income $4,766 $5,083 Interest Expense 1,337 1,800 Net Interest Income 3,429 2,923 Provision for Loan Losses (360 ) (360 ) Non-Interest Income 1,389 1,352 Non-Interest Expense 4,401 4,286 Net Income $121 $80
4

Ameriana Bank Capital (as of 3/31/11) ASBI Peer Tier 1 Leverage Capital 8.73 9.20 Tier 1 RBC/Risk Wtd. Assets 11.82 13.39 Total RBC/Risk Wtd. Assets 13.07 14.66 Source: FDIC UBPR 3/31/2011
5
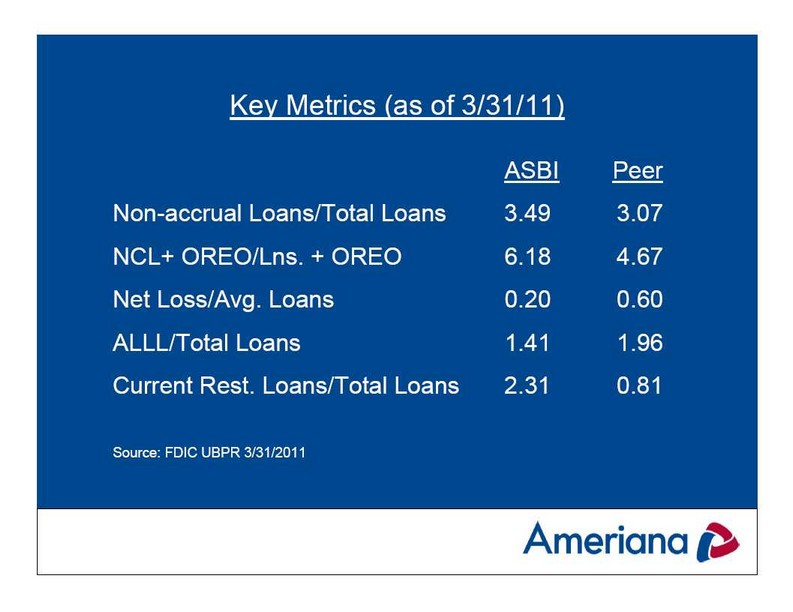
Key Metrics (as of 3/31/11) ASBI Peer Non-accrual Loans/Total Loans 3.49 3.07 NCL+ OREO/Lns. + OREO 6.18 4.67 Net Loss/Avg. Loans 0.20 0.60 ALLL/Total Loans 1.41 1.96 Current Rest. Loans/Total Loans 2.31 0.81 Source: FDIC UBPR 3/31/2011
6
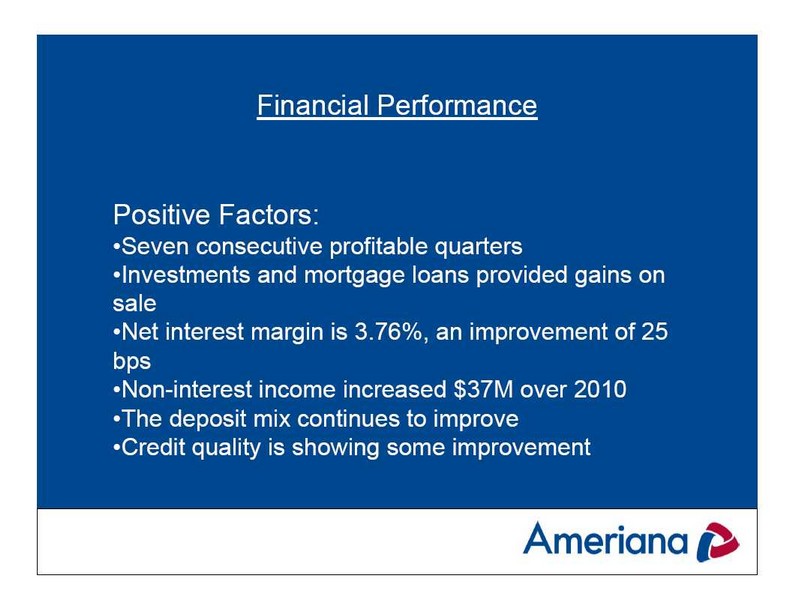
Financial Performance Positive Factors: Seven consecutive profitable quarters •Investments and mortgage loans provided gains on sale •Net interest margin is 3.76%, an improvement of 25 bps •Non-interest income increased $37M over 2010 •The deposit mix continues to improve •Credit quality is showing some improvement
7

Financial Performance Negative Factors: Asset yields are somewhat below peer Funding costs are higher than peer •Assets per employee is low (i.e. excess capacity) DDA’s are below high performing peer banks •Other non-personnel expenses are higher than peer Personnel expense, due to number of offices, is higher than peer •Credit costs remain significant and negatively impact earnings
8

Financial Performance (as of 3/31/11) Profitability: (% of Avg. Assets) ASBI Peer Interest Expense 1.15 0.99 Other Operating Expense 1.16 1.03 Occupancy Expense 0.62 0.38 Personnel Expense 2.12 1.50 Total Overhead Expense 3.90 2.93 Efficiency Ratio 85.91 % 68.89 % Assets Per Employee (in millions) 2.76 4.58 Avg. Pers. Exp. Per Employee ($ Million) 57.41 65.49 Source: FDIC UBPR 3/31/2011
9
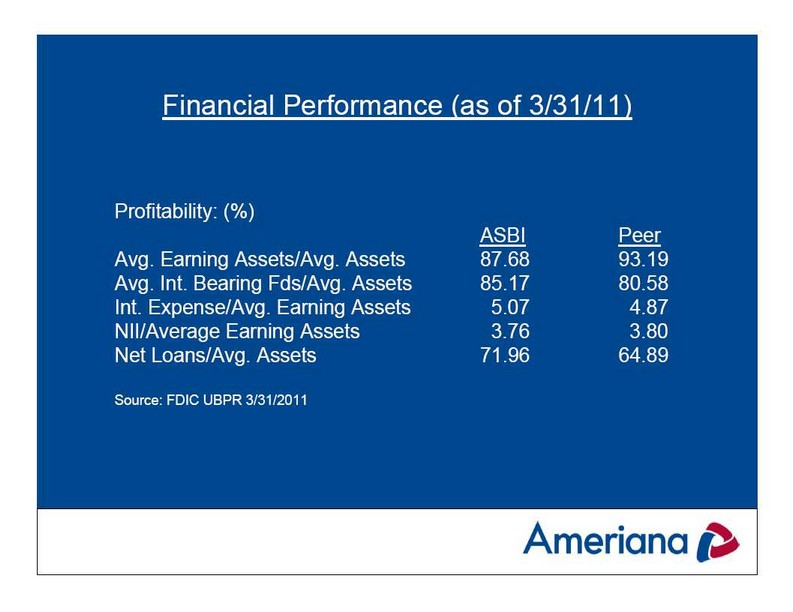
Financial Performance (as of 3/31/11) Profitability: (%) ASBI Peer Avg. Earning Assets/Avg. Assets 87.68 93.19 Avg. Int. Bearing Fds/Avg. Assets 85.17 80.58 Int. Expense/Avg. Earning Assets 5.07 4.87 NII/Average Earning Assets 3.76 3.80 Net Loans/Avg. Assets 71.96 64.89 Source: FDIC UBPR 3/31/2011
10

Financial Performance (as of 3/31/11) Profitability: (%) ASBI Peer Securities/Avg. Assets 8.25 17.90 DDA/Avg. Assets 4.50 7.28 CDs/Avg. Assets 28.97 13.71 Core Deposits 75.80 74.79 FHLB/Avg. Assets 7.17 3.24 Source: FDIC UBPR 3/31/2011
11
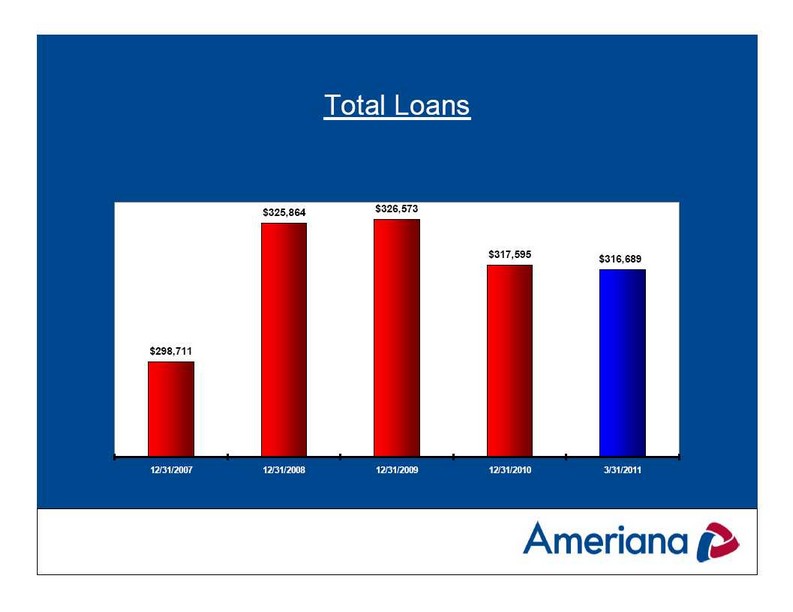
Total Loans $325,864 $326,573 $317,595 $316,689 $298,711 12/31/2008 12/31/2009 12/31/2010 3/31/2011 12/31/2007
12
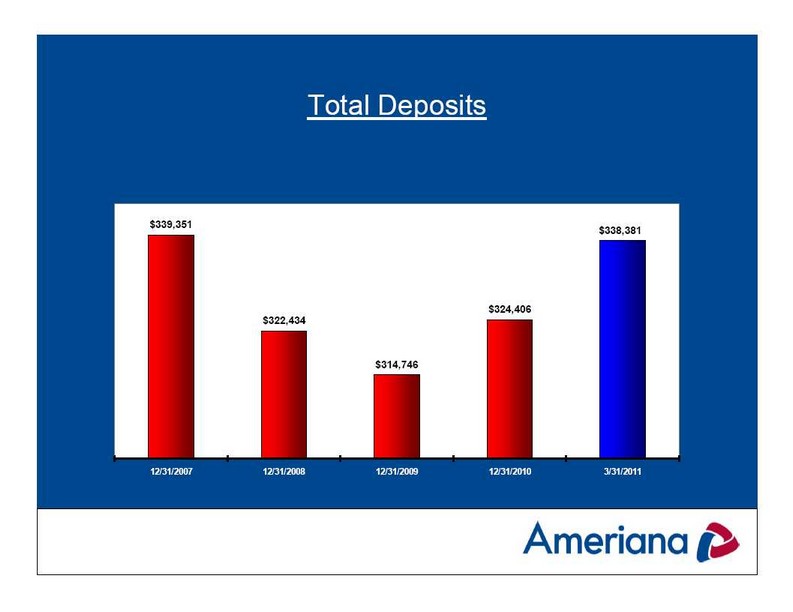
Total Deposits 12/31/2007 12/31/2008 12/31/2009 12/31/2010 3/31/2011 $339,351 $322,434 $314,746 $324,406 $338,381
13
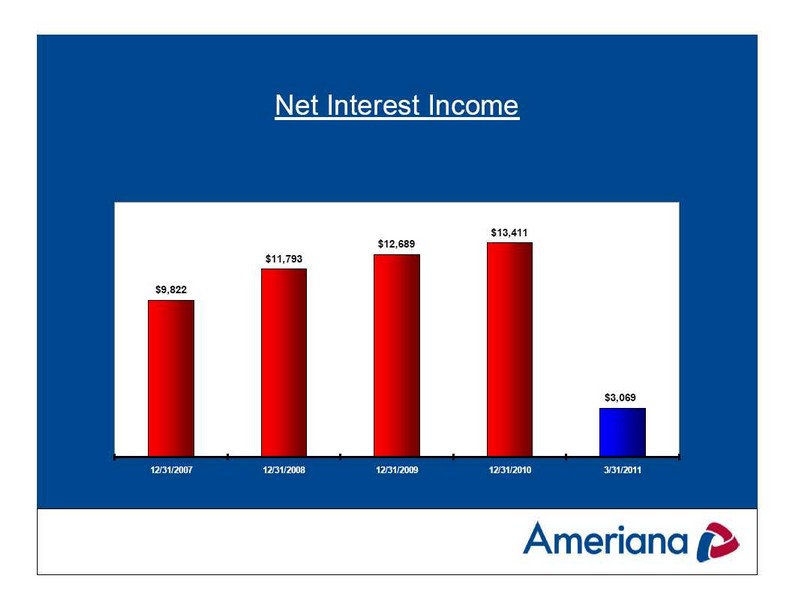
Net Interest Income 12/31/2007 12/31/2008 12/31/2009 12/31/2010 3/31/2011 $9,822 $11,793 $12,689 $13,411 $3,069
14
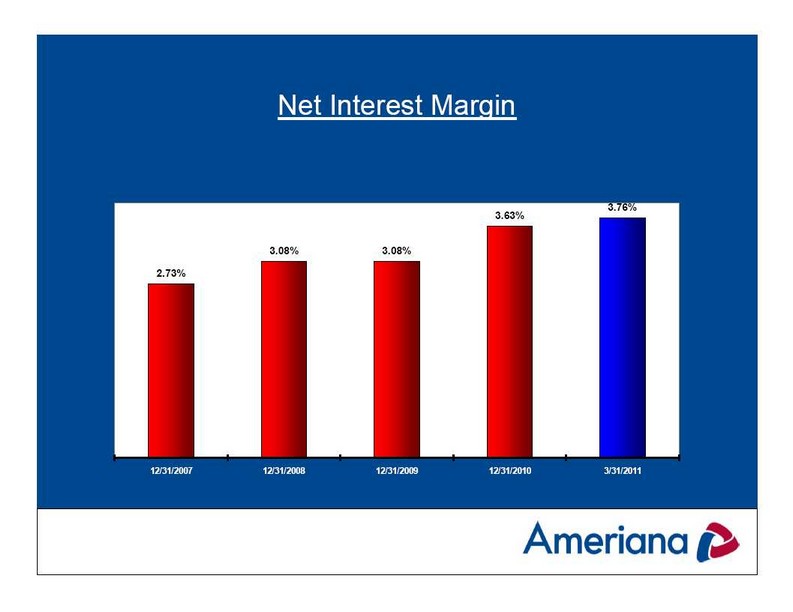
Net Interest Margin 3.63% 3.76% 3.08% 3.08% 2.73% 12/31/2007 12/31/2008 12/31/2009 12/31/2010 3/31/2011
15
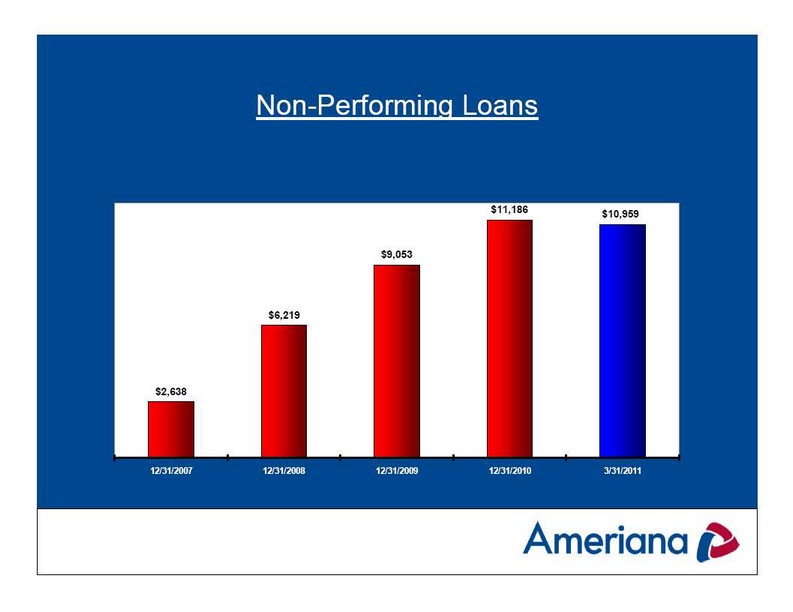
Non-Performing Loans $11,186 $10,959 $9,053 $6,219 $2,638 12/31/2008 12/31/2009 12/31/2010 3/31/2011 12/31/2007
16
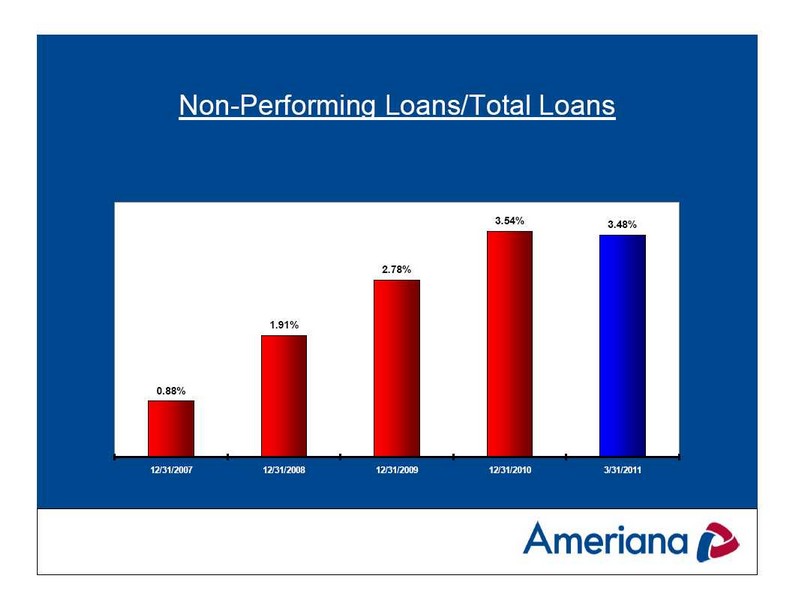
Non-Performing Loans/Total Loans 3.54% 3.48% 2.78% 1.91% 0.88% 12/31/2008 12/31/2009 12/31/2010 3/31/2011 12/31/200
17

OREO $9,082 $9,026 $5,517 $4,169 $3,037 12/31/2008 12/31/2009 12/31/2010 3/31/2011 12/31/2007
18
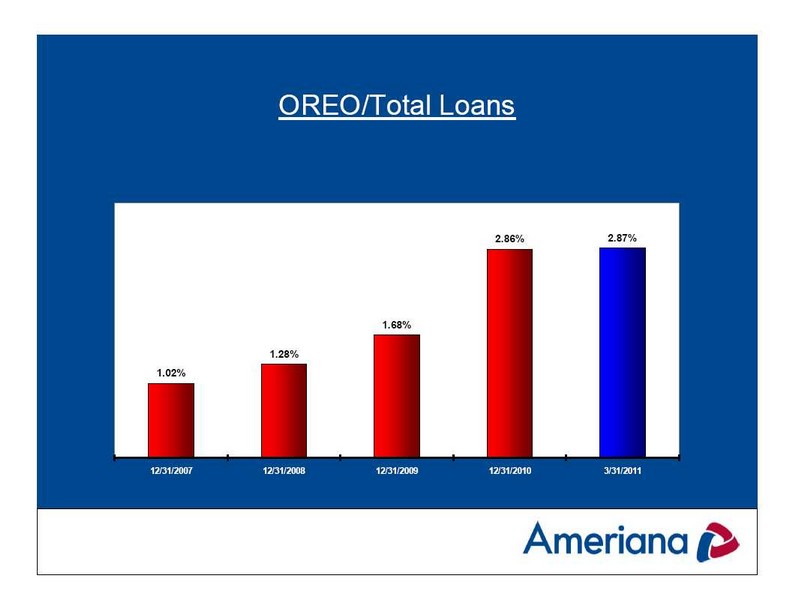
OREO/Total Loans 2.86% 2.87% 1.68% 1.28% 1.02% 12/31/2008 12/31/2009 12/31/2010 3/31/2011 12/31/2007
19
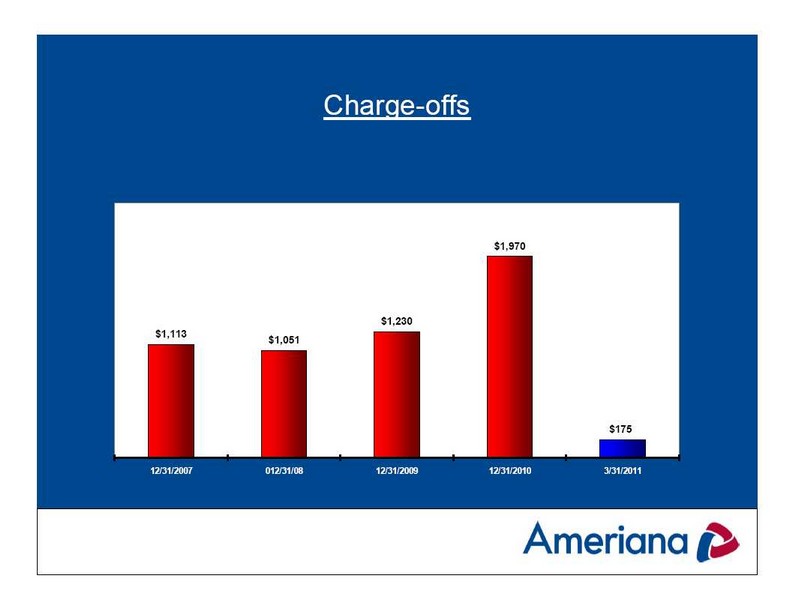
Charge –offs 12/31/2007 012/31/08 12/31/2009 12/31/2010 3/31/2011 $1,113 $1,051 $1,230 $1,970 $175
20
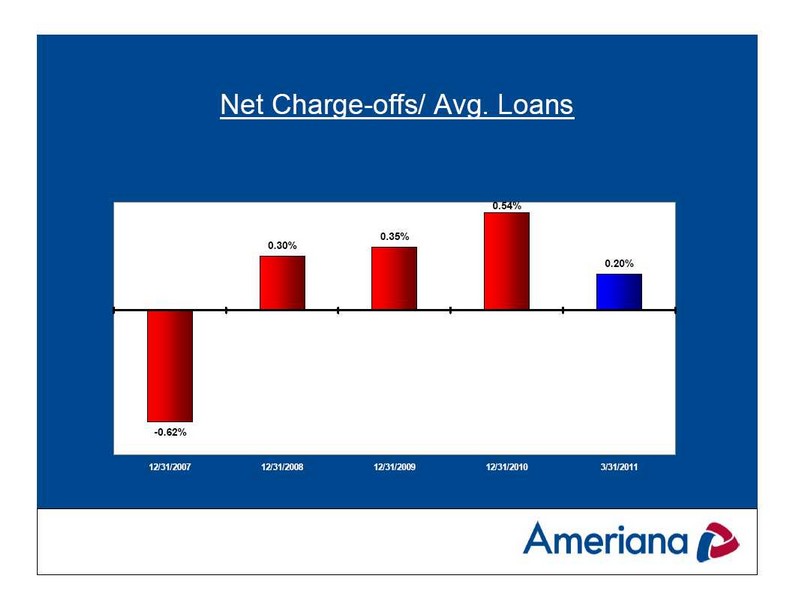
Net Charge -offs/ Avg. Loans 12/31/2007 12/31/2008 12/31/2009 12/31/2010 3/31/2011 -0.62% 0.30% 0.35% 0.54% 0.20%
21
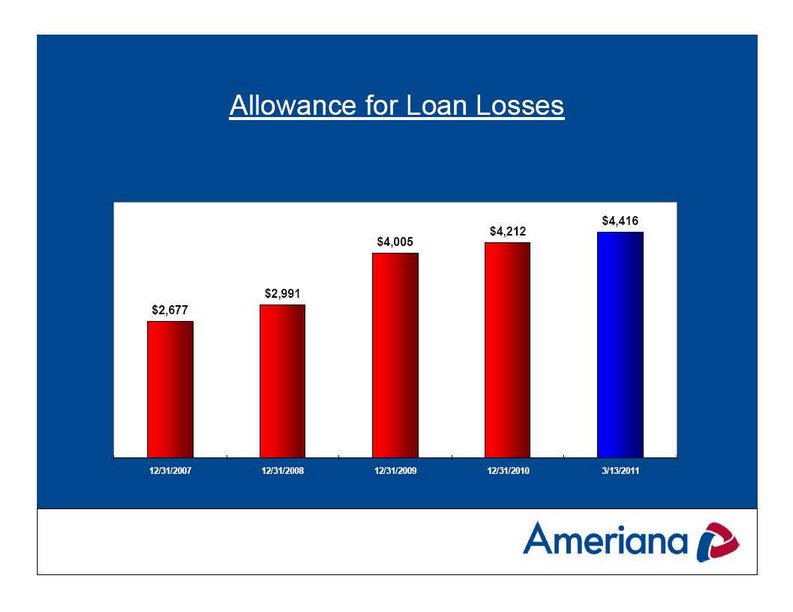
Allowance for Loan Losses $4,416 $4,005 $4,212 $2,991 $2,677 12/31/2007 12/31/2008 12/31/2009 12/31/2010 3/13/2011
22
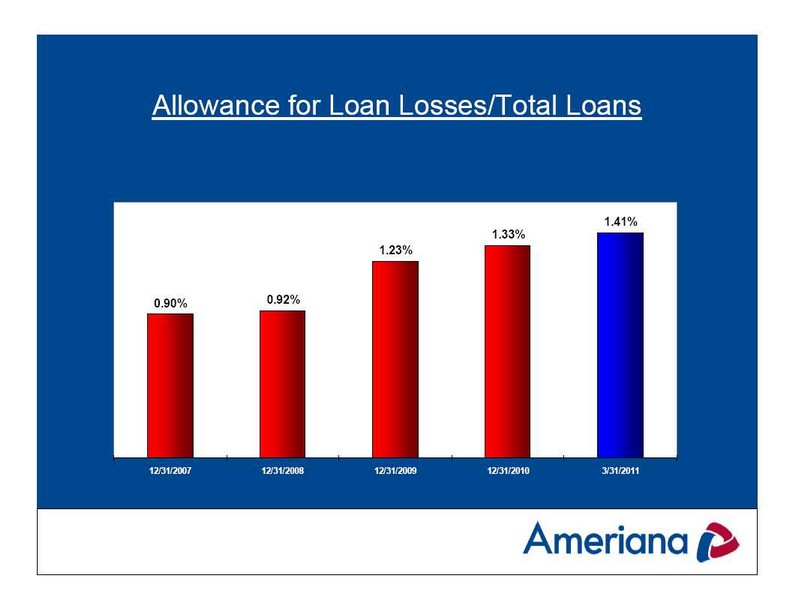
Allowance for Loan Losses/Total Loans 1.41% 1.33% 1.23% 0.90% 0.92% 12/31/2007 12/31/2008 12/31/2009 12/31/2010 3/13/2011
23
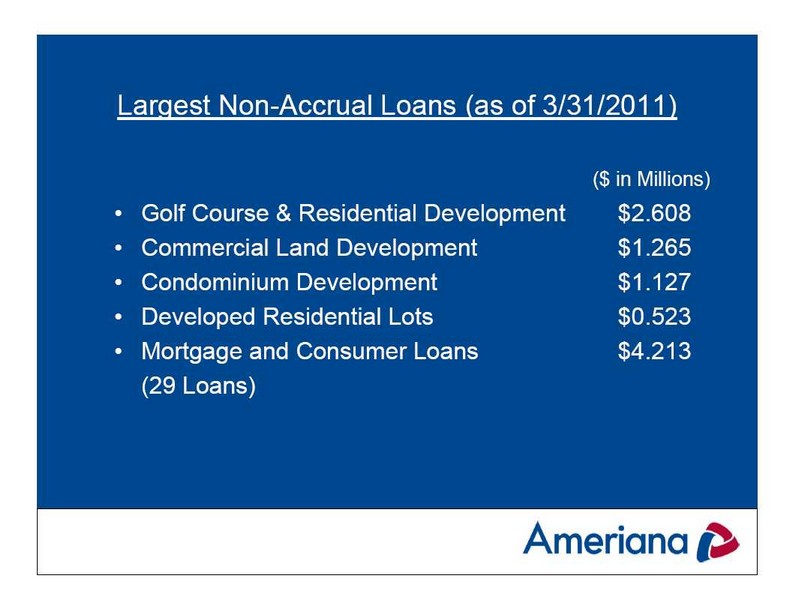
Largest Non-Accrual Loans (as of 3/31/2011) ($ in Millions) • Golf Course & Residential Development $2.608 • Commercial Land Development $1.265 • Condominium Development $1.127 • Developed Residential Lots $0.523 • Mortgage and Consumer Loans $4.213 (29 Loans)
24
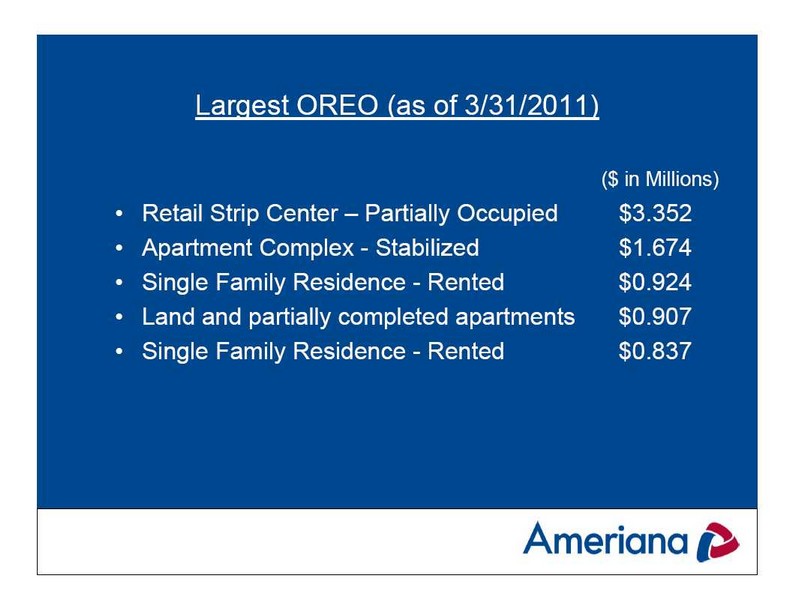
Largest OREO (as of 3/31/2011) ($ in Millions) • Retail Strip Center – Partially Occupied $3.352 • Apartment Complex - Stabilized $1.674 • Single Family Residence - Rented $0.924 • Land and partially completed apartments $0.907 • Single Family Residence - Rented $0.837
25
Key Challenges for 2011 Margin Compression is likely Low short-term interest rates, steep yield curve Deposit pricing is at all time lows Extremely competitive loan pricing Consumers preference for short-term, fixed-rate certificates of deposit • Regulatory and accounting environment Dodd - Frank Basel III FASB pronouncements
26
Industry Challenges for 2011 • Economic Conditions Current economic conditions slowly improving Resurgent U.S. auto industry and regional impact Continued price decline of residential housing market Decline in commercial property values Continued high unemployment Competition Capital Liquidity Global unrest and sovereign risk
27
Key Objectives for 2011 Asset Quality Earnings Capital Liquidity Customer and Brand Experience/Service Performance Regulatory and Enterprise Risk Management Technology Implementation and Operational Improvement People
28
Asset Quality Objectives for 2011 Reduce the level of criticized and classified credits Reduce OREO to reasonable levels Maintain an adequate ALLL Ensure proper risk rating of all loans Obtain risk-adjusted pricing for loans Improve regulatory ratings
29
Earnings Objectives for 2011 Achieve net income of $1,713,500 for Bank and $1,140,000 on a consolidated basis Improve our net interest margin Increase fee income from lending Reduce credit losses and OREO expenses Increase fee income from AFS and AIA Increase new checking accounts and demand deposit balances Reduce non-interest expenses
30
Capital Objectives for 2011 Maintain well-capitalized status: minimum of 8.5% Tier 1 Capital and 12.0% Total Risk Based Capital Evaluate SBLF as a way to raise additional capital and provide funding for additional small business lending Evaluate other strategies for raising capital to mitigate exposure to loan losses Build or acquire capital for acquisition or expansion purposes
31
Liquidity Objectives for 2011 Maintain adequate on balance sheet liquidity Meet or exceed all board established minimums and regulatory standards Monitor and adjust to changes in sources of liquidity due to changing collateral requirements Increase low cost deposit balances
32
Customer and Brand Experience/Service Performance Build on our “Welcome Home” experience Incorporate the skill from Priosys into all customer interactions Incorporate 360 Degrees of Service into our daily routines Enhance our community focused brand position Increase the impact from our participation in community events Continue Refer-a-Friend
33
Customer and Brand Performance/Service Performance Build on our financial advising competency, including our platform sales initiative Continue Life/Money Chats Conduct regular mystery shops and customer satisfaction surveys Provide meaningful training and educational opportunities for all Associates Measure, monitor and coach enhanced sales and service, i.e. Custom Blend
34
Regulatory and Enterprise Risk Management Objectives for 2011 Meet regulatory standards for risk management and measurement Develop enterprise risk standards and compile management and measurement reports Meet the requirements of Dodd – Frank Evaluate the impact of Basel III Capital Standards Meet FASB and SEC financial reporting standards
35
Technology Implementation and Operational Improvement Finalize contract with FIS Install and implement new systems including ECHO, BI, FLO, etc. Evaluate a mobile banking solution Upgrade the on-line banking system Improve all operating processes to streamline and automate account processing
36
People Improve the performance appraisal process Revise the employee handbook Improve career counseling Implement KSOP plan as part of our 401-(k) plan Be an employer of choice and be recognized as a “best place” to work
37
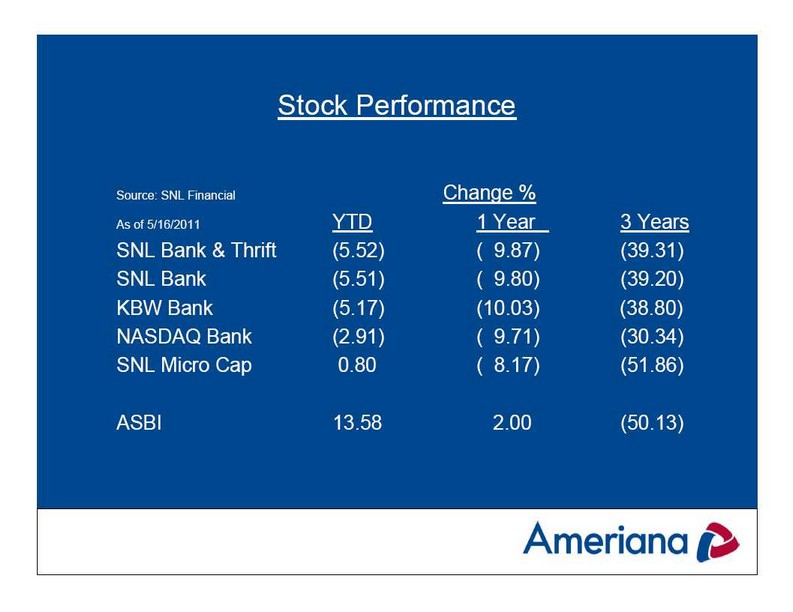
Source: SNL Financial Change % As of 5/16/2011 YTD 1 Year 3 Years SNL Bank & Thrift (5.52 ) ( 9.87 ) (39.31 ) SNL Bank (5.51 ) ( 9.80 ) (39.20 ) KBW Bank (5.17 ) (10.03 ) (38.80 ) NASDAQ Bank (2.91 ) ( 9.71 ) (30.34 ) SNL Micro Cap 0.80 ( 8.17 ) (51.86 ) ASBI 13.58 2.00 (50.13 ) Stock Performance
38

Questions?
39