Attached files
| file | filename |
|---|---|
| 8-K - FORM 8-K - STATE STREET CORP | d8k.htm |
| EX-99.2 - RECONCILIATIONS OF CONSOLIDATED REPORTED RESULTS OF OPERATION - STATE STREET CORP | dex992.htm |
 Annual
Meeting of Shareholders 18 May 2011
Exhibit 99.1 |
 Building from Strength
Joseph L. Hooley
Chairman, President and
Chief Executive Officer |
 3
Reminder
This presentation contains “forward-looking statements” within the meaning of U.S.
securities laws, including statements about industry trends, management’s expectations about
our financial performance, market growth, acquisitions and divestitures, new technologies, services
and opportunities and earnings, management’s confidence in our strategies and other
matters that do not relate strictly to historical facts. Forward-looking statements are often identified by such forward-looking terminology as “expect,” “look,” “believe,”
“anticipate,” “estimate,” “seek,” “may,” “will,”
“trend,” “target” and “goal,” or similar statements or variations of such terms. Forward-looking statements are subject to various risks
and uncertainties, which change over time, are based on management’s expectations and assumptions
at the time the statements are made, and are not guarantees of future results.
Management’s expectations and assumptions, and the continued validity of the forward-looking statements, are subject to change due to a broad range of factors affecting
the national and global economies, the equity, debt, currency and other financial markets, as well as
factors specific to State Street and its subsidiaries, including State Street Bank. Therefore,
actual outcomes and results may differ materially from what is expressed in those statements, and those statements should not be relied upon as representing our
expectations or beliefs as of any date subsequent to May 18, 2011.
Important factors that could cause changes in the expectations or assumptions on which
forward-looking statements are based include, but are not limited to: the manner in which
the Federal Reserve and other regulators implement the Dodd-Frank Act and other regulatory
initiatives in the U.S. and internationally, including any increases in the minimum regulatory
capital ratios applicable to us and regulatory developments that result in changes to our operating model, or other changes to the provision of our services in order to
comply with or respond to such regulations; required regulatory capital ratios under Basel II and
Basel III, in each case as fully implemented by State Street and State Street Bank (and in the
case of Basel III, when finally adopted by the Federal Reserve), which may result in the need for substantial additional capital or increased levels of liquidity in the future;
changes in law or regulation that may adversely affect our, our clients’ or our
counterparties’ business activities and the products or services that we sell, including additional or
increased taxes or assessments thereon, capital adequacy requirements and changes that expose us to
risks related to compliance; financial market disruptions and the economic recession, whether
in the U.S. or internationally; the liquidity of the U.S. and international securities markets, particularly the markets for fixed-income securities, and the liquidity
requirements of our clients; increases in the volatility of, or declines in the levels of, our net
interest revenue, changes in the composition of the assets on our consolidated statement of
condition and the possibility that we may be required to change the manner in which we fund those assets; the financial strength and continuing viability of the
counterparties with which we or our clients do business and to which we have investment, credit or
financial exposure; the credit quality, credit agency ratings, and fair values of the
securities in our investment securities portfolio, a deterioration or downgrade of which could lead to
other-than-temporary impairment of the respective securities and the recognition of an
impairment loss in our consolidated statement of income; delays or difficulties in the execution of our previously announced global multi-year program designed to enhance
our operating model, which could lead to changes in our estimates of the charges, expenses or savings
associated with the planned program, resulting in increased volatility of our earnings; the
maintenance of credit agency ratings for our debt and depository obligations as well as the level of credibility of credit agency ratings; the risks that acquired
businesses will not be integrated successfully, or that the integration will take longer than
anticipated, that expected synergies will not be achieved or unexpected disynergies will be
experienced, that client and deposit retention goals will not be met, that other regulatory or
operational challenges will be experienced and that disruptions from the transaction will harm
relationships with clients, employees or regulators; the ability to complete acquisitions, divestitures and joint ventures, including the ability to obtain regulatory approvals, the
ability to arrange financing as required and the ability to satisfy closing conditions; the
performance of and demand for the products and services we offer, including the level and
timing of redemptions and withdrawals from our collateral pools and other collective investment
products; the possibility that our clients will incur substantial losses in investment pools
where we act as agent, and the possibility of significant reductions in the valuation of assets; our ability to attract deposits and other low-cost, short-term funding; potential
changes to the competitive environment, including changes due to the effects of consolidation, and
perceptions of State Street as a suitable service provider or counterparty; the level and
volatility of interest rates and the performance and volatility of securities, credit, currency and other markets in the U.S. and internationally; our ability to measure the fair
value of the investment securities on our consolidated statement of condition; the results of
litigation, government investigations and similar disputes or proceedings; our ability to
control operating risks, information technology systems risks and outsourcing risks, and our ability
to protect our intellectual property rights, the possibility of errors in the quantitative
models we use to manage our business and the possibility that our controls will prove insufficient, fail or be circumvented; adverse publicity or other reputational harm;
our ability to grow revenue, attract and/or retain and compensate highly skilled people, control
expenses and attract the capital necessary to achieve our business goals and comply with
regulatory requirements; the potential for new products and services to impose additional costs on us and expose us to increased operational risk; changes in accounting
standards and practices; and changes in tax legislation and in the interpretation of existing tax laws
by U.S. and non-U.S. tax authorities that affect the amount of taxes due. Other important factors that could cause actual results to differ materially from those
indicated by any forward-looking statements are set forth in our 2010 Annual Report on Form
10-K and our subsequent SEC filings. We encourage investors to read these filings,
particularly the sections on risk factors, for additional information with respect to any forward-
looking statements and prior to making any investment decision. The forward-looking statements
contained in this presentation speak only as of the date hereof, May 18, 2011, and we do not
undertake efforts to revise those forward-looking statements to reflect events after that date. |
 4
Building from Strength
2010: A Year of Transition
Strategic Direction
Investing in Communities and Corporate Social Responsibility
2011: Progress
Agenda |
 5
2010: A Year of Transition |
 6
Building from Strength
2010: A Year of Transition
INCREASED CAPITAL
FLEXIBILITY
•
Repositioned investment portfolio to lay the foundation to
restore the dividend and prepare for Basel III ahead of
implementation dates
•
90% of investment portfolio assets rated AAA / AA*
ADDRESSED ISSUES FROM
FINANCIAL CRISIS
•
Reached settlement with SEC on fixed-income issues
•
Implemented solution to provide clients in securities
lending program with improved access to liquidity
•
Strengthened risk infrastructure
DEEPENED CLIENT
RELATIONSHIPS
•
Added $1.4T in assets to be serviced
•
Added $160B in gross new asset management business
•
Launched new products and services
EXPANDED MARKET SHARE
•
Strategic acquisitions advanced State Street’s market share
in Europe and key client segments
INITIATED OPS AND IT
TRANSFORMATION PROGRAM
•
Multi-year strategic transformational plan in place
•
Broad-based organizational focus
*
As of March 31, 2011. |
 7
Building from Strength
State Street Corporation
“Well
Capitalized”
1
3/31/11
12/31/10
12/31/09
Tier 1 Leverage
5.0%
2
8.7%
8.2%
8.5%
Tier 1 Capital
6.0%
19.6%
20.5%
17.7%
Tier 1 Common Ratio
3
----
17.5%
18.1%
15.6%
Total Capital
10.0%
21.6%
22.0%
19.1%
Tangible Common Equity
4
----
7.4%
7.6%
6.6%
CAPITAL RATIOS
2010: A Year of Transition –
Increased Capital Flexibility
Capital Ratios Exceed Regulatory “Well Capitalized”
Requirements
1 Except as noted in note 4 below, minimum “Well Capitalized” as defined by Federal
regulators under Basel I. 2 Minimum “Well Capitalized,” as defined by Federal
regulators, applies to State Street Bank and Trust only and therefore stated only as a reference point.
3 The tier 1 common ratio is not required by GAAP or on a recurring basis by bank
regulations. See State Street’s website (www.statestreet.com) for a description of this ratio and
related reconciliations.
4 As defined by State Street. The TCE ratio is not required by GAAP or by bank
regulations. See State Street’s website (www.statestreet.com) for a description of this ratio and
related reconciliations.
|
 8
Building from Strength
2010: A Year of Transition –
Deepened Client Relationships
Growing Momentum in Core Businesses
2000
2010
Top 100 clients
11.4 products
13.2 products
Top 1,000 clients
7.1 products
7.9 products
Expanded Relationships
New Clients
INVESTMENT
SERVICING
•
Babson Capital Management
•
Charles Schwab
•
Legg Mason Global Asset Management
•
Martin Currie
•
Norges Bank
•
Guotai Nasdaq-100 Index Fund
•
Marshall Wace
•
National Employment Savings Trust
(NEST)
•
PineBridge Investments
•
REST Industry Super
INVESTMENT
MANAGEMENT
•
AT&T
•
Stichting Pensionefonds Ahold
•
Mass PRIM
•
AP7
•
NY State Teachers
•
Lincoln Financial Group
•
Previambiante
•
Pegaso Pension Fund
•
Qsuper
•
Alliance Bernstein
•
Illinois State Teachers
•
UAW |
                            9
Building from Strength
No. 2 Manager
of Worldwide
Institutional Assets
Pensions & Investments
2010 Money
Managers Survey
HF
Administrator
of
the
Year
and PE Fund Administrator
of the Year
International Custody and
Fund Administration
2010 Americas Service
Provider Awards
Transition Manager
of the Year
2010
Global Pensions
Awards
No. 1 Custodian for
Institutional Investors
Global Custodian
2010
Global Custody Survey
No. 1 Among Custodians*
Global Investor / isf
2010 Beneficial
Owners Survey
No. 1 Global Custodian
in Asia Pacific
Global Investor / isf
2010 Global Custody Survey
Equity Lender of the Year
Global Investor / isf
2010 Equity Lending Survey
Best Multi-Asset Class
Trading Platform
(FX Connect)
Profit & Loss
2010 Digital Markets Awards
Most Recognized
ETF Brand, Americas
exchangetradedfunds.com
2010 Global ETF Awards
2010: A Year of Transition –
Deepened Client Relationships
MARKET RECOGNITION
*
Weighted by lendable assets. |
 10
INTESA SANPAOLO’S
SECURITIES SERVICES
•
State Street is now:
–
Leading asset servicer in Italy
–
No. 2 asset servicer of offshore funds in
Luxembourg
and
Ireland
1
•
Goal to retain 90% of revenue of ~€293M
•
Additional cross-sell opportunities
MOURANT INTERNATIONAL
FINANCE ADMINISTRATION
•
State Street is now No. 1 in Alternative Asset
Servicing
globally
2
:
–
Hedge funds
–
Private equity
–
Real estate assets
•
Annualized revenue of about $100 million
•
Additional cross-sell opportunities
BANK OF IRELAND
ASSET MANAGEMENT
•
Expected to deepen SSgA’s capabilities across key
investment strategies
Building from Strength
1 Fitzrovia 12/10.
2 ICFA Annual Fund Administration Survey, 2010; HFN Biannual Fund
Administration Survey 6/10. 2010: A Year of Transition –
Expanded Market Share |
 11
Building from Strength
SUPPORTING GROWTH
•
Market expansion
•
Mergers and acquisitions
•
Geographic expansion
ENABLING PRODUCTIVITY
•
Business process excellence
•
Flexible global workforce
•
Global shared services
ACCELERATING INNOVATION
•
New product development
•
Technology leadership
•
Global solutions
BENEFITING THE CLIENT
•
Service excellence
•
Time to market
•
New products and services
2010: A Year of Transition –
Initiated Ops and IT Transformation Program
Expect to Save Between $575M and $625M by the End of 2014
|
 12
Building from Strength
2010: A Year of Transition
$ in millions
12/31/10
1
12/31/09
1
% Change
Operating-basis revenue
$8,714
$8,138
+7.1%
Operating-basis expenses
$6,176
$5,667
+ 9.0%
Operating-basis EPS
$3.40
$3.32
+2.4%
Operating-basis ROE
10.4%
12.6%
-220 bps
FOR THE TWELVE MONTHS ENDED
•
Responded effectively to the global financial crisis
•
Strengthened capital position
•
Deepened client relationships
•
Expanded market share
•
Launched Ops and IT Transformational Program
1
Financial data presented on an operating or non-GAAP basis (which is adjusted
to exclude, among other things, discount accretion). For a description of GAAP to operating-basis
results,
and
related
reconciliations,
please
see
the
Appendix
on
State
Street’s
website
(www.statestreet.com)
or
State
Street‘s
current
Report
on
Form
8-K
filed
with
the
SEC
on
the date hereof. |
 13
Strategic Direction |
 14
Building from Strength
Strategic Direction
–
Secular Trends Support Growth
GLOBALIZATION
•
Asset managers increasingly invest beyond
their borders
•
Asset management industry globalizing product and
distribution strategies
RETIREMENT SAVINGS
•
Driven by demographics, especially in Europe and Asia
•
Evolution of retirement / savings schemes
OUTSOURCING
•
Growing global trend driven by complexity, cost and
risk management
•
Expanding into middle and front office
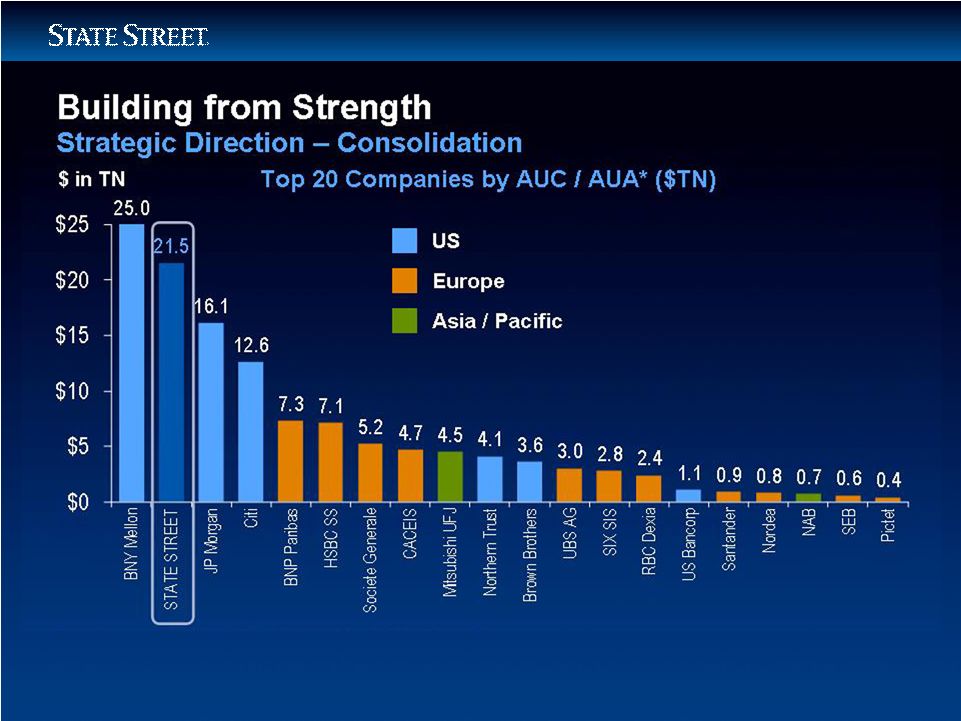
CONSOLIDATION
•
Non-core activity for universal banks
•
Increasing requirement for global capabilities |
 15
Year ended
12/31/00
2
Year ended
12/31/10
% Change
Operating-basis revenue
$3.45B
$8.71B
+152%
Operating-basis non-US revenue
$0.94B
$3.18B
+238%
Employees
3
17,281
28,670
+66%
Non-US
employees
3
3,463
12,518
+261%
Building from Strength
1 Financial data presented on an operating-basis (which is adjusted to
exclude, among other things, discount accretion). For a description of operating-basis revenue and related
reconciliations,
see
State
Street’s
website
(www.statestreet.com)
or
State
Street’s
current
report
on
Form
8-K
filed
with
the
SEC
on
the
date
hereof.
2 Data exclude the revenue and employees associated with the Corporate Trust
and Private Asset Management businesses divested in 2002 and 2003, respectively.
3 At period end.
Strategic
Direction
–
Globalization1 |
 16
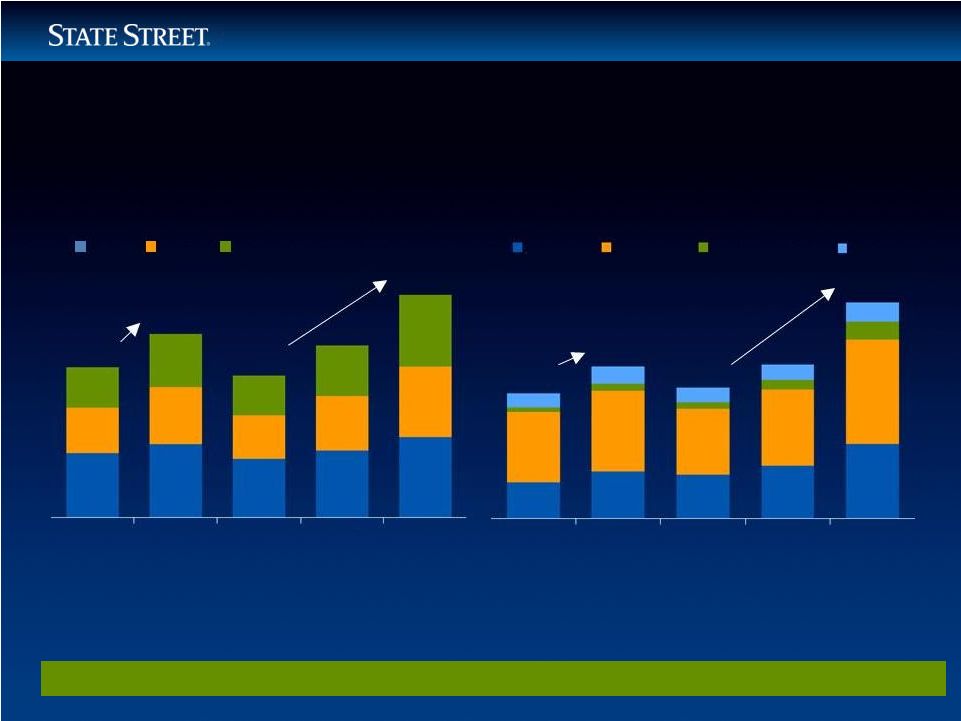
Building from Strength
Non-US Retirement Growth
US Retirement Growth
$13.6T
$16.6T
$12.8T
$15.6T
$20.1T
10.5%
CAGR
7.8%
CAGR
$6.6T
$8.1T
$7.0T
$8.1T
$11.3T
10.8%
CAGR
8.3%
CAGR
Almost 50% of expected retirement asset
growth (2008 –
2014) will come from Europe
Strategic Direction –
Retirement Savings
Global Retirement Assets are Expected to Grow 32% ($7.7 Trillion) from 2010 through
2014 Source:
Cerulli
Associates
“Global
Markets
2010”
statistics
DC and IRA assets will lead US retirement
growth, with 8.6% and 10.1% expected
CAGRs (2008 –
2014)
DB
DC
IRA
2005
2007
2008
2010E
2014F
2005
2007
2008
2010E
2014F
APAC
Europe
Latin America
Other |
 17
Building from Strength
INVESTMENT MANAGER
OPERATIONS OUTSOURCING
•
Leading provider with more than $7 trillion
of AUA
•
Market
sized
at
approximately
$53
trillion
1
HEDGE FUND SERVICING
•
Second
largest
servicer
in
the
world
2
with
about
$470
billion
3
of
AUA
in
hedge
fund
assets
•
Market sized at
$1.7 trillion
4
and growing at an
estimated
19%
CAGR
through
2013
5
INVESTMENT
MANAGEMENT SOLUTIONS
•
Customized strategic and tactical asset allocation
solutions through flexible and efficient portfolio
implementation across and within global asset
classes
Strategic Direction
–
Outsourcing
1 Pension & Investment,/Watson Wyatt World 500, 12/28/09.
2 ICFA Annual Fund Administration Survey, 2010.
3 As of March 31, 2011.
4 Hedge Fund Research, 3/31/10.
5 McKinsey, 7/09. |
 18
Source: Company reports, Global Custody.net, Institutional Investor
Global Custodian Survey. *
Data for BNY, State Street, & CACEIS reflect AUA as of 12/31/2010;
as of 9/30/10 for, BNP Paribas, Societe Generale, & Brown Brothers; as of 6/30/10 for RBC Dexia & HSBC ;
all
others
reflect
AUC
data:
JP
Morgan,
Citi,
&
Northern
Trust
as
of
12/31/10;
Nordea,
NAB,
&
SEB
as
of
9/30/10;
Pictet
as
of
6/30/10;
Mitsubishi,
UBS,
SIX
SIS,
&
Santander:
as of 3/31/10. |
 19
Investing in Communities and
Corporate Social Responsibility |
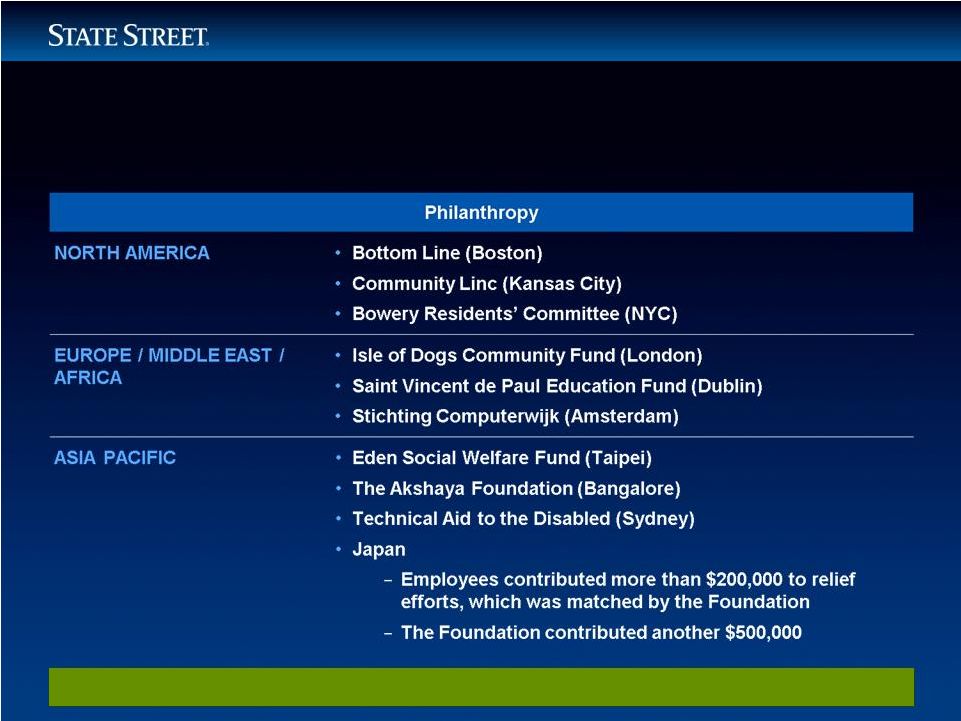 Building from Strength
Investing in Communities and Corporate Social Responsibility
Provided 619 Grants Worldwide
20 |
 21
Building from Strength
Investing in Communities and Corporate Social Responsibility
Volunteerism
PROJECTS INCLUDED
•
Environmental cleanups
•
Food sorting and service
•
Distance and web-based volunteerism
•
Youth Mentoring
•
Support Pledge-a-thons
EXECUTIVES ACTIVE WITH
MANY NON-PROFIT
ORGANIZATIONS INCLUDING
•
Boys & Girls Club of Boston
•
Boston Partners in Education
•
Boston Symphony Orchestra
•
Earthwatch Institute
•
Women’s Lunch Place
•
Oxfam Hong Kong
•
Urban League of Eastern Massachusetts
78,000 Volunteer Hours Dedicated by State Street Employees and Alumni
|
 22
Building from Strength
CORPORATE
RESPONSIBILITY
PRACTICES
Organization
Ranking
Newsweek
Magazine:
Greenest US Companies
No. 35 of Top 500
Carbon Disclosure Project
First time on S&P 500 Business Leadership Index
Dow Jones Sustainability World
and North America Indices
One of only three U.S. financial services companies
listed on both indices
CR
Magazine’s
100 Best Corporate Citizens
One of only three financial services
companies listed
•
Established new Executive Corporate Responsibility Committee
•
Recent accolades include:
Annual CSR Report One of the Only Independently Verified
Reports Among US-based Financial Services Firms
Investing in Communities and Corporate Social Responsibility
|
 23
2011: Progress |
 24
Building from Strength
2011: Progress –
Recent Update
CAPITAL DEPLOYMENT
DIVIDEND PAYOUT
•
Announced increase in quarterly dividend to $0.18 per
share at a 20% payout ratio
SHARE REPURCHASE
PROGRAM
•
Board approved up to $675M in share purchase
program for 2011
BUSINESS
INVESTMENTS
•
Fund organic growth
•
Continue to evaluate accretive acquisition
opportunities to expand our global footprint, accelerate
our growth, and extend our product capabilities |
 25
Building from Strength
$ in millions, except per share data
Q1 2011
1
Q1 2010
1
Change
Operating-basis revenue
$2,330
$2,116
+10.1%
Operating-basis expenses
$1,683
$1,566
+7.5%
Operating-basis EPS
$0.88
$0.75
+17.3%
Operating-basis ROE
9.9%
10.0%
-10 bps
Positive operating leverage
2
260 bps
2011: Progress –
Recent Update
Q1 2011 COMPARED TO Q1 2010
1
Financial
data
presented
on
an
operating
basis
(which
is
adjusted
to
exclude,
among
other
things,
discount
accretion).
For
a
description
of
GAAP
to
operating-basis
results,
and
related reconciliations, please see the Appendix on State Street’s website
(www.statestreet.com) or State Street‘s current Report on Form 8-K filed with the SEC on the date
hereof.
2
Operating leverage represents the difference between the growth rate of total
revenue and the growth rate of total expenses, each determined on an operating basis. |
 26
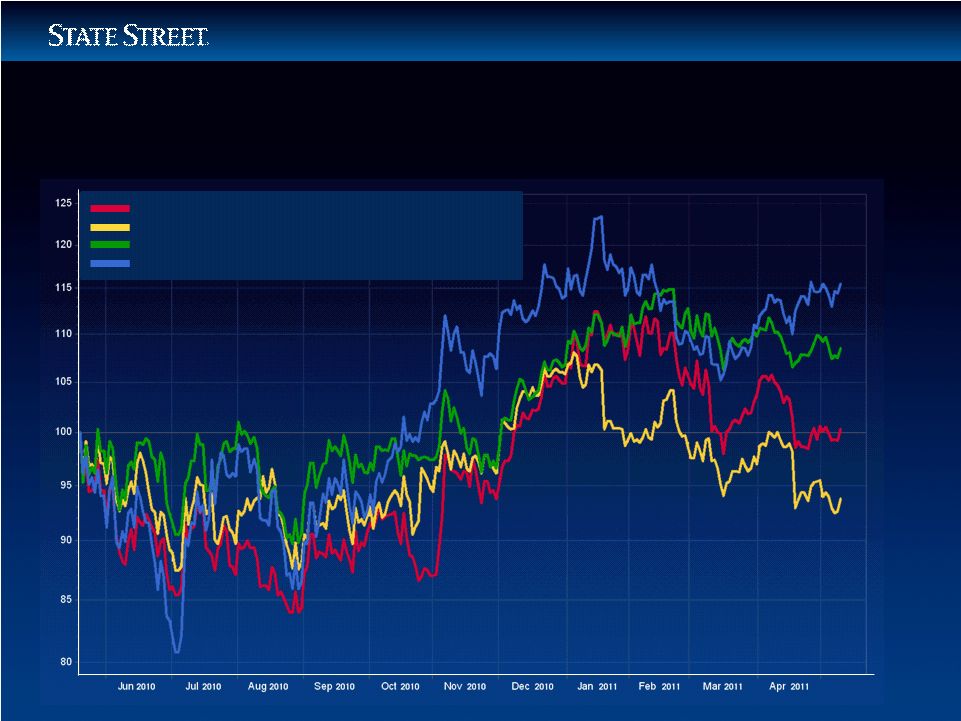
Building from Strength
STT
+15%
S & P
Fin. +8%
BK 0%
NTRS
-7%
Strong Annual Share Performance
Bank of New York Mellon Corp.
Northern Trust Corp.
S&P 500 / Financials
State Street Corp. |
 27
Building from Strength
Delivering Long-Term
Shareholder Value
Summary
Successfully Transitioned
Through Crisis in 2010
Well-Positioned Against
Secular Growth Trends
Financial and Capital Strength
Executing our Strategic Plan |
 28 |
 29 |