Attached files
| file | filename |
|---|---|
| EX-31.2 - EXHIBIT 31.2 - Yankee Holding Corp. | ex31_2.htm |
| EX-32.1 - EXHIBIT 32.1 - Yankee Holding Corp. | ex32_1.htm |
| EX-31.1 - EXHIBIT 31.1 - Yankee Holding Corp. | ex31_1.htm |
| EX-32.2 - EXHIBIT 32.2 - Yankee Holding Corp. | ex32_2.htm |
UNITED STATES
SECURITIES AND EXCHANGE COMMISSION
WASHINGTON, DC 20549
FORM 10-Q
(Mark One)
|
x
|
QUARTERLY REPORT PURSUANT TO SECTION 13 OR 15(d) OF THE SECURITIES EXCHANGE ACT OF 1934
|
For the quarterly period ended: April 2, 2011
|
o
|
TRANSITION REPORT PURSUANT TO SECTION 13 OR 15(d) OF THE SECURITIES EXCHANGE ACT OF 1934
|
For the transition period from ______________ to _____________
Commission File Number: 333-141699-05
YANKEE HOLDING CORP.
(Exact name of registrant as specified in its charter)
|
DELAWARE
|
|
20-8304743
|
|
(State or other jurisdiction of incorporation or organization)
|
|
(I.R.S. Employer Identification No.)
|
16 YANKEE CANDLE WAY
SOUTH DEERFIELD, MASSACHUSETTS 01373
(Address of principal executive office and zip code)
(413) 665-8306
(Registrant’s telephone number, including area code)
Indicate by check mark whether the registrant (1) has filed all reports required to be filed by Section 13 or 15(d) of the Securities Exchange Act of 1934 during the preceding 12 months (or for such shorter period that such registrant was required to file such reports), and (2) has been subject to such filing requirements for the past 90 days.
Yes o No x
We are a voluntary filer of reports required of companies with public securities under Section 13 or 15(d) of the Securities Exchange Act of 1934, and we will have filed all reports which would have been required of us during the past 12 months had we been subject to such provisions.
Indicate by check mark whether the registrant has submitted electronically and posted on its corporate Web site, if any, every Interactive Data File required to be submitted and posted pursuant to Rule 405 of Regulation S-T (§232.405 of this chapter) during the preceding 12 months (or for such shorter period that such registrant was required to submit and post such files).
Yes o No o
Indicate by check mark whether the registrant is a large accelerated filer, an accelerated filer, a non-accelerated filer, or a smaller reporting company. See the definitions of “large accelerated filer,” “accelerated filer” and “smaller reporting company” in Rule 12b-2 of the Exchange Act.
|
Large accelerated filer
|
o
|
Accelerated filer
|
x
|
Non-accelerated filer
|
o
|
Smaller reporting company
|
o
|
Indicate by check mark whether the registrant is a shell company (as defined in Rule 12b-2 of the Exchange Act). Yes o No x
Yankee Holdings Corp.’s sole member is YCC Holdings LLC, which holds 100% of Yankee Holding Corp.’s common stock. There is no aggregate market value for Yankee Holding Corp.’s common stock as of May 6, 2011.
Note Regarding Forward-Looking Statements
This Quarterly Report on Form 10-Q contains a number of forward-looking statements. Any statements contained herein, including without limitation statements to the effect that together Yankee Holding Corp. and subsidiaries (the “Company”) or its management “believes”, “expects”, “anticipates”, “plans” and similar expressions, that relate to prospective events or developments should be considered forward-looking statements. Readers are cautioned not to place undue reliance on these forward-looking statements, which speak only as of the date the statement was made. There are a number of important factors that could cause our actual results to differ materially from those indicated by such forward-looking statements. These factors include, without limitation, those set forth in our Annual Report on Form 10-K and below under Item 1A-Risk Factors. Management undertakes no obligation to publicly update or revise any forward-looking statements, whether as a result of new information, future events or otherwise.
Table of Contents
|
Item
|
|
|
Page
|
|
PART I. Financial Information
|
|
||
|
Item 1.
|
|||
|
|
|
3
|
|
|
|
|
4
|
|
|
5
|
|||
|
|
|
6
|
|
|
|
|
7
|
|
|
Item 2.
|
|
21
|
|
|
Item 3.
|
|
26
|
|
|
Item 4.
|
|
27
|
|
|
PART II. Other Information
|
|||
|
Item 1.
|
|
27
|
|
|
Item 1A.
|
|
28
|
|
|
Item 2.
|
|
31
|
|
|
Item 3.
|
|
31
|
|
|
Item 5.
|
|
32
|
|
|
Item 6.
|
|
32
|
|
|
33
|
|||
PART I. FINANCIAL INFORMATION
|
Item 1.
|
Financial Statements
|
YANKEE HOLDING CORP. AND SUBSIDIARIES
CONDENSED CONSOLIDATED BALANCE SHEETS
(in thousands except share data)
(Unaudited)
|
April 2,
|
January 1,
|
|||||||
|
2011
|
2011
|
|||||||
|
ASSETS
|
||||||||
|
CURRENT ASSETS:
|
||||||||
|
Cash
|
$ | 4,043 | $ | 12,713 | ||||
|
Accounts receivable, net
|
48,623 | 46,937 | ||||||
|
Inventory
|
85,221 | 67,387 | ||||||
|
Prepaid expenses and other current assets
|
18,010 | 10,813 | ||||||
|
Deferred tax assets
|
10,663 | 11,642 | ||||||
|
TOTAL CURRENT ASSETS
|
166,560 | 149,492 | ||||||
|
PROPERTY AND EQUIPMENT-NET
|
117,176 | 118,786 | ||||||
|
GOODWILL
|
643,570 | 643,570 | ||||||
|
INTANGIBLE ASSETS
|
278,682 | 281,749 | ||||||
|
DEFERRED FINANCING COSTS
|
13,456 | 14,271 | ||||||
|
OTHER ASSETS
|
2,113 | 1,832 | ||||||
|
TOTAL ASSETS
|
$ | 1,221,557 | $ | 1,209,700 | ||||
|
LIABILITIES AND STOCKHOLDER'S EQUITY
|
||||||||
|
CURRENT LIABILITIES:
|
||||||||
|
Accounts payable
|
$ | 25,118 | $ | 26,291 | ||||
|
Accrued payroll
|
8,802 | 12,669 | ||||||
|
Accrued interest
|
6,009 | 17,509 | ||||||
|
Accrued income taxes
|
- | 18,840 | ||||||
|
Accrued purchases of property and equipment
|
2,800 | 2,269 | ||||||
|
Current portion of capital leases
|
642 | 667 | ||||||
|
Other accrued liabilities
|
33,573 | 45,508 | ||||||
|
TOTAL CURRENT LIABILITIES
|
76,944 | 123,753 | ||||||
|
DEFERRED TAX LIABILITIES
|
100,297 | 99,432 | ||||||
|
LONG-TERM DEBT
|
959,125 | 901,125 | ||||||
|
DEFERRED RENT
|
11,856 | 11,535 | ||||||
|
CAPITAL LEASES, NET OF CURRENT PORTION
|
1,560 | 1,677 | ||||||
|
OTHER LONG-TERM LIABILITIES
|
2,612 | 2,170 | ||||||
|
COMMITMENTS AND CONTINGENCIES
|
||||||||
|
STOCKHOLDER'S EQUITY:
|
||||||||
|
Common stock: $.01 par value; 500,000 issued and 497,981 outstanding at April 2, 2011 and 500,000 issued and 498,042 outstanding at January 1, 2011
|
418,187 | 418,187 | ||||||
|
Additional paid-in capital
|
8,705 | 3,421 | ||||||
|
Treasury stock: at cost, 2,019 shares at April 2, 2011 and 1,958 shares at January 1, 2011
|
(1,809 | ) | (1,723 | ) | ||||
|
Accumulated deficit
|
(353,740 | ) | (346,516 | ) | ||||
|
Accumulated other comprehensive loss
|
(2,180 | ) | (3,361 | ) | ||||
|
Total stockholder's equity
|
69,163 | 70,008 | ||||||
|
TOTAL LIABILITIES AND STOCKHOLDER'S EQUITY
|
$ | 1,221,557 | $ | 1,209,700 | ||||
See notes to condensed consolidated financial statements
YANKEE HOLDING CORP. AND SUBSIDIARIES
CONDENSED CONSOLIDATED STATEMENTS OF OPERATIONS
(in thousands)
(Unaudited)
|
Thirteen
Weeks Ended
April 2, 2011
|
Thirteen
Weeks Ended
April 3, 2010
|
|||||||
|
Sales
|
$ | 144,114 | $ | 140,975 | ||||
|
Cost of sales
|
64,863 | 62,312 | ||||||
|
Gross profit
|
79,251 | 78,663 | ||||||
|
Selling expenses
|
53,059 | 49,568 | ||||||
|
General and administrative expenses
|
18,594 | 16,679 | ||||||
|
Restructuring charges
|
- | 800 | ||||||
|
Operating income
|
7,598 | 11,616 | ||||||
|
Interest expense
|
17,679 | 19,807 | ||||||
|
Other (income) expense, net
|
(1,875 | ) | 4,732 | |||||
|
Loss from continuing operations before provision for income taxes
|
(8,206 | ) | (12,923 | ) | ||||
|
Benefit from income taxes
|
(2,912 | ) | (4,676 | ) | ||||
|
Loss from continuing operations
|
(5,294 | ) | (8,247 | ) | ||||
|
Loss from discontinued operations, net of income taxes
|
(54 | ) | (255 | ) | ||||
|
Net loss
|
$ | (5,348 | ) | $ | (8,502 | ) | ||
See notes to condensed consolidated financial statements
YANKEE HOLDING CORP. AND SUBSIDIARIES
CONDENSED CONSOLIDATED STATEMENTS OF CHANGES IN STOCKHOLDER'S EQUITY
(in thousands, except treasury shares)
(Unaudited)
|
Common Stock
|
Additional
|
Treasury Stock
|
Accumulated
Other
|
|||||||||||||||||||||||||||||||||
|
Shares
|
Amount |
Paid in
Capital
|
Shares
|
Amount
|
Accumulated
Deficit
|
Comprehensive
Loss
|
Comprehensive Loss |
Total
|
||||||||||||||||||||||||||||
|
BALANCE, JANUARY 2, 2010
|
500 | $ | 418,187 | $ | 2,419 | 1,120 | $ | (790 | ) | $ | (388,425 | ) | $ | (8,148 | ) | $ | 23,243 | |||||||||||||||||||
|
Issuance of common stock
|
— | — | 25 | — | — | — | — | 25 | ||||||||||||||||||||||||||||
|
Repurchase of common stock
|
— | — | — | 570 | (630 | ) | — | — | (630 | ) | ||||||||||||||||||||||||||
|
Equity-based compensation expense
|
— | — | 329 | — | — | — | — | 329 | ||||||||||||||||||||||||||||
|
Comprehensive loss:
|
||||||||||||||||||||||||||||||||||||
|
Net loss
|
— | — | — | — | — | (8,502 | ) | — | $ | (8,502 | ) | (8,502 | ) | |||||||||||||||||||||||
|
Foreign currency translation
|
— | — | — | — | — | — | (1,078 | ) | (1,078 | ) | (1,078 | ) | ||||||||||||||||||||||||
|
Unrealized loss on interest rate swaps, net of tax
|
— | — | — | — | — | — | 3,113 | 3,113 | 3,113 | |||||||||||||||||||||||||||
|
Comprehensive loss
|
$ | (6,467 | ) | |||||||||||||||||||||||||||||||||
|
BALANCE, APRIL 3, 2010
|
500 | $ | 418,187 | $ | 2,773 | 1,690 | $ | (1,420 | ) | $ | (396,927 | ) | $ | (6,113 | ) | $ | 16,500 | |||||||||||||||||||
|
BALANCE, JANUARY 1, 2011
|
500 | $ | 418,187 | $ | 3,421 | 1,958 | $ | (1,723 | ) | $ | (346,516 | ) | $ | (3,361 | ) | $ | 70,008 | |||||||||||||||||||
|
Issuance of common stock
|
— | — | 3 | — | — | — | — | — | 3 | |||||||||||||||||||||||||||
|
Repurchase of common stock
|
— | — | — | 61 | (86 | ) | — | — | — | (86 | ) | |||||||||||||||||||||||||
|
Equity-based compensation expense
|
— | — | 194 | — | — | — | — | — | 194 | |||||||||||||||||||||||||||
|
Contributions by YCC Holdings LLC
|
— | — | 5,087 | — | — | — | — | — | 5,087 | |||||||||||||||||||||||||||
|
Dividend to YCC Holdings LLC
|
— | — | — | — | — | (1,876 | ) | — | — | (1,876 | ) | |||||||||||||||||||||||||
|
Comprehensive income:
|
||||||||||||||||||||||||||||||||||||
|
Net income
|
— | — | — | — | — | (5,348 | ) | — | $ | (5,348 | ) | (5,348 | ) | |||||||||||||||||||||||
|
Foreign currency translation
|
— | — | — | — | — | — | 469 | 469 | 469 | |||||||||||||||||||||||||||
|
Unrealized gain on interest rate swaps, net of tax
|
— | — | — | — | — | — | 712 | 712 | 712 | |||||||||||||||||||||||||||
|
Comprehensive income
|
$ | (4,167 | ) | |||||||||||||||||||||||||||||||||
|
BALANCE, APRIL 2, 2011
|
500 | $ | 418,187 | $ | 8,705 | 2,019 | $ | (1,809 | ) | $ | (353,740 | ) | $ | (2,180 | ) | $ | 69,163 | |||||||||||||||||||
See notes to condensed consolidated financial statements
YANKEE HOLDING CORP. AND SUBSIDIARIES
CONDENSED CONSOLIDATED STATEMENTS OF CASH FLOWS
(in thousands)
(Unaudited)
|
Thirteen
Weeks Ended
April 2, 2011
|
Thirteen
Weeks Ended
April 3, 2010
|
|||||||
|
CASH FLOWS USED IN OPERATING ACTIVITIES:
|
||||||||
|
Net loss
|
$ | (5,348 | ) | $ | (8,502 | ) | ||
|
Adjustments to reconcile net loss to net cash used in operating activities:
|
||||||||
|
Realized (gain) loss on derivative contracts
|
(1,408 | ) | 4,802 | |||||
|
Depreciation and amortization
|
10,239 | 10,704 | ||||||
|
Unrealized gain on marketable securities
|
(57 | ) | (54 | ) | ||||
|
Equity-based compensation expense
|
194 | 329 | ||||||
|
Deferred taxes
|
1,245 | (865 | ) | |||||
|
Loss (gain) on disposal and impairment of property and equipment
|
69 | (5 | ) | |||||
|
Changes in assets and liabilities:
|
||||||||
|
Accounts receivable
|
(1,200 | ) | 3,065 | |||||
|
Inventory
|
(17,248 | ) | (9,293 | ) | ||||
|
Prepaid expenses and other assets
|
(1,653 | ) | (2,712 | ) | ||||
|
Accounts payable
|
(1,233 | ) | 4,663 | |||||
|
Income taxes
|
(23,374 | ) | (4,726 | ) | ||||
|
Accrued expenses and other liabilities
|
(23,694 | ) | (25,017 | ) | ||||
|
NET CASH USED IN OPERATING ACTIVITIES
|
(63,468 | ) | (27,611 | ) | ||||
|
CASH FLOWS USED IN INVESTING ACTIVITIES:
|
||||||||
|
Purchases of property and equipment
|
(4,124 | ) | (2,932 | ) | ||||
|
Proceeds from sale of property and equipment
|
- | 192 | ||||||
|
NET CASH USED IN INVESTING ACTIVITIES
|
(4,124 | ) | (2,740 | ) | ||||
|
CASH FLOWS PROVIDED BY FINANCING ACTIVITIES:
|
||||||||
|
Borrowings under Senior Secured Credit Facility
|
58,000 | 37,000 | ||||||
|
Repayments under Senior Secured Credit Facility
|
- | (11,000 | ) | |||||
|
Contributions by YCC Holdings LLC
|
3,000 | - | ||||||
|
Dividend to YCC Holdings LLC
|
(1,876 | ) | - | |||||
|
Proceeds from issuance of common stock
|
3 | 25 | ||||||
|
Repurchase of common stock
|
(86 | ) | (630 | ) | ||||
|
Principal payments on capital lease obligations
|
(165 | ) | - | |||||
|
NET CASH PROVIDED BY FINANCING ACTIVITIES
|
58,876 | 25,395 | ||||||
|
EFFECT OF EXCHANGE RATE CHANGES ON CASH
|
46 | (92 | ) | |||||
|
NET DECREASE IN CASH
|
(8,670 | ) | (5,048 | ) | ||||
|
CASH, BEGINNING OF PERIOD
|
12,713 | 9,095 | ||||||
|
CASH, END OF PERIOD
|
$ | 4,043 | $ | 4,047 | ||||
|
SUPPLEMENTAL DISCLOSURES OF CASH FLOW INFORMATION:
|
||||||||
|
Cash paid during the period for:
|
||||||||
|
Interest
|
$ | 28,168 | $ | 30,350 | ||||
|
Income taxes
|
$ | 19,188 | $ | 766 | ||||
|
Net change in accrued purchases of property and equipment
|
$ | (531 | ) | $ | 1,586 | |||
|
Capital lease obligations related to equipment purchase
|
$ | 22 | $ | 1,974 | ||||
|
Noncash Financing Activities:
|
||||||||
|
Noncash contribution by YCC Holdings LLC
|
$ | 2,087 | $ | - | ||||
See notes to condensed consolidated financial statements
YANKEE HOLDING CORP. AND SUBSIDIARIES
NOTES TO CONDENSED CONSOLIDATED FINANCIAL STATEMENTS
(Unaudited)
1. BASIS OF PRESENTATION AND ORGANIZATION
Basis of Presentation
The unaudited interim condensed consolidated financial statements of Yankee Holding Corp. (“Yankee Holdings”) and its subsidiaries (collectively with Yankee Holdings, the “Company”) have been prepared in accordance with accounting principles generally accepted in the United States of America (“generally accepted accounting principles” or “GAAP”). The financial information included herein is unaudited; however, in the opinion of management such information reflects all adjustments (consisting of normal recurring accruals) necessary for a fair presentation of financial position, results of operations, and cash flows as of the date and for the periods indicated. All intercompany transactions and balances have been eliminated. The results of operations for the interim period are not necessarily indicative of the results to be expected for the full fiscal year.
Certain information and disclosures normally included in the notes to consolidated financial statements have been condensed or omitted as permitted by the rules and regulations of the Securities and Exchange Commission (the “SEC”). The accompanying unaudited condensed financial statements of the Company should be read in conjunction with the audited consolidated financial statements of the Company for the year ended January 1, 2011 included in the Company’s Annual Report on Form 10-K.
Organization and current events
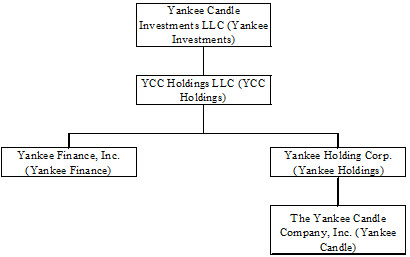
Yankee Holdings is a wholly owned subsidiary of YCC Holdings LLC (“YCC Holdings”). In 2011, Yankee Candle Investments LLC (“Yankee Investments”) and Yankee Finance, Inc. (“Yankee Finance”) were formed for the purpose of issuing senior notes. The members of YCC Holdings LLC include certain funds affiliated with Madison Dearborn Partners, LLC (“Madison Dearborn”), as well as certain management and directors of the Company with equity interests. These members exchanged their interests in YCC Holdings for identical interests in Yankee Investments. As of April 2, 2011, Yankee Investments is the parent of YCC Holdings who is the parent of Yankee Finance and Yankee Holdings. YCC Holdings and Yankee Holdings are holding companies with no direct operations. Their principal assets are the indirect equity interests in The Yankee Candle Company, Inc. (“Yankee Candle”), and all of their operations are conducted through Yankee Candle, the wholly owned operating subsidiary of the Company. See the entity chart below:
In February 2011, YCC Holdings and Yankee Finance co-issued $315.0 million of 10.25%/11.00% Senior Notes due 2016 (the “Senior PIK Notes”) pursuant to an indenture at a discount of $6.3 million for net proceeds of $308.7 million. Issuance costs related to the Senior PIK Notes were $9.7 million, of which $7.8 million were paid for by YCC Holdings and $1.9 million were paid for by the Company. The costs paid for by the Company have been reflected as a dividend to YCC Holdings in the accompanying condensed consolidated statement of stockholder’s equity. The Senior PIK Notes are not registered; however, the issuers are in the process of registering the notes.
The proceeds from the Senior PIK Notes were used to pay transaction costs (exclusive of the amounts paid by the Company) and make a payment of $300.8 million to Yankee Investments who in turn made payments of $297.8 million to holders of Yankee Investments’ Class A common units and payments of $3.0 million to holders of Yankee Investments’ Class B and Class C common units. The payments to the Class A common unit holders represent a partial return of their original investment and are reflected as an equity transaction by Yankee Investments. The payments to the Class B and Class C common unit holders who are members of management and directors of the Company did not affect the liquidation amounts for such units and accordingly are reflected as general and administrative expense in the accompanying condensed consolidated statement of operations and as a contribution by YCC Holdings in the accompanying condensed consolidated statement of stockholder’s equity for the thirteen weeks ended April 2, 2011.
Cash interest on the Senior PIK Notes accrues at a rate of 10.25% per annum, and PIK Interest (defined below) accrues at the cash interest rate plus 0.75%. YCC Holdings is required to pay interest on the Senior PIK Notes (1) for the first interest payment date, entirely in cash and (2) for all subsequent interest payment dates, entirely in cash interest, unless the conditions described in the indenture are satisfied with respect to the related interest period, in which case, YCC Holdings may pay interest on the Senior PIK Notes for such interest period by increasing the principal amount of the Senior PIK Notes or by issuing new PIK Notes for up to the entire amount of the interest payment (in each case, “PIK Interest”) to the extent described in the indenture.
YCC Holdings is dependent upon dividends from Yankee Holdings to generate the funds necessary to meet its outstanding debt service obligations. Yankee Holdings does not guarantee the Senior PIK Notes nor is Yankee Holdings obligated to pay dividends to YCC Holdings. Yankee Holdings is allowed to make dividends to YCC Holdings based upon the lower of (a) available excess cash flow based on provisions determined in Yankee Candle’s $650.0 million senior secured term loan facility (the “Term Facility”) agreement or (b) amounts available for restricted payments based on provisions included in Yankee Candle’s senior secured notes indenture agreement.
Available excess cash flow for Yankee Candle’s Term Facility is defined as the aggregate cumulative amount of excess cash flow for all fiscal years subsequent to issuance (February 2007) that is not required to prepay the borrowings. On an annual basis, the Company is required to prepay the borrowings by 50% of excess cash flow, reduced to 25% of excess cash flow if the total debt ratio is not greater than 5.0 to 1.0. The Company is not required to make a payment if the total debt ratio is less than or equal to 4.0 to 1.0. Excess cash flow is defined in Yankee Candle’s senior secured credit facility (the “Credit Facility”) agreement as net income plus all non cash charges including depreciation, amortization, deferred tax expense, losses on disposition of property and decreases in working capital, decreased by non-cash gains including gains on disposition of property, cash paid for capital expenditures, regularly scheduled and voluntary prepayments of borrowings and increases in working capital.
Restricted payments under Yankee Candle’s senior secured notes are allowed to the extent that total restricted payments subsequent to the issuance date (February 2007) are less than 50% of net income from December 31, 2006 through the most recent fiscal quarter. Net income is defined as net income excluding extraordinary, unusual or non recurring gains, losses or expenses, cumulative effect of a change in accounting principle, asset dispositions, income from equity method subsidiaries, dividends from restricted subsidiaries, non-cash compensation charges, gains or losses of early extinguishment of debt, non-cash write-offs of assets or liabilities resulting from the transaction, gains or losses from hedging activities and any net after-tax income or loss from discontinued operations.
As of January 1, 2011, the amount available for dividends was $138.4 million. During the thirteen weeks ended April 2, 2011 Yankee Holdings made a dividend of $1.9 million to YCC Holdings, which decreases the amount available for future dividends.
As a result of YCC Holdings’ issuance of the Senior PIK Notes, Yankee Holdings’ income tax receivable reflects the tax benefit of the related interest expense. As such, in the first quarter of fiscal 2011 Yankee Holdings received a cashless contribution of $2.1 million from YCC Holdings which increased Yankee Holdings’ income tax receivable. The $2.1 million contribution is shown as a contribution by YCC Holdings in the condensed consolidated statements of changes in stockholder’s equity and in the non-cash financing section of the condensed consolidated statements of cash flows.
2. INVENTORY
The Company values its inventory on the first–in first–out (“FIFO”) basis. The components of inventory were as follows (in thousands):
|
April 2,
2011
|
January 1,
2011
|
|||||||
|
Finished goods
|
$ | 73,889 | $ | 58,153 | ||||
|
Work-in-process
|
537 | 362 | ||||||
|
Raw materials and packaging
|
10,795 | 8,872 | ||||||
|
Total inventory
|
$ | 85,221 | $ | 67,387 | ||||
3. GOODWILL AND INTANGIBLE ASSETS
The Company has determined that its tradenames have an indefinite useful life and, therefore, are not being amortized. Under the Intangibles Topic of the ASC, goodwill and indefinite lived intangible assets are not amortized but are subject to an annual impairment test. There were no changes in the carrying amount of goodwill during the thirteen weeks ended April 2, 2011 and April 3, 2010.
Intangible Assets
The carrying amount and accumulated amortization of intangible assets consisted of the following (in thousands):
|
Weighted Average Useful Life (in years)
|
Gross Carrying Amount
|
Accumulated Amortization
|
Net Book Value
|
|||||||||||||
|
April 2, 2011
|
||||||||||||||||
|
Indefinite life:
|
||||||||||||||||
|
Tradenames
|
N/A | $ | 267,755 | $ | - | $ | 267,755 | |||||||||
|
Finite-lived intangible assets:
|
||||||||||||||||
|
Customer lists
|
5 | 63,669 | (53,267 | ) | 10,402 | |||||||||||
|
Favorable lease agreements
|
5 | 2,330 | (1,807 | ) | 523 | |||||||||||
|
Other
|
3 | 36 | (34 | ) | 2 | |||||||||||
|
Total finite-lived intangible assets
|
66,035 | (55,108 | ) | 10,927 | ||||||||||||
|
Total intangible assets
|
$ | 333,790 | $ | (55,108 | ) | $ | 278,682 | |||||||||
|
January 1, 2011
|
||||||||||||||||
|
Indefinite life:
|
||||||||||||||||
|
Tradenames
|
N/A | $ | 267,755 | $ | - | $ | 267,755 | |||||||||
|
Finite-lived intangible assets:
|
||||||||||||||||
|
Customer lists
|
5 | 63,650 | (50,234 | ) | 13,416 | |||||||||||
|
Favorable lease agreements
|
5 | 2,330 | (1,755 | ) | 575 | |||||||||||
|
Other
|
3 | 36 | (33 | ) | 3 | |||||||||||
|
Total finite-lived intangible assets
|
66,016 | (52,022 | ) | 13,994 | ||||||||||||
|
Total intangible assets
|
$ | 333,771 | $ | (52,022 | ) | $ | 281,749 | |||||||||
Total amortization expense from finite–lived intangible assets was $3.1 million and $3.2 million for the thirteen weeks ended April 2, 2011 and April 3, 2010, respectively. These intangible assets are amortized on a straight line basis. Favorable lease agreements are amortized over the remaining lease term of each respective lease.
4. LONG-TERM DEBT
Long-term debt consisted of the following at April 2, 2011 and January 1, 2011 (in thousands):
|
April 2,
2011
|
January 1, 2011
|
|||||||
|
Senior secured revolving credit facility
|
$ | 58,000 | $ | - | ||||
|
Senior secured term loan facility
|
388,125 | 388,125 | ||||||
|
Senior notes due 2015
|
325,000 | 325,000 | ||||||
|
Senior subordinated notes due 2017
|
188,000 | 188,000 | ||||||
|
Total
|
$ | 959,125 | $ | 901,125 | ||||
Senior Secured Credit Facility
Yankee Candle’s Credit Facility consists of a $650.0 million Term Facility maturing on February 6, 2014 and a $125.0 million senior secured revolving credit facility (“Revolving Facility”), which expires on February 6, 2013. Amounts repaid under the Term Facility can not be reborrowed.
All borrowings under Yankee Candle’s Credit Facility bear interest at a rate per annum equal to an applicable margin, plus, at Yankee Candle’s option, (i) the higher of (a) the prime rate (as set forth on the British Banking Association Telerate Page 5) and (b) the federal funds effective rate, plus one-half percent (0.50%) per annum or (ii) the Eurodollar rate, and resets periodically. In addition to paying interest on outstanding principal under the senior secured credit facility, Yankee Candle is required to pay a commitment fee to the lenders in respect of unutilized loan commitments at a rate of 0.50% per annum. As of April 2, 2011, the weighted average combined interest rate on the Term Facility and the Revolving Facility was 2.21%.
Yankee Candle’s Credit Facility contains a financial covenant which requires that Yankee Candle maintain at the end of each fiscal quarter, commencing with the quarter ended January 1, 2011 through the quarter ending October 1, 2011, a consolidated total secured debt (net of cash and cash equivalents not to exceed $30.0 million) to consolidated Adjusted EBITDA ratio of no more than 3.25 to 1.00. The consolidated total secured debt to consolidated Adjusted EBITDA ratio will change to no more than 2.75 to 1.00 for the fourth quarter ending December 31, 2011. As of April 2, 2011, Yankee Candle’s actual secured leverage ratio was 2.31 to 1.00, as calculated in accordance with the Credit Facility. As of April 2, 2011, total secured debt was $444.3 million (net of $4.0 million of cash). Under the Credit Facility, Consolidated Adjusted EBITDA is defined as net income plus, interest, taxes, depreciation and amortization, further adjusted to add back extraordinary, unusual or non-recurring losses, non-cash stock option expense, fees and expenses related to the completion of the merger (the “Merger”), fees and expenses under the Management Agreement with our equity sponsor, restructuring charges or reserves, as well as other non-cash charges, expenses or losses, and further adjusted to subtract extraordinary, unusual or non-recurring gains, other non-cash income or gains, and certain cash contributions to the Company’s common equity.
As of April 2, 2011, Yankee Candle had outstanding letters of credit of $1.7 million and $58.0 outstanding under the Revolving Facility, leaving $65.3 million in availability under the Revolving Facility.
On April 21, 2011, Yankee Candle entered into a Joinder Agreement to the Revolving Facility which provided a total of $15.0 million in new revolving loan commitments increasing Yankee Candle’s total revolving loan capacity under the Revolving Facility from $125.0 million to $140.0 million.
5. STOCKHOLDER’S EQUITY AND EQUITY-BASED COMPENSATION
As discussed in Note 1, on February 9, 2011, the holders of interests in YCC Holdings exchanged their interest for identical interests in Yankee Investments. A summary of nonvested units for YCC Holdings and Yankee Investments as applicable as of April 2, 2011 and April 3, 2010, and the activity for the thirteen weeks ended April 2, 2011 and April 3, 2010 is presented below:
|
Class A Common Units
|
Weighted Average Calculated Value
|
Class B Common Units
|
Weighted Average Calculated Value
|
Class C Common Units
|
Weighted Average Calculated Value
|
|||||||||||||||||||
|
Nonvested stock at January 1, 2011
|
- | - | 73,293 | $ | 9.39 | 62,747 | $ | 23.16 | ||||||||||||||||
|
Forfeited
|
- | - | (20,858 | ) | $ | 9.39 | - | - | ||||||||||||||||
|
Vested
|
- | - | (11,831 | ) | $ | 9.39 | (4,232 | ) | $ | 19.94 | ||||||||||||||
|
Nonvested stock at April 2, 2011
|
- | - | 40,604 | $ | 9.39 | 58,515 | $ | 23.39 | ||||||||||||||||
|
Class A Common Units
|
Weighted Average Calculated Value
|
Class B Common Units
|
Weighted Average Calculated Value
|
Class C Common Units
|
Weighted Average Calculated Value
|
|||||||||||||||||||
|
Nonvested stock at January 2, 2010
|
- | - | 152,136 | $ | 9.39 | 75,037 | $ | 11.56 | ||||||||||||||||
|
Granted
|
198 | - | - | — | 39,000 | $ | 34.40 | |||||||||||||||||
|
Forfeited
|
- | - | (9,519 | ) | $ | 9.39 | (28,651 | ) | $ | 12.30 | ||||||||||||||
|
Vested
|
(198 | ) | - | (17,295 | ) | $ | 9.39 | (9,109 | ) | $ | 22.00 | |||||||||||||
|
Nonvested stock at April 3, 2010
|
- | - | 125,322 | $ | 9.39 | 76,277 | $ | 21.71 | ||||||||||||||||
During the thirteen weeks ended April 2, 2011, 565 vested Class B common units and 900 vested Class C common units were repurchased, for $0.1 million. During the thirteen weeks ended April 3, 2010, 1,126 vested Class A common units, 12,130 vested Class B common units and 13,123 vested Class C common units were repurchased, for $0.6 million. Yankee Investments anticipates that all of its nonvested common units will vest.
The total estimated fair value of equity awards vested during thirteen weeks ended April 2, 2011 and April 3, 2010 was $0.2 million and $0.4 million, respectively. Equity-based compensation expense for the thirteen weeks ended April 2, 2011 and April 3, 2010 was $3.3 million and $0.3 million, respectively. Included in the $3.3 million of equity-based compensation for the thirteen weeks ended April 2, 2011 was the $3.0 million payment to the holders of Class B common units and Class C common units discussed in Note 1.
As of April 2, 2011, there was approximately $1.8 million of total unrecognized compensation cost related to Class B and Class C common unit equity awards and there was no unrecognized expense related to the Class A common unit equity awards. This cost is expected to be recognized over the remaining vesting period, of approximately 5 years (April 2011 to September 2015).
Presented below is a summary of assumptions for the indicated periods. There were no Class A grants, Class B grants or Class C grants for the thirteen weeks ended April 2, 2011. There were 370 Class A grants, 12,400 Class C grants and no Class B grants for the thirteen weeks ended April 3, 2010.
|
Assumptions
|
Thirteen
Weeks Ended
April 3, 2010
|
|||
|
Weighted average calculated value of awards granted
|
$ | 34.40 | ||
|
Weighted average volatility
|
39.7 | % | ||
|
Weighted average expected term (in years)
|
5.0 | |||
|
Dividend yield
|
— | |||
|
Weighted average risk-free interest rate
|
2.7 | % | ||
With respect to the Class B and Class C common units, since YCC Holdings and Yankee Investments are not publicly traded, the estimate of expected volatility is based on the median historical volatility of a group of eight comparable public companies. The historical volatilities of the comparable companies were measured over a 5-year historical period. The expected term of the Class B and Class C common units granted represents the period of time that the units are expected to be outstanding and is assumed to be approximately five years based on management’s estimate of the time to a liquidity event. Yankee Investments does not expect to pay dividends, and accordingly, the dividend yield is zero. The risk free interest rate reflects a five-year period commensurate with the expected time to a liquidity event and was based on the U.S. Treasury yield curve.
6. DERIVATIVE FINANCIAL INSTRUMENTS
The Company follows the guidance under the Derivatives and Hedging Topic of the ASC, which establishes accounting and reporting standards for derivative instruments. The guidance requires an entity to recognize all derivatives as either assets or liabilities in the statement of financial position and to measure those instruments at fair value. Additionally, the fair value adjustments will affect stockholder’s equity as accumulated other comprehensive income (loss) (“OCI”) or net income (loss) depending on whether the derivative instrument qualifies as a hedge for accounting purposes and, if so, the nature of the hedging activity.
Interest Rate Swaps
The Company uses interest rate swaps to eliminate the variability of a portion of cash flows associated with the forecasted interest payments on Yankee Candle’s Term Facility. This is achieved through converting a portion of the floating rate Term Facility to a fixed rate by entering into pay-fixed interest rate swaps. During the second quarter of 2009 the Company changed the interest rate election on Yankee Candle’s Term Facility from the three-month LIBOR rate to the one-month LIBOR rate. As a result, the Company's existing interest rate swaps were de-designated as cash flow hedges and the Company no longer accounts for these instruments using hedge accounting. Accordingly, changes in fair value are now recognized in the condensed consolidated statements of operations as a component of other income (expense). The unrealized loss of $21.7 million which was included in OCI on the date the Company changed its interest rate election is being amortized to other expense over the remaining term of the respective interest rate swap agreements. The unrealized loss was fully amortized as of April 2, 2011.
Simultaneous with the de-designations, Yankee Candle entered into new interest rate swap agreements to further reduce the variability of cash flows associated with the forecasted interest payments on Yankee Candle’s Term Facility. These swaps are not designated as cash flow hedges and, are measured at fair value with changes in fair value recognized in the condensed consolidated statements of operations as a component of other income (expense). One of the Company's original interest rate swaps terminated in March 2010 and the remaining original swap agreement terminated on March 31, 2011.
During the second and third quarters of 2009, Yankee Candle entered into forward starting, amortizing, interest rate swaps in the aggregate notional amount of $320.7 million with a blended fixed rate of 3.49% to eliminate the variability in future interest payments on Yankee Candle’s Term Facility by having the Company pay fixed-rate amounts in exchange for receipt of floating-rate interest payments. The effective date of the forward starting swaps was March 31, 2011 after the original swaps terminated. These forward starting swaps are not designated as cash flow hedges and, are measured at fair value with changes in fair value recognized in the condensed consolidated statements of operations as a component of other income (expense). The forward starting swap agreements terminate in March 2013.
The fair values of the Company’s derivative instruments as of April 2, 2011 and January 1, 2011, were as follows (in thousands):
|
Fair Values of Derivative Instruments
|
||||||||
|
Asset Derivatives
|
||||||||
|
April 2,
|
January 1,
|
|||||||
|
Balance Sheet Location
|
2011
|
2011
|
||||||
|
Derivatives not designated as hedging instruments
|
||||||||
|
Interest rate swap agreements
|
Prepaid expenses and other current assets
|
$
|
-
|
$
|
1,030
|
|||
|
Total Derivative Assets
|
$
|
-
|
$
|
1,030
|
||||
|
Fair Value of Derivative Instruments
|
|||||||||
|
Liability Derivatives
|
|||||||||
|
Balance Sheet Location
|
April 2,
2011
|
January 1,
2011
|
|||||||
|
Derivatives not designated as hedging instruments
|
|||||||||
|
Interest rate swap agreements
|
Other accrued liabilities
|
$ | 14,404 | $ | 18,011 | ||||
|
Total Derivative Liabilities
|
$ | 14,404 | $ | 18,011 | |||||
The effect of derivative instruments on the condensed consolidated statement of operations for the thirteen weeks ended April 2, 2011 and April 3, 2010, was as follows (in thousands):
|
Amount of Realized Gain Recognized on Derivatives
|
Amount of Realized Loss Recognized on Derivatives
|
||||||||
|
Location of Realized Loss Recognized on Derivatives
|
Thirteen Weeks Ended April 2, 2011
|
Thirteen Weeks Ended April 3, 2010
|
|||||||
|
Derivatives not designated as hedging instruments
|
|||||||||
|
Interest rate swap agreements
|
Other expense
|
$ | (1,407 | ) | $ | 4,802 | |||
|
Total
|
$ | (1,407 | ) | $ | 4,802 | ||||
|
Amount of Loss Reclassified from Accumulated OCI Into Income (Effective Portion)
|
Amount of Loss Reclassified from Accumulated OCI Into Income (Effective Portion)
|
||||||||
|
Location of Loss Reclassified from Accumulated OCI into Income (Effective Portion)
|
Thirteen Weeks Ended April 2, 2011
|
Thirteen Weeks Ended April 3, 2010
|
|||||||
|
Cash Flow Hedges
|
|||||||||
|
Interest rate swap agreements
|
Other expense
|
$ | 1,169 | $ | 5,114 | ||||
|
Total
|
$ | 1,169 | $ | 5,114 | |||||
7. FAIR VALUE MEASUREMENTS
The Company follows the guidance prescribed by the Fair Value Measurements and Disclosures Topic of the ASC. The Fair Value Measurements and Disclosures Topic defines fair value and provides a consistent framework for measuring fair value under GAAP, including financial statement disclosure requirements. As specified under this Topic, valuation techniques are based on observable and unobservable inputs. Observable inputs reflect readily obtainable data from independent sources, while unobservable inputs reflect market assumptions. The Fair Value Measurements and Disclosures Topic classifies these inputs into the following hierarchy:
Level 1 Inputs– Quoted prices for identical instruments in active markets.
Level 2 Inputs– Quoted prices for similar instruments in active markets; quoted prices for identical or similar instruments in markets that are not active; and model-derived valuations whose inputs are observable or whose significant value drivers are observable.
Level 3 Inputs– Instruments with primarily unobservable value drivers.
The following table represents the fair value hierarchy for those financial assets and liabilities measured at fair value on a recurring basis as of April 2, 2011 and January 1, 2011:
|
Fair Value Measurements on a Recurring Basis
|
||||||||||||||||
|
as of April 2, 2011
|
||||||||||||||||
|
Level 1
|
Level 2
|
Level 3
|
Total
|
|||||||||||||
|
Assets
|
||||||||||||||||
|
Marketable securities
|
$ | 1,597 | $ | - | $ | - | $ | 1,597 | ||||||||
|
Total Assets
|
$ | 1,597 | $ | - | $ | - | $ | 1,597 | ||||||||
|
Liabilities
|
||||||||||||||||
|
Interest rate swap agreements
|
$ | - | $ | 14,404 | $ | 14,404 | ||||||||||
|
Total Liabilities
|
$ | - | $ | 14,404 | $ | - | $ | 14,404 | ||||||||
|
Fair Value Measurements on a Recurring Basis
|
||||||||||||||||
|
as of January 1, 2011
|
||||||||||||||||
|
Level 1
|
Level 2
|
Level 3
|
Total
|
|||||||||||||
|
Assets
|
||||||||||||||||
|
Marketable securities
|
$ | 1,182 | $ | - | $ | - | $ | 1,182 | ||||||||
|
Interest rate swap agreements
|
- | 1,030 | - | 1,030 | ||||||||||||
|
Total Assets
|
$ | 1,182 | $ | 1,030 | $ | - | $ | 2,212 | ||||||||
|
Liabilities
|
||||||||||||||||
|
Interest rate swap agreements
|
$ | - | $ | 18,011 | $ | - | $ | 18,011 | ||||||||
|
Total Liabilities
|
$ | - | $ | 18,011 | $ | - | $ | 18,011 | ||||||||
The Company holds marketable securities in its deferred compensation plan. The marketable securities consist of investments in mutual funds and are recorded at fair value based on third party quotes. The Company uses an income approach to value the asset and liability for its interest rate swaps using a discounted cash flow model that takes into account the present value of future cash flows under the terms of the contract using current market information as of the reporting date such as the one month LIBOR curve and the creditworthiness of the Company and its counterparties.
Financial Instruments Not Measured at Fair Value
The Company’s long-term debt is recorded at historical amounts. The Company estimates the fair value of its long-term debt based on current quoted market prices. The following table represents the carrying value and fair value of the Company’s long-term debt as of April 2, 2011 and April 3, 2010.
|
April 2, 2011
|
||||||||
|
Carrying Value
|
Fair Value
|
|||||||
|
Senior secured term loan facility
|
$ | 388,125 | $ | 385,602 | ||||
|
Senior notes due 2015
|
325,000 | 335,969 | ||||||
|
Senior subordinated notes due 2017
|
188,000 | 199,280 | ||||||
|
January 1, 2011
|
||||||||
|
Carrying Value
|
Fair Value
|
|||||||
|
Senior secured term loan facility
|
$ | 388,125 | $ | 384,244 | ||||
|
Senior notes due 2015
|
325,000 | 338,000 | ||||||
|
Senior subordinated notes due 2017
|
188,000 | 195,990 | ||||||
It is impracticable for the Company to estimate the fair value of its Revolving Facility.
8. SEGMENTS OF ENTERPRISE AND RELATED INFORMATION
The Company has segmented its operations in a manner that reflects how its chief operating decision–maker (the “CEO”) currently reviews the results of the Company and its subsidiaries’ businesses. In the prior fiscal year the Company had two reportable segments, retail and wholesale. Wholesale had been an aggregation of the wholesale and international reporting units. Because of the increased importance of the international segment to the Company’s operations, as evidenced by higher sales volumes and the appointment of a full time international president, the Company is now disaggregating the international operations from the domestic wholesale operations. The Company has restated the prior year information to conform to the current period presentation.
The CEO evaluates its retail, wholesale, and international operations based on an “operating earnings” measure. Such measure gives recognition to specifically identifiable operating costs such as cost of sales and selling expenses. Costs and income not specifically identifiable are included within the unallocated/corporate/other column and include administrative charges, interest expense, fair value changes of derivative contracts and other costs not allocated to specific operating segments and are accordingly reflected in the unallocated/corporate/other reconciliation to the total consolidated results. The Company does not account for or report assets, capital expenditures or depreciation and amortization by segment to the CEO.
The following is the relevant data for the thirteen weeks ended April 2, 2011 and April 3, 2010 (in thousands):
|
Thirteen Weeks Ended April 2, 2011
|
Retail
|
Wholesale
|
International
|
Unallocated/
Corporate/Other
|
Balance per
Condensed
Consolidated
Statements of
Operations
|
|||||||||||||||
|
Sales
|
$ | 74,777 | $ | 47,449 | $ | 21,888 | $ | - | $ | 144,114 | ||||||||||
|
Gross profit
|
47,351 | 22,688 | 9,318 | (106 | ) | 79,251 | ||||||||||||||
|
Selling expenses
|
41,143 | 3,208 | 5,233 | 3,475 | 53,059 | |||||||||||||||
|
Operating income
|
6,208 | 19,480 | 4,085 | (22,175 | ) | 7,598 | ||||||||||||||
|
Interest and other expense, net
|
- | - | - | (15,804 | ) | (15,804 | ) | |||||||||||||
|
Income from continuing operations before provision for income taxes
|
$ | (8,206 | ) | |||||||||||||||||
|
Thirteen Weeks Ended April 3, 2010
|
Retail
|
Wholesale
|
International
|
Unallocated/
Corporate/Other
|
Balance per
Condensed
Consolidated
Statements of
Operations
|
|||||||||||||||
|
Sales
|
$ | 73,695 | $ | 50,693 | $ | 16,587 | $ | - | $ | 140,975 | ||||||||||
|
Gross profit
|
48,390 | 23,767 | 6,573 | (67 | ) | 78,663 | ||||||||||||||
|
Selling expenses
|
39,391 | 2,856 | 3,687 | 3,634 | 49,568 | |||||||||||||||
|
Operating income
|
8,999 | 20,911 | 2,886 | (21,180 | ) | 11,616 | ||||||||||||||
|
Interest and other expense, net
|
- | - | - | (24,539 | ) | (24,539 | ) | |||||||||||||
|
Income from continuing operations before provision for income taxes
|
$ | (12,923 | ) | |||||||||||||||||
Sales for the Company’s international operations including sales that are classified within the wholesale segment were approximately $22.3 million and $16.6 million for the thirteen weeks ended April 2, 2011 and April 3, 2010, respectively. Long lived assets of the Company’s international operations were approximately $2.4 million as of April 2, 2011 and January 1, 2011.
9. COMMITMENTS AND CONTINGENCIES
In August 2009, in connection with the Linens 'N Things bankruptcy proceedings, Linens Holding Co. and its affiliates ("Linens") filed a lawsuit against the Company in United States Bankruptcy Court in the District of Delaware alleging that pursuant to the United States Bankruptcy Code Linens is entitled to recover from the Company the certain amounts on the basis that they constitute "preferential transfers" under the Code. On April 4, 2011, the bankruptcy court approved a settlement of this matter, under which the Company paid $0.2 million.
In addition, the Company is engaged in various lawsuits, either as plaintiff or defendant. In the opinion of management, the ultimate outcome of these lawsuits will not have a material adverse effect on the Company’s financial condition, results of operations or cash flows.
10. FINANCIAL INFORMATION RELATED TO GUARANTOR SUBSIDIARIES
Obligations under the senior notes of Yankee Candle are guaranteed on an unsecured senior basis and obligations under the senior subordinated notes are guaranteed on an unsecured senior subordinated basis by Yankee Holdings and 100% of Yankee Candle’s existing and future domestic subsidiaries. The senior notes are fully and unconditionally guaranteed by all of Yankee Candle’s 100% owned U.S. subsidiaries (the “Guarantor Subsidiaries” and collectively with the Yankee Holdings, the “Guarantors”) on a senior unsecured basis. These guarantees are joint and several obligations of the Guarantors. Yankee Candle’s foreign subsidiary does not guarantee these notes.
The following tables present condensed consolidating supplementary financial information for Yankee Candle, as the issuer of the senior and senior subordinated notes, Yankee Holdings, Yankee Candle’s domestic guarantor subsidiaries and the non guarantor subsidiaries together with eliminations as of and for the periods indicated. Yankee Holdings is also a guarantor of the notes. Separate complete financial statements of the respective Guarantors would not provide additional material information that would be useful in assessing the financial composition of the Guarantors.
Condensed consolidating financial information is as follows:
YANKEE HOLDING CORP. AND SUBSIDIARIES
CONDENSED CONSOLIDATING BALANCE SHEETS
April 2, 2011
(in thousands)
|
Non
|
||||||||||||||||||||||||
|
Yankee
|
Yankee
|
Guarantor
|
Guarantor
|
Intercompany
|
||||||||||||||||||||
|
ASSETS
|
Holdings
|
Candle
|
Subsidiaries
|
Subsidiary
|
Eliminations
|
Consolidated
|
||||||||||||||||||
|
CURRENT ASSETS:
|
||||||||||||||||||||||||
|
Cash
|
$ | - | $ | 2,033 | $ | 1,384 | $ | 626 | $ | - | $ | 4,043 | ||||||||||||
|
Accounts receivable, net
|
- | 33,824 | 46 | 14,753 | - | 48,623 | ||||||||||||||||||
|
Inventory
|
- | 72,487 | 82 | 12,652 | - | 85,221 | ||||||||||||||||||
|
Prepaid expenses and other current assets
|
- | 17,739 | 223 | 48 | - | 18,010 | ||||||||||||||||||
|
Deferred tax assets
|
- | 10,607 | 56 | - | - | 10,663 | ||||||||||||||||||
|
TOTAL CURRENT ASSETS
|
- | 136,690 | 1,791 | 28,079 | - | 166,560 | ||||||||||||||||||
|
PROPERTY, PLANT AND EQUIPMENT, NET
|
- | 114,657 | 76 | 2,443 | - | 117,176 | ||||||||||||||||||
|
GOODWILL
|
- | 643,570 | - | - | - | 643,570 | ||||||||||||||||||
|
INTANGIBLE ASSETS
|
- | 278,416 | - | 266 | - | 278,682 | ||||||||||||||||||
|
DEFERRED FINANCING COSTS
|
- | 13,456 | - | - | - | 13,456 | ||||||||||||||||||
|
OTHER ASSETS
|
- | 2,113 | - | - | - | 2,113 | ||||||||||||||||||
|
INTERCOMPANY RECEIVABLES
|
22,999 | 267 | (23,266 | ) | - | |||||||||||||||||||
|
INVESTMENT IN SUBSIDIARIES
|
69,163 | 3,638 | - | - | (72,801 | ) | - | |||||||||||||||||
|
TOTAL ASSETS
|
$ | 69,163 | $ | 1,215,539 | $ | 2,134 | $ | 30,788 | $ | (96,067 | ) | $ | 1,221,557 | |||||||||||
|
LIABILITIES AND STOCKHOLDER'S EQUITY
|
||||||||||||||||||||||||
|
CURRENT LIABILITIES:
|
||||||||||||||||||||||||
|
Accounts payable
|
$ | - | $ | 22,557 | $ | 30 | $ | 2,531 | $ | - | $ | 25,118 | ||||||||||||
|
Accrued payroll
|
- | 8,255 | 66 | 481 | - | 8,802 | ||||||||||||||||||
|
Accrued interest
|
- | 6,009 | - | - | - | 6,009 | ||||||||||||||||||
|
Accrued purchases of property and equipment
|
- | 2,800 | - | - | - | 2,800 | ||||||||||||||||||
|
Current portion of capital leases
|
- | 642 | - | - | - | 642 | ||||||||||||||||||
|
Other accrued liabilities
|
- | 30,663 | 1,396 | 1,514 | - | 33,573 | ||||||||||||||||||
|
TOTAL CURRENT LIABILITIES
|
- | 70,926 | 1,492 | 4,526 | - | 76,944 | ||||||||||||||||||
|
DEFERRED TAX LIAIBILITY
|
- | 100,297 | - | - | - | 100,297 | ||||||||||||||||||
|
LONG-TERM DEBT
|
- | 959,125 | - | - | - | 959,125 | ||||||||||||||||||
|
DEFERRED RENT
|
- | 11,856 | - | - | - | 11,856 | ||||||||||||||||||
|
CAPITAL LEASES, NET OF CURRENT PORTION
|
- | 1,560 | - | - | - | 1,560 | ||||||||||||||||||
|
OTHER LONG-TERM LIABILITIES
|
- | 2,612 | - | - | - | 2,612 | ||||||||||||||||||
|
INTERCOMPANY PAYABLES
|
- | - | - | 23,266 | (23,266 | ) | - | |||||||||||||||||
|
STOCKHOLDER'S EQUITY
|
69,163 | 69,163 | 642 | 2,996 | (72,801 | ) | 69,163 | |||||||||||||||||
|
TOTAL LIABILITIES AND STOCKHOLDER'S EQUITY
|
$ | 69,163 | $ | 1,215,539 | $ | 2,134 | $ | 30,788 | $ | (96,067 | ) | $ | 1,221,557 | |||||||||||
YANKEE HOLDING CORP. AND SUBSIDIARIES
CONDENSED CONSOLIDATING BALANCE SHEETS
January 1, 2011
(in thousands)
|
Yankee Holdings
|
Yankee Candle
|
Guarantor Subsidiaries
|
Non Guarantor Subsidiary
|
Intercompany Eliminations
|
Consolidated
|
|||||||||||||||||||
|
ASSETS
|
||||||||||||||||||||||||
|
CURRENT ASSETS:
|
||||||||||||||||||||||||
|
Cash
|
$ | — | $ | 8,702 | $ | 1,868 | $ | 2,143 | $ | — | $ | 12,713 | ||||||||||||
|
Accounts receivable, net
|
— | 31,960 | 176 | 14,801 | — | 46,937 | ||||||||||||||||||
|
Inventory
|
— | 57,427 | 87 | 9,873 | — | 67,387 | ||||||||||||||||||
|
Prepaid expenses and other current assets
|
— | 10,032 | 195 | 586 | — | 10,813 | ||||||||||||||||||
|
Deferred tax assets
|
— | 11,577 | 65 | — | — | 11,642 | ||||||||||||||||||
|
TOTAL CURRENT ASSETS
|
— | 119,698 | 2,391 | 27,403 | — | 149,492 | ||||||||||||||||||
|
PROPERTY AND EQUIPMENT, NET
|
— | 116,377 | 55 | 2,354 | — | 118,786 | ||||||||||||||||||
|
GOODWILL
|
— | 643,570 | — | — | — | 643,570 | ||||||||||||||||||
|
INTANGIBLE ASSETS
|
— | 281,465 | — | 284 | — | 281,749 | ||||||||||||||||||
|
DEFERRED FINANCING COSTS
|
— | 14,271 | — | — | — | 14,271 | ||||||||||||||||||
|
OTHER ASSETS
|
— | 1,832 | — | — | — | 1,832 | ||||||||||||||||||
|
INTERCOMPANY RECEIVABLES
|
— | 23,214 | 430 | — | (23,644 | ) | — | |||||||||||||||||
|
INVESTMENT IN SUBSIDIARIES
|
70,008 | 3,625 | — | — | (73,633 | ) | — | |||||||||||||||||
|
TOTAL ASSETS
|
$ | 70,008 | $ | 1,204,052 | $ | 2,876 | $ | 30,041 | $ | (97,277 | ) | $ | 1,209,700 | |||||||||||
|
LIABILITIES AND STOCKHOLDER'S EQUITY
|
||||||||||||||||||||||||
|
CURRENT LIABILITIES:
|
||||||||||||||||||||||||
|
Accounts payable
|
$ | — | $ | 25,025 | $ | 46 | $ | 1,220 | $ | — | $ | 26,291 | ||||||||||||
|
Accrued payroll
|
— | 12,317 | 31 | 321 | — | 12,669 | ||||||||||||||||||
|
Accrued interest
|
— | 17,509 | — | — | — | 17,509 | ||||||||||||||||||
|
Accrued income taxes
|
— | 18,639 | — | 201 | — | 18,840 | ||||||||||||||||||
|
Accrued purchases of property and equipment
|
— | 2,269 | — | — | — | 2,269 | ||||||||||||||||||
|
Current portion of capital leases
|
— | 667 | — | — | — | 667 | ||||||||||||||||||
|
Other accrued liabilities
|
— | 41,679 | 1,960 | 1,869 | — | 45,508 | ||||||||||||||||||
|
TOTAL CURRENT LIABILITIES
|
— | 118,105 | 2,037 | 3,611 | — | 123,753 | ||||||||||||||||||
|
DEFERRED TAX LIABILITIES
|
— | 99,432 | — | — | — | 99,432 | ||||||||||||||||||
|
LONG-TERM DEBT
|
— | 901,125 | — | — | — | 901,125 | ||||||||||||||||||
|
DEFERRED RENT
|
— | 11,535 | — | — | — | 11,535 | ||||||||||||||||||
|
CAPITAL LEASES, NET OF CURRENT PORTION
|
— | 1,677 | — | — | — | 1,677 | ||||||||||||||||||
|
OTHER LONG-TERM LIABILITIES
|
— | 2,170 | — | — | — | 2,170 | ||||||||||||||||||
|
INTERCOMPANY PAYABLES
|
— | — | — | 23,644 | (23,644 | ) | — | |||||||||||||||||
|
STOCKHOLDER'S EQUITY
|
70,008 | 70,008 | 839 | 2,786 | (73,633 | ) | 70,008 | |||||||||||||||||
|
TOTAL LIABILITIES AND STOCKHOLDER'S EQUITY
|
$ | 70,008 | $ | 1,204,052 | $ | 2,876 | $ | 30,041 | $ | (97,277 | ) | $ | 1,209,700 | |||||||||||
YANKEE HOLDING CORP. AND SUBSIDIARIES
CONDENSED CONSOLIDATING STATEMENTS OF OPERATIONS
For the Thirteen Weeks Ended April 2, 2011
(in thousands)
|
Non
|
||||||||||||||||||||||||
|
Yankee
|
Yankee
|
Guarantor
|
Guarantor
|
Intercompany
|
||||||||||||||||||||
|
Candle
|
Candle
|
Subsidiaries
|
Subsidiary
|
Eliminations
|
Consolidated
|
|||||||||||||||||||
|
Sales
|
$ | - | $ | 135,115 | $ | 527 | $ | 21,325 | $ | (12,853 | ) | $ | 144,114 | |||||||||||
|
Cost of sales
|
- | 59,372 | 163 | 17,012 | (11,684 | ) | 64,863 | |||||||||||||||||
|
Gross profit
|
- | 75,743 | 364 | 4,313 | (1,169 | ) | 79,251 | |||||||||||||||||
|
Selling expenses
|
- | 47,492 | 485 | 5,142 | (60 | ) | 53,059 | |||||||||||||||||
|
General and administrative expenses
|
- | 18,544 | - | - | 50 | 18,594 | ||||||||||||||||||
|
Operating income (loss)
|
- | 9,707 | (121 | ) | (829 | ) | (1,159 | ) | 7,598 | |||||||||||||||
|
Interest expense
|
- | 17,679 | - | - | - | 17,679 | ||||||||||||||||||
|
Other income
|
- | (507 | ) | - | (1,368 | ) | - | (1,875 | ) | |||||||||||||||
|
(Loss) income before (benefit) provision for income taxes
|
- | (7,465 | ) | (121 | ) | 539 | (1,159 | ) | (8,206 | ) | ||||||||||||||
|
(Benefit) provision for income taxes
|
- | (2,605 | ) | (42 | ) | 147 | (412 | ) | (2,912 | ) | ||||||||||||||
|
(Loss) income from continuing operations
|
- | (4,860 | ) | (79 | ) | 392 | (747 | ) | (5,294 | ) | ||||||||||||||
|
Loss from discontinued operations, net of income taxes
|
- | (54 | ) | - | - | - | (54 | ) | ||||||||||||||||
|
(Loss) income before equity in losses (earnings) of subsidiaries, net of tax
|
- | (4,914 | ) | (79 | ) | 392 | (747 | ) | (5,348 | ) | ||||||||||||||
|
Equity in losses (earnings) of subsidiaires, net of tax
|
5,348 | (313 | ) | - | - | (5,035 | ) | - | ||||||||||||||||
|
Net (loss) income
|
$ | (5,348 | ) | $ | (4,601 | ) | $ | (79 | ) | $ | 392 | $ | 4,288 | $ | (5,348 | ) | ||||||||
YANKEE HOLDING CORP. AND SUBSIDIARIES
CONDENSED CONSOLIDATING STATEMENTS OF OPERATIONS
For the Thirteen Weeks Ended April 3, 2010
(in thousands)
|
Yankee Holdings
|
Yankee Candle
|
Guarantor
Subsidiaries |
Non
Guarantor |
Intercompany
Eliminations |
Consolidated
|
|||||||||||||||||||
|
Sales
|
$ | — | $ | 133,952 | $ | 514 | $ | 15,938 | $ | (9,429 | ) | $ | 140,975 | |||||||||||
|
Cost of sales
|
— | 57,441 | 145 | 13,410 | (8,684 | ) | 62,312 | |||||||||||||||||
|
Gross profit
|
— | 76,511 | 369 | 2,528 | (745 | ) | 78,663 | |||||||||||||||||
|
Selling expenses
|
— | 45,513 | 450 | 3,665 | (60 | ) | 49,568 | |||||||||||||||||
|
General and administrative expenses
|
— | 16,626 | — | — | 53 | 16,679 | ||||||||||||||||||
|
Restructuring charges
|
— | 800 | — | — | — | 800 | ||||||||||||||||||
|
Operating income (loss)
|
— | 13,572 | (81 | ) | (1,137 | ) | (738 | ) | 11,616 | |||||||||||||||
|
Interest expense
|
— | 19,807 | — | — | — | 19,807 | ||||||||||||||||||
|
Other expense (income)
|
— | 4,875 | — | (143 | ) | — | 4,732 | |||||||||||||||||
|
Loss from continuing operations before benefit from income taxes
|
— | (11,110 | ) | (81 | ) | (994 | ) | (738 | ) | (12,923 | ) | |||||||||||||
|
Benefit from income taxes
|
— | (4,101 | ) | (30 | ) | (278 | ) | (267 | ) | (4,676 | ) | |||||||||||||
|
Loss from continuing operations
|
— | (7,009 | ) | (51 | ) | (716 | ) | (471 | ) | (8,247 | ) | |||||||||||||
|
Loss from discontinued operations, net of income taxes
|
— | (255 | ) | — | — | — | (255 | ) | ||||||||||||||||
|
Loss before equity in losses of subsidiaries, net of tax
|
— | (7,264 | ) | (51 | ) | (716 | ) | (471 | ) | (8,502 | ) | |||||||||||||
|
Equity in losses of subsidiaries, net of tax
|
8,502 | 767 | — | — | (9,269 | ) | — | |||||||||||||||||
|
Net loss
|
$ | (8,502 | ) | $ | (8,031 | ) | $ | (51 | ) | $ | (716 | ) | $ | 8,798 | $ | (8,502 | ) | |||||||
YANKEE HOLDING CORP. AND SUBSIDIARIES
CONDENSED CONSOLIDATING STATEMENTS OF CASH FLOWS
For the Thirteen weeks Ended April 2, 2011
(in thousands)
|
Non
|
||||||||||||||||||||||||
|
Yankee
|
Yankee
|
Guarantor
|
Guarantor
|
Intercompany
|
||||||||||||||||||||
|
Holdings
|
Candle
|
Subsidiaries
|
Subsidiary
|
Eliminations
|
Consolidated
|
|||||||||||||||||||
|
CASH FLOWS USED IN OPERATING ACTIVITIES:
|
||||||||||||||||||||||||
|
Net (loss) income
|
$ | (5,348 | ) | $ | (4,600 | ) | $ | (79 | ) | $ | 392 | $ | 4,287 | $ | (5,348 | ) | ||||||||
|
Adjustments to reconcile net (loss) income to net cash in operating activities:
|
||||||||||||||||||||||||
|
Depreciation and amortization
|
- | 10,034 | 5 | 200 | - | 10,239 | ||||||||||||||||||
|
Gain on derivatives
|
- | (1,408 | ) | - | - | - | (1,408 | ) | ||||||||||||||||
|
Unrealized gain on marketable securities
|
- | (57 | ) | - | - | - | (57 | ) | ||||||||||||||||
|
Equity-based compensation expense
|
- | 194 | - | - | - | 194 | ||||||||||||||||||
|
Deferred taxes
|
- | 1,236 | 9 | - | - | 1,245 | ||||||||||||||||||
|
Loss on disposal of property and equipment
|
- | 69 | - | - | - | 69 | ||||||||||||||||||
|
Equity in losses of subsidiaries
|
5,348 | (313 | ) | - | (748 | ) | (4,287 | ) | - | |||||||||||||||
|
Changes in assets and liabilities:
|
- | |||||||||||||||||||||||
|
Accounts receivable, net
|
- | (1,864 | ) | 130 | 534 | - | (1,200 | ) | ||||||||||||||||
|
Inventory
|
- | (15,058 | ) | 5 | (2,195 | ) | - | (17,248 | ) | |||||||||||||||
|
Prepaid expenses and other assets
|
- | (1,793 | ) | (28 | ) | 168 | - | (1,653 | ) | |||||||||||||||
|
Accounts payable
|
- | (2,467 | ) | (16 | ) | 1,250 | - | (1,233 | ) | |||||||||||||||
|
Income taxes payable
|
- | (23,559 | ) | - | 185 | - | (23,374 | ) | ||||||||||||||||
|
Accrued expenses and other current liabilities
|
- | (22,376 | ) | (529 | ) | (789 | ) | - | (23,694 | ) | ||||||||||||||
|
NET CASH USED IN OPERATING ACTIVITIES
|
- | (61,962 | ) | (503 | ) | (1,003 | ) | - | (63,468 | ) | ||||||||||||||
|
CASH FLOWS USED IN INVESTING ACTIVITIES:
|
||||||||||||||||||||||||
|
Purchase of property and equipment
|
- | (3,907 | ) | (26 | ) | (191 | ) | - | (4,124 | ) | ||||||||||||||
|
Intercompany payables/receivables
|
- | 324 | - | - | (324 | ) | - | |||||||||||||||||
|
NET CASH USED IN INVESTING ACTIVITIES
|
- | (3,583 | ) | (26 | ) | (191 | ) | (324 | ) | (4,124 | ) | |||||||||||||
|
CASH FLOWS PROVIDED BY FINANCING ACTIVITIES:
|
||||||||||||||||||||||||
|
Borrowings on credit facility
|
- | 58,000 | - | - | - | 58,000 | ||||||||||||||||||
|
Contribution by YCC Holdings LLC
|
- | 3,000 | - | - | - | 3,000 | ||||||||||||||||||
|
Dividends paid to YCC Holdings LLC
|
- | (1,876 | ) | - | - | - | (1,876 | ) | ||||||||||||||||
|
Proceeds from issuance of common stock
|
- | 3 | - | - | - | 3 | ||||||||||||||||||
|
Repurchase of common stock
|
- | (86 | ) | - | - | - | (86 | ) | ||||||||||||||||
|
Principal payments on capital lease obligations
|
- | (165 | ) | - | - | - | (165 | ) | ||||||||||||||||
|
Intercompany payables/receivables
|
- | - | 45 | (369 | ) | 324 | - | |||||||||||||||||
|
NET CASH PROVIDED BY (USED IN) FINANCING ACTIVITIES
|
- | 58,876 | 45 | (369 | ) | 324 | 58,876 | |||||||||||||||||
|
EFFECT OF EXCHANGE RATE CHANGES ON CASH
|
- | - | - | 46 | - | 46 | ||||||||||||||||||
|
NET DECREASE IN CASH
|
- | (6,669 | ) | (484 | ) | (1,517 | ) | - | (8,670 | ) | ||||||||||||||
|
CASH, BEGINNING OF PERIOD
|
- | 8,702 | 1,868 | 2,143 | - | 12,713 | ||||||||||||||||||
|
CASH, END OF PERIOD
|
$ | - | $ | 2,033 | $ | 1,384 | $ | 626 | $ | - | $ | 4,043 | ||||||||||||
YANKEE HOLDING CORP. AND SUBSIDIARIES
CONDENSED CONSOLIDATING STATEMENTS OF CASH FLOWS
For the Thirteen weeks Ended April 3, 2010
(in thousands)
|
Yankee Holdings
|
Yankee Candle
|
Guarantor
Subsidiaries |
Non
Guarantor
Subsidiary |
Intercompany
Eliminations |
Consolidated | |||||||||||||||||||
|
CASH FLOWS USED IN OPERATING ACTIVITIES:
|
||||||||||||||||||||||||
|
Net loss
|
$ | (8,502 | ) | $ | (8,031 | ) | $ | (51 | ) | $ | (716 | ) | $ | 8,798 | $ | (8,502 | ) | |||||||
|
Adjustments to reconcile net loss to net cash used in operating activities:
|
||||||||||||||||||||||||
|
Depreciation and amortization
|
— | 10,574 | 3 | 127 | — | 10,704 | ||||||||||||||||||
|
Realized loss on derivative contracts
|
— | 4,802 | — | — | — | 4,802 | ||||||||||||||||||
|
Unrealized gain on marketable securities
|
— | (54 | ) | — | — | — | (54 | ) | ||||||||||||||||
|
Share-based compensation expense
|
— | 329 | — | — | — | 329 | ||||||||||||||||||
|
Deferred taxes
|
— | (998 | ) | 133 | — | — | (865 | ) | ||||||||||||||||
|
Gain on disposal of property and equipment
|
— | (5 | ) | — | — | — | (5 | ) | ||||||||||||||||
|
Equity in losses of subsidiaries
|
8,502 | 767 | — | (471 | ) | (8,798 | ) | — | ||||||||||||||||
|
Changes in assets and liabilities
|
||||||||||||||||||||||||
|
Accounts receivable, net
|
— | 4,179 | 180 | (1,294 | ) | — | 3,065 | |||||||||||||||||
|
Inventory
|
— | (8,619 | ) | (6 | ) | (668 | ) | — | (9,293 | ) | ||||||||||||||
|
Prepaid expenses and other assets
|
— | (1,993 | ) | 2 | (721 | ) | — | (2,712 | ) | |||||||||||||||
|
Accounts payable
|
— | 4,093 | (59 | ) | 629 | — | 4,663 | |||||||||||||||||
|
Income taxes
|
— | (4,726 | ) | — | — | — | (4,726 | ) | ||||||||||||||||
|
Accrued expenses and other liabilities
|
— | (24,419 | ) | (597 | ) | (1 | ) | — | (25,017 | ) | ||||||||||||||
|
NET CASH USED IN OPERATING ACTIVITIES
|
— | (24,101 | ) | (395 | ) | (3,115 | ) | — | (27,611 | ) | ||||||||||||||
|
CASH FLOWS USED IN INVESTING ACTIVITIES:
|
||||||||||||||||||||||||
|
Purchases of property and equipment
|
— | (2,891 | ) | — | (41 | ) | — | (2,932 | ) | |||||||||||||||
|
Proceeds from the sale of property and equipment
|
— | 192 | — | — | — | 192 | ||||||||||||||||||
|
Intercompany payables/receivables
|
— | (1,598 | ) | — | — | 1,598 | — | |||||||||||||||||
|
NET CASH USED IN INVESTING ACTIVITIES
|
— | (4,297 | ) | — | (41 | ) | 1,598 | (2,740 | ) | |||||||||||||||
|
CASH FLOWS PROVIDED BY FINANCING ACTIVITIES:
|
||||||||||||||||||||||||
|
Repayments under Credit Facility
|
(11,000 | ) | — | — | — | (11,000 | ) | |||||||||||||||||
|
Borrowings under Credit Facility
|
— | 37,000 | — | — | — | 37,000 | ||||||||||||||||||
|
Proceeds from issuance of common stock
|
— | 25 | — | — | — | 25 | ||||||||||||||||||
|
Repurchase of common stock
|
— | (630 | ) | — | — | — | (630 | ) | ||||||||||||||||
|
Intercompany payables/receivables
|
— | — | 78 | 1,520 | (1,598 | ) | — | |||||||||||||||||
|
NET CASH PROVIDED BY FINANCING ACTIVITIES
|
— | 25,395 | 78 | 1,520 | (1,598 | ) | 25,395 | |||||||||||||||||
|
EFFECT EXCHANGE RATE CHANGES ON CASH
|
— | — | — | (92 | ) | — | (92 | ) | ||||||||||||||||
|
NET DECREASE IN CASH
|
— | (3,003 | ) | (317 | ) | (1,728 | ) | — | (5,048 | ) | ||||||||||||||
|
CASH, BEGINNING OF PERIOD
|
— | 4,588 | 2,151 | 2,356 | — | 9,095 | ||||||||||||||||||
|
CASH, END OF PERIOD
|
$ | — | $ | 1,585 | $ | 1,834 | $ | 628 | $ | — | $ | 4,047 | ||||||||||||
|
ITEM 2.
|
MANAGEMENT’S DISCUSSION AND ANALYSIS OF FINANCIAL CONDITION AND RESULTS OF OPERATIONS
|
ORGANIZATION AND CURRENT EVENTS
Yankee Holdings is a wholly owned subsidiary of YCC Holdings LLC (“YCC Holdings”). In 2011, Yankee Candle Investments LLC (“Yankee Investments”) and Yankee Finance, Inc. (“Yankee Finance”) were formed for the purpose of co-issuing senior notes. The members of YCC Holdings LLC include certain funds affiliated with Madison Dearborn Partners, LLC (“Madison Dearborn”), as well as certain management and directors of the Company with equity interests. These members exchanged their interests in YCC Holdings for identical interests in Yankee Investments. As of April 2, 2011, Yankee Investments is the parent of YCC Holdings who is the parent of Yankee Finance and Yankee Holding Corp. (“Yankee Holdings”). YCC Holdings and Yankee Holdings are holding companies with no direct operations. Their principal assets are the indirect equity interests in The Yankee Candle Company, Inc. (“Yankee Candle”), and all of their operations are conducted through Yankee Candle, the wholly owned operating subsidiary of the Company.
In February 2011, YCC Holdings and Yankee Finance co-issued $315.0 million of 10.25%/11.00% Senior Notes due 2016 (the “Senior PIK Notes”) pursuant to an Indenture at a discount of $6.3 million for net proceeds of $308.7 million. Issuance costs related to the Senior PIK Notes were $9.7 million, of which $7.8 million were paid for by YCC Holdings and $1.9 million were paid for by the Company. The costs paid for by the Company have been reflected as a dividend to YCC Holdings in the accompanying condensed consolidated statement of stockholder’s equity. The Senior PIK Notes are not registered; however, the issuers are in the process of registering the notes.
The proceeds from the Senior PIK Notes were used to pay transaction costs (exclusive of the amounts paid by the Company) and make a payment of $300.8 million to Yankee Investments who in turn made payments of $297.8 million to holders of Yankee Investments’ Class A common units and payments of $3.0 million to holders of Yankee Investments’ Class B and Class C common units. The payments to the Class A common unit holders represent a partial return of their original investment and are reflected as an equity transaction by Yankee Investments. The payments to the Class B and Class C common unit holders who are members of management and directors of the Company did not affect the liquidation amounts for such units and accordingly are reflected as general and administrative expense in the accompanying condensed consolidated statement of operations and as a contribution by YCC Holdings in the accompanying condensed consolidated statement of stockholder’s equity for the thirteen weeks ended April 2, 2011.
Cash interest on the Senior PIK Notes accrues at a rate of 10.25% per annum, and PIK Interest (defined below) accrues at the cash interest rate plus 0.75%. YCC Holdings is required to pay interest on the Senior PIK Notes (1) for the first interest payment date, entirely in cash and (2) for all subsequent interest payment dates, entirely in cash interest, unless the conditions described in the indenture are satisfied with respect to the related interest period, in which case, YCC Holdings may pay interest on the Senior PIK Notes for such interest period by increasing the principal amount of the Senior PIK Notes or by issuing new PIK Notes for up to the entire amount of the interest payment (in each case, “PIK Interest”) to the extent described in the indenture.
YCC Holdings is dependent upon dividends from Yankee Holdings to generate the funds necessary to meet its outstanding debt service obligations. Yankee Holdings did not guarantee the Senior PIK Notes nor is Yankee Holdings obligated to pay dividends to YCC Holdings. Yankee Holdings is allowed to make dividends to YCC Holdings based upon the lower of (a) available excess cash flow based on provisions determined in Yankee Candle’s Term Facility agreement or (b) amounts available for restricted payments based on provisions included in Yankee Candle’s senior secured notes indenture agreement.
Available excess cash flow for Yankee Candle’s Term Facility is defined as the aggregate cumulative amount of excess cash flow for all fiscal years subsequent to issuance (February 2007) that is not required to prepay the borrowings. On an annual basis, the Company is required to prepay the borrowings by 50% of excess cash flow, reduced to 25% of excess cash flow if the total debt ratio is not greater than 5.0 to 1.0. The Company is not required to make a payment if the total debt ratio is less than or equal to 4.0 to 1.0. Excess cash flow is defined in Yankee Candle’s Credit Facility agreement as net income plus all non cash charges including depreciation, amortization, deferred tax expense, losses on disposition of property and decreases in working capital, decreased by non-cash gains including gains on disposition of property, cash paid for capital expenditures, regularly scheduled and voluntary prepayments of borrowings and increases in working capital.
Restricted payments under Yankee Candle’s senior secured notes are allowed to the extent that total restricted payments subsequent to the issuance date (February 2007) are less than 50% of net income from December 31, 2006 through the most recent fiscal quarter. Net income is defined as net income excluding extraordinary, unusual or non recurring gains, losses or expenses, cumulative effect of a change in accounting principle, asset dispositions, income from equity method subsidiaries, dividends from restricted subsidiaries, non-cash compensation charges, gains or losses of early extinguishment of debt, non-cash write-offs of assets or liabilities resulting from the transaction, gains or losses from hedging activities and any net after-tax income or loss from discontinued operations.
As of January 1, 2011, the amount available for dividends was $138.4 million. During the thirteen weeks ended April 2, 2011 Yankee Holdings made a dividend of $1.9 million to YCC Holdings, which decreases the amount available for future dividends.
CRITICAL ACCOUNTING POLICIES AND ESTIMATES
“Management’s Discussion and Analysis of Financial Condition and Results of Operations” discusses our condensed consolidated financial statements for Yankee Holdings and its subsidiaries (the “Company”), which have been prepared in accordance with accounting principles generally accepted in the United States of America. The preparation of these financial statements requires management to make estimates and judgments that affect the reported amounts of assets and liabilities and the disclosure of contingent assets and liabilities at the date of the financial statements and the reported amounts of revenues and expenses during the reporting period. Management bases its estimates and judgments on historical experience and on various other factors that are believed to be reasonable under the circumstances, the results of which form the basis for making judgments about operating results and the carrying values of assets and liabilities that are not readily apparent from other sources. Actual results may differ from these estimates under different assumptions or conditions. There have been no significant changes to our critical accounting policies as discussed in our Annual Report on Form 10-K for the fiscal year ended January 1, 2011.
OVERVIEW
General Business Information
We are the largest specialty branded premium scented candle company in the United States based on our annual sales and profitability. The strong brand equity of the Yankee Candle ® brand, coupled with our vertically integrated multi-channel business model, have enabled us to be the market leader in the premium scented candle market for many years. We design, develop, manufacture, and distribute the majority of the products we sell which allows us to offer distinctive, trend-appropriate products for every season, every customer, and every room in the home. We have a 41-year history of category leadership and growth by marketing Yankee Candle products as affordable luxuries, consumable products, and valued gifts. We offer the broadest assortment of highly scented candles, innovative home fragrance products, and candle related home décor accessories in a variety of compelling fragrances, colors, styles, and price points.
Candle products are the foundation of our business, and are available in a wide range of fragrances and colors across a variety of jar candles, Samplers ® votive candles, Tarts ® wax potpourri, pillars and other candle products, the vast majority of which are marketed under the Yankee Candle ® brand. Our candles are moderately-priced ranging from $1.99 for a Samplers ® votive candle to $25.99 for a large 22 ounce jar candle. This variety ensures each customer can find Yankee Candle products appropriate for the consumer’s lifestyle and budget. In addition to our core candle business, we successfully have extended the Yankee Candle brand into the growing home fragrance market with a portfolio of innovative fragrance products for your home. Our assortment includes electric plug home fragrancers, decorative reed diffusers, room sprays, potpourri, and scented oils. Additionally, we offer products such as the Yankee Candle Car Jars ® auto air fresheners to fragrance cars and small spaces. We also offer a wide array of coordinated candle related and home decor accessories in dozens of exclusive patterns, colors and styles, and numerous giftsets. In addition to our “everyday” product offerings, we also offer seasonally-appropriate fragrances, products, home décor accessories, and giftsets on a limited edition, seasonal basis. These themed temporary programs occur four times a year: Spring, Summer, Fall, and the Christmas/Holiday season.
We operate our business through our retail, wholesale and international segments.
Retail Segment. We are the largest specialty retailer of premium scented candles in the U.S. We operate 518 specialty retail stores under the Yankee Candle® name as of April 2, 2011. Our retail stores, excluding our two flagship stores, average approximately 1,640 gross square feet and are primarily located in high traffic shopping malls and lifestyle centers. We operate two flagship stores, a 90,000-square-foot store in South Deerfield, Massachusetts, which is a major tourist destination in Massachusetts, and a second 42,000-square-foot store in Williamsburg, Virginia. These stores promote our brand image and culture and allow us to test new product and fragrance introductions. In addition to our retail stores, we also sell our products directly to consumers through the Consumer Direct business and the Fundraising business. We believe these two businesses will continue to serve as important sources of revenue growth and profitability, while also helping to build brand awareness, introduce our products to new customers and drive traffic to our retail stores.
Wholesale Segment. We have an attractive and growing wholesale segment with a diverse customer base. As of April 2, 2011, we had approximately 20,100 wholesale locations in North America, including independent gift stores, leading national gift retailers such as Hallmark, leading home specialty retailers such as Bed, Bath & Beyond, national department stores such as Kohl’s, regional department stores, “premium mass” retailers such as Target, home improvement retailers such as Home Depot, selected club stores and other national accounts. We believe that as a result of our strong brand name, the popularity, quality and profitability of our products, our emphasis on customer service, and our successful in-store merchandising and display system, our domestic wholesale customers are extremely loyal, with approximately 80% of our U.S. wholesale accounts having been customers for over five years.
International Segment. Outside of North America, we sell our products primarily through our subsidiary, Yankee Candle (Europe), LTD (“YCE”), which has an international wholesale customer network of approximately 5,200 store locations and distributors covering 47 countries as of April 2, 2011. We also sell our products in Japan, Korea, China and other Asian countries through our Asian distributors. Prior to the first quarter of 2011, we aggregated our international and domestic wholesale segments. Because of the increasing importance of our international operations, as evidenced by increased sales and the appointment of a full time international president, we disaggregated these twp segments during the first quarter of 2011.
Due to the seasonal nature of our business, interim results are not necessarily indicative of results for the entire fiscal year. Our revenue and earnings are typically greater during our fiscal fourth quarter, which includes the majority of the holiday selling season.
Discontinued Operations
During 2009, we discontinued the operations of our Illuminations and Aroma Naturals businesses. Accordingly, we have classified the results of operations of the Illuminations and Aroma Naturals businesses as discontinued operations for all periods presented.
RESULTS OF OPERATIONS
The following table sets forth the various components of our condensed consolidated statements of operations, expressed as a percentage of sales, for the periods indicated that are used in connection with the discussion herein.
|
Thirteen Weeks Ended April 2, 2011
|
Thirteen Weeks Ended April 3, 2010
|
|||||||
|
Yankee Holding Corp. Statements of Operations Data:
|
||||||||
|
Sales:
|
||||||||
|
Retail
|
51.9 | % | 52.3 | % | ||||
|
Wholesale
|
32.9 | 36.0 | ||||||
|
International
|
15.2 | 11.7 | ||||||
|
Total net sales
|
100.0 | 100.0 | ||||||
|
Cost of sales
|
45.0 | 44.2 | ||||||
|
Gross profit
|
55.0 | 55.8 | ||||||
|
Selling expenses
|
36.8 | 35.2 | ||||||
|
General and administrative expenses
|
12.9 | 11.8 | ||||||
|
Restructuring charges
|
- | 0.6 | ||||||
|
Operating income
|
5.3 | 8.2 | ||||||
|
Other expense, net
|
11.0 | 17.4 | ||||||
|
Loss from continuing operations before benefit from income taxes
|
(5.7 | ) | (9.2 | ) | ||||
|
Benefit from income taxes
|
(2.0 | ) | (3.3 | ) | ||||
|
Loss from continuing operations
|
(3.7 | ) | (5.9 | ) | ||||
|
Loss from discontinued operations, net of taxes
|
(0.0 | ) | (0.1 | ) | ||||
|
Net loss
|
(3.7 | ) % | (6.0 | ) % | ||||
The results of operations discussion that follows for the thirteen weeks ended April 3, 2011 versus the thirteen weeks ended April 3, 2010, is for continuing operations only. The results of operations of the Aroma Naturals and the Illuminations divisions have been treated as discontinued operations for all periods presented and are not included in the discussion below.
Thirteen weeks ended April 2, 2011 versus the Thirteen weeks ended April 3, 2010
SALES
Sales increased 2.2% to $144.1 million for the thirteen weeks ended April 2, 2011 from $141.0 million for the thirteen weeks ended April 3, 2010.
Retail Sales
Retail sales increased 1.5% to $74.8 million for the thirteen weeks ended April 2, 2011, from $73.7 million for the thirteen weeks ended April 3, 2010. The increase in retail sales was primarily due to (i) sales attributable to stores opened in 2010 that have not yet entered the comparable store base (which in 2010 were open for less than a full year) of approximately $2.1 million and (ii) increased sales in our catalog and internet business of approximately $1.3 million, partially offset by decreases in comparable store sales of approximately $1.4 million and decreases in sales from our Yankee Candle Fundraising division of approximately $1.1 million.
Comparable store and catalog and Internet sales for our Yankee Candle Retail business decreased 0.1% for the thirteen weeks ended April 2, 2011 compared to the thirteen weeks ended April 3, 2010. Yankee Candle comparable store sales for the thirteen weeks ended April 2, 2011 decreased 2.3% compared to the thirteen weeks ended April 3, 2010. Comparable store sales represent a comparison of sales during the corresponding fiscal periods on stores in our comparable stores sales base. A store first enters our comparable store sales base in the fourteenth fiscal month of operation. Permanently closed stores are excluded from the comparable store calculation beginning in the month in which the store closes. The decrease in comparable store sales was driven by decreased transactions of 0.6% and a decrease in average ticket price of 1.7%. There were 486 stores included in the Yankee Candle comparable store base as of April 2, 2011 as compared to 464 stores included in the Yankee Candle comparable store base as of April 3, 2010. There were 518 total retail stores open as of April 2, 2011, compared to 498 total retail stores open as of April 3, 2010.
Wholesale Sales
Wholesale sales decreased 6.4% to $47.4 million for the thirteen weeks ended April 2, 2011 from $50.7 million for the thirteen weeks ended April 3, 2010.
The decrease in wholesale sales was primarily due to decreased sales in domestic gift accounts in operation prior to April 3, 2010 of approximately $3.4 million and decreased sales from co-packaging and licensing activities of approximately $1.4 million partially offset by increased sales to domestic national wholesale locations opened during the last 12 months of approximately $1.5 million.
International Sales
International sales increased 31.9% to $21.9 million for the thirteen weeks ended April 2, 2011 from $16.6 million for the thirteen weeks ended April 3, 2010.
The increase in international sales was primarily due to increased sales in our UK wholesale and concession channels driven by new locations opened during the last 12 months.
GROSS PROFIT
Gross profit is sales less cost of sales. Included within cost of sales are the cost of the merchandise we sell through our retail, wholesale and international segments, inbound and outbound freight costs, the operational costs of our distribution facilities, which include receiving costs, inspection and warehousing costs, and salaries and expenses incurred by our buying and merchandising operations.
Gross profit increased 0.1% to $79.3 million for the thirteen weeks ended April 2, 2011 from $78.7 million for the thirteen weeks ended April 3, 2010. As a percentage of sales, gross profit decreased to 55.0% for the thirteen weeks ended April 2, 2011 from 55.8% for the thirteen weeks ended April 3, 2010. Included in the calculation of gross profit for both the thirteen weeks ended April 2, 2011 and April 3, 2010 are purchase accounting costs of $0.1 million. These costs were not allocated to our segments.
Retail Gross Profit
Retail gross profit dollars decreased to $47.4 million for the thirteen weeks ended April 2, 2011 compared to $48.4 million for the thirteen weeks ended April 3, 2010. The decrease in gross profit dollars over the prior year quarter was primarily due to increased costs in our supply chain operations of approximately $1.2 million driven by inflationary pressure on wax and transportation costs and decreased profitability in our Yankee Candle Fundraising division of approximately $0.6 million as a result of reduced sales, partially offset by increased sales volume in our consumer direct business and our new retail stores which increased gross profit by approximately $0.8 million.
As a percentage of sales, retail gross profit decreased to 63.3% for the thirteen weeks ended April 2, 2011 from 65.7% for the thirteen weeks ended April 3, 2010. The decrease in gross profit rate was primarily the result of increased promotional activity of 1.0% and increased costs in our supply chain operations driven by inflationary pressure on wax and transportation costs which negatively impacted our gross profit rate by approximately 1.4%.
Wholesale Gross Profit
Wholesale gross profit dollars decreased 4.5% to $22.7 million for the thirteen weeks ended April 2, 2011 from $23.8 million for the thirteen weeks ended April 3, 2010. The decrease in wholesale gross profit dollars was primarily attributable decreased sales volume.
As a percentage of sales, wholesale gross profit increased to 47.8% for the thirteen weeks ended April 2, 2011 from 46.9% for the thirteen weeks ended April 3, 2010. The increase in gross profit rate was primarily attributable to favorable product mix of approximately 1.2% and decreased sales volume within our co-packaging and licensing activities, which has a lower profit margin, and which has become a smaller portion of the wholesale business resulting in favorable margin rate of approximately 0.6% relative to the prior year, offset by increased costs in our supply chain operations of 0.9% driven by inflationary pressure in wax and transportation costs.
International Gross Profit
International gross profit dollars increased 41.8% to $9.3 million for the thirteen weeks ended April 2, 2011 from $6.6 million for the thirteen weeks ended April 3, 2010. The increase in international gross profit dollars was primarily attributable to increased sales volume.
As a percentage of sales, international gross profit increased to 42.6% for the thirteen weeks ended April 2, 2011 from 39.6% for the thirteen weeks ended April 3, 2010. The increase in gross profit rate was primarily attributable to favorable product and channel mix of approximately 4.5% driven primarily by increased sales of our wax products within our concessions channel which both have higher margins, partially offset by increased costs in our supply chain operations of 1.5% driven by inflationary pressure in wax and transportation costs.
SELLING EXPENSES
Selling expenses increased 7.1% to $53.1 million for the thirteen weeks ended April 2, 2011 from $49.6 million for the thirteen weeks ended April 3, 2010. These expenses are related to both wholesale and retail operations and consist of payroll, occupancy, advertising and other operating costs, as well as pre-opening costs, which are expensed as incurred. As a percentage of sales, selling expenses were 36.8% and 35.2% for the thirteen weeks ended April 2, 2011 and April 3, 2010, respectively. Included in selling expenses for the thirteen weeks ended April 2, 2011 and April 3, 2010 are purchase accounting costs of $3.5 million and $3.6 million respectively, consisting primarily of the amortization of intangible assets. These costs were not allocated to our segments.
Retail Selling Expenses
Retail selling expenses increased 4.3% to $41.1 million for the thirteen weeks ended April 2, 2011 from $39.4 million for the thirteen weeks ended April 3, 2010. As a percentage of retail sales, retail selling expenses were 55.0% and 53.5% for the thirteen weeks ended April 2, 2011 and April 3, 2010, respectively. The increase in retail selling expenses in dollars was primarily related to selling expenses incurred in the new Yankee Candle retail stores opened in 2011 and 2010, which together represented approximately $1.7 million.
The increase in retail selling expenses as a percentage of sales was primarily related to the de-leveraging of selling expenses as a result of decreased comparative store sales which increased selling expense as a rate of sales by approximately 1.0% and selling expenses incurred in the new Yankee Candle retail stores opened in 2011 and 2010 which had a negative impact of 0.3%.
Wholesale Selling Expenses
Wholesale selling expenses increased 12.3% to $3.2 million for the thirteen weeks ended April 2, 2011 from $2.9 million for the thirteen weeks ended April 3, 2010. These expenses relate to payroll, advertising and other operating costs. As a percentage of wholesale sales, wholesale selling expenses were 6.8% and 5.6% for the thirteen weeks ended April 2, 2011 and April 3, 2010, respectively. The increase in selling expenses and as a percentage of sales was attributable to increased marketing costs of approximately $0.4 million.
International Selling Expenses
International selling expenses increased 41.9% to $5.2 million for the thirteen weeks ended April 2, 2011 from $3.7 million for the thirteen weeks ended April 3, 2010. These expenses relate to payroll, advertising and other operating costs. As a percentage of international sales, international selling expenses were 23.9% and 22.2% for the thirteen weeks ended April 2, 2011 and April 3, 2010, respectively. The increase in selling expenses and as a percentage of sales is attributable to increased commissions, labor and other selling costs related to the revenue growth.
General and Administrative Expenses
General and administrative expenses, which are shown in our unallocated, corporate and other column within our segment footnote, consist primarily of personnel–related costs including senior management, accounting, information systems, human resources, legal, marketing, management incentive programs and bonus and other costs that are not readily allocable to either the retail or wholesale operations. General and administrative expenses increased approximately 11.5% to $18.6 million for the thirteen weeks ended April 2, 2011 from $16.7 million for the thirteen weeks ended April 3, 2010. As a percentage of sales, general and administrative expenses were approximately 12.9% and 11.8% for the thirteen weeks ended April 2, 2011 and April 3, 2010, respectively.
The general and administrative expenses of $18.6 million for the thirteen weeks ended April 2, 2011 includes the $3.0 million paid to Class B and Class C common unit holders in February 2011 in connection with the issuance of the Senior PIK Notes by YCC Holdings and Yankee Finance. Excluding such expenses, general and administrative costs were favorable by $1.1 million and as a percentage of sales were 10.8% and 11.8% for the thirteen weeks ended April 2, 2011 and April 3, 2010 respectively.
Interest and Other Expense, Net
The Company’s interest and other expense, net which is shown in our unallocated, corporate and other column within our segment footnote was $15.8 million for the thirteen weeks ended April 2, 2011 compared to $24.5 million for the thirteen weeks ended April 3, 2010. The primary component of this expense is interest expense, which was $17.7 million and $19.8 million for the thirteen weeks ended April 2, 2011 and April 3, 2010, respectively. The decrease in interest expense is primarily related to lower average borrowings in the first quarter of fiscal 2011 versus the prior year quarter.
Changes in the fair value of the Company’s derivative contracts are recognized in the condensed consolidated statement of operations. During the thirteen weeks ended April 2, 2011, the Company recognized a gain of $1.4 million related to derivative contracts. During the thirteen weeks ended April 3, 2010, the Company recognized $4.8 million in expense related to derivative contracts.
Benefit from Income Taxes
The benefit from income taxes for the Company for the thirteen weeks ended April 2, 2011 was $2.9 million compared to $4.7 million for the thirteen weeks ended April 3, 2010. The effective tax rate decreased to 35.5% from 36.2% for the thirteen weeks ended April 2, 2011 and April 3, 2010, respectively. The decrease in the effective tax rate primarily relates to a decrease in state tax rates.
Loss from Discontinued Operations, Net of Tax
During 2009, we discontinued the operations of our Illuminations and Aroma Naturals businesses. Accordingly, the Company has classified the results of operations of the Illuminations and Aroma Naturals businesses as discontinued operations for all periods presented. The loss from discontinued operations, net of income taxes was $0.1 million and $0.3 million for the thirteen weeks ended April 2, 2011 and April 3, 2010, respectively.
LIQUIDITY AND CAPITAL RESOURCES
Senior Secured Credit Facility
Yankee Candle’s senior secured credit facility (the “Credit Facility”) consists of a $650.0 million 7–year senior term loan facility (“Term Facility”) and a 6–year $125.0 million senior secured revolving credit facility (“Revolving Facility”). All borrowings under Yankee Candle’s Credit Facility bear interest at a rate per annum equal to an applicable margin, plus, at Yankee Candle’s option, (i) the higher of (x) the prime rate (as set forth on the British Banking Association Telerate Page 5) and (y) the federal funds effective rate, plus one-half percent (0.50%) per annum or (ii) the Eurodollar rate, and resets periodically. In addition to paying interest on outstanding principal under Yankee Candle’s Credit Facility, the Company is required to pay a commitment fee to the lenders in respect of unutilized loan commitments at a rate of 0.50% per annum. The Term Facility matures on February 6, 2014 and the Revolving Facility matures on February 6, 2013.
As of April 2, 2011, Yankee Candle had outstanding letters of credit of $1.7 million and $58.0 million outstanding under its Revolving Facility, leaving $65.3 million in availability under the Revolving Facility. On April 21, 2011, the Company entered into a Joinder Agreement to the Revolving Facility which provided a total of $15.0 million in new revolving loan commitments increasing Yankee Candle’s total revolving loan capacity under the Revolving Facility from $125.0 million to $140.0 million. As of April 2, 2011, the Company was in compliance with all covenants under the Credit Facility. The Company believes that based on its current projections for fiscal 2011 it will continue to be in compliance with its financial covenants during 2011.
The Company uses interest rate swaps to eliminate the variability of a portion of cash flows associated with the forecasted interest payments on its Term Facility. This is achieved through converting a portion of the floating rate Term Facility to a fixed rate by entering into pay-fixed interest rate swaps. During the second quarter of 2009 the Company changed the interest rate election on its Term Facility from the three-month LIBOR rate to the one-month LIBOR rate. As a result, its existing interest rate swaps were de-designated as cash flow hedges and it no longer accounts for these instruments using hedge accounting with changes in fair value recognized in the condensed consolidated statement of operations. The unrealized loss included in other comprehensive income “OCI” on the date the Company changed its interest rate election was amortized to other expense over the remaining terms of the two interest rate swap agreements. One of the swap agreements expired in March of 2010 and the other expired in March of 2011. The unrealized loss was fully amortized as of April 2, 2011.
Simultaneous with the de-designations, Yankee Candle entered into new interest rate swap agreements to further reduce the variability of cash flows associated with the forecasted interest payments on its Term Facility. These swaps were not designated as cash flow hedges and, were measured at fair value with changes in fair value recognized in the condensed consolidated statement of operations as a component of other income (expense). One of the swap agreements expired in March of 2010 and the other expired in March of 2011.
During the second and third quarters of 2009, Yankee Candle also entered into forward starting amortizing interest rate swaps in the aggregate notional amount of $320.7 million or 82.6% of its term debt with a blended fixed rate of 3.49% to eliminate the variability in future interest payments by having the Company pay fixed-rate amounts in exchange for receipt of floating-rate interest payments. The effective date of the forward starting swaps was March 31, 2011, of which there are no settlements required until after that date. The forward starting swaps are not designated as cash flow hedges and, are measured at fair value with changes in fair value recognized in the condensed consolidated statements of operations as a component of other income (expense). The forward starting swap agreements terminate in March 2013.
All obligations under the Credit Facility are guaranteed by the Company and each of the Company’s existing and future domestic subsidiaries. In addition, the senior secured credit facility is secured by first priority perfected liens on all of the Company’s capital stock and substantially all of the Company’s existing and future material assets and the existing and future material assets of the Company’s guarantors, except that only up to 66% of the voting capital stock of the first tier foreign subsidiaries and 100% of the non–voting capital stock of such foreign subsidiaries will be pledged in favor of the senior secured credit facility and each of the guarantor’s assets.
The Credit Facility permits all or any portion of the loans outstanding to be prepaid at any time and commitments to be terminated in whole or in part at the Yankee Candle’s option without premium or penalty. Yankee Candle is required to repay amounts borrowed under the Term Facility in equal quarterly installments in an aggregate annual amount equal to one percent (1.0%) of the original principal amount of the Term Facility with the balance being payable on the maturity date of the Term Facility.
Subject to certain exceptions, the Credit Facility requires that 100% of the net proceeds from certain asset sales, casualty insurance, condemnations and debt issuances, and 50% (subject to step downs) from excess cash flow, as defined, for each fiscal year must be used to pay down outstanding borrowings. The calculation to determine if the Company has excess cash flow per the Credit Facility is on an annual basis at the end of each fiscal year.
Consolidated Adjusted EBITDA Ratio
Yankee Candle’s Credit Facility contains a financial covenant which requires that Yankee Candle maintain at the end of each fiscal quarter, commencing with the quarter ended January 2, 2010 through the quarter ending April 2, 2011, a consolidated total secured debt (net of cash and cash equivalents not to exceed $30.0 million) to consolidated Adjusted EBITDA ratio of no more than 3.25 to 1.00. The consolidated total secured debt to consolidated Adjusted EBITDA ratio will step down to no more than 2.75 to 1.00 for the fourth quarter ending December 31, 2011. As of April 2, 2011, Yankee Candle’s actual secured leverage ratio was 2.31 to 1.00, as defined. As of April 2, 2011, total secured debt (including the Company’s capital lease obligations of $2.2 million) was approximately $444.3 million (net of $4.0 million in cash). Under Yankee Candle’s Credit Facility, consolidated Adjusted EBITDA is defined as net income plus, interest, taxes, depreciation and amortization, further adjusted to add back extraordinary, unusual or non-recurring losses, non-cash stock option expense, fees and expenses related to the Merger, fees and expenses under the Management Agreement with our equity sponsor, restructuring charges or reserves, as well as other non-cash charges, expenses or losses, and further adjusted to subtract extraordinary, unusual or non-recurring gains, other non-cash income or gains, and certain cash contributions to our common equity. Set forth below is a reconciliation of the Company’s Consolidated Adjusted EBITDA, as calculated under Yankee Candle’s Credit Facility, to EBITDA and net income for the four quarters ended April 2, 2011 (in thousands):
|
Net income
|
$ | 45,063 | ||
|
Income tax expense
|
25,452 | |||
|
Interest expense, net (excluding amortization of deferred financing fees)
|
71,516 | |||
|
Depreciation and amortization
|
42,511 | |||
|
EBITDA
|
184,542 | |||
|
Equity-based compensation expense
|
3,926 | |||
|
Restructuring charges
|
29 | |||
|
Fees paid pursuant to management agreement
|
1,500 | |||
|
Other non-cash expenses
|
1,988 | |||
|
|
||||
|
Consolidated Adjusted EBITDA under the Credit Facility
|
$ | 191,985 |
Yankee Candle’s Credit Facility also contains certain other limitations on Yankee Candle’s and certain of Yankee Candle’s restricted subsidiaries’, as defined in Yankee Candle’s credit agreement related to its Credit Facility, ability to incur additional debt, guarantee other obligations, grant liens on assets, make investments or acquisitions, dispose of assets, make optional payments or modifications of other debt instruments, pay dividends or other payments on capital stock, engage in mergers or consolidations, enter into sale and leaseback transactions, enter into arrangements that restrict the Company’s ability to pay dividends or grant liens and engage in transactions with affiliates.
Yankee Candle’s Consolidated Adjusted EBITDA ratio is a material component of Yankee Candle’s Credit Facility. Non-compliance with the maximum Consolidated Adjusted EBITDA ratio could prevent Yankee Candle from borrowing under its Revolving Facility and would result in a default under the credit agreement related to Yankee Candle’s Credit Facility. If there were an event of default under the credit agreement related to Yankee Candle’s Credit Facility that was not cured or waived, the lenders under Yankee Candle’s Credit Facility could cause all amounts outstanding under Yankee Candle’s Credit Facility to be due and payable immediately, which would have a material adverse effect on the Company’s financial position and cash flows.
Cash Flows and Funding of our Operations
Our cash includes interest-bearing and non-interest bearing accounts. We maintain cash balances at several financial institutions. Cash as of April 2, 2011, was $4.0 million compared to $12.7 million as of January 2, 2010. Cash used in operating activities for the thirteen weeks ended April 2, 2011 was $63.5 million as compared to cash used in operations of $27.6 million for the thirteen weeks ended April 3, 2010. Cash used in operating activities during the thirteen weeks ended April 2, 2011 includes total payments of $19.2 million for taxes primarily related to fiscal 2010 and cash paid for interest of $28.2 million. Cash used in operating activities during the thirteen weeks ended April 3, 2010 includes total payments of $0.8 million for taxes primarily related to fiscal 2009 and cash paid for interest of $30.4 million
Net cash used in investing activities was $4.1 million and $2.7 million for the thirteen weeks ended April 2, 2011 and April 3, 2010 respectively and was used for the purchase of property and equipment, primarily related to new stores, store renovations and supply chain initiatives.
Net cash provided by financing activities for the Company for the thirteen weeks ended April 2, 2011, was $58.9 million, of which $58.0 million is related to borrowings under Yankee Candle’s Revolving Facility. Net cash provided by financing activities was $25.4 million for the thirteen weeks ended April 3, 2010, of which $26.0 million was related to net borrowings under Yankee Candle’s Revolving Facility. The fluctuation in financing activities year over year relates to increased borrowings in the first quarter of fiscal 2011 primarily related to the payment of income taxes.
The Company funds its operations through a combination of internally generated cash from operations and from borrowings under Yankee Candle’s Credit Facility. The Company’s primary uses of cash are working capital requirements, new store expenditures, new store inventory purchases and debt service requirements. The Company anticipates that cash generated from operations together with amounts available under Yankee Candle’s Credit Facility will be sufficient to meet its future working capital requirements, new store expenditures, new store inventory purchases and debt service obligations as they become due over the next twelve months. However, the Company’s ability to fund future operating expenses and capital expenditures and its ability to make scheduled payments of interest on, to pay principal on or refinance indebtedness and to satisfy any other present or future debt obligations will depend on future operating performance which will be affected by general economic, financial and other factors beyond our control. While we have limited visibility to the 2011 retail environment, based upon current trends and our budget expectations we remain confident that for the foreseeable future we will have sufficient cash flow and liquidity to fund our working capital requirements and meet our debt service obligations. In addition, borrowings under Yankee Candle’s Credit Facility are dependent upon our continued compliance with the financial and other covenants contained therein.
Due to the seasonality of the business, we typically do not generate positive cash flow from operations through the first three quarters of our fiscal year. As such, we draw on the revolver portion of Yankee Candle’s Credit Facility during these times to fund operations. In the fourth quarter, these borrowings are typically repaid in full using cash generated from operations during the fourth quarter holiday season. We typically reach our peak borrowings during the latter part of the third quarter. In fiscal 2010 Yankee Candle’s peak borrowings was $76.0 million. We review and forecast our cash flow on a daily basis for the current year and on a quarterly basis for the upcoming year to ensure we have adequate liquidity to fund our business. We believe that we will, for the foreseeable future, be able to meet our debt service obligations, fund our working capital requirements, fund our capital expenditures and be in compliance with our covenants under Yankee Candle’s Credit Facility.
|
Item 3.
|
Quantitative and Qualitative Disclosures About Market Risk
|
Our market risks relate primarily to changes in interest rates. At April 2, 2011, the Company had $446.1 million of floating rate debt and $513.0 million of fixed rate debt. For fixed rate debt, interest rate changes affect the fair market value, but do not impact earnings or cash flows. Conversely for floating rate debt, interest rate changes do not affect the fair market value but do impact future earnings and cash flows, assuming other factors are held constant. The $446.1 million outstanding under Yankee Candle’s Credit Facility bears interest at variable rates. All borrowings under Yankee Candle’s Credit Facility bear interest at a rate per annum equal to an applicable margin, plus, at Yankee Candle’s option, (i) the higher of (a) the prime rate (as set forth on the British Banking Association Telerate Page 5) and (b) the federal funds effective rate, plus one-half percent (0.50%) per annum or (ii) the Eurodollar rate, and resets periodically. As of April 2, 2011, the weighted average combined interest rate on Yankee Candle’s Term Facility and Revolving Facility was 2.21%. Yankee Candle’s Credit Facility is intended to fund operating needs. Because Yankee Candle’s Credit Facility bears a variable interest rate based on market indices, our results of operations and cash flows will be exposed to changes in interest rates.
The variable nature of our obligations under Yankee Candle’s Credit Facility creates interest rate risk. In order to mitigate this risk we use interest rate swaps to manage the variability of a portion of cash flows associated with the forecasted interest payments on Yankee Candle’s Term Facility. This is achieved through converting a portion of the floating rate Term Facility to a fixed rate by entering into pay-fixed interest rate swaps. In essence, Yankee Candle converted its Term Facility, which is floating-rate debt, to a fixed-rate up to the aggregate notional value of the swaps by paying fixed-rate amounts in exchange for the receipt of floating-rate interest payments. As of April 2, 2011, the aggregate notional value of the swaps was $320.7 million, or 82.6% of Yankee Candle’s Term Facility, resulting in a blended fixed rate of 3.49%. Based on Yankee Candle’s outstanding floating rate debt and the notional amount of our interest rate swaps, as of April 2, 2011, a 1.0% increase or decrease in current market interest rates would have the effect of causing an approximately $1.3 million additional annual pre–tax charge or benefit to the Company’s results of operations.
We buy a variety of raw materials for inclusion in our products. The only raw material that is considered to be of a commodity nature is wax. Wax is a petroleum based product. Its market price has not historically fluctuated with the movement of oil prices and has instead generally moved with inflation. However, in the past several years the price of wax has increased at a rate significantly above the rate of inflation. Future increases in wax prices could have an adverse affect on our cost of goods sold and could lower our margins.
|
Item 4.
|
Controls and Procedures
|
Disclosure Controls and Procedures
The Company’s management, with the participation of its chief executive officer and chief financial officer, evaluated the effectiveness of our disclosure controls and procedures as of April 2, 2011. The term “disclosure controls and procedures,” as defined in Rules 13a-15(e) and 15d-15(e) under the Exchange Act, means controls and other procedures of a company that are designed to ensure that information required to be disclosed by a company in the reports that it files or submits under the Exchange Act is recorded, processed, summarized and reported, within the time periods specified in the SEC’s rules and forms. Disclosure controls and procedures include, without limitation, controls and procedures designed to ensure that information required to be disclosed by a company in the reports that it files or submits under the Exchange Act is accumulated and communicated to the company’s management, including its principal executive and principal financial officers, as appropriate to allow timely decisions regarding required disclosure. Management recognizes that any controls and procedures, no matter how well designed and operated, can provide only reasonable assurance of achieving their objectives and management necessarily applies its judgment in evaluating the cost-benefit relationship of possible controls and procedures. Based on the evaluation of our disclosure controls and procedures as of April 2, 2011, the Company’s chief executive officer and chief financial officer concluded that, as of such date, our disclosure controls and procedures were effective at the reasonable assurance level.
Changes in Internal Control Over Financial Reporting
No change in our internal control over financial reporting (as defined in Rules 13a–15(f) and 15d–15(f) under the Exchange Act) occurred during the fiscal quarter ended April 2, 2011 that has materially affected, or is reasonably likely to materially affect, the Company’s internal control over financial reporting.
PART II. OTHER INFORMATION
|
Legal Proceedings
|
In August 2009, in connection with the Linens 'N Things bankruptcy proceedings, Linens Holding Co. and its affiliates ("Linens") filed a lawsuit against Yankee Candle in United States Bankruptcy Court in the District of Delaware alleging that pursuant to the United States Bankruptcy Code Linens is entitled to recover from the Company the certain amounts on the basis that they constitute "preferential transfers" under the Code. On April 4, 2011, the bankruptcy court approved a settlement of this matter, under which the Company paid $0.2 million.
We are also party to various other litigation matters, in most cases involving ordinary and routine claims incidental to our business. We cannot estimate with certainty our ultimate legal and financial liability with respect to such pending litigation matters. However, we believe, based on our examination of such matters, that our ultimate liability will not have a material adverse effect on our financial position, results of operations or cash flows.
|
Item 1A.
|
Risk Factors
|
This report on Form 10-Q contains forward-looking statements. Statements that are not historical or current facts, including statements about our expectations, anticipated financial results, projected capital expenditures, and future business prospects, are forward-looking statements. You can identify these statements by our use of words such as “may,” “will,” “expect,” “believe,” “should,” “plan,” “anticipate,” and other similar expressions. You can find examples of these statements throughout this report, including “Item 2. Management’s Discussion and Analysis of Financial Condition and Results of Operations.” There are a number of factors that might cause our actual results to differ significantly from the results reflected by the forward-looking statements contained herein. You should review carefully the risk factors listed in “Item 1A. Risk Factors” in Yankee Holdings’ 2010 Form 10-K, as well as those factors listed in other documents we file with the Securities and Exchange Commission. In addition, you should consider the following factors before investing in the Company. We do not assume an obligation to update any forward-looking statement.
Risks Relating to Our Business
The current economic conditions and uncertain future outlook, including the credit and liquidity crisis in the financial markets and the continued deterioration in consumer confidence and spending, may continue to negatively impact our business and results of operations.
As widely reported, since the latter part of 2008 financial and credit markets in the United States and globally have experienced significant volatility and disruption, which has resulted in, among other things, diminished liquidity and credit availability and a widespread reduction in business activity and consumer spending and confidence. Since 2008, these economic conditions have negatively impacted our business and our results of operations and continue to do so. Any continuation or deterioration in the current economic conditions, or any prolonged global, national or regional recession, may materially adversely affect our results of operations and financial condition.
These economic developments affect businesses such as ours in a number of ways. The current adverse market conditions, including the tightening of credit in financial markets, negatively impacts the discretionary spending of our consumers and may result in a decrease in sales or demand for our products. Similarly, these conditions may negatively impact the financial and operating condition of our wholesale customer base, or their ability to obtain credit, either of which in turn could cause them to reduce or delay their purchases of our products and increase our exposure to losses from bad debts. These conditions could also increase the likelihood that one or more of our wholesale customers may file for bankruptcy or similar protection from creditors, which also may result in a loss of sales and increase our exposure to bad debt.
From a financing perspective, we believe that we currently have sufficient liquidity to support the ongoing activities of our business, service our existing debt and invest in future growth opportunities. While the existing conditions have therefore not currently impacted our ability to finance our operations, the continuation or further tightening of the credit markets may adversely affect our ability to access the credit market and to obtain any additional financing or refinancing on satisfactory terms or at all.
We are unable to predict the likely duration and severity of the ongoing economic downturn in the United States and the economies of other countries, nor are we able to predict the long-term impact of these conditions on our operations.
Many aspects of our manufacturing and distribution facilities are customized for our business; as a result, the loss of one of these facilities would materially disrupt our operations.
Approximately 77% of our gross sales for the thirteen weeks ended April 2, 2011 were generated by products we manufactured at our manufacturing facility in Whately, Massachusetts and we rely primarily on our distribution facilities in South Deerfield, Massachusetts to distribute our products. Because most of our machinery is designed or customized by us to manufacture our products, and because we have strict quality control standards for our products, the loss of our manufacturing facility, due to natural disaster or otherwise, would materially affect our operations. Similarly, our distribution facilities rely upon customized machinery, systems and operations, the loss of which would materially affect our operations. Although our manufacturing and distribution facilities are adequately insured, if our facilities were destroyed we believe it would take up to twelve months to resume operations at a level equivalent to current operations.
It will be difficult to maintain our historical growth rates. If we fail to grow our business as planned, our future operating results may suffer.
We intend to continue to pursue a long-term business strategy of increasing sales and earnings by expanding our retail and wholesale operations both in the United States and internationally. However, our ability to grow these operations in the short-term may be negatively impacted by the current economic conditions. Our ability to implement our long-term growth strategy successfully will also be dependent in part on several factors beyond our control, including economic conditions, consumer preferences, and the competitive environment in the markets in which we compete, and we may not be able to achieve our planned growth or sustain our financial performance. Our ability to anticipate changes in the candle, home fragrance and giftware industries, and identify industry trends, will be critical factors in our ability to remain competitive.
We expect that it will become more difficult to maintain our historical growth rate, which could negatively impact our operating margins and results of operations. New stores typically generate lower operating margin contributions than mature stores because (i) fixed costs, as a percentage of sales, are higher and (ii) pre-opening costs are fully expensed in the year of opening. In addition, our retail sales generate lower segment margins than our wholesale sales. Over the past several years, our wholesale business has grown by increasing sales to existing customers and by adding new customers. If we are not able to continue this, our sales and profitability could be adversely affected. In addition, as we expand our wholesale business into new channels of trade that we believe to be appropriate, sales in some of these new channels may, for competitive reasons within the channels, generate lower margins than do our existing wholesale sales. Similarly, as we continue to broaden our product offerings in order to meet consumer demand, we may do so in part by adding products that have lower product margins than those of our core candle products.
Further increases in wax prices above the rate of inflation may negatively impact our cost of goods sold and margins. Any shortages in refined oil supplies could impact our wax supply.
In the past several years significant increases in the price of crude oil have adversely impacted our transportation and freight costs and have contributed to significant increases in the cost of various raw materials, including wax, which is a petroleum-based product. These price increases were significant in 2010 and we have already incurred additional wax price increases in 2011. This in turn negatively impacts our cost of goods sold and margins. In addition, we believe that rising oil prices and corresponding increases in raw materials and transportation costs negatively impact not only our business but consumer sentiment and the economy at large. Continued weakness in consumer confidence and the macro-economic environment could negatively impact our sales and earnings. Future significant increases in wax prices could have an adverse affect on our cost of goods sold and could lower our margins.
In addition to the impact of increased wax prices, any shortages in refined oil supplies may impact our wax supply. The closing or disruption of oil refineries could significantly limit our ability to source wax and negatively impact our operations. While we experienced no supply issues in 2010, any future prolonged interruption or reduction in wax supplies could negatively impact our operations, sales and earnings.
We face significant competition in the giftware industry. This competition could cause our revenues or margins to fall short of expectations which could adversely affect our future operating results, financial condition, liquidity and our ability to continue to grow our business.
We compete generally for the disposable income of consumers with other producers and retailers in the giftware industry. The giftware industry is highly competitive with a large number of both large and small participants and relatively low barriers to entry.
Our products compete with other scented and unscented candle, home fragrance and personal care products and with other gifts within a comparable price range, like boxes of candy, flowers, wine, fine soap and related merchandise. Our retail stores compete primarily with specialty candle retailers and a variety of other retailers including department stores, gift stores and national specialty retailers that carry candles along with personal care items, giftware and houseware. In addition, while we focus primarily on the premium scented candle segment, scented and unscented candles are also sold outside of that segment by a variety of retailers, including mass merchandisers. In our wholesale business, we compete with numerous manufacturers and importers of candles, home fragrance products and other home decor and gift items for the limited space available in our wholesale customer locations for the display and sale of such products to consumers. Some of our competitors are part of large, diversified companies which have greater financial resources and a wider range of product offerings than we do. Many of our competitors source their products from low cost manufacturers outside of the United States. This competitive environment could adversely affect our future revenues and profits, financial condition and liquidity and our ability to continue to grow our business.
A material decline in consumers’ discretionary income could cause our sales and income to decline.
Our results depend on consumer spending, which is influenced by general economic conditions and the availability of discretionary income. Accordingly, we may experience declines in sales during periods of significant economic volatility and disruption such as the one we are currently experiencing, or during other economic downturns or periods of uncertainty like that which followed the September 11, 2001 terrorist attacks on the United States or which result from the threat of war or the possibility of further terrorist attacks. Any material decline in the amount of discretionary spending could have a material adverse effect on our sales and income.
Current environmental laws and regulations, or those enacted in the future, could result in additional liabilities and costs.
The manufacturing of our products may require the use of materials that are subject to a variety of environmental, health and safety laws and regulations. For example, various federal and state agencies regulate the petroleum used to produce our wax products and certain ingredients contained in our fragrance oils. Compliance with these laws and regulations could increase our costs and impact the availability of components required to manufacture our products. Violation of these laws and regulations may subject us to significant fines, penalties or disposal costs, which could negatively impact our results of operations, financial position or cash flows.
We may be unable to continue to open new stores successfully or renew leases for existing locations.
Our retail strategy depends in large part on our ability to successfully open new stores in both existing and new geographic markets. For our strategy to be successful, we must identify and lease favorable store sites on favorable economic terms, hire and train managers and associates and adapt management and operational systems to meet the needs of our expanded operations. These tasks may be difficult to accomplish successfully and any changes in the availability of suitable real estate locations on acceptable terms could adversely impact our retail growth. If we are unable to open new stores as quickly as planned or at all, then our future sales and profits could be materially adversely affected. Even if we succeed in opening new stores, these new stores may not achieve the same sales or profit levels as our existing stores. Also, our retail strategy includes opening new stores in markets where we already have a presence so we can take advantage of economies of scale in marketing, distribution and supervision costs, or the opening of new malls or lifestyle centers in the market. However, these new stores may result in the loss of sales in existing stores in nearby areas, thereby negatively impacting our comparable store sales. A decrease in our retail comparable store sales will have an adverse impact on our cash flows and earnings. This is due to the fact that a significant portion of our expenses are comprised of fixed costs, such as lease payments, and our ability to decrease expenses in response to negative comparable store sales is limited in the short term. Our retail strategy also depends upon our ability to successfully renew the expiring leases of our profitable existing stores. If we are unable to do so at planned levels and upon favorable economic terms, then our future sales and profits could be negatively affected.
The loss or significant deterioration in the financial condition of a significant wholesale customer, or a bankruptcy filing and subsequent bankruptcy proceedings by such a customer, could negatively impact our sales and operating results.
The loss or significant deterioration in the financial condition of one of our major customers could have a material adverse effect on our sales, profitability and cash flow to the extent that we are unable to offset any revenue losses with additional revenue from existing customers or by opening new accounts. We continually monitor and evaluate the credit status of our customers and attempt to adjust trade and credit terms as appropriate. Given the current economic environment, there is an increased risk that wholesale customers could be forced to cease or significantly reduce their purchases from us. The loss of one or more significant wholesale customers, or a significant reduction in their operations, could materially adversely impact our results of operations and financial condition. In addition, in the event that one of our significant wholesale customers files for bankruptcy protection, there are various potential claims that may arise in connection therewith that, if filed and adversely decided, could potentially negatively impact our operating results and financial condition.
The failure or delay of a third party to supply goods to our customers could adversely impact our business.
For certain of our operations, we rely on third-party vendors to supply goods to our customers. The failure of such vendors to deliver our goods in a timely or appropriate manner could adversely impact our customer relationships, which would adversely impact our business. For example, we currently utilize a third party fulfillment provider for the Fundraising business and the Consumer Direct business. This party recently experienced difficulty in timely delivering goods to our Fundraising business and Consumer Direct business customers. Delays such as these or other problems encountered by our third-party vendors could have an adverse effect on our business, including our reputation and ability to grow our operations as planned.
Sustained interruptions in the supply of products from overseas may affect our operating results.
We source various accessories and other products from Asia. A sustained interruption of the operations of our suppliers, as a result of economic difficulties, the impact of global shipping capacity constraints, the impact of health epidemics, natural disasters or other factors, could have an adverse effect on our ability to receive timely shipments of certain of our products, which might in turn negatively impact our sales and operating results.
Counterparties to the Credit Facility and interest rate swaps may not be able to fulfill their obligations due to disruptions in the global financial and credit markets.
As a result of concerns about the stability of the financial and credit markets and the strength of counterparties during this challenging global macroeconomic environment, many financial institutions have reduced, and in some instances ceased to provide, funding to borrowers. Based upon information available to us, we have no indication that financial institutions syndicated under the Company’s Revolving Facility would be unable to fulfill their commitments to us. However, if certain counterparties were to become unable to fulfill those obligations, it may adversely affect our results of operations, financial condition and liquidity.
Additionally, we have entered into interest rate swap agreements to hedge the variability of interest payments associated with the Credit Facility. We may be exposed to losses in the event of nonperformance by counterparties on these instruments. Continued turbulence in the global credit markets and the U.S. economy may adversely affect our results of operations and financial condition.
Because we are not a diversified company and are primarily dependent upon one industry, we have less flexibility in reacting to unfavorable consumer trends, adverse economic conditions or business cycles.
We rely primarily on the sale of premium scented candles and related products in the giftware industry. In the event that sales of these products decline or do not meet our expectations, we cannot rely on the sales of other products to offset such a shortfall. As a significant portion of our expenses is comprised of fixed costs, such as lease payments, our ability to decrease expenses in response to adverse business conditions is limited in the short term. As a result, unfavorable consumer trends, adverse economic conditions or changes in the business cycle could have a material and adverse impact on our earnings.
If we lose our senior executive officers, or are unable to attract and retain the talent required for our business, our business could be disrupted and our financial performance could suffer.
Our success is in part dependent upon the retention of our senior executive officers. If our senior executive officers become unable or unwilling to participate in our business, our future business and financial performance could be materially affected. In addition, as our business grows in size and complexity we must be able to continue to attract, develop and retain qualified personnel sufficient to allow us to adequately manage and grow our business. If we are unable to do so, our operating results could be negatively impacted. We cannot guarantee that we will be able to attract and retain personnel as and when necessary in the future.
In the past we have been required to recognize a pre-tax, non-cash impairment charge related to goodwill and other intangible assets, and we may be required to recognize additional impairment charges against goodwill or intangible assets in the future.
At April 2, 2011, the net carrying value of our goodwill and intangible assets totaled approximately $643.6 million and $281.8 million, respectively. Our amortizing intangible assets are subject to impairment testing in accordance with the Property Plant and Equipment Topic of the Accounting Standards Codification (the “ASC”), and our non-amortizing goodwill and trade names are subject to impairment tests in accordance with the Intangibles, Goodwill and Other Topic of the ASC. We review the carrying value of our intangible assets and goodwill for impairment whenever events or circumstances indicate that their carrying value may not be recoverable, at least annually for our goodwill and trade names. Significant negative industry or economic trends, including disruptions to our business, unexpected significant changes or planned changes in the use of our intangible assets, and mergers and acquisitions could result in an impairment charge for any of our intangible assets, goodwill or other long-lived assets.
In the impairment analyses we used certain estimates and assumptions, including a combination of market-based and income-based approaches, each of which were weighted at 50% for the impairment test performed as of November 6, 2010. The market-based approach estimates fair value by applying multiples of potential earnings, such as EBITDA and revenue, of publicly traded comparable companies. We believe this approach is appropriate because it provides a fair value using multiples from companies with operations and economic characteristics similar to our reporting units. The income-based approach is based on projected future debt-free cash flow that is discounted to present value using factors that consider the timing and risk of the future cash flows. We believe this approach is appropriate because it provides a fair value estimate based upon the reporting units expected long-term operations and cash flow performance. The income-based approach is based on future projections of operating results and cash flows. These projections are discounted to present value using a weighted average cost of capital for market participants, who are generally thought to be industry participants. The future projections are based on both past performance and the projections and assumptions used in our current operating plan. Such assumptions are subject to change as a result of changing economic and competitive conditions and could result in additional impairment charges. Further, if the economic market conditions were to worsen and our estimated future discounted cash flows decrease further we may incur additional impairment charges. Additional impairment charges related to our goodwill, tradenames or other intangible assets could have a significant impact on our financial position and results of operations.
Our international operations subject us to a number of risks, including unfavorable regulatory, labor, tax and political conditions in foreign countries.
Sales from our international operations were $22.3 million for the thirteen weeks ended April 2, 2011, and were primarily generated in Europe. As a result, we are subject to the legal, political, social and regulatory requirements and economic conditions of many jurisdictions other than the United States. Risks inherent to maintaining international operations, include, but are not limited to, the following:
|
|
•
|
withholding taxes or other taxes on our foreign income, tariffs or other restrictions on foreign trade and investment, including currency exchange controls imposed by or in other countries;
|
|
|
•
|
the inability to obtain, maintain or enforce intellectual property rights in other jurisdictions, at a reasonable cost or at all;
|
|
|
•
|
difficulty with staffing and managing widespread operations;
|
|
|
•
|
trade barriers such as export requirements, tariffs, taxes and other restrictions and expenses, which could increase the prices of our products and make our product offering less competitive in some countries; and
|
|
|
•
|
our establishing ourselves and becoming tax resident in foreign jurisdictions.
|
Our business in foreign markets requires us to respond to rapid changes in market conditions in these countries. Our overall success in these international markets depends, in part, on our ability to succeed under differing legal, regulatory, economic, social and political conditions. There can be no assurance that we will be able to develop, implement and maintain policies and strategies that will be effective in each location where we do business. As a result of any of the foregoing factors, our financial condition, results of operations, business and/or prospects could be materially adversely affected.
Seasonal, quarterly and other fluctuations in our business, and general industry and market conditions, could affect the market for our results of operations.
Our sales and operating results vary from quarter to quarter. We have historically realized higher sales and operating income in our fourth quarter, particularly in our retail business, which accounts for a larger portion of our sales. We believe that this has been due primarily to an increase in giftware industry sales during the holiday season of the fourth quarter. In addition, in anticipation of increased holiday sales activity, we incur certain significant incremental expenses, including the hiring of a substantial number of temporary employees to supplement our existing workforce. As a result of this seasonality, we believe that quarter to quarter comparisons of our operating results are not necessarily meaningful and that these comparisons cannot be relied upon as indicators of future performance. In addition, we may also experience quarterly fluctuations in our sales and income depending on various factors, including, among other things, the number of new retail stores we open in a particular quarter, changes in the ordering patterns of our wholesale customers during a particular quarter, pricing and promotional activities of our competitors, and the mix of products sold. Most of our operating expenses, such as rent expense, advertising and promotional expense and employee wages and salaries, do not vary directly with sales and are difficult to adjust in the short term. As a result, if sales for a particular quarter are below our expectations, we might not be able to proportionately reduce operating expenses for that quarter, and therefore a sales shortfall could have a disproportionate effect on our operating results for that quarter. Further, our comparable store sales from our retail business in a particular quarter could be adversely affected by competition, the opening nearby of new retail stores or wholesale locations, economic or other general conditions or our inability to execute a particular business strategy. As a result of these factors, we may report in the future sales, operating results or comparable store sales that do not match the expectations of analysts and investors. This could cause the price of the notes to decline.
Other factors may also cause our actual results to differ materially from our estimates and projections.
In addition to the foregoing, there are other factors which may cause our actual results to differ materially from our estimates and projections. Such factors include the following:
|
|
•
|
changes in the general economic conditions in the United States including, but not limited to, consumer debt levels, financial market performance, interest rates, consumer sentiment, inflation, commodity prices, unemployment and other factors that impact consumer confidence and spending;
|
|
|
•
|
changes in levels of competition from our current competitors and potential new competition from both retail stores and alternative methods or channels of distribution;
|
|
|
•
|
loss of a significant vendor or prolonged disruption of product supply;
|
|
|
•
|
the successful introduction of new products and technologies in our product categories, including the frequency of such introductions, the level of consumer acceptance of new products and technologies, and their impact on demand for existing products and technologies;
|
|
|
•
|
the impact of changes in pricing and profit margins associated with our sourced products or raw materials;
|
|
|
•
|
changes in income tax laws or regulations, or in interpretations of existing income tax laws or regulations;
|
|
|
•
|
adverse outcomes from significant litigation matters;
|
|
|
•
|
changes in the interpretation or enforcement of laws and regulations regarding our business or the sale of our products, or the ingredients contained in our products; or the imposition of new or additional restrictions or regulations regarding the same;
|
|
|
•
|
changes in our ability to attract, retain and develop highly-qualified employees or changes in the cost or availability of a sufficient labor force to manage and support our operations;
|
|
|
•
|
changes in our ability to meet objectives with regard to business acquisitions or new business ventures;
|
|
|
•
|
the occurrence of severe weather events prohibiting or discouraging consumers from traveling to retail or wholesale locations;
|
|
|
•
|
the disruption of global, national or regional transportation systems;
|
|
|
•
|
the occurrence of certain material events including natural disasters, acts of terrorism, the outbreak of war or other significant national or international events;
|
|
|
•
|
an outbreak of certain public health issues, including contagious diseases;
|
|
|
•
|
our ability to react in a timely manner and maintain our critical business processes and information systems capabilities in a disaster recovery situation; and
|
|
|
•
|
changes in our ability to manage our existing computer systems and technology infrastructures, and our ability to implement successfully new computer systems and technology infrastructures.
|
|
Item 2.
|
Unregistered Sales of Equity Securities and Use of Proceeds.
|
Not Applicable
|
Item 3.
|
Defaults Upon Senior Securities.
|
Not Applicable
|
Item 5.
|
Other Information.
|
Not Applicable
|
Item 6.
|
Exhibits
|
|
10.1
|
|
Yankee Candle Investments LLC 2011 Incentive Equity Plan, filed with YCC Holdings LLC’s Form S-4 filed on April 14, 2011 (Reg. No. 333-173505) and incorporated by reference
|
|
10.2
|
Unitholders Agreement, dated February 8, 2011, by and among Yankee Candle Investments LLC, Madison Dearborn Capital Partners V-A, L.P., Madison Dearborn Capital Partners V-C, L.P., and Madison Dearborn Capital Partners V Executive-A, L.P., filed with YCC Holdings LLC’s Form S-4 filed on April 14, 2011 (Reg. No. 333-173505) and incorporated by reference
|
|
|
10.3
|
Form of Class A Unit Exchange Agreement (executive form), filed with YCC Holdings LLC’s Form S-4 filed on April 14, 2011 (Reg. No. 333-173505) and incorporated by reference
|
|
|
10.4
|
Form of Class A Unit Exchange Agreement (director form), filed with YCC Holdings LLC’s Form S-4 filed on April 14, 2011 (Reg. No. 333-173505) and incorporated by reference
|
|
|
10.5
|
Form of Class A Unit Exchange Agreement (management form), filed with YCC Holdings LLC’s Form S-4 filed on April 14, 2011 (Reg. No. 333-173505) and incorporated by reference
|
|
|
10.6
|
Form of Class B Executive Unit Exchange Agreement (executive form), filed with YCC Holdings LLC’s Form S-4 filed on April 14, 2011 (Reg. No. 333-173505) and incorporated by reference
|
|
|
10.7
|
Form of Class B Executive Unit Exchange Agreement (management form), filed with YCC Holdings LLC’s Form S-4 filed on April 14, 2011 (Reg. No. 333-173505) and incorporated by reference
|
|
|
10.8
|
Form of Class C Executive Unit Exchange Agreement (executive form), filed with YCC Holdings LLC’s Form S-4 filed on April 14, 2011 (Reg. No. 333-173505) and incorporated by reference
|
|
|
10.9
|
Form of Class C Executive Unit Exchange Agreement (director form), filed with YCC Holdings LLC’s Form S-4 filed on April 14, 2011 (Reg. No. 333-173505) and incorporated by reference
|
|
|
10.10
|
Form of Class C Executive Unit Exchange Agreement (management form), filed with YCC Holdings LLC’s Form S-4 filed on April 14, 2011 (Reg. No. 333-173505) and incorporated by reference
|
|
|
|
Certification of Harlan M. Kent Pursuant to Rule 13a-14(a) under the Securities Exchange Act of 1934, dated May 17, 2011
|
|
|
|
Certification of Gregory W. Hunt Pursuant to Rule 13a-14(a) under the Securities Exchange Act of 1934, dated May 17, 2011
|
|
|
|
Certification of Harlan M. Kent Pursuant to Rule 13a-14(b) under the Securities Exchange Act of 1934, dated May 17, 2011
|
|
|
|
|
|
|
|
Certification of Gregory W. Hunt Pursuant to Rule 13a-14(b) under the Securities Exchange Act of 1934, dated May 17, 2011
|
|
Pursuant to the requirements of the Securities Exchange Act of 1934, as amended, the registrant has duly caused this report to be signed on its behalf by the undersigned thereunto duly authorized.
|
|
|
|
|
|
|
|
|
YANKEE HOLDING CORP.
|
||
|
|
|
|
||
|
Date: May 17, 2011
|
|
By:
|
|
/s/ GREGORY W. HUNT
|
|
|
|
|
|
Gregory W. Hunt
|
|
|
|
|
|
Executive Vice President and Chief Financial Officer
|
|
(Principal Financial and Accounting Officer)
|
||||
33