Attached files
| file | filename |
|---|---|
| 8-K - FORM 8-K - PUBLIC SERVICE ELECTRIC & GAS CO | d8k.htm |
 2
Forward-Looking Statement
EXHIBIT 99
Readers are cautioned that statements contained in this presentation about our and our
subsidiaries' future performance, including future revenues, earnings, strategies, prospects, consequences
and all other statements that are not purely historical, are forward-looking
statements for purposes of the safe harbor provisions under The Private Securities Litigation Reform Act of 1995. When
used herein, the words “anticipate”, “intend”,
“estimate”, “believe”, “expect”, “plan”, “should”, “hypothetical”, “potential”, “forecast”, “project”, variations of such words and similar expressions are
intended to identify forward-looking statements. Although we believe
that our expectations are based on reasonable assumptions, they are subject to risks and uncertainties and we can give no
assurance they will be achieved. The results or developments projected or
predicted in these statements may differ materially from what may actually occur. Factors which could cause results or
events to differ from current expectations include, but are not limited to:
• adverse changes in energy industry law, policies and regulation, including
market structures and a potential shift away from competitive markets toward subsidized market mechanisms,
transmission planning and cost allocation rules, including
rules regarding how transmission is planned and who is permitted to build transmission going forward, and reliability standards,
• any inability of our transmission and distribution businesses to obtain adequate
and timely rate relief and regulatory approvals from federal and state regulators,
• changes in federal and state environmental regulations that could increase our
costs or limit operations of our generating units, • changes in nuclear
regulation and/or general developments in the nuclear power industry, including various impacts from any accidents or incidents experienced at our facilities or by others in the
industry that could limit operations of our nuclear
generating units, • actions or activities at one of our nuclear units
located on a multi-unit site that might adversely affect our ability to continue to operate that unit or other units located at the same site,
• any inability to balance our energy obligations, available supply and trading
risks, • any deterioration in our credit quality, or the credit quality of
our counterparties, • availability of capital and credit at commercially
reasonable terms and conditions and our ability to meet cash needs, • any
inability to realize anticipated tax benefits or retain tax credits, •
changes in the cost of, or interruption in the supply of, fuel and other commodities necessary to the operation of our generating units,
• delays in receipt of necessary permits and approvals for our construction and
development activities, • delays or unforeseen cost escalations in our
construction and development activities, • adverse changes in the demand
for or price of the capacity and energy that we sell into wholesale electricity markets,
• increase in competition in energy markets in which we compete,
• challenges associated with retention of a qualified workforce,
• adverse performance of our decommissioning and defined benefit plan trust fund
investments and changes in discount rates and funding requirements, and •
changes in technology and customer usage patterns. For further information, please refer to our Annual Report on Form 10-K, including
Item 1A. Risk Factors, and subsequent reports on Form 10-Q and Form 8-K filed with the Securities and Exchange
Commission. These documents address in further detail our business, industry
issues and other factors that could cause actual results to differ materially from those indicated in this presentation. In
addition, any forward-looking statements included herein represent our
estimates only as of today and should not be relied upon as representing our estimates as of any subsequent date. While we
may elect to update forward-looking statements from time to time, we specifically
disclaim any obligation to do so, even if our internal estimates change, unless otherwise required by applicable
securities laws. |
 3
GAAP Disclaimer
PSEG presents Operating Earnings in addition to its Net Income reported in
accordance with accounting principles generally accepted in the United States
(GAAP). Operating Earnings is a non-GAAP financial measure that differs from
Net Income because it excludes gains or losses associated with Nuclear
Decommissioning Trust (NDT), Mark-to-Market (MTM) accounting, and other
material one-time items. PSEG presents Operating Earnings because
management believes that it is appropriate for investors to consider results
excluding these items in addition to the results reported in accordance with
GAAP. PSEG believes that the non-GAAP financial measure of Operating
Earnings provides a consistent and comparable measure of performance of its
businesses to help shareholders understand performance trends.
This
information is not
intended to be viewed as an alternative to GAAP information.
The last two slides in this presentation include a list of items
excluded from
Income from Continuing Operations to reconcile to Operating Earnings, with a
reference to that slide included on each of the slides where the
non-GAAP
information appears. |
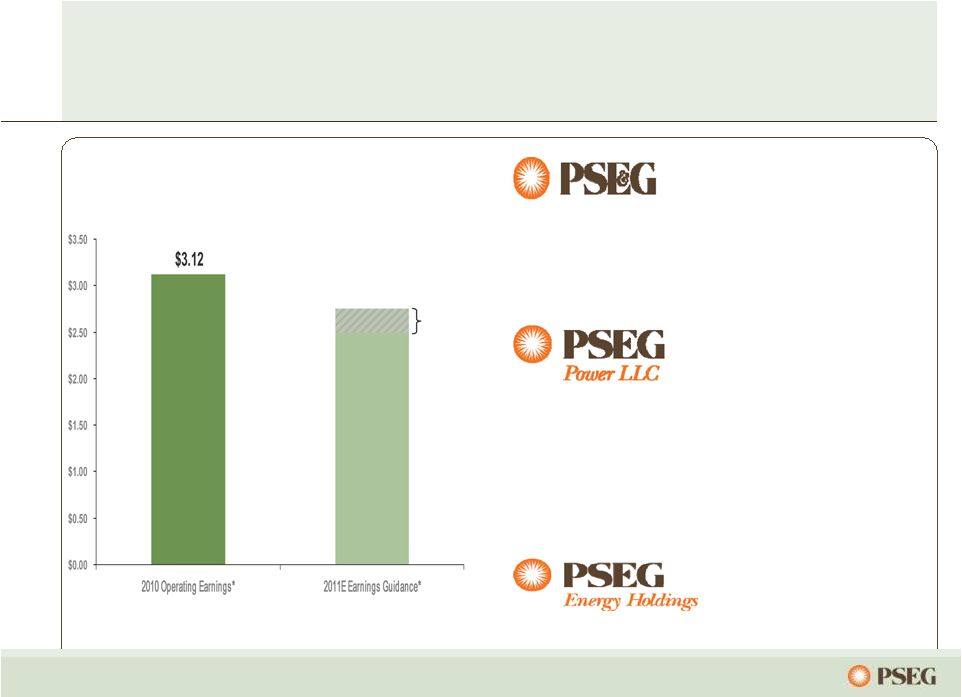 11
PSEG’s 2011 earnings guidance reflects
continued improvement at PSE&G…
–
Network transmission service revenue increase
= ~ $0.05 per share
–
Full year of E&G Rate Relief = ~ $0.05 per share
–
Each 1% change in Load = ~ $0.02 per share
–
Each 1% change in O&M = ~ $0.01 per share
–
2010 Utility ROE 9.9%; Each 10 bp = $0.01 per share
Revenue/Margin
–
Decline in average Hedge Price/Volume = ~ ($0.25-$0.30)
per share
–
Decline in Capacity revenues = ~ ($0.15-$0.20) per share
–
Improvement in WPT/BGSS = ~ $0.03-$0.05 per share
Other Expense
–
Higher O&M = ~ ($0.03) per share
–
Increase in Depreciation rate = ~ ($0.05) per share
–
Absence of LILO/SILO termination gains = ~ ($0.05) per share
–
Loss of Income from Asset Sales = ~ ($0.05) per share
Guidance
$2.75
$2.50
2011 Drivers
…offset by a decline in margins at Power and Holdings.
Earnings Per Share
* See page 64 for Items excluded from Income from Continuing Operations to reconcile
to Operating Earnings. E Estimate. |
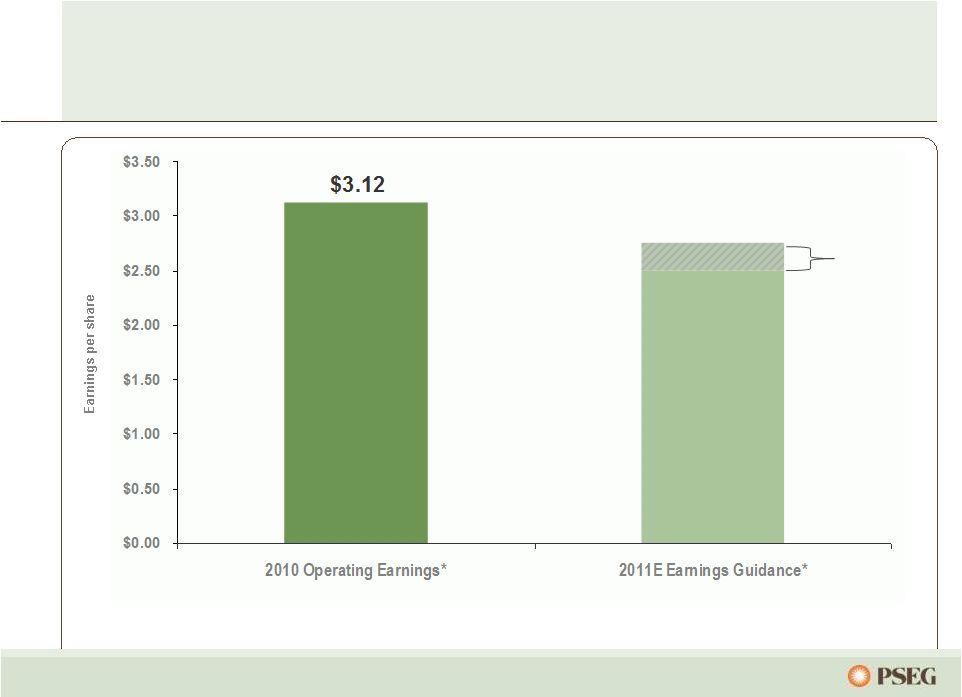 12
Outlook for 2011 Operating Earnings
Maintained
* See page 64 for Items excluded from Income from Continuing Operations to
reconcile to Operating Earnings. $2.75E
$2.50E |
 33
…
with sites in the eastern part of PJM.
With nearly 1/3 of its capacity in PS North and nearly 2/3 of its capacity in EMAAC, Power’s
assets in congested locations received higher pricing.
•
Locational
value of Power’s
fleet recognized.
•
Bid for 89 MW of new
capacity accepted for
2013/2014 auction;
in-service June 2012.
•
On schedule to complete
178 MW of previously
cleared peaking capacity
by June 2012.
•
Latest auction influenced
by updated demand
forecast and transfer
capabilities.
$/MW-day
PJM Zones
2009 / 2010
2010 / 2011
2011 / 2012
2012 / 2013
2013/2014
2014/2015
Eastern MAAC
$191.32
$174.29
$110.00
$139.73
$245.00
$136.50
MAAC
$191.32
$174.29
$110.00
$133.37
$226.15
$136.50
PSEG
$245.00
PSEG North Zone
$185.00
$245.00
$225.00
Rest of Pool
$102.04
$174.29
$110.00
$16.46
$27.73
$125.99
Reliability Pricing Model –
locational
value
of Power’s generating fleet recognized…
PJM Capacity Available to Receive Auction Pricing
0
2,000
4,000
6,000
8,000
10,000
12,000
09/10
10/11
11/12
12/13
13/14
14/15 |
 47
PSEG’s long-term outlook is influenced by
Power’s hedge position…
2012
2013
Each $1/mcf Change in Natural Gas
Each $2/Mwh Change in Spark Spread
Each $2/Mwh Change in Dark Spread
Each 1% Change in Nuclear Capacity Factor
Each 1% Change in Depreciation Rate
$0.06 -
$0.08
$0.03
$0.02
$0.01
$0.01
$0.15 -
$0.20
$0.03
$0.03
$0.01
$0.01
Segment EPS Drivers
Each $100 Million of Incremental Investment
Each 1% Change in Sales:
Electric
Gas
Each 1% Change in O&M
Each 10 bp Change in ROE
$0.01
$0.01
$0.01
$0.01
$0.01
$0.02
$0.01
$0.01
$0.01
$0.01
…and increased investment at PSE&G. |
 57
PSEG 2011 Operating Earnings Guidance
-
by Subsidiary
$ millions (except EPS)
2011E
2010A
PSEG Power
$ 765 –
$ 855
$ 1,091
PSE&G
$ 495 –
$ 520
$ 430
PSEG Energy Holdings
$ 0 –
$ 5
$ 49
Enterprise
$ 5 –
$ 15
$ 14
Operating Earnings*
$ 1,265 –
$ 1,395
$ 1,584
Earnings per Share
$ 2.50 –
$ 2.75
$ 3.12
* See Page 64 for Items excluded from Income from Continuing Operations to
reconcile to Operating Earnings. |
 59
Operated by PSEG Nuclear
PSEG Ownership: 100%
Technology: Boiling Water Reactor
Total Capacity: 1,197MW
Owned Capacity: 1,197MW
License Expiration: 2026
Filed for license extension,
August 2009
Next Refueling 2012
Operated by PSEG Nuclear
Ownership: PSEG –
57%
Exelon –
43%
Technology: Pressurized Water Reactor
Total Capacity: 2,337MW
Owned Capacity: 1,342MW
License Expiration: 2016 and 2020
Filed for license extension,
August 2009
Next Refueling
Unit 1 –
Fall 2011
Unit 2 –
Fall 2012
Operated by Exelon
PSEG Ownership: 50%
Technology: Boiling Water Reactor
Total Capacity: 2,245MW
Owned Capacity: 1,122MW
License Expiration: 2033 and 2034
Next Refueling
Unit 2 –
2012
Unit 3 –
Fall 2011
Hope Creek
Salem Units 1 and 2
Peach Bottom Units 2 and 3
Our five unit nuclear fleet…
…
is a critical element of Power’s success. |
 64
Pro-forma Adjustments, net of tax
2010
2009
2008
Gain (Loss) on Nuclear Decommissioning Trust (NDT)
Fund Related Activity (PSEG Power)
46
$
9
$
(71)
$
Gain (Loss) on Mark-to-Market (MTM) (PSEG Power)
(1)
(11)
14
Market Transition Charge Refund (PSE&G)
(72)
-
-
Net Reversal of Lease Transaction Reserves (Energy Holdings)
-
29
-
Lease Transaction Reserves (Energy Holdings)
-
-
(490)
Asset Impairments
-
-
(13)
Premium on Bond Redemption
-
-
(1)
Total Pro-forma adjustments
(27)
$
27
$
(561)
$
Fully Diluted Average Shares Outstanding (in Millions)
507
507
508
Gain (Loss) on Nuclear Decommissioning Trust (NDT)
Fund Related Activity (PSEG Power)
0.09
$
0.02
$
(0.14)
$
Gain (Loss) on Mark-to-Market (MTM) (PSEG Power)
-
(0.02)
0.03
Market Transition Charge Refund (PSE&G)
(0.14)
-
-
Net Reversal of Lease Transaction Reserves (Energy Holdings)
-
0.05
-
Lease Transaction Reserves (Energy Holdings)
-
-
(0.96)
Asset Impairments
-
-
(0.03)
Premium on Bond Redemption
-
-
-
Total Pro-forma adjustments
(0.05)
$
0.05
$
(1.10)
$
December 31,
PUBLIC SERVICE ENTERPRISE GROUP INCORPORATED
Reconciling Items Excluded from Continuing Operations to Compute Operating Earnings
(Unaudited)
For the Twelve Months Ended
Items Excluded from Income from Continuing
Operations to Reconcile to Operating Earnings
Earnings Impact ($ Millions)
Per Share Impact (Diluted)
Please see Page 3 for an explanation of PSEG’s use of Operating Earnings as a non-GAAP financial measure and how it differs from Net Income. |