Attached files
| file | filename |
|---|---|
| EX-10.1 - EX-10.1 - IMPAC MORTGAGE HOLDINGS INC | a11-9507_1ex10d1.htm |
| EX-31.2 - EX-31.2 - IMPAC MORTGAGE HOLDINGS INC | a11-9507_1ex31d2.htm |
| EX-32.1 - EX-32.1 - IMPAC MORTGAGE HOLDINGS INC | a11-9507_1ex32d1.htm |
| EX-31.1 - EX-31.1 - IMPAC MORTGAGE HOLDINGS INC | a11-9507_1ex31d1.htm |
UNITED STATES
SECURITIES AND EXCHANGE COMMISSION
Washington, D.C. 20549
FORM 10-Q
x QUARTERLY REPORT PURSUANT TO SECTION 13 OR 15(d) OF THE SECURITIES EXCHANGE ACT OF 1934
For the quarterly period ended March 31, 2011
or
o TRANSITION REPORT PURSUANT TO SECTION 13 OR 15(d) OF THE SECURITIES EXCHANGE ACT OF 1934
For the transition period from to .
Commission File Number: 1-14100
IMPAC MORTGAGE HOLDINGS, INC.
(Exact name of registrant as specified in its charter)
|
Maryland |
|
33-0675505 |
|
(State or other jurisdiction of |
|
(I.R.S. Employer |
|
incorporation or organization) |
|
Identification No.) |
19500 Jamboree Road, Irvine, California 92612
(Address of principal executive offices)
(949) 475-3600
(Registrant’s telephone number, including area code)
Indicate by check mark whether the registrant (1) has filed all reports required to be filed by Section 13 or 15(d) of the Securities Exchange Act of 1934 during the preceding 12 months (or for such shorter period that the registrant was required to file such reports), and (2) has been subject to such filing requirements for the past 90 days. Yes x No o
Indicate by check mark whether the registrant has submitted electronically and posted on its corporate Web site, if any, every Interactive Data File required to be submitted and posted pursuant to Rule 405 of Regulation S-T during the preceding 12 months (or for such shorter period that the registrant was required to submit and post such files). Yes o No o
Indicate by check mark whether the registrant is a large accelerated filer, an accelerated filer, or a non-accelerated filer. See definition of “accelerated filer and large accelerated filer” in Rule 12b-2 of the Exchange Act.
|
Large accelerated filer o |
|
Accelerated filer ¨ |
|
|
|
|
|
Non-accelerated filer o |
|
Smaller reporting company x |
|
(Do not check if a smaller reporting company) |
|
|
Indicate by check mark whether the registrant is a shell company (as defined in Exchange Act Rule 12b-2) Yes o No x
There were 7,789,946 shares of common stock outstanding as of May 13, 2011.
IMPAC MORTGAGE HOLDINGS, INC.
FORM 10-Q QUARTERLY REPORT
ITEM 1. CONSOLIDATED FINANCIAL STATEMENTS
IMPAC MORTGAGE HOLDINGS, INC. AND SUBSIDIARIES
(dollars in thousands, except share data)
|
|
|
March 31, |
|
December 31, |
| ||
|
|
|
2011 |
|
2010 |
| ||
|
|
|
(Unaudited) |
|
|
| ||
|
ASSETS |
|
|
|
|
| ||
|
Cash and cash equivalents |
|
$ |
7,750 |
|
$ |
11,507 |
|
|
Restricted cash |
|
2,507 |
|
1,495 |
| ||
|
Trust assets |
|
|
|
|
| ||
|
Investment securities available-for-sale |
|
415 |
|
645 |
| ||
|
Securitized mortgage collateral |
|
6,053,766 |
|
6,011,675 |
| ||
|
Derivative assets |
|
37 |
|
40 |
| ||
|
Real estate owned |
|
74,709 |
|
92,708 |
| ||
|
Total trust assets |
|
6,128,927 |
|
6,105,068 |
| ||
|
|
|
|
|
|
| ||
|
Mortgage loans held-for-sale |
|
31,888 |
|
4,283 |
| ||
|
Finance receivables |
|
3,911 |
|
— |
| ||
|
Assets of discontinued operations |
|
296 |
|
373 |
| ||
|
Other assets |
|
30,515 |
|
31,213 |
| ||
|
Total assets |
|
$ |
6,205,794 |
|
$ |
6,153,939 |
|
|
|
|
|
|
|
| ||
|
LIABILITIES |
|
|
|
|
| ||
|
Trust liabilities |
|
|
|
|
| ||
|
Securitized mortgage borrowings |
|
$ |
6,056,577 |
|
$ |
6,012,745 |
|
|
Derivative liabilities |
|
46,243 |
|
65,916 |
| ||
|
Total trust liabilities |
|
6,102,820 |
|
6,078,661 |
| ||
|
|
|
|
|
|
| ||
|
Warehouse borrowings |
|
34,266 |
|
4,057 |
| ||
|
Long-term debt |
|
12,030 |
|
11,728 |
| ||
|
Notes payable |
|
4,763 |
|
6,874 |
| ||
|
Liabilities of discontinued operations |
|
12,004 |
|
13,053 |
| ||
|
Other liabilities |
|
13,155 |
|
11,869 |
| ||
|
Total liabilities |
|
6,179,038 |
|
6,126,242 |
| ||
|
|
|
|
|
|
| ||
|
Commitments and contingencies |
|
|
|
|
| ||
|
|
|
|
|
|
| ||
|
STOCKHOLDERS’ EQUITY |
|
|
|
|
| ||
|
Series A junior participating preferred stock, $0.01 par value; 2,500,000 shares authorized; none issued or outstanding |
|
— |
|
— |
| ||
|
Series B 9.375% redeemable preferred stock, $0.01 par value; liquidation value $16,904; 2,000,000 shares authorized, 665,592 noncumulative shares issued and outstanding as of March 31, 2011 and December 31, 2010, respectively |
|
7 |
|
7 |
| ||
|
Series C 9.125% redeemable preferred stock, $0.01 par value; liquidation value $35,389; 5,500,000 shares authorized; 1,405,086 noncumulative shares issued and outstanding as of March 31, 2011 and December 31, 2010, respectively |
|
14 |
|
14 |
| ||
|
Common stock, $0.01 par value; 200,000,000 shares authorized; 7,788,546 and 7,787,546 shares issued and outstanding as of March 31, 2011 and December 31, 2010, respectively |
|
78 |
|
78 |
| ||
|
Additional paid-in capital |
|
1,076,451 |
|
1,076,375 |
| ||
|
Net accumulated deficit: |
|
|
|
|
| ||
|
Cumulative dividends declared |
|
(822,520 |
) |
(822,520 |
) | ||
|
Retained deficit |
|
(228,545 |
) |
(227,558 |
) | ||
|
Net accumulated deficit |
|
(1,051,065 |
) |
(1,050,078 |
) | ||
|
Total Impac Mortgage Holdings, Inc. stockholders’ equity |
|
25,485 |
|
26,396 |
| ||
|
Noncontrolling interests |
|
1,271 |
|
1,301 |
| ||
|
Total equity |
|
26,756 |
|
27,697 |
| ||
|
Total liabilities and stockholders’ equity |
|
$ |
6,205,794 |
|
$ |
6,153,939 |
|
See accompanying notes to consolidated financial statements.
IMPAC MORTGAGE HOLDINGS, INC. AND SUBSIDIARIES
CONSOLIDATED STATEMENTS OF OPERATIONS
(in thousands, except per share data)
(Unaudited)
|
|
|
For the Three Months |
| ||||
|
|
|
Ended March 31, |
| ||||
|
|
|
2011 |
|
2010 |
| ||
|
|
|
|
|
|
| ||
|
INTEREST INCOME |
|
$ |
218,082 |
|
$ |
279,876 |
|
|
INTEREST EXPENSE |
|
216,547 |
|
279,106 |
| ||
|
Net interest income |
|
1,535 |
|
770 |
| ||
|
|
|
|
|
|
| ||
|
NON-INTEREST INCOME: |
|
|
|
|
| ||
|
Change in fair value of net trust assets, excluding REO |
|
4,896 |
|
7,372 |
| ||
|
Losses from REO |
|
(4,249 |
) |
(1,108 |
) | ||
|
Non-interest income - net trust assets |
|
647 |
|
6,264 |
| ||
|
|
|
|
|
|
| ||
|
Change in fair value of long-term debt |
|
238 |
|
(291 |
) | ||
|
Mortgage and real estate services fees |
|
11,690 |
|
10,950 |
| ||
|
Other |
|
295 |
|
80 |
| ||
|
Total non-interest income |
|
12,870 |
|
17,003 |
| ||
|
|
|
|
|
|
| ||
|
NON-INTEREST EXPENSE: |
|
|
|
|
| ||
|
General and administrative |
|
4,579 |
|
4,778 |
| ||
|
Personnel expense |
|
10,766 |
|
9,681 |
| ||
|
Total non-interest expense |
|
15,345 |
|
14,459 |
| ||
|
(Loss) earnings from continuing operations before income taxes |
|
(940 |
) |
3,314 |
| ||
|
Income tax expense from continuing operations |
|
12 |
|
85 |
| ||
|
(Loss) earnings from continuing operations |
|
(952 |
) |
3,229 |
| ||
|
(Loss) earnings from discontinued operations, net of tax |
|
(350 |
) |
2,386 |
| ||
|
Net (loss) earnings |
|
(1,302 |
) |
5,615 |
| ||
|
Net loss attributable to noncontrolling interests |
|
315 |
|
303 |
| ||
|
Net (loss) earnings attributable to IMH |
|
$ |
(987 |
) |
$ |
5,918 |
|
|
|
|
|
|
|
| ||
|
(Loss) earnings per common share - basic: |
|
|
|
|
| ||
|
(Loss) earnings from continuing operations attributable to IMH |
|
$ |
(0.08 |
) |
$ |
0.46 |
|
|
(Loss) earnings from discontinued operations |
|
(0.04 |
) |
0.31 |
| ||
|
Net (loss) earnings per share available to common stockholders |
|
$ |
(0.12 |
) |
$ |
0.77 |
|
|
|
|
|
|
|
| ||
|
(Loss) earnings per common share - diluted: |
|
|
|
|
| ||
|
(Loss) earnings from continuing operations attributable to IMH |
|
$ |
(0.08 |
) |
$ |
0.42 |
|
|
(Loss) earnings from discontinued operations |
|
(0.04 |
) |
0.29 |
| ||
|
Net (loss) earnings per share available to common stockholders |
|
$ |
(0.12 |
) |
$ |
0.71 |
|
See accompanying notes to consolidated financial statements
IMPAC MORTGAGE HOLDINGS, INC. AND SUBSIDIARIES
CONSOLIDATED STATEMENTS OF CASH FLOWS
(in thousands)
(Unaudited)
|
|
|
For the Three Months |
| ||||
|
|
|
Ended March 31, |
| ||||
|
|
|
2011 |
|
2010 |
| ||
|
CASH FLOWS FROM OPERATING ACTIVITIES: |
|
|
|
|
| ||
|
Net (loss) earnings |
|
$ |
(1,302 |
) |
$ |
5,615 |
|
|
|
|
|
|
|
| ||
|
Losses from real estate owned |
|
4,249 |
|
1,108 |
| ||
|
Change in fair value of mortgage servicing rights |
|
99 |
|
— |
| ||
|
Gain on sale of loans |
|
(646 |
) |
— |
| ||
|
Origination of mortgage loans held-for-sale |
|
(53,444 |
) |
— |
| ||
|
Sale and principal reduction on mortgage loans held-for-sale |
|
26,768 |
|
— |
| ||
|
Change in fair value of net trust assets, excluding REO |
|
(21,950 |
) |
(43,300 |
) | ||
|
Change in fair value of long-term debt |
|
(238 |
) |
291 |
| ||
|
Accretion of interest income and expense |
|
87,158 |
|
125,906 |
| ||
|
Change in REO impairment reserve |
|
(10,305 |
) |
(5,951 |
) | ||
|
Stock-based compensation |
|
76 |
|
350 |
| ||
|
Net change in restricted cash |
|
(1,012 |
) |
— |
| ||
|
Net cash used in operating activities of discontinued operations |
|
(1,076 |
) |
(1,204 |
) | ||
|
Net change in other assets and liabilities |
|
(1,907 |
) |
(5,107 |
) | ||
|
Net cash provided by operating activities |
|
26,470 |
|
77,708 |
| ||
|
|
|
|
|
|
| ||
|
CASH FLOWS FROM INVESTING ACTIVITIES: |
|
|
|
|
| ||
|
Net change in securitized mortgage collateral |
|
178,988 |
|
185,917 |
| ||
|
Net change in mortgages held-for-investment |
|
3 |
|
6 |
| ||
|
Maturity of short-term investments |
|
— |
|
5,000 |
| ||
|
Purchase of premises and equipment |
|
(351 |
) |
(436 |
) | ||
|
Net principal change on investment securities available-for-sale |
|
56 |
|
70 |
| ||
|
Proceeds from the sale of real estate owned |
|
49,736 |
|
63,563 |
| ||
|
Net cash provided by investing activities of discontinued operations |
|
— |
|
864 |
| ||
|
Net cash provided by investing activities |
|
228,432 |
|
254,984 |
| ||
|
|
|
|
|
|
| ||
|
CASH FLOWS FROM FINANCING ACTIVITIES: |
|
|
|
|
| ||
|
Repayment of warehouse borrowings |
|
(32,169 |
) |
— |
| ||
|
Borrowings under warehouse agreement |
|
62,378 |
|
— |
| ||
|
Repayment of securitized mortgage borrowings |
|
(287,146 |
) |
(329,986 |
) | ||
|
Principal payments on notes payable |
|
(1,826 |
) |
(4,224 |
) | ||
|
Net cash used in financing activities |
|
(258,763 |
) |
(334,210 |
) | ||
|
|
|
|
|
|
| ||
|
Net change in cash and cash equivalents |
|
(3,861 |
) |
(1,518 |
) | ||
|
Cash and cash equivalents at beginning of period |
|
11,620 |
|
25,850 |
| ||
|
Cash and cash equivalents at end of period - Continuing Operations |
|
7,750 |
|
23,023 |
| ||
|
Cash and cash equivalents at end of period - Discontinued Operations |
|
9 |
|
1,309 |
| ||
|
Total cash and cash equivalents at end of period |
|
$ |
7,759 |
|
$ |
24,332 |
|
|
|
|
|
|
|
| ||
|
NON-CASH TRANSACTIONS (Continuing and Discontinued Operations): |
|
|
|
|
| ||
|
Transfer of securitized mortgage collateral to real estate owned |
|
$ |
25,735 |
|
$ |
41,894 |
|
|
Net effect of consolidation of net trust assets from adoption of accounting principle |
|
— |
|
119,631 |
| ||
|
Net effect of consolidation of net trust liabilities from adoption of accounting principle |
|
— |
|
(119,631 |
) | ||
See accompanying notes to consolidated financial statements.
IMPAC MORTGAGE HOLDINGS, INC. AND SUBSIDIARIES
NOTES TO UNAUDITED CONSOLIDATED FINANCIAL STATEMENTS
(dollars in thousands, except share and per share data or as otherwise indicated)
Note 1.—Summary of Business, Market Conditions, Status of Operations, Liquidity, and Financial Statement Presentation
Business Summary
Impac Mortgage Holdings, Inc. (the Company or IMH) is a Maryland corporation incorporated in August 1995 and has the following subsidiaries: Integrated Real Estate Service Corporation (IRES), IMH Assets Corp. (IMH Assets), Impac Warehouse Lending Group, Inc. (IWLG) and Impac Funding Corporation (IFC).
The Company’s continuing operations include the long-term mortgage portfolio (residual interests in securitizations determined as total trust assets minus total trust liabilities in the consolidated balance sheets) and the mortgage and real estate fee-based business activities conducted by IRES. The discontinued operations include the former non-conforming mortgage and retail operations conducted by IFC and subsidiaries, and warehouse lending operations conducted by IWLG.
The information contained throughout this document is presented on a continuing operations basis, unless otherwise stated.
Market Update, Status of Operations and Liquidity
Beginning in the third quarter of 2010 and continuing through the first quarter of 2011, we continue to see home price declines in many markets as the homebuyer tax credit expired and housing prices remained under pressure due to elevated foreclosure levels. In addition, foreclosure delays as a result of reviews into foreclosure practices of some prominent loan servicers in the fourth quarter of 2010, among other market conditions may result in continued downward pressure on home prices for the foreseeable future.
Mortgage lending and credit market conditions remained soft through the first quarter of 2011 due primarily to an increase in mortgage rates and weak economy. Existing uncertainties surrounding the housing market, economy and regulatory environment will continue to present challenges for the Company. The ongoing economic stress or further deterioration of general economic conditions could prolong or increase borrower defaults leading to deteriorating performance of our long-term mortgage portfolio.
In March 2011, the Company expanded its mortgage lending operations by moving into the Pacific Northwest and Gulf Coast Regions, opening regional production offices in Lake Oswego, Oregon, and Baton Rouge, Louisiana. In addition to the Company’s mortgage lending operations in Irvine, California, this expansion gives the Company origination capabilities throughout the entire West Coast and Gulf Coast regions with additional regional operation centers and retail and wholesale locations. As part of this expansion, the Company invested approximately $2.0 million in its mortgage lending operations infrastructure, consisting principally of additional personnel and occupancy costs (included in total non-interest expense in the consolidated statement of operations). Also during the quarter ended March 31, 2011, the Company obtained an additional warehouse borrowing facility of $20.0 million bringing total warehouse borrowing capacity to $73.5 million at March 31, 2011. Through both retail and wholesale channels, the Company funded $53.4 million in mortgage loans during the quarter ended March 31, 2011 of primarily government sponsored and conventional loans eligible for sale to Ginnie Mae, Fannie Mae and Freddie Mac, respectively.
The ability to meet the Company’s long-term liquidity requirements is subject to several factors, such as generating fees from the mortgage and real estate business activities and realizing cash flows from the long-term mortgage portfolio. The Company’s future financial performance and success are dependent in large part upon the ability to grow the mortgage and real estate business activities, including providing services to third parties and expanding the mortgage lending operations. The Company believes that current cash balances, cash flows from mortgage and real estate services fees generated from the long-term mortgage portfolio, and residual interest cash flows from the long-term mortgage portfolio are adequate for the current operating needs. However, the mortgage and real estate services market is volatile, highly competitive and subject to increased regulation. The Company’s ability to successfully compete in the mortgage and real estate services industry may be challenging as its business activities have been established in the last few years and many competitors have recently entered or have established businesses delivering similar services. Additionally, the mortgage lending environment is extremely competitive and highly regulated. The future success of the mortgage lending operations will depend on a number of factors, including the ability to procure adequate financing to fund loan production, maintaining associated financial covenants of lenders, how well the Company competes, housing market conditions, economic recovery and financial regulatory reform. If the Company is unsuccessful, the Company may be unable to satisfy the future operating costs and liabilities, including repayment of the note payable and long-term debt. To be successful in expanding the business and providing adequate returns to the shareholders, the Company may seek financing in the form of debt or equity capital.
Financial Statement Presentation
The accompanying unaudited consolidated financial statements of IMH and its subsidiaries (as defined above) have been prepared in accordance with Accounting Principles Generally Accepted in the United States of America (GAAP) for interim financial information and with the instructions to Form 10-Q and Rule 8-03 of Regulation S-X. Accordingly, they do not include all of the information and footnotes required by GAAP for complete financial statements. In the opinion of management, all adjustments, consisting of normal recurring adjustments considered necessary for a fair presentation, have been included. Operating results for the three months ended March 31, 2011 are not necessarily indicative of the results that may be expected for the year ending December 31, 2011. These interim period condensed consolidated financial statements should be read in conjunction with the Company’s audited consolidated financial statements, which are included in the Company’s Annual Report on Form 10-K for the year ended December 31, 2010, filed with the United States Securities and Exchange Commission (SEC).
All significant inter-company balances and transactions have been eliminated in consolidation. In addition, certain amounts in the prior periods’ consolidated financial statements have been reclassified to conform to the current year presentation.
Management has made a number of estimates and assumptions relating to the reporting of assets and liabilities, the disclosure of contingent assets and liabilities at the date of the financial statements and the reported amounts of revenues and expenses during the reporting period to prepare these consolidated financial statements in conformity with GAAP. The items affected by such estimates and assumptions include the valuation of trust assets and trust liabilities, the estimated obligation of repurchase liabilities related to sold loans, the valuation of long-term debt and mortgage loans held-for-sale. Actual results could differ from those estimates and assumptions.
Recently Adopted Accounting Pronouncements
In January 2010, the FASB issued Accounting Standards Update (ASU) No. 2010-6 “Improving Disclosures About Fair Value Measurements” (ASU 2010-6). The ASU amends Codification Topic 820 “Fair Value Measurements and Disclosures” to add new disclosure requirements for transfers into and out of Levels 1 and 2 fair value measurements, as well as separate disclosures about purchases, sales, issuances, and settlements relating to Level 3 fair value measurements. ASU 2010-6 also clarifies existing fair value disclosures regarding the level of disaggregation and inputs and valuation techniques used to measure fair value. ASU 2010-6 is effective for the first reporting period (including interim periods) beginning after December 15, 2009, except for the requirement to provide the Level 3 activity of purchases, sales, issuances, and settlements on a gross basis, which will be effective for fiscal years beginning after December 15, 2010, and for interim periods within those fiscal years. ASU 2010-6 only adds new disclosure requirements and as a result, its adoption did not have an impact on the Company’s consolidated financial statements.
Income Taxes and Deferred Charge
The Company recorded income tax expense of $12 thousand and $85 thousand for the three months ended March 31, 2011 and 2010, respectively. The income tax expense for 2011 and 2010 is the result of state income taxes primarily from states where the Company does not have net operating loss carryforwards.
As of December 31, 2010, the Company had estimated federal and California net operating loss carryforwards of approximately $490.6 million and $492.1 million, respectively, of which $271.7 million (federal) relate to discontinued operations. During the year ended December 31, 2010, estimated net operating loss carryforwards were reduced as a result of the Company generating taxable income from cancellation of debt for approximately $426.2 million of securitized mortgage borrowings. Federal and state net operating loss (NOL) carryforwards begin to expire in 2020 and 2017, respectively. California net operating loss carryforwards have been suspended by the state until 2012, thus the expiration begins in 2017. The Company recorded a full valuation allowance against the deferred tax assets as it believes that as of March 31, 2011 it is more likely than not that the deferred tax assets will not be recoverable.
During the fourth quarter of 2009, the Company received a federal income tax refund in the amount of $8.9 million as a result of an election to carryback NOLs five years pursuant to 2009 federal legislation, The Worker, Homeownership, and Business Assistance Act of 2009. The Company files income tax returns in the U.S. federal and various state jurisdictions. The Company is subject to routine income tax audits in the various jurisdictions. A subsidiary of the Company is currently under examination by the Internal Revenue Service for tax year 2008. Management believes that there are no unresolved issues or claims likely to be material to our financial position. As of March 31, 2011, the Company has no material uncertain tax positions.
The deferred charge represents the deferral of income tax expense on inter-company profits that resulted from the sale of mortgages from taxable subsidiaries to IMH in prior years. The deferred charge is included in other assets in the accompanying consolidated balance sheets and is amortized as a component of income tax expense in the accompanying consolidated statement of operations over the estimated life of the mortgages retained in the securitized mortgage collateral. There was no amortization of deferred charge during the three months ended March 31, 2011.
Legal Proceedings
On May 6, 2011 a case entitled Massachusetts Mutual Life Insurance Company v Impac Funding Corporation, et al was filed in the United States District Court for the District of Massachusetts as Case No. 3:11-cv-30127. The complaint names Impac Funding Corporation and Impac secured Assets Corporation along with two of their officers as defendants. The action alleges violations of the Massachusetts Uniform Securities Act and the plaintiff seeks rescission or damages for their purchase of bonds from two securitization trusts issued by the Defendants. The plaintiff alleges that the loans deposited into the trusts did not meet the representations made in the offering documents when they purchased their bonds.
On or about April 20, 2011, an action was filed in the Superior Court of the Commonwealth of Massachusetts as case No. B.L.S. 11-1533 entitled Federal Home Loan bank of Boston v. Ally financial Inc., et al. Named as defendants in that action are IMH Assets Corp, Impac Funding Corporation, Impac Mortgage Holdings, Inc. and Impac Secured Assets Corp. The complaint alleges misrepresentations in connection with the materials used to market mortgage backed securities that the plaintiff purchased. The complaint seeks damages and attorney’s fees in an amount to be established at time of trial.
On or about May10, 2011 a purported class action complaint was filed in the United States District court, Central district of California as Case No. SACV11-00717 entitled Norma B. Power Trust, individually and on Behalf of All Others Similarly Situated v Impac Mortgage Holdings, Inc., et al. The action alleges that the Defendants filed unauthorized false, invalid amendments to the Company’s corporate charter with regards to the holders of series B Preferred Stock and Series C Preferred Stock. The action seeks recovery under Section 10(b) of the Exchange Act and Rule 10b-5, Section 13(a) of the Exchange Act, Rules 12b-20, 13a-1 and 13a-11. It also seeks recovery under Rule 14(e) and Section 20(a) of the Exchange Act. The Plaintiff seeks compensatory damages, costs, expenses, attorney’s fees and rescission.
We are party to other litigation and claims which are normal in the course of our operations. While the results of such other litigation and claims cannot be predicted with certainty, we believe the final outcome of such matters will not have a material adverse effect on our financial condition or results of operations.
The Company believes that it has meritorious defenses to the above claims and intends to defend these claims vigorously and as such the Company believes the final outcome of such matters will not have a material adverse effect on its financial condition or results of operations. Nevertheless, litigation is uncertain and the Company may not prevail in the lawsuits and can express no opinion as to their ultimate resolution. An adverse judgment in any of these matters could have a material adverse effect on the Company’s financial position and results of operations.
Please refer to IMH’s report on Form 10-K for the year ended December 31, 2010 for a description of litigation and claims.
Note 2.—Fair Value of Financial Instruments
The use of fair value to measure the Company’s financial instruments is fundamental to its consolidated financial statements and is a critical accounting estimate because a substantial portion of its assets and liabilities are recorded at estimated fair value.
For securitized mortgage collateral and securitized mortgage borrowings, the underlying Alt-A residential and commercial loans and mortgage-backed securities market have experienced significant declines in market activity, along with a lack of orderly transactions. The Company’s methodology to estimate fair value of these assets and liabilities include the use of internal pricing techniques such as the net present value of future expected cash flows (with observable market participant assumptions, where available) discounted at a rate of return based on the Company’s estimates of market participant requirements. The significant assumptions utilized in these internal pricing techniques, which are based on the characteristics of the underlying collateral, include estimated credit losses, estimated prepayment speeds and appropriate discount rates. The following table presents the estimated fair value of financial instruments included in the consolidated financial statements as of the dates indicated:
|
|
|
March 31, 2011 |
|
December 31, 2010 |
| ||||||||
|
|
|
Carrying |
|
Estimated |
|
Carrying |
|
Estimated |
| ||||
|
Assets |
|
|
|
|
|
|
|
|
| ||||
|
Cash and cash equivalents |
|
$ |
7,750 |
|
$ |
7,750 |
|
$ |
11,507 |
|
$ |
11,507 |
|
|
Restricted cash |
|
2,507 |
|
2,507 |
|
1,495 |
|
1,495 |
| ||||
|
Investment securities available-for-sale |
|
415 |
|
415 |
|
645 |
|
645 |
| ||||
|
Securitized mortgage collateral |
|
6,053,766 |
|
6,053,766 |
|
6,011,675 |
|
6,011,675 |
| ||||
|
Derivative assets |
|
37 |
|
37 |
|
40 |
|
40 |
| ||||
|
Mortgage servicing rights |
|
1,340 |
|
1,340 |
|
1,439 |
|
1,439 |
| ||||
|
Mortgage loans held-for-sale |
|
31,888 |
|
31,888 |
|
4,283 |
|
4,283 |
| ||||
|
Call option |
|
483 |
|
483 |
|
706 |
|
706 |
| ||||
|
|
|
|
|
|
|
|
|
|
| ||||
|
Liabilities |
|
|
|
|
|
|
|
|
| ||||
|
Securitized mortgage borrowings |
|
6,056,577 |
|
6,056,577 |
|
6,012,745 |
|
6,012,745 |
| ||||
|
Derivative liabilities |
|
46,243 |
|
46,243 |
|
65,916 |
|
65,916 |
| ||||
|
Long-term debt |
|
12,030 |
|
12,030 |
|
11,728 |
|
11,728 |
| ||||
|
Warehouse borrowings |
|
34,266 |
|
34,266 |
|
4,057 |
|
4,057 |
| ||||
|
Notes payable |
|
4,763 |
|
4,716 |
|
6,874 |
|
6,818 |
| ||||
|
Put option |
|
61 |
|
61 |
|
61 |
|
61 |
| ||||
The fair value amounts above have been estimated by management using available market information and appropriate valuation methodologies. Considerable judgment is required to interpret market data to develop the estimates of fair value in both inactive and orderly markets. Accordingly, the estimates presented are not necessarily indicative of the amounts that could be realized in a current market exchange. The use of different market assumptions and/or estimation methodologies may have a material effect on the estimated fair value amounts.
The carrying amount of cash and cash equivalents and restricted cash approximates fair value.
Refer to Recurring Fair Value Measurements below for a description of the valuation methods used to determine the fair value of investment securities available for sale, securitized mortgage collateral and borrowings, derivative assets and liabilities, long-term debt, mortgage servicing rights, loans held-for-sale, and call and put options.
Warehouse borrowings fair value approximates carrying amounts due to the short-term nature of the liabilities and do not present unanticipated interest rate or credit concerns.
Note payable is recorded at amortized cost. Notes payable includes notes with maturities ranging from less than a year to three years. For notes with maturities of less than a year, the estimated fair value approximates carrying value due to the short-term nature of the liabilities. Notes with maturities greater than a year, the estimated fair value is determined using a discounted cash flow model using market rates. The estimated fair value is less than the carrying value as certain notes are non-interest bearing.
Fair Value Hierarchy
The application of fair value measurements may be on a recurring or nonrecurring basis depending on the accounting principles applicable to the specific asset or liability or whether management has elected to carry the item at its estimated fair value.
FASB ASC 820-10-35 specifies a hierarchy of valuation techniques based on whether the inputs to those techniques are observable or unobservable. Observable inputs reflect market data obtained from independent sources, while unobservable inputs reflect the Company’s market assumptions. These two types of inputs create the following fair value hierarchy:
· Level 1—Quoted prices (unadjusted) in active markets for identical instruments or liabilities that an entity has the ability to assess at measurement date.
· Level 2—Quoted prices for similar instruments in active markets; quoted prices for identical or similar instruments in markets that are not active; inputs other than quoted prices that are observable for an asset or liability, including interest rates and yield curves observable at commonly quoted intervals, prepayment speeds, loss severities, credit risks and default rates; and market-corroborated inputs.
· Level 3—Valuations derived from valuation techniques in which one or more significant inputs or significant value drivers are unobservable.
This hierarchy requires the Company to use observable market data, when available, and to minimize the use of unobservable inputs when estimating fair value.
As a result of the lack of observable market data resulting from inactive markets, the Company has classified its investment securities available-for-sale, securitized mortgage collateral and borrowings, net derivative liabilities, long-term debt, mortgage servicing rights, and call and put options as Level 3 fair value measurements. Level 3 assets and liabilities were 99% and 100%, respectively, of total assets and total liabilities measured at estimated fair value at March 31, 2011 and December 31, 2010.
Recurring Fair Value Measurements
We assess our financial instruments on a quarterly basis to determine the appropriate classification within the fair value hierarchy, as defined by ASC Topic 810. Transfers between fair value classifications occur when there are changes in pricing observability levels. Transfers of financial instruments among the levels occur at the beginning of the reporting period. There were no material transfers between our Level 1 and Level 2 classified instruments during the three months ended March 31, 2011.
The following tables present the Company’s assets and liabilities that are measured at estimated fair value on a recurring basis, including financial instruments for which the Company has elected the fair value option at March 31, 2011 and December 31, 2010, based on the fair value hierarchy:
|
|
|
Recurring Fair Value Measurements |
| ||||||||||||||||
|
|
|
March 31, 2011 |
|
December 31, 2010 |
| ||||||||||||||
|
|
|
Level 1 |
|
Level 2 |
|
Level 3 |
|
Level 1 |
|
Level 2 |
|
Level 3 |
| ||||||
|
Assets |
|
|
|
|
|
|
|
|
|
|
|
|
| ||||||
|
Investment securities available-for-sale |
|
$ |
— |
|
$ |
— |
|
$ |
415 |
|
$ |
— |
|
$ |
— |
|
$ |
645 |
|
|
Mortgage loans held-for-sale |
|
— |
|
31,888 |
|
— |
|
— |
|
4,283 |
|
— |
| ||||||
|
Mortgage servicing rights (1) |
|
— |
|
— |
|
1,340 |
|
— |
|
— |
|
1,439 |
| ||||||
|
Call option (1) |
|
— |
|
— |
|
483 |
|
— |
|
— |
|
706 |
| ||||||
|
Securitized mortgage collateral |
|
— |
|
— |
|
6,053,766 |
|
— |
|
— |
|
6,011,675 |
| ||||||
|
Total assets at fair value |
|
$ |
— |
|
$ |
31,888 |
|
$ |
6,056,004 |
|
$ |
— |
|
$ |
4,283 |
|
$ |
6,014,465 |
|
|
|
|
|
|
|
|
|
|
|
|
|
|
|
| ||||||
|
Liabilities |
|
|
|
|
|
|
|
|
|
|
|
|
| ||||||
|
Securitized mortgage borrowings |
|
$ |
— |
|
$ |
— |
|
$ |
6,056,577 |
|
$ |
— |
|
$ |
— |
|
$ |
6,012,745 |
|
|
Derivative liabilities, net (2) |
|
— |
|
— |
|
46,205 |
|
— |
|
— |
|
65,876 |
| ||||||
|
Long-term debt |
|
— |
|
— |
|
12,030 |
|
— |
|
— |
|
11,728 |
| ||||||
|
Put option (3) |
|
— |
|
— |
|
61 |
|
— |
|
— |
|
61 |
| ||||||
|
Total liabilities at fair value |
|
$ |
— |
|
$ |
— |
|
$ |
6,114,873 |
|
$ |
— |
|
$ |
— |
|
$ |
6,090,410 |
|
(1) Included in other assets in the accompanying balance sheets.
(2) At March 31, 2011, derivative liabilities, net included $37 thousand in derivative assets and $46.2 million in derivative liabilities, included within trust assets and trust liabilities, respectively. At December 31, 2010, derivative liabilities, net included $40 thousand in derivative assets and $65.9 million in derivative liabilities, included within trust assets and trust liabilities, respectively.
(3) Included in other liabilities in the accompanying balance sheets.
The following tables present a reconciliation for all assets and liabilities measured at estimated fair value on a recurring basis using significant unobservable inputs (Level 3) for the three months ended March 31, 2011 and 2010:
|
|
|
Level 3 Recurring Fair Value Measurements |
| ||||||||||||||||||||||
|
|
|
For the three months ended March 31, 2011 |
| ||||||||||||||||||||||
|
|
|
Investment |
|
Securitized |
|
Securitized |
|
Derivative |
|
Mortgage |
|
Call option |
|
Put Option |
|
Long-term |
| ||||||||
|
Fair value, December 31, 2010 |
|
$ |
645 |
|
$ |
6,011,675 |
|
$ |
(6,012,745 |
) |
$ |
(65,876 |
) |
$ |
1,439 |
|
$ |
706 |
|
$ |
(61 |
) |
$ |
(11,728 |
) |
|
Total gains (losses) included in earnings: |
|
|
|
|
|
|
|
|
|
|
|
|
|
|
|
|
| ||||||||
|
Interest income (1) |
|
28 |
|
107,369 |
|
— |
|
— |
|
— |
|
— |
|
— |
|
— |
| ||||||||
|
Interest expense (1) |
|
— |
|
— |
|
(194,015 |
) |
— |
|
— |
|
— |
|
— |
|
(540 |
) | ||||||||
|
Change in fair value |
|
(202 |
) |
139,446 |
|
(137,278 |
) |
2,930 |
|
(99 |
) |
(223 |
) |
— |
|
238 |
| ||||||||
|
Total gains (losses) included in earnings |
|
(174 |
) |
246,815 |
|
(331,293 |
) |
2,930 |
|
(99 |
) |
(223 |
) |
— |
|
(302 |
) | ||||||||
|
Transfers in and/or out of Level 3 |
|
— |
|
— |
|
— |
|
— |
|
— |
|
— |
|
— |
|
— |
| ||||||||
|
Purchases, issuances and settlements |
|
|
|
|
|
|
|
|
|
|
|
|
|
|
|
|
| ||||||||
|
Purchases |
|
— |
|
— |
|
— |
|
— |
|
— |
|
— |
|
— |
|
— |
| ||||||||
|
Issuances |
|
— |
|
— |
|
— |
|
— |
|
— |
|
— |
|
— |
|
— |
| ||||||||
|
Settlements |
|
(56 |
) |
(204,724 |
) |
287,461 |
|
16,741 |
|
— |
|
— |
|
— |
|
— |
| ||||||||
|
Fair value, March 31, 2011 |
|
$ |
415 |
|
$ |
6,053,766 |
|
$ |
(6,056,577 |
) |
$ |
(46,205 |
) |
$ |
1,340 |
|
$ |
483 |
|
$ |
(61 |
) |
$ |
(12,030 |
) |
|
|
|
|
|
|
|
|
|
|
|
|
|
|
|
|
|
|
| ||||||||
|
Unrealized gains (losses) still held (2) |
|
$ |
202 |
|
$ |
(4,342,090 |
) |
$ |
6,222,257 |
|
$ |
(46,475 |
) |
$ |
— |
|
$ |
— |
|
$ |
— |
|
$ |
58,733 |
|
(1) Amounts primarily represent accretion to recognize interest income and interest expense using effective yields based on estimated fair values for trust assets and trust liabilities. The total net interest income, including cash received and paid, was $1.5 million for the three months ended March 31, 2011, as reflected in the accompanying consolidated statement of operations.
(2) Represents the amount of unrealized gains (losses) relating to assets and liabilities classified as Level 3 that are still held and reflected in the fair values at March 31, 2011.
|
|
|
Level 3 Recurring Fair Value Measurements |
| |||||||||||||
|
|
|
For the three months ended March 31, 2010 |
| |||||||||||||
|
|
|
Investment |
|
Securitized |
|
Securitized |
|
Derivative |
|
Long-term |
| |||||
|
Fair value, December 31, 2009 |
|
$ |
813 |
|
$ |
5,666,122 |
|
$ |
(5,659,865 |
) |
$ |
(126,457 |
) |
$ |
(9,773 |
) |
|
Total gains (losses) included in earnings: |
|
|
|
|
|
|
|
|
|
|
| |||||
|
Interest income (1) |
|
47 |
|
130,229 |
|
— |
|
— |
|
— |
| |||||
|
Interest expense (1) |
|
— |
|
— |
|
(255,513 |
) |
— |
|
(668 |
) | |||||
|
Change in fair value |
|
178 |
|
681,408 |
|
(656,199 |
) |
(18,015 |
) |
(291 |
) | |||||
|
Total gains (losses) included in earnings |
|
225 |
|
811,637 |
|
(911,712 |
) |
(18,015 |
) |
(959 |
) | |||||
|
Adoption of ASU 2009-17 (2) |
|
(298 |
) |
116,907 |
|
(110,618 |
) |
(9,013 |
) |
— |
| |||||
|
Transfers in and/or out of Level 3 |
|
— |
|
— |
|
— |
|
— |
|
— |
| |||||
|
Purchases, issuances and settlements |
|
|
|
|
|
|
|
|
|
|
| |||||
|
Purchases |
|
— |
|
— |
|
— |
|
— |
|
— |
| |||||
|
Issuances |
|
— |
|
— |
|
— |
|
— |
|
— |
| |||||
|
Settlements |
|
(70 |
) |
(227,811 |
) |
330,305 |
|
35,609 |
|
— |
| |||||
|
Fair value, March 31, 2010 |
|
$ |
670 |
|
$ |
6,366,855 |
|
$ |
(6,351,890 |
) |
$ |
(117,876 |
) |
$ |
(10,732 |
) |
|
|
|
|
|
|
|
|
|
|
|
|
| |||||
|
Unrealized (losses) gains still held (3) |
|
$ |
368 |
|
$ |
(5,491,407 |
) |
$ |
7,093,620 |
|
$ |
(119,405 |
) |
$ |
60,031 |
|
(1) Amounts primarily represent accretion to recognize interest income and interest expense using effective yields based on estimated fair values for trust assets and trust liabilities. The total net interest income, including cash received and paid, was $770 thousand for the three months ended March 31, 2010, as reflected in the accompanying consolidated statement of operations.
(2) Amounts represent the consolidation and deconsolidation of trust assets and liabilities as a result of the adoption of ASU 2009-17 on January 1, 2010. See Note 1. — Summary of Market Conditions and Liquidity, Business and Financial Statement Presentation including Significant Accounting Policies in our Annual Report on Form 10K for the year ended December 31, 2010 for the impact of the adoption of ASU 2009-17 on our consolidated financial statements.
(3) Represents the amount of unrealized gains (losses) relating to assets and liabilities classified as Level 3 that are still held at March 31, 2010.
The following tables present the changes in recurring fair value measurements included in net earnings (loss) for the three months ended March 31, 2011 and 2010:
|
|
|
Recurring Fair Value Measurements |
| ||||||||||||||||
|
|
|
Changes in Fair Value Included in Net Earnings |
| ||||||||||||||||
|
|
|
For the three months ended March 31, 2011 |
| ||||||||||||||||
|
|
|
|
|
|
|
Change in Fair Value of |
|
Other non-interest |
|
|
| ||||||||
|
|
|
Interest Income (1) |
|
Interest Expense (1) |
|
Net Trust Assets |
|
Long-term Debt |
|
income |
|
Total |
| ||||||
|
Investment securities available-for-sale |
|
$ |
28 |
|
$ |
— |
|
$ |
(202 |
) |
$ |
— |
|
$ |
— |
|
$ |
(174 |
) |
|
Securitized mortgage collateral |
|
107,369 |
|
— |
|
139,446 |
|
— |
|
— |
|
246,815 |
| ||||||
|
Securitized mortgage borrowings |
|
— |
|
(194,015 |
) |
(137,278 |
) |
— |
|
— |
|
(331,293 |
) | ||||||
|
Mortgage servicing rights |
|
— |
|
— |
|
— |
|
— |
|
(99 |
) |
(99 |
) | ||||||
|
Call option |
|
— |
|
— |
|
— |
|
— |
|
(223 |
) |
(223 |
) | ||||||
|
Put option |
|
— |
|
— |
|
— |
|
— |
|
— |
|
— |
| ||||||
|
Derivative instruments, net |
|
— |
|
— |
|
2,930 |
(2) |
— |
|
— |
|
2,930 |
| ||||||
|
Long-term debt |
|
— |
|
(540 |
) |
— |
|
238 |
|
— |
|
(302 |
) | ||||||
|
Total |
|
$ |
107,397 |
|
$ |
(194,555 |
) |
$ |
4,896 |
(3) |
$ |
238 |
|
$ |
(322 |
) |
$ |
(82,346 |
) |
(1) Amounts primarily represent accretion to recognize interest income and interest expense using effective yields based on estimated fair values for trust assets and trust liabilities.
(2) Included in this amount is $20.0 million in changes in the fair value of derivative instruments, offset by $17.1 million in cash payments from the securitization trusts for the three months ended March 31, 2011.
(3) For the three months ended March 31, 2011, change in the fair value of trust assets, excluding REO was $4.9 million. Excluded from the $22.0 million change in fair value of net trust assets, excluding REO, in the accompanying consolidated statement of cash flows is $17.1 million in cash payments from the securitization trusts related to the Company’s net derivative liabilities.
|
|
|
Recurring Fair Value Measurements |
| |||||||||||||
|
|
|
Changes in Fair Value Included in Net Loss |
| |||||||||||||
|
|
|
For the three months ended March 31, 2010 |
| |||||||||||||
|
|
|
|
|
|
|
Change in Fair Value of |
|
|
| |||||||
|
|
|
Interest Income (1) |
|
Interest Expense (1) |
|
Net Trust Assets |
|
Long-term Debt |
|
Total |
| |||||
|
Investment securities available-for-sale |
|
$ |
47 |
|
$ |
— |
|
$ |
178 |
|
$ |
— |
|
$ |
225 |
|
|
Securitized mortgage collateral |
|
130,229 |
|
— |
|
681,408 |
|
— |
|
811,637 |
| |||||
|
Securitized mortgage borrowings |
|
— |
|
(255,513 |
) |
(656,199 |
) |
— |
|
(911,712 |
) | |||||
|
Derivative instruments, net |
|
— |
|
— |
|
(18,015 |
)(2) |
— |
|
(18,015 |
) | |||||
|
Long-term debt |
|
— |
|
(668 |
) |
— |
|
(291 |
) |
(959 |
) | |||||
|
Total |
|
$ |
130,276 |
|
$ |
(256,181 |
) |
$ |
7,372 |
(3) |
$ |
(291 |
) |
$ |
(118,824 |
) |
(1) Amounts primarily represent accretion to recognize interest income and interest expense using effective yields based on estimated fair values for trust assets and trust liabilities.
(2) Included in this amount is $17.9 million in changes in the fair value of derivative instruments, offset by $35.9 million in cash payments from the securitization trusts for the three months ended March 31, 2010.
(3) For the three months ended March 31, 2010, change in the fair value of net trust assets, excluding REO was $7.4 million. Excluded from the $43.3 million change in fair value of net trust assets, excluding REO, in the accompanying consolidated statement of cash flows is $35.9 million in cash payments from the securitization trusts related to the Company’s net derivative liabilities.
The following is a description of the measurement techniques for items recorded at estimated fair value on a recurring basis.
Investment securities available-for-sale—The Company elected to carry all of its investment securities available-for-sale at fair value. The investment securities consist primarily of non-investment grade mortgage-backed securities. The fair value of the investment securities is measured based upon the Company’s expectation of inputs that other market participants would use. Such assumptions include judgments about the underlying collateral, prepayment speeds, future credit losses, forward interest rates and certain other factors. Given the market disruption and lack of observable market data as of March 31, 2011 and December 31, 2010, the estimated fair value of the investment securities available-for-sale was measured using significant internal expectations of market participants’ assumptions.
Mortgage servicing rights—The Company elected to carry all of its mortgage servicing rights arising from its newly acquired mortgage lending operation at fair value. The fair value of mortgage servicing rights is based upon an internal discounted cash flow model. The valuation model incorporates assumptions that market participants would use in estimating the fair value of servicing. These assumptions include estimates of prepayment speeds, discount rate, cost to service, escrow account earnings, contractual servicing fee income, prepayment and late fees, among other considerations. Mortgage servicing rights are considered a Level 3 measurement at March 31, 2011.
Mortgage loans held-for-sale—The Company elected to carry its mortgage loans held-for-sale originated from its recently formed residential mortgage lending platform at fair value. Fair value is based on quoted market prices, where available, prices for other traded mortgage loans with similar characteristics, and purchase commitments and bid information received from market participants. Given the meaningful level of secondary market activity for conforming mortgage loans, active pricing is available for similar assets and accordingly, the Company classifies its mortgage loans held-for-sale as a Level 2 measurement at March 31, 2011.
Call option—As part of the acquisition of AmeriHome Mortgage Corporation (AmeriHome) as more fully discussed in Note 18.—Business Combinations of our Annual Report on Form 10-K for the year ended December 31, 2010, the purchase agreement included a call option to purchase an additional 39% of AmeriHome. The estimated fair value is based on a multinomial model incorporating various assumptions including expected future book value of AmeriHome, the probability of the option being exercised, volatility, expected term and certain other factors. The call option is considered a Level 3 measurement at March 31, 2011.
Put option—As part of the acquisition of AmeriHome, a put option which allows the noncontrolling interest holder to sell his remaining 49% of AmeriHome to the Company in the event the Company does not exercise the call option discussed above. The estimated fair value is based on a multinomial model incorporating various assumptions including expected future book value of AmeriHome, the probability of the option being exercised, volatility, expected term and certain other factors. The put option is considered a Level 3 measurement at March 31, 2011.
Securitized mortgage collateral—The Company elected to carry all of its securitized mortgage collateral at fair value. These assets consist primarily of non-conforming mortgage loans securitized between 2002 and 2007. Fair value measurements are based on the Company’s internal models used to compute the net present value of future expected cash flows with observable market participant assumptions where available. The Company’s assumptions include its expectations of inputs that other market participants would use in pricing these assets. These assumptions include judgments about the underlying collateral, prepayment speeds, estimated future credit losses, forward interest rates, investor yield requirements and certain other factors. As of March 31, 2011, securitized mortgage collateral had an unpaid principal balance of $10.4 billion, compared to an estimated fair value of $6.1 billion. The aggregate unpaid principal balance exceeds the fair value by $4.3 billion at March 31, 2011. As of March 31, 2011, the unpaid principal balance of loans 90 days or more past due was $1.8 billion compared to an estimated fair value of $0.5 billion. The aggregate unpaid principal balances of loans 90 days or more past due exceed the fair value by $1.3 billion at March 31, 2011.
Securitized mortgage borrowings—The Company elected to carry all of its securitized mortgage borrowings at fair value. These borrowings consist of individual tranches of bonds issued by securitization trusts and are primarily backed by non-conforming mortgage loans. Fair value measurements include the Company’s judgments about the underlying collateral and assumptions such as prepayment speeds, estimated future credit losses, forward interest rates, investor yield requirements and certain other factors. As of March 31, 2011, securitized mortgage borrowings had an outstanding principal balance of $10.6 billion compared to an estimated fair value of $6.1 billion. The aggregate outstanding principal balance exceeds the fair value by $4.5 billion at March 31, 2011.
Long-term debt—The Company elected to carry all of its long-term debt (consisting of trust preferred securities and junior subordinated notes) at fair value. These securities are measured based upon an analysis prepared by management, which considered the Company’s own credit risk, including settlements with trust preferred debt holders and discounted cash flow analysis. As of March 31, 2011, long-term debt had an unpaid principal balance of $70.5 million compared to an estimated fair value of $12.0 million. The aggregate unpaid principal balance exceeds the fair value by $58.5 million at March 31, 2011.
Derivative assets and liabilities—For non-exchange traded contracts, fair value is based on the amounts that would be required to settle the positions with the related counterparties as of the valuation date. Valuations of derivative assets and liabilities are based on observable market inputs, if available. To the extent observable market inputs are not available, fair values measurements include the Company’s judgments about future cash flows, forward interest rates and certain other factors, including counterparty risk. Additionally, these values also take into account the Company’s own credit standing, to the extent applicable; thus, the valuation of the derivative instrument includes the estimated value of the net credit differential between the counterparties to the derivative contract.
Nonrecurring Fair Value Measurements
The Company is required to measure certain assets and liabilities at estimated fair value from time to time. These fair value measurements typically result from the application of specific accounting pronouncements under GAAP. The fair value measurements are considered nonrecurring fair value measurements under FASB ASC 820-10.
The following tables present financial and non-financial assets and liabilities measured using nonrecurring fair value measurements at March 31, 2011 and 2010, respectively:
|
|
|
Nonrecurring Fair Value Measurements |
|
Total Gains (Losses) |
| ||||||||
|
|
|
March 31, 2011 |
|
For the Three Months Ended |
| ||||||||
|
|
|
Level 1 |
|
Level 2 |
|
Level 3 |
|
March 31, 2011 (5) |
| ||||
|
REO (1) |
|
$ |
— |
|
$ |
62,656 |
|
$ |
— |
|
$ |
(4,247 |
) |
|
Lease liability (2) |
|
— |
|
— |
|
(2,246 |
) |
(217 |
) | ||||
|
Deferred charge (3) |
|
— |
|
— |
|
13,144 |
|
— |
| ||||
|
Intangible assets (4) |
|
— |
|
— |
|
1,479 |
|
— |
| ||||
(1) Amounts are included in continuing operations. For the three months ended March 31, 2011, the $4.3 million loss related to additional impairment write-downs during the period is within continuing operations.
(2) Amounts are included in discontinued operations. For the three months ended March 31, 2011, the Company recorded $217 thousand in losses resulting from changes in lease liabilities as a result of changes in our expected minimum future lease payments.
(3) Amounts are included in continuing operations. For the three months ended March 31, 2011, the Company recorded zero in income tax expense resulting from impairment write-downs based on changes in estimated cash flows and lives of the related mortgages retained in the securitized mortgage collateral.
(4) Amount is included in other assets in the accompanying consolidated balance sheets.
(5) Total gains (losses) reflect gains and losses from all nonrecurring measurements during the period.
|
|
|
Non-recurring Fair Value Measurements |
|
Total Gains |
| ||||||||
|
|
|
March 31, 2010 |
|
For the Three Months Ended |
| ||||||||
|
|
|
Level 1 |
|
Level 2 |
|
Level 3 |
|
March 31, 2010 (6) |
| ||||
|
Mortgage loans held-for-sale (1) |
|
$ |
— |
|
$ |
— |
|
$ |
3,049 |
|
$ |
254 |
|
|
REO (2) |
|
— |
|
95,794 |
|
— |
|
1,028 |
| ||||
|
Lease liability (3) |
|
— |
|
— |
|
(3,178 |
) |
479 |
| ||||
|
Deferred charge (4) |
|
— |
|
— |
|
13,144 |
|
— |
| ||||
|
Intangible asset (5) |
|
— |
|
— |
|
1,000 |
|
— |
| ||||
(1) Relates to Alt-A loans held-for-sale included in assets of discontinued operations.
(2) Includes $95.6 million and $175 thousand in REO within continuing and discontinued operations, respectively, at March 31, 2010 which had additional impairment write-downs subsequent to the date of foreclosure. For the three months ended March 31, 2010, the $1.0 million gain during the period included $672 thousand and $355 thousand within continuing and discontinued operations, respectively.
(3) Amounts are included in discontinued operations. For the three months ended March 31, 2010, the Company recorded $485 thousand in gains resulting from changes in lease liabilities as a result of changes in our expected minimum future lease payments, respectively.
(4) Amounts are included in continuing operations. For the three months ended March 31, 2010, the Company recorded zero in income tax expense resulting from impairment write-downs based on changes in estimated cash flows and lives of the related mortgages retained in the securitized mortgage collateral.
(5) Amount is included in other assets in the accompanying consolidated balance sheets.
(6) Total gains (losses) reflect gains and losses from all nonrecurring measurements during the period.
Mortgage loans held-for-sale—Mortgage loans held-for-sale (included in assets of discontinued operations) for which the fair value option was not elected are carried at the lower of cost or market (LOCOM). When available, such measurements are based upon what secondary markets offer for portfolios with similar characteristics, and are considered Level 2 measurements. If market pricing is not available, such measurements are significantly impacted by the Company’s expectations of other market participants’ assumptions, and are considered Level 3 measurements. The Company utilizes internal pricing processes to estimate the fair value of these loans, which is based on recent loan sales and estimates of the fair value of the underlying collateral. Loans held-for-sale from the discontinued non-conforming lending division is considered Level 3 fair value measurements at March 31, 2010.
Real estate owned—REO consists of residential real estate acquired in satisfaction of loans. Upon foreclosure, REO is adjusted to the estimated fair value of the residential real estate less estimated selling and holding costs, offset by expected contractual mortgage insurance proceeds to be received, if any. Subsequently, REO is recorded at the lower of carrying value or estimated fair value less costs to sell. Fair values of REO are generally based on observable market inputs, and considered Level 2 measurements at March 31, 2011.
Lease liability—In connection with the discontinuation of our non-conforming mortgage, retail mortgage, warehouse lending and commercial operations, a significant amount of office space that was previously occupied is no longer being used by the Company. The Company has subleased a significant amount of this office space. The Company has recorded a liability, included within discontinued operations, representing the present value of the minimum lease payments over the remaining life of the lease, offset by the expected proceeds from sublet revenue related to this office space. This liability is based on present value techniques that incorporate the Company’s judgments about estimated sublet revenue and discount rates. Therefore, this liability is considered a Level 3 measurement at March 31, 2011.
Deferred charge—Deferred charge represents the deferral of income tax expense on inter-company profits that resulted from the sale of mortgages from taxable subsidiaries to IMH in prior years. The deferred charge is amortized as a component of income tax expense over the estimated life of the mortgages retained in the securitized mortgage collateral. The Company evaluates the deferred charge for impairment quarterly using internal estimates of estimated cash flows and lives of the related mortgages retained in the securitized mortgage collateral. If the deferred charge is determined to be impaired, it is amortized as a component of income tax expense. Deferred charge is considered a Level 3 measurement at March 31, 2011.
Intangible assets—Intangible assets deemed to have an indefinite life are tested annually for impairment, or more frequently if events or changes in circumstances indicate that the asset might be impaired. Impairment losses are recognized if carrying amount of an intangible asset exceeds its estimated fair value. Intangible asset, which is included in other assets of continuing operations, is considered a Level 3 measurement at March 31, 2011.
Note 3.—Stock Options
There were no options granted during the three months ended March 31, 2011 or 2010, respectively.
The following table summarizes activity, pricing and other information for the Company’s stock options for the three months ended March 31, 2011:
|
|
|
|
|
Weighted- |
| |
|
|
|
|
|
Average |
| |
|
|
|
Number of |
|
Exercise |
| |
|
|
|
Shares |
|
Price ($) |
| |
|
Options outstanding at January 1, 2011 |
|
1,476,704 |
|
$ |
6.28 |
|
|
Options granted |
|
— |
|
— |
| |
|
Options exercised |
|
(1,000 |
) |
0.53 |
| |
|
Options forfeited / cancelled |
|
(58,632 |
) |
37.71 |
| |
|
Options outstanding at March 31, 2011 |
|
1,417,072 |
|
$ |
4.98 |
|
|
Options exercisable at March 31, 2011 |
|
1,025,534 |
|
$ |
5.83 |
|
As of March 31, 2011, there was approximately $820 thousand of total unrecognized compensation cost related to stock option compensation arrangements granted under the plan, net of estimated forfeitures. That cost is expected to be recognized over the remaining weighted average period of 2.64 years.
The following table summarizes activity, pricing and other information for the Company’s restricted stock units (RSU’s) for the three months ended March 31, 2011:
|
|
|
|
|
Weighted- |
| |
|
|
|
|
|
Average |
| |
|
|
|
Number of |
|
Grant Date |
| |
|
|
|
Shares |
|
Fair Value |
| |
|
RSU’s outstanding at January 1, 2011 |
|
24,000 |
|
$ |
2.73 |
|
|
RSU’s granted |
|
— |
|
— |
| |
|
RSU’s exercised |
|
— |
|
— |
| |
|
RSU’s forfeited / cancelled |
|
— |
|
— |
| |
|
RSU’s outstanding at March 31, 2011 |
|
24,000 |
|
$ |
2.73 |
|
As of March 31, 2011, there was approximately $58 thousand of total unrecognized compensation cost related to the RSU compensation arrangements granted under the plan. That cost is expected to be recognized over a weighted average period of 2.68 years.
Note 4.—Reconciliation of Earnings Per Share
The following table presents the computation of basic and diluted earnings (loss) per common share, including the dilutive effect of stock options and cumulative redeemable preferred stock outstanding for the periods indicated:
|
|
|
For the Three Months |
| ||||
|
|
|
Ended March 31, |
| ||||
|
|
|
2011 |
|
2010 |
| ||
|
Numerator for basic earnings (loss) per share: |
|
|
|
|
| ||
|
(Loss) earnings from continuing operations |
|
$ |
(952 |
) |
$ |
3,229 |
|
|
Net loss attributable to noncontrolling interest |
|
315 |
|
303 |
| ||
|
(Loss) earnings from continuing operations attributable to IMH |
|
(637 |
) |
3,532 |
| ||
|
(Loss) earnings from discontinued operations |
|
(350 |
) |
2,386 |
| ||
|
(Loss) earnings per share available to common stockholders |
|
$ |
(987 |
) |
$ |
5,918 |
|
|
|
|
|
|
|
| ||
|
Denominator for basic earnings (loss) per share (1): |
|
|
|
|
| ||
|
Basic weighted average common shares outstanding during the year |
|
7,788 |
|
7,698 |
| ||
|
|
|
|
|
|
| ||
|
Denominator for diluted earnings per share (1): |
|
|
|
|
| ||
|
Basic weighted average common shares outstanding during the year |
|
7,788 |
|
7,698 |
| ||
|
Net effect of dilutive stock options |
|
— |
|
620 |
| ||
|
Diluted weighted average common shares |
|
7,788 |
|
8,318 |
| ||
|
|
|
|
|
|
| ||
|
(Loss) earnings per common share - basic: |
|
|
|
|
| ||
|
(Loss) earnings from continuing operations |
|
$ |
(0.08 |
) |
$ |
0.46 |
|
|
(Loss) earnings from discontinued operations |
|
(0.04 |
) |
0.31 |
| ||
|
(Loss) earnings per share available to common stockholders |
|
$ |
(0.12 |
) |
$ |
0.77 |
|
|
|
|
|
|
|
| ||
|
(Loss) earnings per common share - diluted: |
|
|
|
|
| ||
|
(Loss) earnings from continuing operations |
|
$ |
(0.08 |
) |
$ |
0.42 |
|
|
(Loss) earnings from discontinued operations |
|
(0.04 |
) |
0.29 |
| ||
|
(Loss) earnings per share available to common stockholders |
|
$ |
(0.12 |
) |
$ |
0.71 |
|
(1) Number of shares presented in thousands.
For the three months ended March 31, 2011 and 2010, stock options to purchase 1.4 million and 459 thousand shares, respectively, were outstanding but not included in the above weighted average share calculations because they were anti-dilutive.
Note 5.—Segment Reporting
The Company has three reporting segments, consisting of the long-term mortgage portfolio, mortgage and real estate services and discontinued operations. The following tables present the selected financial data and operating results by reporting segment for the periods indicated:
|
|
|
|
|
Mortgage and |
|
|
|
|
|
|
| ||||
|
|
|
Long-term |
|
Real Estate |
|
Discontinued |
|
|
|
|
| ||||
|
|
|
Portfolio |
|
Services |
|
Operations |
|
Reclassifications (1) |
|
Consolidated |
| ||||
|
Balance sheet items as of March 31, 2011: |
|
|
|
|
|
|
|
|
|
|
| ||||
|
Cash and cash equivalents |
|
$ |
— |
|
$ |
8,146 |
|
$ |
9 |
|
$ |
(405 |
) |
7,750 |
|
|
Restricted cash |
|
1,012 |
|
1,495 |
|
91 |
|
(91 |
) |
2,507 |
| ||||
|
Trust assets |
|
6,128,927 |
|
— |
|
— |
|
— |
|
6,128,927 |
| ||||
|
Mortgage loans held-for-sale |
|
— |
|
31,888 |
|
— |
|
— |
|
31,888 |
| ||||
|
Other assets |
|
16,320 |
|
18,106 |
|
196 |
|
100 |
|
34,722 |
| ||||
|
Total assets |
|
6,146,259 |
|
59,635 |
|
296 |
|
(396 |
) |
6,205,794 |
| ||||
|
Total liabilities |
|
6,124,377 |
|
43,053 |
|
12,004 |
|
(396 |
) |
6,179,038 |
| ||||
|
Total stockholders’ equity (deficit) |
|
21,882 |
|
16,582 |
|
(11,708 |
) |
— |
|
26,756 |
| ||||
|
|
|
|
|
|
|
|
|
|
|
|
| ||||
|
Balance sheet items as of December 31, 2010: |
|
|
|
|
|
|
|
|
|
|
| ||||
|
Cash and cash equivalents |
|
$ |
— |
|
$ |
12,259 |
|
$ |
113 |
|
$ |
(865 |
) |
11,507 |
|
|
Restricted cash |
|
— |
|
1,495 |
|
91 |
|
(91 |
) |
1,495 |
| ||||
|
Trust assets |
|
6,105,068 |
|
— |
|
— |
|
— |
|
6,105,068 |
| ||||
|
Mortgage loans held-for-sale |
|
— |
|
4,283 |
|
— |
|
— |
|
4,283 |
| ||||
|
Other assets |
|
18,526 |
|
12,687 |
|
169 |
|
204 |
|
31,586 |
| ||||
|
Total assets |
|
6,123,594 |
|
30,724 |
|
373 |
|
(752 |
) |
6,153,939 |
| ||||
|
Total liabilities |
|
6,101,157 |
|
12,784 |
|
13,053 |
|
(752 |
) |
6,126,242 |
| ||||
|
Total stockholders’ equity (deficit) |
|
22,437 |
|
17,940 |
|
(12,680 |
) |
— |
|
27,697 |
| ||||
|
|
|
|
|
Mortgage and |
|
|
|
|
|
|
| |||||
|
Statement of Operations Items |
|
Long-term |
|
Real Estate |
|
Discontinued |
|
|
|
|
| |||||
|
for the three months ended March 31, 2011: |
|
Portfolio |
|
Services |
|
Operations |
|
Reclassifications (1) |
|
Consolidated |
| |||||
|
Net interest income |
|
$ |
1,535 |
|
$ |
— |
|
$ |
— |
|
$ |
— |
|
$ |
1,535 |
|
|
Non-interest income- net trust assets |
|
647 |
|
— |
|
— |
|
— |
|
647 |
| |||||
|
Change in fair value of long-term debt |
|
238 |
|
— |
|
— |
|
— |
|
238 |
| |||||
|
Mortgage and real estate services fees |
|
— |
|
11,690 |
|
— |
|
— |
|
11,690 |
| |||||
|
Other non-interest (expense) income |
|
(32 |
) |
327 |
|
(131 |
) |
131 |
|
295 |
| |||||
|
Non-interest expense and income taxes |
|
(4,270 |
) |
(11,087 |
) |
(219 |
) |
219 |
|
(15,357 |
) | |||||
|
(Loss) earnings from continuing operations |
|
$ |
(1,882 |
) |
$ |
930 |
|
|
|
|
|
(952 |
) | |||
|
Loss from discontinued operations, net of tax |
|
|
|
|
|
$ |
(350 |
) |
|
|
(350 |
) | ||||
|
Net loss |
|
|
|
|
|
|
|
|
|
$ |
(1,302 |
) | ||||
|
|
|
|
|
Mortgage and |
|
|
|
|
|
|
| ||||
|
Statement of Operations Items |
|
Long-term |
|
Real Estate |
|
Discontinued |
|
|
|
|
| ||||
|
for the three months ended March 31, 2010: |
|
Portfolio |
|
Services |
|
Operations |
|
Reclassifications (1) |
|
Consolidated |
| ||||
|
Net interest income |
|
765 |
|
5 |
|
27 |
|
(27 |
) |
$ |
770 |
| |||
|
Non-interest income- net trust assets |
|
6,264 |
|
— |
|
— |
|
— |
|
6,264 |
| ||||
|
Change in fair value of long-term debt |
|
(291 |
) |
— |
|
— |
|
— |
|
(291 |
) | ||||
|
Mortgage and real estate services fees |
|
— |
|
10,950 |
|
— |
|
— |
|
10,950 |
| ||||
|
Other non-interest (expense) income |
|
1 |
|
79 |
|
2,085 |
|
(2,085 |
) |
80 |
| ||||
|
Non-interest expense and income taxes |
|
(4,645 |
) |
(9,899 |
) |
274 |
|
(274 |
) |
(14,544 |
) | ||||
|
Earnings from continuing operations |
|
$ |
2,094 |
|
$ |
1,135 |
|
|
|
|
|
3,229 |
| ||
|
Earnings from discontinued operations, net of tax |
|
|
|
|
|
$ |
2,386 |
|
|
|
2,386 |
| |||
|
Net earnings |
|
|
|
|
|
|
|
|
|
$ |
5,615 |
| |||
(1) Amounts represent reclassifications of activity in the discontinued operations segment into loss from discontinued operations, net of tax as presented in the accompanying consolidated statements of operations.
Note 6.—Warehouse Borrowings
The Company, through IRES and its subsidiaries, enters into Master Repurchase Agreements with lenders providing warehouse facilities. The warehouse facilities are used to fund and are secured by residential mortgage loans that are held for sale.
In March 2011, the Company, through IRES and its subsidiaries, entered into a Master Repurchase Agreement with a lender providing a $20 million warehouse facility (Repurchase Agreement 4). The interest rate relating to this agreement is Prime plus 1.50% and expires March 2012. Under the terms of this warehouse facility, IRES and its subsidiaries are required to maintain various financial and other covenants.
At March 31, 2011, the Company was in compliance with all financial covenants of its four repurchase agreements.
The following table presents certain information on warehouse borrowings for the periods indicated:
|
|
|
Maximum |
|
|
|
|
| |||
|
|
|
Borrowing |
|
Balance Outstanding at |
| |||||
|
|
|
Capacity |
|
March 31, 2011 |
|
December 31, 2010 |
| |||
|
Short-term borrowings: |
|
|
|
|
|
|
| |||
|
Repurchase agreement 1 |
|
$ |
25,000 |
|
$ |
8,530 |
|
$ |
477 |
|
|
Repurchase agreement 2 (1) |
|
3,500 |
|
2,112 |
|
1,800 |
| |||
|
Repurchase agreement 3 (2) |
|
25,000 |
|
23,010 |
|
1,780 |
| |||
|
Repurchase agreement 4 |
|
20,000 |
|
614 |
|
— |
| |||
|
Total short-term borrowings |
|
$ |
73,500 |
|
$ |
34,266 |
|
$ |
4,057 |
|
(1) In April 2011, the maturity was extended to May 2011.
(2) The maximum borrowing capacity increased to $32.5 million in April 2011.
Note 7.—Subsequent Events
Subsequent events have been evaluated through the date of this filing.
In April 2011, the Company, through its subsidiaries, entered into a $2.0 million working capital line of credit agreement with a national bank with an interest rate of LIBOR plus 3.5%. The agreement expires in April 2012 and under the terms of the agreement the Company and its subsidiaries are required to maintain various financial and other covenants.
ITEM 2: MANAGEMENT’S DISCUSSION AND ANALYSIS OF FINANCIAL CONDITION AND RESULTS OF OPERATIONS
(dollars in thousands, except per share data or as otherwise indicated)
Unless the context otherwise requires, the terms “Company,” “we,” “us,” and “our” refer to Impac Mortgage Holdings, Inc. (the Company or IMH), a Maryland corporation incorporated in August 1995, and its subsidiaries, Integrated Real Estate Service Corporation (IRES), IMH Assets Corp. (IMH Assets), Impac Warehouse Lending Group, Inc. (IWLG) and Impac Funding Corporation (IFC).
This report on Form 10-Q contains certain forward-looking statements within the meaning of Section 27A of the Securities Act of 1933 and Section 21E of the Securities Exchange Act of 1934. Forward-looking statements, some of which are based on various assumptions and events that are beyond our control, may be identified by reference to a future period or periods or by the use of forward-looking terminology, such as “may,” “will,” “believe,” “expect,” “likely,” “should,” “could,” “seem to,” “anticipate,” or similar terms or variations on those terms or the negative of those terms. The forward-looking statements are based on current management expectations. Actual results may differ materially as a result of several factors, including, but not limited to the following: the ongoing volatility in the mortgage industry; our ability to successfully manage through the current market environment; our ability to meet liquidity needs from current cash flows or generate new sources of revenue; management’s ability to successfully manage and grow the Company’s mortgage and real estate fee-based business activities; the ability to make interest payments; increases in default rates or loss severities and mortgage related losses; the ability to satisfy conditions (payment and covenants) in the note payable with a major creditor; our ability to obtain additional financing and the terms of any financing that we do obtain; inability to effectively liquidate properties to mitigate losses; increase in loan repurchase requests and ability to adequately settle repurchase obligations; decreases in value of our residual interests that differ from our assumptions; the ability of our common stock to continue trading in an active market; the outcome of litigation or regulatory actions pending against us or other legal contingencies; our compliance with applicable local, state and federal laws and regulations and other general market and economic conditions.
For a discussion of these and other risks and uncertainties that could cause actual results to differ from those contained in the forward-looking statements, see “Risk Factors” and “Management’s Discussion and Analysis of Financial Condition and Results of Operations” in the Company’s Annual Report on Form 10-K for the period ended December 31, 2010, the other reports we file under the Securities and Exchange Act of 1934. This document speaks only as of its date and we do not undertake, and specifically disclaim any obligation, to release publicly the results of any revisions that may be made to any forward-looking statements to reflect the occurrence of anticipated or unanticipated events or circumstances after the date of such statements.
The Mortgage Industry and Discussion of Relevant Fiscal Periods
The mortgage industry is continually vulnerable to current events that occur in the financial services industry. These events include changes in economic indicators, government regulation, interest rates, price competition, geographic shifts, disposable income, housing prices, market liquidity, market anticipation, and customer perception, as well as others. The factors that affect the industry change rapidly and can be unforeseeable.
Current events can diminish the relevance of “quarter over quarter” and “year-to-date over year-to-date” comparisons of financial information. In such instances, the Company attempts to present financial information in its Management’s Discussion and Analysis of Financial Condition and Results of Operations that is the most relevant to its financial information.
Status of Operations, Liquidity and Capital Resources
Mortgage and Real Estate Services
The mortgage and real estate services have been developed as part of a centralized platform to operate synergistically to maximize revenues and profits. The integrated services platform includes the mortgage lending operations, portfolio loss mitigation and real estate services and title and escrow.
Mortgage Lending Operations— In March 2011, the Company expanded its mortgage lending operations by moving into the Pacific Northwest and Gulf Coast Regions, opening regional production offices in Lake Oswego, Oregon, and Baton Rouge, Louisiana. In addition to the Company’s mortgage lending operations in Irvine, California, this expansion gives the Company origination capabilities throughout the entire West Coast and Gulf Coast regions with additional regional operation centers and retail and wholesale locations. As part of this expansion, the Company invested approximately $2 million in its mortgage lending operations infrastructure, consisting principally of additional personnel and occupancy costs (included in total non-interest expense in the consolidated statement of operations). We expect to derive benefits from this investment through increased net revenues from mortgage origination activity, however there can be no assurances that this investment will result in additional net revenues to us. In addition, because the costs associated with our mortgage origination expansion must be expensed in accordance with GAAP, this investment was in part, a reason for the net loss incurred during the quarter ended March 31, 2011.
During the first quarter of 2011, the Company funded $53.4 million, sold $26.3 million and brokered $3.9 million of loans as compared to a minimal amount of loans brokered in the first quarter of 2010.
In March 2011, the Company, through IRES and its subsidiaries, entered into a Master Repurchase Agreement with a lender providing an additional $20 million warehouse facility. As of March 31, 2011, the Company had increased its warehouse funding capacity to $73.5 million. During April 2011 the maximum borrowing capacity of Repurchase Agreement 3 increased to $32.5 and we obtained approvals from another lender for an additional $25.0 million in warehouse capacity.
Portfolio Loss Mitigation and Real Estate Services—The Company has been able to develop and enhance its service offerings by providing services focusing on loss mitigation and performance of our own long-term mortgage portfolio. The Company portfolio loss mitigation and real estate services include REO surveillance and disposition services, default surveillance and loss recovery services, short sale and real estate brokerage services, loan modifications, portfolio monitoring and reporting services.
Title and Escrow—The title insurance company services primarily California and selected national markets providing title insurance, escrow and settlement services to residential mortgage lenders, real estate agents, asset managers and REO companies in the residential real estate market. The services are provided through a proprietary integrated technology platform.
For the three months ended March 31, 2011 and 2010, mortgage and real estate services fees were $11.7 million and $11.0 million, respectively, as follows:
|
|
|
For the Three Months |
| ||||
|
|
|
Ended March 31, |
| ||||
|
|
|
2011 |
|
2010 |
| ||
|
Monitoring, surveillance and recovery fees |
|
4,557 |
|
4,010 |
| ||
|
Title and escrow |
|
4,308 |
|
2,717 |
| ||
|
Servicing income |
|
1,339 |
|
732 |
| ||
|
Loan modification fees |
|
1,486 |
|
3,491 |
| ||
|
Total mortgage and real estate services fees |
|
$ |
11,690 |
|
$ |
10,950 |
|
Although the Company intends to expand its portfolio loss mitigation and real estate services to more third parties in the marketplace, the revenues from these business activities have historically been generated from the Company’s long-term mortgage portfolio. Furthermore, as the distressed mortgage and real estate markets remain unstable and uncertain due to the significant number of foreclosure properties that need to be sold, there remains uncertainty about the ongoing need and delivery of these services in the future.
Long-Term Mortgage Portfolio
At March 31, 2011, our residual interest in securitizations (represented by the difference between trust assets and trust liabilities) decreased to $26.1 million, compared to $26.4 million at December 31, 2010. The decrease in residual fair value for the three months ended March 31, 2011 was primarily due to cash received and changes in the forward LIBOR curve partially offset by decreased loss assumptions.
To estimate fair value of the assets and liabilities within the securitization trusts each reporting period, management uses an industry standard valuation and analytical model that is updated monthly with current collateral, real estate, derivative, bond and cost (servicer, trustee, etc.) information for each securitization trust. The Company employs an internal process to validate the accuracy of the model as well as the data within this model. Forecasted assumptions, sometimes referred to as “curves,” for defaults, loss severity, interest rates (LIBOR) and prepayments are input into the valuation model for each securitization trust. The Company hires third party experts to provide forecasted curves for the aforementioned assumptions for each of the securitizations. Before inputting this information into the model, management employs a process to qualitatively and quantitatively review the assumption curves for reasonableness using other information gathered from the mortgage and real estate market (i.e. third party home price indices, published industry reports discussing regional mortgage and commercial loan performance and delinquency) as well as actual default and foreclosure information for each trust from the respective trustees.
The Company uses the valuation model to generate the expected cash flows to be collected from the trust assets and the expected required bondholder distribution (trust liabilities). To the extent that the trusts are overcollateralized, the Company receives the excess interest as the holder of the residual interest. The information above provides us with the future expected cash flows for the securitized mortgage collateral, real estate owned, securitized mortgage borrowings, derivative assets/liabilities, and the residual interests.
To determine the discount rates to apply to these cash flows, the Company gathers information from the bond pricing services and other market participants regarding estimated investor required yields for each bond tranche. Based on that information and the collateral type and vintage, the Company determines an acceptable range of expected yields an investor would require including an appropriate risk premium for each bond tranche. The Company uses the blended yield of the bond tranches together with the residual interests to determine an appropriate yield for the securitized mortgage collateral in each securitization (after taking into consideration any derivatives in the securitization).
The following table presents changes in the Company’s trust assets and trust liabilities for the three months ended March 31, 2011:
|
|
|
TRUST ASSETS |
|
TRUST LIABILITIES |
|
|
| |||||||||||||||||||||
|
|
|
Level 3 Recurring Fair Value Measurements |
|
NRV |
|
|
|
Level 3 Recurring Fair Value Measurements |
|
|
| |||||||||||||||||
|
|
|
Investment |
|
Securitized |
|
Derivative |
|
Real estate |
|
Total trust |
|
Securitized |
|
Derivative |
|
Total trust |
|
Net trust assets |
| |||||||||
|
Recorded book value at 12/31/2010 |
|
645 |
|
6,011,675 |
|
40 |
|
92,708 |
|
6,105,068 |
|
(6,012,745 |
) |
(65,916 |
) |
(6,078,661 |
) |
26,407 |
| |||||||||
|
Total Gains/(losses) included in earnings: |
|
|
|
|
|
|
|
|
|
|
|
|
|
|
|
|
|
|
| |||||||||
|
Interest income |
|
28 |
|
107,369 |
|
— |
|
— |
|
107,397 |
|
— |
|
— |
|
— |
|
107,397 |
| |||||||||
|
Interest expense |
|
— |
|
— |
|
— |
|
— |
|
— |
|
(194,015 |
) |
— |
|
(194,015 |
) |
(194,015 |
) | |||||||||
|
Change in FV of net trust assets, excluding REO |
|
(202 |
) |
139,446 |
|
(3 |
) |
|
|
139,241 |
(1) |
(137,278 |
) |
2,933 |
|
(134,345 |
)(1) |
4,896 |
| |||||||||
|
Change in FV of long-term debt |
|
— |
|
— |
|
— |
|
— |
|
— |
|
— |
|
— |
|
— |
|
— |
| |||||||||
|
Losses from REO - not at FV but at NRV |
|
— |
|
— |
|
— |
|
(4,249 |
) |
(4,249 |
)(1) |
— |
|
— |
|
— |
|
(4,249 |
) | |||||||||
|
Total gains (losses) included in earnings |
|
(174 |
) |
246,815 |
|
(3 |
) |
(4,249 |
) |
242,389 |
|
(331,293 |
) |
2,933 |
|
(328,360 |
) |
(85,971 |
) | |||||||||
|
Purchases issuances and settlements |
|
(56 |
) |
(204,724 |
) |
— |
|
(13,750 |
) |
(218,530 |
) |
287,461 |
|
16,740 |
|
304,201 |
|
85,671 |
| |||||||||
|
Recorded book value at 3/31/2011 |
|
$ |
415 |
|
$ |
6,053,766 |
|
$ |
37 |
|
$ |
74,709 |
|
$ |
6,128,927 |
|
$ |
(6,056,577 |
) |
$ |
(46,243 |
) |
$ |
(6,102,820 |
) |
$ |
26,107 |
|
(1) Represents non-interest income-net trust assets on the Company’s consolidated statements of operations for the three months ended March 31, 2011.
The increase in fair value of securitized mortgage collateral resulted in gains of $139.4 million, offset by losses from the $137.3 million increase in the fair value of securitized mortgage borrowings within the Level 3 recurring fair value measurements table for the three months ended March 31, 2011. For the three months ended March 31, 2011, the valuation change of REO resulted in a loss of $4.2 million. Inclusive of losses from REO, trust assets reflect a net gain of $135.0 million as a result of gains from the increase in fair value of securitized mortgage collateral of $139.4 million offset by losses from REO of $4.2 million and losses from other trust assets of $205 thousand. Net losses on trust liabilities were $134.3 million as a result of $137.3 million in losses from the increase in fair value of securitized mortgage borrowings partially offset by gains from other trust liabilities of $2.9 million. As a result non-interest income—net trust assets increased by $647 thousand during the three months ended March 31, 2011.
Liquidity and capital resources
During the first three months of 2011, the Company continued to fund its operations primarily from income generated from its long-term mortgage portfolio, which included mortgage and real estate services fees and cash flows from our residual interests in securitizations.
The ability to meet our long-term liquidity requirements is subject to several factors, such as generating fees from our mortgage and real estate fee-based business activities and realizing cash flows from our long-term mortgage portfolio. Our future financial performance and success are dependent in large part upon our ability to grow our mortgage and real estate fee-based business activities, including providing services to third parties and expanding our mortgage lending operations. We believe that current cash balances, cash flows from mortgage and real estate services fees generated from our long-term mortgage portfolio, and residual interest cash flows from our long-term mortgage portfolio are adequate for our current operating needs. However, the mortgage and real estate services market is volatile, highly competitive and subject to increased regulation. The Company’s ability to successfully compete in the mortgage and real estate services industry may be challenging as many competitors have recently entered or have established businesses delivering similar services. Additionally, the mortgage lending environment is extremely competitive and highly regulated. The future success of our mortgage lending operations will depend on a number of factors, including how well we compete, housing market conditions, economic recovery and financial regulatory reform. If we are unsuccessful, we may be unable to satisfy our future operating costs and liabilities, including repayment of the notes payable and long-term debt.
To understand the financial position of the Company better, we believe it is important to understand the composition of the Company’s stockholders’ equity (deficit) and to which component of the business it relates. At March 31, 2011, the equity (deficit) within our continuing and discontinued operations was comprised of the following significant assets and liabilities:
|
|
|
Condensed Components of Stockholders’ Equity (Deficit) |
| |||||||
|
|
|
As of March 31, 2011 |
| |||||||
|
|
|
Continuing |
|
Discontinued |
|
|
| |||
|
|
|
Operations |
|
Operations |
|
Total |
| |||
|
Cash |
|
$ |
7,750 |
|
$ |
9 |
|
$ |
7,759 |
|
|
Residual interests in securitizations |
|
26,107 |
|
— |
|
26,107 |
| |||
|
Loans held-for-sale |
|
31,888 |
|
— |
|
31,888 |
| |||
|
Finance receivables |
|
3,911 |
|
— |
|
3,911 |
| |||
|
Warehouse borrowings |
|
(34,266 |
) |
— |
|
(34,266 |
) | |||
|
Notes payable |
|
(4,763 |
) |
— |
|
(4,763 |
) | |||
|
Long-term debt ($71,120 par) |
|
(12,030 |
) |
— |
|
(12,030 |
) | |||
|
Repurchase reserve |
|
(354 |
) |
(7,115 |
) |
(7,469 |
) | |||
|
Lease liability (1) |
|
— |
|
(2,246 |
) |
(2,246 |
) | |||
|
Deferred charge |
|
13,144 |
|
— |
|
13,144 |
| |||
|
Net other assets (liabilities) |
|
7,077 |
|
(2,356 |
) |
4,721 |
| |||
|
Stockholders’ equity (deficit) |
|
$ |
38,464 |
|
$ |
(11,708 |
) |
$ |
26,756 |
|
(1) Guaranteed by IMH.
Continuing operations
At March 31, 2011, cash within our continuing operations decreased to $7.8 million from $11.5 million at December 31, 2010. The primary sources of cash between periods were $11.7 million in fees generated from the mortgage and real estate fee-based businesses and $2.3 million from residual interests in securitizations (net of the restricted excess cash in the reserve account). Offsetting the sources of cash were operating expenses totaling $15.3 million and payments on the notes payable of $2.0 million.
Since our consolidated and unconsolidated securitization trusts are nonrecourse, we have netted trust assets and liabilities to present the Company’s interest in these trusts more simply, which are considered our residual interests in securitizations. For unconsolidated securitizations our residual interests represent the fair value of investment securities available-for-sale. For consolidated securitizations, our residual interests are represented by the fair value of securitized mortgage collateral and real estate owned, offset by the fair value of securitized mortgage borrowings and net derivative liabilities. We receive cash flows from our residual interests in securitizations to the extent they are available after required distributions to bondholders and maintaining overcollateralization levels within the trusts. The estimated fair value of the residual interests, represented by the difference in the fair value of trust assets and trust liabilities, was $26.1 million at March 31, 2011, compared to $26.4 million at December 31, 2010.
At March 31, 2011, our notes payable decreased $1.8 million from December 31, 2010, as a result of monthly payments totaling $2.0 million comprising of principal and interest. Additionally, during the first quarter of 2011, the Company received $1.0 million in excess cash flows from the residuals collateralizing the note payable. The $1.0 million is included in restricted cash on the consolidated balance sheets, which is available to cover any future shortfalls of scheduled principal and interest payments due on the note payable. As of March 31, 2011, the balance of the note was $4.7 million and will mature in October of 2011.
At March 31, 2011, we had deferred charges of $13.1 million, which is amortized as a component of income tax expense in the consolidated statements of operations over the estimated life of the mortgages retained in the securitized mortgage collateral. The deferred charges represent the deferral of income tax expense on inter-company profits that resulted from the sale of mortgages from taxable subsidiaries to IMH in prior years. This balance is recorded as required by GAAP and does not have any realizable cash value.
Net other assets (liabilities) primarily includes $3.3 million in premises and equipment, $2.7 million in accounts receivable, $2.5 million in prepaid expenses and $2.0 million in restricted cash.
Discontinued operations
The Company’s most significant liabilities within discontinued liabilities at March 31, 2011 relate to its repurchase reserve and a lease liability associated with the former non-conforming mortgage operations.
In previous years when our discontinued operations sold loans to investors, we were required to make normal and customary representations and warranties about the loans we had previously sold to investors. Our whole loan sale agreements generally required us to repurchase loans if we breached a representation or warranty given to the loan purchaser. In addition, we also could be required to repurchase loans as a result of borrower fraud or if a payment default occurs on a mortgage loan shortly after its sale. The repurchase reserve is an estimate of losses from expected repurchases, and is based, in part, on the recent settlement of claims. At March 31, 2011, the repurchase reserve was $7.1 million as compared to $8.0 million at December 31, 2010.
In connection with the discontinuation of our non-conforming mortgage, retail mortgage, warehouse lending and commercial operations, a significant amount of office space that was previously occupied is no longer being used by the Company. The Company has subleased a significant amount of this office space. At March 31, 2011, the Company had a liability of $2.2 million included within discontinued operations, representing the present value of the minimum lease payments over the remaining life of the lease, offset by the expected proceeds from sublet revenue related to this office space.
Beginning in the third quarter of 2010 and continuing through the first quarter of 2011, we continue to see home price declines in many markets as the homebuyer tax credit expired and housing prices remained under pressure due to elevated foreclosure levels. In addition, foreclosure delays as a result of reviews into foreclosure practices of some prominent loan servicers in the fourth quarter of 2010, among other market conditions may result in continued downward pressure on home prices for the foreseeable future.
Mortgage lending and credit market conditions remained soft through the first quarter of 2011 due primarily to an increase in mortgage rates and a weak economy. Existing uncertainties surrounding the housing market, economy and regulatory environment will continue to present challenges for the Company. The ongoing economic stress or further deterioration of general economic conditions could prolong or increase borrower defaults leading to deteriorating performance of our long-term mortgage portfolio.
A number of factors make it difficult to predict when a sustained recovery in the housing and credit markets will occur. Concerns about the future of the U.S. economy, including the pace and magnitude of recovery from the recent economic recession, consumer confidence, volatility in energy prices, credit market volatility and trends in corporate earnings will continue to influence the U.S. economic recovery and the capital markets. In particular, continued improvement in unemployment rates and a sustained recovery of the housing markets remain critical components of a broader U.S. economic recovery. Further weakening in these components as well as in consumer confidence may result in additional deterioration in consumer payment patterns and credit quality. Weak consumer fundamentals including consumer spending, declines in wage income and wealth, as well as a difficult job market continue to depress consumer confidence. Additionally, there is uncertainty as to the future course of monetary policy and uncertainty as to the impact on the economy and consumer confidence when the remaining actions taken by the government to restore faith in the capital markets and stimulate consumer spending end, including the recent extension of unemployment insurance benefits and the prior presidential administration’s tax cuts. These conditions in combination with general economic weakness and the impact of recent regulatory changes will continue to impact our results throughout 2011, the degree of which is largely dependent upon the nature and extent of the economic recovery.
The ability to meet the Company’s long-term liquidity requirements is subject to several factors, such as generating fees from the mortgage and real estate business activities and realizing cash flows from the long-term mortgage portfolio. The Company’s future financial performance and success are dependent in large part upon the ability to grow the mortgage and real estate business activities, including providing services to third parties and expanding the mortgage lending operations. The Company believes that current cash balances, cash flows from mortgage and real estate services fees generated from the long-term mortgage portfolio, and residual interest cash flows from the long-term mortgage portfolio are adequate for the current operating needs. However, the mortgage and real estate services market is volatile, highly competitive and subject to increased regulation. The Company’s ability to successfully compete in the mortgage and real estate services industry may be challenging as its business activities have been established in the last few years and many competitors have recently entered or have established businesses delivering similar services. Additionally, the mortgage lending environment is extremely competitive and highly regulated. The future success of the mortgage lending operations will depend on a number of factors, including the ability to procure adequate financing to fund loan production, maintaining associated financial covenants of lenders, how well the Company competes, housing market conditions, economic recovery and financial regulatory reform. If the Company is unsuccessful, the Company may be unable to satisfy the future operating costs and liabilities, including repayment of the note payable and long-term debt. To be successful in expanding the business and providing adequate returns to the shareholders, the Company may seek financing in the form of debt or equity capital.
Financial Regulatory Reform
On July 21, 2010, the “Dodd-Frank Wall Street Reform and Consumer Protection Act” was signed into law. This legislation is a sweeping overhaul of the financial regulatory system.
The legislation provides for new regulation on financial institutions, creates new supervisory and advisory bodies, including the new Consumer Financial Protection Bureau, and contains many consumer related provisions including provisions addressing mortgage reform. In the area of mortgage origination, it appears there is an effective elimination of stated income loans and low document loans along with a requirement to apply a net tangible benefit test for all refinancing transactions. There are also numerous revised servicing requirements for mortgage loans.
The legislation will have a significant effect on the operations of many financial institutions in the U.S. As the legislation calls for extensive regulations to be promulgated to interpret and implement the legislation, it is not possible to precisely determine the impact to operations and financial results at this time. The Company will continue to assess the effect of the legislation on the Company’s business as the associated regulations are adopted.
Effects of Recent Market Activity
During the first quarter of 2011, the Company’s investment in securitized non-conforming loans (residual interests) continued to be affected by the aforementioned economic and housing market conditions resulting in increased estimated defaults and severities.
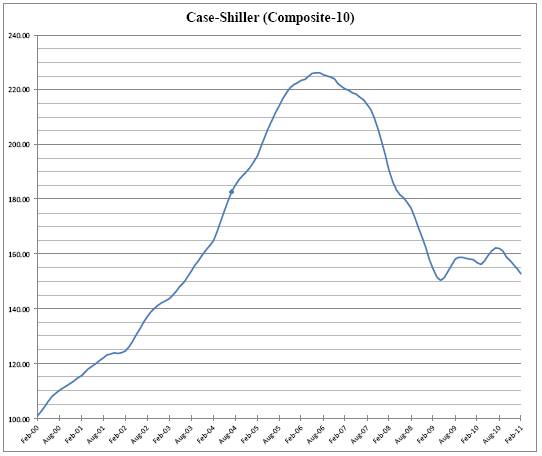
As depicted in the chart above, average home prices peaked in June 2006 at 226.29 and continued their dramatic decline through much of the first half of 2009, while increasing slightly over the remaining half of the year. The Standard & Poor’s Case-Shiller 10-City Composite Home Price Index (the Index) for February 2011 was 152.7 (with the base of 100.00 for January 2000.) Beginning in the third quarter of 2007, the Company began to believe that there was a correlation between the borrowers’ perceived equity in their homes and defaults. The original loan-to-value (defined as loan amount as a percentage of collateral value, LTV) and original combined loan-to-value (defined as first lien plus total subordinate liens to collateral value, CLTV) ratios of single-family
mortgages remaining in the Company’s securitized mortgage collateral as of March 31, 2011 was 72% and 80%, respectively. The current LTV and CLTV ratios likely increased from origination date as a result of the deterioration in the real estate market. We believe that home prices that have declined below the borrower’s original purchase price have a higher risk of default within our portfolio. Based on the Index, home prices have declined 33% through February 2011 from the 2006 peak. Further, we believe the home prices in general within California and Florida, the states with the highest concentration of our mortgages, have declined even further than the Index. We have considered the deterioration in home prices and its impact on our loss severities, which are a primary assumption used in the valuation of securitized mortgage collateral and borrowings.
We define critical accounting policies as those that are important to the portrayal of our financial condition and results of operations. Our critical accounting policies require management to make difficult and complex judgments that rely on estimates about the effect of matters that are inherently uncertain due to the effect of changing market conditions and/or consumer behavior. In determining which accounting policies meet this definition, we considered our policies with respect to the valuation of our assets and liabilities and estimates and assumptions used in determining those valuations. We believe the most critical accounting issues that require the most complex and difficult judgments and that are particularly susceptible to significant change to our financial condition and results of operations include the following:
Please refer to IMH’s report on Form 10-K on pages 27 through 29 of Management’s Discussion and Analysis of Results of Operations for the year ended December 31, 2010 for a detailed discussion of our significant accounting policies. Such policies have not changed during 2011.
Selected Financial Results for the Three Months Ended March 31, 2011
Continuing Operations
· Loss from continuing operations of $952 thousand for the first quarter of 2011, compared to earnings of $3.2 million for the comparable 2010 period.
· Net interest income of $1.5 million for the first quarter of 2011, primarily from our long-term mortgage portfolio, compared to $770 thousand for the comparable 2010 period.
· Non-interest income - net trust assets of $647 thousand for the first quarter of 2011, compared to $6.3 million for the comparable 2010 period.
· Mortgage and real estate services fees of $11.7 million for the first quarter of 2011, compared to $11.0 million for the comparable 2010 period.
· The mortgage lending operations funded $53.4 million, sold $26.3 million and brokered $3.9 million of loans during the first quarter as compared to a minimal amount of loans brokered for the comparable period in 2010.
Discontinued Operations
· Loss from discontinued operations of $350 thousand for the first quarter of 2011, compared to earnings of $2.4 million for the comparable 2010 period.
· Repurchase reserve was $7.1 million at March 31, 2011, compared to $8.0 million at December 31, 2010.
Financial Condition and Results of Operations
Financial Condition
Condensed Balance Sheet Data
|
|
|
March 31, |
|
December 31, |
|
Increase |
|
% |
| |||
|
|
|
2011 |
|
2010 |
|
(Decrease) |
|
Change |
| |||
|
Investment securities available-for-sale |
|
$ |
415 |
|
$ |
645 |
|
$ |
(230 |
) |
(36 |
)% |
|
Securitized mortgage collateral |
|
6,053,766 |
|
6,011,675 |
|
42,091 |
|
1 |
| |||
|
Derivative assets |
|
37 |
|
40 |
|
(3 |
) |
(8 |
) | |||
|
Real estate owned |
|
74,709 |
|
92,708 |
|
(17,999 |
) |
(19 |
) | |||
|
Total trust assets |
|
6,128,927 |
|
6,105,068 |
|
23,859 |
|
0 |
| |||
|
Assets of discontinued operations |
|
296 |
|
373 |
|
(77 |
) |
(21 |
) | |||
|
Other assets |
|
76,571 |
|
48,498 |
|
28,073 |
|
58 |
| |||
|
Total assets |
|
$ |
6,205,794 |
|
$ |
6,153,939 |
|
$ |
51,855 |
|
1 |
% |
|
|
|
|
|
|
|
|
|
|
| |||
|
Securitized mortgage borrowings |
|
$ |
6,056,577 |
|
$ |
6,012,745 |
|
$ |
43,832 |
|
1 |
% |
|
Derivative liabilities |
|
46,243 |
|
65,916 |
|
(19,673 |
) |
(30 |
) | |||
|
Total trust liabilities |
|
$ |
6,102,820 |
|
$ |
6,078,661 |
|
$ |
24,159 |
|
0 |
|
|
Liabilities of discontinued operations |
|
12,004 |
|
13,053 |
|
(1,049 |
) |
(8 |
) | |||
|
Other liabilities |
|
64,214 |
|
34,528 |
|
29,686 |
|
86 |
| |||
|
Total liabilities |
|
6,179,038 |
|
6,126,242 |
|
52,796 |
|
1 |
| |||
|
Total IMH stockholders’ equity |
|
25,485 |
|
26,396 |
|
(911 |
) |
(3 |
) | |||
|
Noncontrolling interest |
|
1,271 |
|
1,301 |
|
(30 |
) |
(2 |
) | |||
|
Total equity |
|
26,756 |
|
27,697 |
|
(941 |
) |
(3 |
) | |||
|
Total liabilities and stockholders’ equity |
|
$ |
6,205,794 |
|
$ |
6,153,939 |
|
$ |
51,855 |
|
1 |
% |
Total assets and total liabilities were $6.2 billion at March 31, 2011 as compared to $6.2 billion and $6.1 billion, respectively, at December 31, 2010. The changes in total assets and liabilities are primarily attributable to increases in the Company’s trust assets and trust liabilities as summarized below.
· Securitized mortgage collateral increased $42.1 million during the three months ended March 31, 2011. The increase in securitized mortgage collateral from $6.0 billion at December 31, 2010 to $6.1 billion at March 31, 2011 was primarily due to a reduction in investor yield requirements, partially offset by an increase in net loss assumptions for single-family and multifamily collateral and reductions in principal balances from defaults and principal payments during the period.
· REO within the Company’s securitization trusts decreased $18.0 million to $74.7 million at March 31, 2011. Decreases in REO were due to liquidations of $39.5 million and $4.2 million in additional impairment write-downs. Offsetting the decrease from liquidations were increases in REO from foreclosures of $25.7 million.
· Securitized mortgage borrowings increased $43.8 million to $6.1 billion at March 31, 2011. The increase in securitized mortgage borrowings was primarily due to a reduction in investor yield requirements, offset by an increase in net loss assumptions for single-family and multifamily collateral and reductions in principal balances during the period.
· Derivative liabilities, net decreased $19.7 million to $46.2 million at March 31, 2011. The decrease is the result of $16.7 million in derivative cash payments from the securitization trusts, and a $2.9 million decrease in fair value resulting from changes in forward LIBOR interest rates.
Since our consolidated and unconsolidated securitization trusts are nonrecourse to the Company, our economic risk is limited to our residual interests in these securitization trusts. Therefore, in the following table we have netted trust assets and trust liabilities to present these residual interests more simply. Our residual interests in securitizations are segregated between our single-family (SF) residential and multifamily (MF) residential portfolios and are represented by the difference between trust assets and trust liabilities.
The following tables present the estimated fair value of our residual interests, including investment securities available for sale, by securitization vintage year and other related assumptions used to derive these values at March 31, 2011:
|
Origination |
|
|
|
Estimated Fair Value of |
| |||||||
|
Year |
|
|
|
SF |
|
MF |
|
Total |
| |||
|
2002-2003 |
|
(1) |
|
$ |
11,702 |
|
$ |
3,390 |
|
$ |
15,092 |
|
|
2004 |
|
|
|
3,829 |
|
7,101 |
|
10,930 |
| |||
|
2005 |
|
(2) |
|
— |
|
85 |
|
85 |
| |||
|
2006 |
|
(2) |
|
— |
|
— |
|
— |
| |||
|
2007 |
|
(2) |
|
— |
|
— |
|
— |
| |||
|
Total |
|
|
|
$ |
15,531 |
|
$ |
10,576 |
|
$ |
26,107 |
|
|
|
|
|
|
|
|
|
|
|
| |||
|
Weighted avg. prepayment rate |
|
7 |
% |
5 |
% |
7 |
% | |||||
|
Weighted avg. discount rate |
|
30 |
% |
20 |
% |
26 |
% | |||||
(1) 2002-2003 vintage year includes CMO 2007-A, since the majority of the mortgages collateralized in this securitization were originated during this period.
(2) The estimated fair values of residual interests in vintage years 2005 through 2007 is reflective of higher estimated future losses and investor yield requirements compared to earlier vintage years.
The Company utilizes a number of assumptions to value securitized mortgage collateral, securitized mortgage borrowings and residual interests. These assumptions include estimated collateral default rates and loss severities (credit losses), collateral prepayment rates, forward interest rates and investor yields (discount rates). The Company uses the same collateral assumptions for securitized mortgage collateral and securitized mortgage borrowings as the collateral assumptions determine collateral cash flows which are used to pay interest and principal for securitized mortgage borrowings and excess spread, if any, to the residual interests. However, the Company uses different investor yield (discount rate) assumptions for securitized mortgage collateral and securitized mortgage borrowings and the discount rate used for residual interests based on underlying collateral characteristics, vintage year, assumed risk and market participant assumptions. The table below reflects the estimated future credit losses and investor yield requirements for trust assets by product (SF and MF) and securitization vintage:
|
|
|
Estimated Future Losses (1) |
|
Investor Yield Requirement (2) |
| ||||
|
|
|
SF |
|
MF |
|
SF |
|
MF |
|
|
2002-2003 |
|
5 |
% |
0 |
% |
10 |
% |
11 |
% |
|
2004 |
|
12 |
% |
1 |
% |
11 |
% |
9 |
% |
|
2005 |
|
28 |
% |
4 |
% |
13 |
% |
9 |
% |
|
2006 |
|
37 |
% |
13 |
% |
19 |
% |
12 |
% |
|
2007 |
|
32 |
% |
8 |
% |
21 |
% |
15 |
% |
(1) Estimated future losses derived by dividing future projected losses by unpaid principal balances at March 31, 2011.
(2) Investor yield requirements represent the Company’s estimate of the yield third-party market participants would require to price our trust assets and liabilities given our prepayment, credit loss and forward interest rate assumptions.
As illustrated in S&Ps Case Shiller 10-City Composite Home Price Index, from 2002 through 2006, home price appreciation escalated to historic levels. During 2005 through 2007, the company originated or acquired mortgages supported by these elevated real estate values. Beginning in 2007, deterioration in the economy resulting in high unemployment and a dramatic drop in home prices resulted in significant negative equity for borrowers. These factors have led to significant increases in loss severities resulting from deterioration in the credit quality of borrowers, as well as strategic defaults, whereby borrowers with the ability to pay are defaulting on their mortgages based on the belief that home prices will not recover in a reasonable amount of time. Home prices have deteriorated back to December 2003 levels which has significantly reduced or eliminated equity for loans originated after 2003. Future loss estimates are significantly higher for mortgage loans included in securitization vintages after 2004 which reflect severe home price deterioration and defaults experienced with mortgages originated during these periods.
Cash flows from the Company’s long-term mortgage portfolio are affected by the following market and operational risks:
· interest rate risk;
· credit risk; and
· prepayment risk.
Interest Rate Risk. The Company’s earnings from the long-term mortgage portfolio depend largely on our interest rate spread, represented by the relationship between the yield on our interest- earning assets (primarily investment securities available-for-sale and securitized mortgage collateral) and the cost of our interest-bearing liabilities (primarily securitized mortgage borrowings, long-term debt and note payable). Our interest rate spread is impacted by several factors, including general economic factors, forward interest rates and the credit quality of mortgage loans in the long-term mortgage portfolio.
The residual interests in our long-term mortgage portfolio are sensitive to changes in interest rates on securitized mortgage collateral and the related securitized mortgage borrowings. Changes in interest rates can significantly affect the cash flows and fair values of the Company’s assets and liabilities, as well as our earnings and stockholders’ equity.
The Company uses derivative instruments to manage some of its interest rate risk. However, the Company does not attempt to hedge interest rate risk completely. To help mitigate some of the exposure to the effect of changing interest rates on cash flows on securitized mortgage borrowings, the Company utilized derivative instruments primarily in the form of interest rate swap agreements (swaps) and, to a lesser extent, interest rate cap agreements (caps) and interest rate floor agreements (floors). These derivative instruments are recorded at fair value in the consolidated balance sheets. For non-exchange traded contracts, fair value is based on the amounts that would be required to settle the positions with the related counterparties as of the valuation date. Valuations of derivative assets and liabilities are based on observable market inputs, if available. To the extent observable market inputs are not available, fair values measurements include the Company’s judgments about future cash flows, forward interest rates and certain other factors, including counterparty risk. Additionally, these values also take into account the Company’s own credit standing, to the extent applicable; thus, the valuation of the derivative instrument includes the estimated value of the net credit differential between the counterparties to the derivative contract.
At March 31, 2011, derivative liabilities, net were $46.2 million and reflect the securitization trust’s liability to pay third-party counterparties based on the estimated value to settle the derivative instruments. Cash payments on these derivative instruments are based on notional amounts that are decreasing over time. Excluding the effects of other factors such as portfolio delinquency and loss severities within the securitization trusts, as the notional amount of these derivative instruments decrease over time, payments to counterparties in the current interest rate environment are reduced, thereby potentially increasing cash flows on our residual interests in securitizations. Conversely, increases in interest rates from current levels could potentially reduce overall cash flows on our residual interests in securitizations. Since our consolidated and unconsolidated securitization trusts are nonrecourse to the Company, our economic risk is limited to our residual interests in these securitization trusts.
The Company is also subject to interest rate risk on its long-term debt (consisting of trust preferred securities and junior subordinated notes) and notes payable. These interest bearing liabilities include adjustable rate periods based on one-month LIBOR (note payable) and three-month LIBOR (trust preferred securities and junior subordinated notes). The Company does not currently hedge its exposure to the effect of changing interest rates related to these interest-bearing liabilities. Significant fluctuations in interest rates could have a material adverse effect on the Company’s business, financial condition, results of operations or liquidity.
Credit risk. We manage credit risk by actively managing delinquencies and defaults through our servicers. Starting with the second half of 2007 we have not retained any additional Alt-A mortgages in our long-term mortgage portfolio. Our securitized mortgage collateral primarily consists of Alt-A mortgages which are generally within typical Fannie Mae and Freddie Mac guidelines but have loan characteristics, which may include higher loan balances, higher loan-to-value ratios or lower documentation requirements (including stated-income loans), that make them non-conforming under those guidelines.
Using historical losses, current portfolio statistics and market conditions and available market data, the Company has estimated future loan losses, which are included in the fair value adjustment to our securitized mortgage collateral. While the credit performance for the loans has been clearly far worse than the Company’s initial expectations when the loans were originated, the ultimate level of realized losses will largely be influenced by events that will likely unfold over the next several years, including the severity of housing price declines and overall strength of the economy. If market conditions continue to deteriorate in excess of our expectations, the Company may need to recognize additional fair value reductions to our securitized mortgage collateral, which may also affect the value of the related securitized mortgage borrowings and residual interests.
We monitor our servicers to attempt to ensure that they perform loss mitigation, foreclosure and collection functions according to their servicing practices and each securitization trust’s pooling and servicing agreement. We have met with the management of our servicers to assess our borrowers’ current ability to pay their mortgages and to make arrangements with selected delinquent borrowers which will result in the best interest of the trust and borrower, in an effort to minimize the number of mortgages which become seriously delinquent. When resolving delinquent mortgages, servicers are required to take timely action. The servicer is required to determine payment collection under various circumstances, which will result in the maximum financial benefit. This is accomplished by either working with the borrower to bring the mortgage current by modifying the loan with terms that will maximize the recovery or by foreclosing and liquidating the property. At a foreclosure sale, the trusts consolidated on our balance sheet generally acquire title to the property.
We use the Mortgage Bankers Association (MBA) method to define delinquency as a contractually required payment being 30 or more days past due. We measure delinquencies from the date of the last payment due date in which a payment was received. Delinquencies for loans 60 days late or greater, foreclosures and delinquent bankruptcies were $2.3 billion or 21.0% as of March 31, 2011.
The following table summarizes the unpaid principal balances of loans in our mortgage portfolio, included in securitized mortgage collateral, mortgage loans held-for-investment and mortgage loans held-for-sale for continuing and discontinued operations combined, that were 60 or more days delinquent (utilizing the MBA method) as of the periods indicated:
|
|
|
|
|
Total |
|
|
|
Total |
| ||
|
|
|
March 31, |
|
Collateral |
|
December 31, |
|
Collateral |
| ||
|
|
|
2011 |
|
% |
|
2010 |
|
% |
| ||
|
Mortgage loans held-for-sale and investment |
|
|
|
|
|
|
|
|
| ||
|
60 - 89 days delinquent |
|
$ |
— |
|
0.0 |
% |
$ |
— |
|
0.0 |
% |
|
90 or more days delinquent |
|
895 |
|
0.0 |
% |
1,121 |
|
0.0 |
% | ||
|
Foreclosures (1) |
|
828 |
|
0.0 |
% |
1,020 |
|
0.0 |
% | ||
|
Total 60+ days delinquent mortgage loans held-for-sale and investment (2) |
|
1,723 |
|
0.0 |
% |
2,141 |
|
0.0 |
% | ||
|
|
|
|
|
|
|
|
|
|
| ||
|
Securitized mortgage collateral |
|
|
|
|
|
|
|
|
| ||
|
60 - 89 days delinquent |
|
$ |
225,247 |
|
2.1 |
% |
$ |
260,106 |
|
2.3 |
% |
|
90 or more days delinquent |
|
684,201 |
|
6.3 |
% |
734,459 |
|
6.5 |
% | ||
|
Foreclosures (1) |
|
1,008,448 |
|
9.3 |
% |
1,062,362 |
|
9.4 |
% | ||
|
Delinquent bankruptcies (3) |
|
370,283 |
|
3.4 |
% |
337,976 |
|
3.0 |
% | ||
|
Total 60+ days delinquent long-term mortgage portfolio |
|
2,288,179 |
|
21.0 |
% |
2,394,903 |
|
21.3 |
% | ||
|
Total 60 or more days delinquent |
|
$ |
2,289,902 |
|
21.0 |
% |
$ |
2,397,044 |
|
21.3 |
% |
|
Total collateral |
|
$ |
10,900,335 |
|
|
|
$ |
11,256,312 |
|
|
|
(1) Represents properties in the process of foreclosure.
(2) Represents legacy mortgage loans held-for-sale included in discontinued operations in the consolidated balance sheets.
(3) Represents bankruptcies that are 30 days or more delinquent.
The following table summarizes securitized mortgage collateral, mortgage loans held-for-investment, mortgage loans held-for-sale and real estate owned, that were non-performing for continuing and discontinued operations combined as of the dates indicated (excludes 60-89 days delinquent):
|
|
|
|
|
Total |
|
|
|
Total |
| ||
|
|
|
March 31, |
|
Collateral |
|
December 31, |
|
Collateral |
| ||
|
|
|
2011 |
|
% |
|
2010 |
|
% |
| ||
|
90 or more days delinquent, foreclosures and delinquent bankruptcies |
|
$ |
2,064,655 |
|
18.9 |
% |
$ |
2,136,938 |
|
19.0 |
% |
|
Real estate owned |
|
74,835 |
|
0.7 |
% |
92,780 |
|
0.8 |
% | ||
|
Total non-performing assets |
|
$ |
2,139,490 |
|
19.6 |
% |
$ |
2,229,718 |
|
19.8 |
% |
Non-performing assets consist of non-performing loans (mortgages that are 90 or more days delinquent, including loans in foreclosure and delinquent bankruptcies) plus REO. It is our policy to place a mortgage on non-accrual status when it becomes 90 days delinquent and to reverse from revenue any accrued interest, except for interest income on securitized mortgage collateral when the scheduled payment is received from the servicer. The servicers are required to advance principal and interest on loans within the securitization trusts to the extent the advances are considered recoverable. As of March 31, 2011, non-performing assets (unpaid principal balance of loans 90 or more days delinquent, foreclosures and delinquent bankruptcies plus REO) as a percentage of the total collateral was 19.6%. At December 31, 2010, non-performing assets to total collateral was 19.8%. As of March 31, 2011, the estimated fair value of non-performing assets (representing the fair value of loans 90 or more days delinquent, foreclosures and delinquent bankruptcies plus REO) was $572.0 million or 9.2% of total assets. At December 31, 2010, the estimated fair value of non-performing assets was $657.5 million or 10.7% of total assets.
REO, which consists of residential real estate acquired in satisfaction of loans, is carried at the lower of cost or net realizable value less estimated selling costs. Adjustments to the loan carrying value required at the time of foreclosure are included in the change in the fair value of net trust assets. Changes in the Company’s estimates of net realizable value subsequent to the time of foreclosure and through the time of ultimate disposition are recorded as gains or losses from real estate owned in the consolidated statements of operations. REO, for continuing and discontinued operations, at March 31, 2011 decreased $18.0 million or 19% from December 31, 2010, as a result of liquidations and a decrease in foreclosures associated with foreclosure delays as a result of reviews into foreclosure practices of some prominent loan servicers.
We realized losses on the sale of real estate owned in the amount $4 thousand for the three months ended March 31, 2011, compared to a loss of $1.8 million for the first quarter of 2010. Additionally, for the first quarter of 2011, the Company recorded write-downs of the net realizable value of the REO in the amount of $4.2 million compared to a recovery of $700 thousand for the first quarter of 2010. These write-downs of the net realizable value reflect declines in value of the REO subsequent to foreclosure date.
The following table presents the balances of REO for continuing operations:
|
|
|
March 31, |
|
December 31, |
| ||
|
REO |
|
$ |
98,341 |
|
$ |
122,279 |
|
|
Impairment (1) |
|
(23,506 |
) |
(29,499 |
) | ||
|
Ending balance |
|
$ |
74,835 |
|
$ |
92,780 |
|
|
|
|
|
|
|
| ||
|
REO inside trusts |
|
$ |
74,709 |
|
$ |
92,708 |
|
|
REO outside trusts |
|
126 |
|
72 |
| ||
|
Total |
|
$ |
74,835 |
|
$ |
92,780 |
|
(1) Impairment represents the cumulative write-downs of net realizable value subsequent to foreclosure.
In calculating the cash flows to assess the fair value of the securitized mortgage collateral, the Company estimates the future losses embedded in our loan portfolio. In evaluating the adequacy of these losses, management takes many factors into consideration. For instance, a detailed analysis of historical loan performance data is accumulated and reviewed. This data is analyzed for loss performance and prepayment performance by product type, origination year and securitization issuance. The data is also broken down by collection status. Our estimate of losses for these loans is developed by estimating both the rate of default of the loans and the amount of loss severity in the event of default. The rate of default is assigned to the loans based on their attributes (e.g., original loan-to-value, borrower credit score, documentation type, geographic location, etc.) and collection status. The rate of default is based on
analysis of migration of loans from each aging category. The loss severity is determined by estimating the net proceeds from the ultimate sale of the foreclosed property. The results of that analysis are then applied to the current mortgage portfolio and an estimate is created. We believe that pooling of mortgages with similar characteristics is an appropriate methodology in which to evaluate the future loan losses.
Management recognizes that there are qualitative factors that must be taken into consideration when evaluating and measuring losses in the loan portfolios. These items include, but are not limited to, economic indicators that may affect the borrower’s ability to pay, changes in value of collateral, political factors, employment and market conditions, competitor’s performance, market perception, historical losses, and industry statistics. The assessment for losses, is based on delinquency trends and prior loss experience and management’s judgment and assumptions regarding various matters, including general economic conditions and loan portfolio composition. Management continually evaluates these assumptions and various relevant factors affecting credit quality and inherent losses.
Prepayment Risk. The Company historically used prepayment penalties as a method of partially mitigating prepayment risk for those borrowers that have the ability to refinance. The recent economic downturn, lack of available credit and declines in property values have limited borrowers’ ability to refinance. These factors have significantly reduced prepayment risk within our long-term mortgage portfolio. With the seasoning of the long-term mortgage portfolio, a significant portion of prepayment penalties terms have expired, thereby further reducing prepayment penalty income.
Results of Operations
For the Three Months Ended March 31, 2011 compared to the Three Months Ended March 31, 2010
|
|
|
For the Three Months Ended March 31, |
| |||||||||
|
|
|
|
|
|
|
Increase |
|
% |
| |||
|
|
|
2011 |
|
2010 |
|
(Decrease) |
|
Change |
| |||
|
Interest income |
|
$ |
218,082 |
|
$ |
279,876 |
|
$ |
(61,794 |
) |
(22 |
)% |
|
Interest expense |
|
216,547 |
|
279,106 |
|
(62,559 |
) |
(22 |
) | |||
|
Net interest income |
|
1,535 |
|
770 |
|
765 |
|
99 |
| |||
|
Total non-interest income |
|
12,870 |
|
17,003 |
|
(4,133 |
) |
(24 |
) | |||
|
Total non-interest expense |
|
15,345 |
|
14,459 |
|
886 |
|
6 |
| |||
|
Income tax expense |
|
12 |
|
85 |
|
(73 |
) |
(86 |
) | |||
|
Net earnings from continuing operations |
|
(952 |
) |
3,229 |
|
(4,181 |
) |
(129 |
) | |||
|
Earnings from discontinued operations, net |
|
(350 |
) |
2,386 |
|
(2,736 |
) |
(115 |
) | |||
|
Net earnings |
|
(1,302 |
) |
5,615 |
|
(6,917 |
) |
(123 |
) | |||
|
Net loss attributable to noncontrolling interest (1) |
|
315 |
|
303 |
|
12 |
|
4 |
| |||
|
Net earnings attributable to IMH |
|
$ |
(987 |
) |
$ |
5,918 |
|
$ |
(6,905 |
) |
(117 |
)% |
|
|
|
|
|
|
|
|
|
|
| |||
|
Earnings per share available to common stockholders - basic |
|
$ |
(0.12 |
) |
$ |
0.77 |
|
$ |
(0.89 |
) |
(115 |
) |
|
Earnings per share available to common stockholders - diluted |
|
$ |
(0.12 |
) |
$ |
0.71 |
|
$ |
(0.83 |
) |
(117 |
) |
(1) Net loss attributable to noncontrolling interest represents the portion of the losses of Experience 1, Inc. and AmeriHome Mortgage Corporation (both subsidiaries of IRES) that the Company does not own.
Net Interest Income
We earn net interest income primarily from mortgage assets which include securitized mortgage collateral, loans held-for-sale and investment securities available-for-sale, or collectively, “mortgage assets,” and, to a lesser extent, interest income earned on cash and cash equivalents. Interest expense is primarily interest paid on borrowings secured by mortgage assets, which include securitized mortgage borrowings and to a lesser extent, interest expense paid on long-term debt and note payable. Interest income and interest expense during the period primarily represents the effective yield, based on the fair value of the trust assets and liabilities.
The following tables summarize average balance, interest and weighted average yield on mortgage assets and borrowings, included within continuing operations, for the periods indicated. Cash receipts and payments on derivative instruments hedging interest rate risk related to our securitized mortgage borrowings are not included in the results below. These cash receipts and payments are included as a component of the change in fair value of net trust assets.
|
|
|
For the three months ended March 31, |
| ||||||||||||||
|
|
|
2011 |
|
2010 |
| ||||||||||||
|
|
|
Average |
|
|
|
|
|
Average |
|
|
|
|
| ||||
|
|
|
Balance |
|
Interest |
|
Yield |
|
Balance |
|
Interest |
|
Yield |
| ||||
|
ASSETS |
|
|
|
|
|
|
|
|
|
|
|
|
| ||||
|
Securitized mortgage collateral |
|
$ |
6,032,721 |
|
$ |
217,746 |
|
14.44 |
% |
$ |
6,016,489 |
|
$ |
279,766 |
|
18.60 |
% |
|
Loans held-for-sale |
|
7,367 |
|
86 |
|
4.67 |
% |
— |
|
— |
|
0.00 |
% | ||||
|
Other |
|
32,294 |
|
250 |
|
3.10 |
% |
14,611 |
|
110 |
|
3.01 |
% | ||||
|
Total interest-earning assets |
|
$ |
6,072,382 |
|
$ |
218,082 |
|
14.37 |
% |
$ |
6,031,100 |
|
$ |
279,876 |
|
18.56 |
% |
|
|
|
|
|
|
|
|
|
|
|
|
|
|
| ||||
|
LIABILITIES |
|
|
|
|
|
|
|
|
|
|
|
|
| ||||
|
Securitized mortgage borrowings |
|
$ |
6,034,661 |
|
$ |
214,965 |
|
14.25 |
% |
$ |
6,005,877 |
|
$ |
277,665 |
|
18.49 |
% |
|
Long-term debt |
|
11,879 |
|
938 |
|
31.59 |
% |
10,253 |
|
1,165 |
|
45.45 |
% | ||||
|
Notes payable |
|
5,960 |
|
555 |
|
37.25 |
% |
28,948 |
|
276 |
|
3.81 |
% | ||||
|
Warehouse borrowings |
|
7,197 |
|
89 |
|
4.95 |
% |
— |
|
— |
|
— |
| ||||
|
Total interest-bearing liabilities |
|
$ |
6,059,697 |
|
$ |
216,547 |
|
14.29 |
% |
$ |
6,045,078 |
|
$ |
279,106 |
|
18.47 |
% |
|
|
|
|
|
|
|
|
|
|
|
|
|
|
| ||||
|
Net Interest Spread (1) |
|
|
|
$ |
1,535 |
|
0.08 |
% |
|
|
$ |
770 |
|
0.09 |
% | ||
|
Net Interest Margin (2) |
|
|
|
|
|
0.10 |
% |
|
|
|
|
0.05 |
% | ||||
(1) Net interest spread is calculated by subtracting the weighted average yield on interest-bearing liabilities from the weighted average yield on interest-earning assets.
(2) Net interest margin is calculated by dividing net interest spread by total average interest-earning assets.
Net interest income spread increased $765 thousand for the three months ended March 31, 2011 to $1.5 million from $770 thousand for the comparable 2010 period. The increase in net interest spread was primarily attributable to overall increases in pricing and the corresponding reduction in investor yield requirements between periods on securitized mortgage collateral and securitized mortgage borrowings, a decrease in interest expense on the long-term debt, partially offset by an increase in interest expense incurred on the note payable for the quarter ended March 31, 2011. As a result, net interest margin increased from 0.05% for the three months ended March 31, 2010 to 0.10% for the three months ended March 31, 2011.
During the three months ended March 31, 2011, the yield on interest-earning assets decreased to 14.37% from 18.56% in the comparable 2010 period. The yield on interest-bearing liabilities decreased to 14.29% for the three months ended March 31, 2011 from 18.47% for the comparable 2010 period. In connection with the fair value accounting for investment securities available-for-sale and securitized mortgage collateral and borrowings, interest income and interest expense is recognized using effective yields based on estimated fair values for these instruments. The decrease in yield for securitized mortgage collateral and securitized mortgage borrowings is primarily related to increased prices on mortgage-backed bonds which resulted in a decrease in yield. Bond prices received from pricing services and other market participants have increased over the past few quarters as investor’s demand for mortgage-backed securities has increased. This has resulted in an increase in fair value for both securitized mortgage collateral and securitized mortgage borrowings. These increases in fair value have decreased the effective yields used for purposes of recognizing interest income and interest expense on these instruments.
Non-Interest Income
Changes in Non-Interest Income
|
|
|
For the Three Months Ended March 31, |
| |||||||||
|
|
|
|
|
|
|
Increase |
|
% |
| |||
|
|
|
2011 |
|
2010 |
|
(Decrease) |
|
Change |
| |||
|
Change in fair value of net trust assets, excluding REO |
|
$ |
4,896 |
|
$ |
7,372 |
|
$ |
(2,476 |
) |
(34 |
)% |
|
Losses from REO |
|
(4,249 |
) |
(1,108 |
) |
(3,141 |
) |
(283 |
) | |||
|
Non-interest income - net trust assets |
|
647 |
|
6,264 |
|
(5,617 |
) |
(90 |
) | |||
|
Change in fair value of long-term debt |
|
238 |
|
(291 |
) |
529 |
|
182 |
| |||
|
Mortgage and real estate services fees |
|
11,690 |
|
10,950 |
|
740 |
|
7 |
| |||
|
Other |
|
295 |
|
80 |
|
215 |
|
269 |
| |||
|
Total non-interest income |
|
$ |
12,870 |
|
$ |
17,003 |
|
$ |
(4,133 |
) |
(24 |
)% |
Non-interest income—net trust assets. Since our consolidated and unconsolidated securitization trusts are nonrecourse to the Company, our economic risk is limited to our residual interests in these securitization trusts. To better understand the economics on our residual interests in securitizations, it is necessary to consider the net effect of changes in fair value of net trust assets and losses from real estate owned. All estimated future losses are included in the estimate of the fair value of securitized mortgage collateral and REO. Losses on REO are reported separately in the consolidated statement of operations as REO is a nonfinancial asset which is the only component of trust assets and liabilities that is not recorded at fair value. Therefore, REO value at the time of sale or losses from further write-downs are recorded separately in the Company’s consolidated statement of operations. The net effect of changes in value related to our investment in all trust assets and liabilities is shown as non-interest income—net trust assets, which includes losses from REO. Non-interest income related to our net trust assets (residual interests in securitizations) was $647 thousand for the three months ended March 31, 2011, compared to $6.3 million in the comparable 2010 period. The individual components of the non-interest income from net trust assets are discussed below:
Change in fair value of net trust assets, excluding REO. For the quarter ended March 31, 2011, the Company recognized a $4.9 million gain from the change in fair value of net trust assets, excluding REO. The net gain recognized during the period was comprised of gains resulting from the increase in fair value of securitized mortgage collateral and reduction in fair value of net derivative liabilities of $139.4 million and $2.9 million, respectively. Offsetting these gains were losses resulting from increases in the fair value of securitized mortgage borrowings and decrease in fair value of investment securities available-for-sale of $137.3 million and $202 thousand, respectively.
For the quarter ended March 31, 2010, the Company recognized a $7.4 million gain from the change in fair value of net trust assets, excluding REO. The net gain recognized during the period was comprised of gains resulting from the increase in fair value of investment securities-for-sale and securitized mortgage collateral of $178 thousand and $681.4 million, respectively. Offsetting these gains were losses resulting from increases in the fair value of securitized mortgage borrowings and net derivative liabilities of $656.2 million and $18.0 million, respectively.
Losses from REO. Losses from REO were $4.2 million for the three months ended March 31, 2011. This loss was comprised of $4.2 million in additional impairment write-downs during the period partially offset by $4 thousand in gain on sale of REO. During the three months ended March 31, 2011, additional impairment write-downs were attributable to higher expected loss severities on properties held during the period as compared to previously reserved. The gain is attributable to mortgage insurance recovery collected in the period.
Losses from real estate owned were $1.1 million for the three months ended March 31, 2010. This loss was comprised of a $1.8 million loss on sale of real estate owned, coupled with $672 thousand in recovery of the net realizable value during the period.
Change in the fair value of long-term debt. Change in the fair value of long-term debt was a gain of $238 thousand for the three months ended March 31, 2011, compared to a loss of $291 thousand for the comparable 2010 period. Long-term debt (consisting of trust preferred securities and junior subordinated notes) is measured based upon an analysis prepared by the Company, which considers the Company’s own credit risk, including consideration of settlements with trust preferred debt holders and discounted cash flow analysis.
Mortgage and real estate services fees. Revenues generated from these businesses are primarily from the Company’s long-term mortgage portfolio. For the three months ended March 31, 2011, mortgage and real estate services fees were $11.7 million compared to $11.0 million in fees in the comparable 2010 period. The mortgage and real estate services fees of $11.7 million for the three months ended March 31, 2011, was primarily comprised of $4.6 million in monitoring, surveillance and recovery fees, $4.3 million in title and escrow fees, $1.5 million in loan modification fees, and $1.3 million in servicing income. The $740 thousand increase in mortgage and real estate services fees was comprised of increases in title and escrow fees, monitoring, surveillance and recovery fees and servicing income of approximately $1.6 million, $600 thousand, and $600 thousand, respectively. Offsetting these increases were reductions in loan modification fees of approximately $2.0 million.
Non-Interest Expense
Changes in Non-Interest Expense
|
|
|
For the Three Months Ended March 31, |
| |||||||||
|
|
|
|
|
|
|
Increase |
|
% |
| |||
|
|
|
2011 |
|
2010 |
|
(Decrease) |
|
Change |
| |||
|
General and administrative |
|
$ |
4,579 |
|
$ |
4,778 |
|
$ |
(199 |
) |
(4 |
)% |
|
Personnel expense |
|
10,766 |
|
9,681 |
|
1,085 |
|
11 |
| |||
|
Total operating expense |
|
$ |
15,345 |
|
$ |
14,459 |
|
$ |
886 |
|
6 |
% |
Total non-interest expense was $15.3 million for the three months ended March 31, 2011, compared to $14.5 million for the comparable period of 2010. The $886 thousand increase in non-interest expense was primarily attributable to a $1.1 million increase in personnel and related costs associated with the expansion of the mortgage lending platform, which was partially offset by a decrease in general and administrative expenses.
Results of Operations by Business Segment
Mortgage and Real Estate Services
Condensed Statements of Operations Data
|
|
|
For the Three Months Ended March 31, |
| |||||||||
|
|
|
|
|
|
|
Increase |
|
% |
| |||
|
|
|
2011 |
|
2010 |
|
(Decrease) |
|
Change |
| |||
|
Net interest income |
|
$ |
— |
|
$ |
5 |
|
$ |
(5 |
) |
(100 |
)% |
|
|
|
|
|
|
|
|
|
|
| |||
|
Mortgage and real estate services fees |
|
11,690 |
|
10,950 |
|
740 |
|
7 |
| |||
|
Other non-interest income |
|
327 |
|
79 |
|
248 |
|
314 |
| |||
|
Total non-interest income |
|
12,017 |
|
11,029 |
|
988 |
|
9 |
| |||
|
|
|
|
|
|
|
|
|
|
| |||
|
Personnel expense |
|
9,039 |
|
7,611 |
|
1,428 |
|
19 |
| |||
|
Non-interest expense and income taxes |
|
2,048 |
|
2,288 |
|
(240 |
) |
(10 |
) | |||
|
Net earnings |
|
$ |
930 |
|
$ |
1,135 |
|
$ |
(205 |
) |
(18 |
)% |
For the three months ended March 31, 2011, mortgage and real estate services fees, which primarily include loan modification fees and monitoring and surveillance services fees, were $11.7 million compared to $11.0 million in monitoring fees in the comparable 2010 period. The $740 thousand increase in mortgage and real estate services fees was comprised of increases in title and escrow fees, monitoring, surveillance and recovery fees and servicing income of approximately $1.6 million, $600 thousand, and $600 thousand, respectively. Offsetting these increases were reductions in loan modification fees of approximately $2.0 million.
For the three months ended March 31, 2011, personnel expense increased $1.4 million to $9.0 million as a result of increases in personnel and related costs associated with the expansion of our mortgage lending platform.
Long-term Portfolio
Condensed Statements of Operations Data
|
|
|
For the Three Months Ended March 31, |
| |||||||||
|
|
|
|
|
|
|
Increase |
|
% |
| |||
|
|
|
2011 |
|
2010 |
|
(Decrease) |
|
Change |
| |||
|
Net interest income |
|
$ |
1,535 |
|
$ |
765 |
|
$ |
770 |
|
101 |
% |
|
|
|
|
|
|
|
|
|
|
| |||
|
Change in fair value of net trust assets, excluding REO |
|
4,896 |
|
7,372 |
|
(2,476 |
) |
(34 |
) | |||
|
Losses from REO |
|
(4,249 |
) |
(1,108 |
) |
(3,141 |
) |
(283 |
) | |||
|
Non-interest (loss) income- net trust assets |
|
647 |
|
6,264 |
|
(5,617 |
) |
(90 |
) | |||
|
Change in fair value of long-term debt |
|
238 |
|
(291 |
) |
529 |
|
182 |
| |||
|
Other non-interest income |
|
(32 |
) |
292 |
|
(324 |
) |
(111 |
) | |||
|
Total non-interest income |
|
853 |
|
6,265 |
|
(5,412 |
) |
(86 |
) | |||
|
|
|
|
|
|
|
|
|
|
| |||
|
Personnel expense |
|
(1,727 |
) |
(2,071 |
) |
344 |
|
17 |
| |||
|
Non-interest expense and income taxes |
|
(2,543 |
) |
(2,574 |
) |
31 |
|
1 |
| |||
|
Net (loss) earnings |
|
$ |
(1,882 |
) |
$ |
2,385 |
|
$ |
(4,267 |
) |
(179 |
)% |
Net loss for the long-term portfolio was $1.9 million for the three months ended March 31, 2011, compared to earnings of $2.1 million for the comparable period of 2010. The increase in net loss is primarily attributable to a $5.6 million decrease in non-interest income-net trust assets, partially offset by a $529 thousand increase in the change in fair value of long-term debt, $770 thousand increase in net interest income and a $344 thousand reduction in personnel expense.
For the three months ended March 31, 2011, the Company recognized a $4.9 million gain from the change in fair value of net trust assets, excluding REO. The net gain recognized during the period was comprised of gains resulting from the increase in fair value of securitized mortgage collateral and reduction in fair value of net derivative liabilities of $139.4 million and $2.9 million, respectively. Offsetting these gains were losses resulting from increases in the fair value of securitized mortgage borrowings and decrease in fair value of investment securities available-for-sale of $137.3 million and $202 thousand, respectively. Losses from REO were $4.2 million for the three months ended March 31, 2011. This loss was comprised of $4.2 million in additional impairment write-downs during the period partially offset by $4 thousand in gain on sale of REO. During the three months ended March 31, 2011, additional impairment write-downs were attributable to higher expected loss severities on properties held during the period as compared to previously reserved. The gain is attributable to mortgage insurance recovery collected in the period.
Personnel expense decreased $344 thousand during the three months ended March 31, 2011 as a result of reduced personnel associated with the long-term portfolio segment of the Company.
Discontinued Operations
Condensed Statements of Operations Data
|
|
|
For the Three Months Ended March 31, |
| |||||||||
|
|
|
|
|
|
|
Increase |
|
% |
| |||
|
|
|
2011 |
|
2010 |
|
(Decrease) |
|
Change |
| |||
|
Net interest income |
|
$ |
— |
|
$ |
27 |
|
$ |
(27 |
) |
(100 |
)% |
|
|
|
|
|
|
|
|
|
|
| |||
|
(Loss) gain on sale of loans |
|
(22 |
) |
195 |
|
(217 |
) |
(111 |
) | |||
|
(Provision) recovery for repurchases |
|
(253 |
) |
53 |
|
(306 |
) |
(577 |
) | |||
|
Other non-interest income |
|
144 |
|
1,837 |
|
(1,693 |
) |
(92 |
) | |||
|
Total non-interest income |
|
(131 |
) |
2,085 |
|
(2,216 |
) |
(106 |
) | |||
|
|
|
|
|
|
|
|
|
|
| |||
|
Non-interest expense and income taxes |
|
(219 |
) |
274 |
|
(493 |
) |
(180 |
) | |||
|
Net (loss) earnings |
|
$ |
(350 |
) |
$ |
2,386 |
|
$ |
(2,736 |
) |
(115 |
)% |
Net loss from discontinued operations was $350 thousand for the three months ended March 31, 2011, compared to earnings of $2.4 million for the comparable period in 2010. The decrease in earnings to a net loss of $350 thousand is primarily attributable to a $2.2 million reduction in non-interest income and a $493 thousand increase in non-interest expense and income taxes.
Provision for repurchases increased $306 thousand to a provision of $253 thousand for the three months ended March 31, 2011, compared to a recovery of $53 thousand for the same period in 2010. The $306 thousand increase is the result of increases in estimated repurchase obligations during the first quarter of 2011.
The $1.7 million decrease in other non-interest income is primarily the result of gains of $144 thousand on sales of REO properties not in trusts during the three months ended March 31, 2011 as compared to gains on sales of REO properties not in trusts and recovery of REO write-downs totaling $1.1 million for the comparable period in 2010.
The $493 thousand increase in non-interest expense and income taxes is primarily related to a $479 thousand gain in the first quarter of 2010 related to lease impairment adjustments as a result of changes in our expected minimum future lease payments.
ITEM 3: QUANTITATIVE AND QUALITATIVE DISCLOSURES ABOUT MARKET RISK
As a smaller reporting company, we are not required to provide the information required by this Item.
ITEM 4: CONTROLS AND PROCEDURES
Evaluation of Disclosure Controls and Procedures
The Company maintains disclosure controls and procedures (as defined in the Securities Exchange Act of 1934 Rules 13a-15(e) or 15d-15(e)) designed to ensure that information required to be disclosed in reports filed or submitted under the Securities Exchange Act of 1934, as amended, is recorded, processed, summarized and reported within the time periods specified in the SEC’s rules and forms. Disclosure controls and procedures include, without limitation, controls and procedures designed to ensure that information required to be disclosed by the Company in its reports that it files or submits under the Exchange Act is accumulated and communicated to the Company’s management, including its principal executive and principal financial officers, or persons performing similar functions, as appropriate to allow timely decisions regarding required disclosure.
As required by Rules 13a-15 and 15d-15 under the Exchange Act, in connection with the filing of this Quarterly Report on Form 10-Q, our management, under the supervision and with the participation of our CEO and CFO, conducted an evaluation of our disclosure controls and procedures, as such term is defined under Rule 13a-15(e). Based on that evaluation, the Company’s chief executive officer and chief financial officer concluded that, as of that date, the Company’s disclosure controls and procedures were effective at a reasonable assurance level.
Changes in Internal Control Over Financial Reporting
There has been no change in the Company’s internal control over financial reporting during the Company’s quarter ended March 31, 2011, that has materially affected, or is reasonably likely to materially affect, the Company’s internal control over financial reporting.
On May 6, 2011 a case entitled Massachusetts Mutual Life Insurance Company v Impac Funding Corporation, et al was filed in the United States District Court for the District of Massachusetts as Case No. 3:11-cv-30127. The complaint names Impac Funding Corporation and Impac secured Assets Corporation along with two of their officers as defendants. The action alleges violations of the Massachusetts Uniform Securities Act and the plaintiff seeks rescission or damages for their purchase of bonds from two securitization trusts issued by the Defendants. The plaintiff alleges that the loans deposited into the trusts did not meet the representations made in the offering documents when they purchased their bonds.
On or about April 20, 2011, an action was filed in the Superior Court of the Commonwealth of Massachusetts as case No. B.L.S. 11-1533 entitled Federal Home Loan bank of Boston v. Ally financial Inc., et al. Named as defendants in that action are IMH Assets Corp, Impac Funding Corporation, Impac Mortgage Holdings, Inc. and Impac Secured Assets Corp. The complaint alleges misrepresentations in connection with the materials used to market mortgage backed securities that the plaintiff purchased. The complaint seeks damages and attorney’s fees in an amount to be established at time of trial.
On or about May10, 2011 a purported class action complaint was filed in the United States District court, Central district of California as Case No. SACV11-00717 entitled Norma B. Power Trust, individually and on Behalf of All Others Similarly Situated v Impac Mortgage Holdings, Inc., et al. The action alleges that the Defendants filed unauthorized false, invalid amendments to the Company’s corporate charter with regards to the holders of series B Preferred Stock and Series C Preferred Stock. The action seeks recovery under Section 10(b) of the Exchange Act and Rule 10b-5, Section 13(a) of the Exchange Act, Rules 12b-20, 13a-1 and 13a-11. It also seeks recovery under Rule 14(e) and Section 20(a) of the Exchange Act. The Plaintiff seeks compensatory damages, costs, expenses, attorney’s fees and rescission.
We are party to other litigation and claims which are normal in the course of our operations. While the results of such other litigation and claims cannot be predicted with certainty, we believe the final outcome of such matters will not have a material adverse effect on our financial condition or results of operations.
The Company believes that it has meritorious defenses to the above claims and intends to defend these claims vigorously and as such the Company believes the final outcome of such matters will not have a material adverse effect on its financial condition or results of operations. Nevertheless, litigation is uncertain and the Company may not prevail in the lawsuits and can express no opinion as to their ultimate resolution. An adverse judgment in any of these matters could have a material adverse effect on the Company’s financial position and results of operations.
Please refer to IMH’s report on Form 10-K for the year ended December 31, 2010 for a description of litigation and claims.
We are subject to a purported class action claim arising from our preferred stock tender offer, which if determined adversely to us, could harm our financial results
In May 2011, a putative class action lawsuit was filed against us and our officers and directors, asserting claims related to the tender offer of our Series B and Series C Preferred Stock that occurred in 2009. The lawsuit asserts that we made material misstatements and omissions in connection with the tender of the preferred stock. Such lawsuit could result in the diversion of management’s time and attention away from business operations, which could harm our business. In addition, the costs of defense and any damages resulting from this litigation, a ruling against us, or a settlement of the litigation could adversely affect our financial condition, results of operations and cash flow.
Our Annual Report on Form 10-K for the year ended December 31, 2010 includes a detailed discussion of our risk factors. The information presented below updates and should be read in conjunction with the risk factors and information disclosed in that Form 10-K.
ITEM 2: UNREGISTERED SALES OF EQUITY SECURITIES AND USE OF PROCEEDS
None
ITEM 3: DEFAULTS UPON SENIOR SECURITIES
None.
None.
On March 30, 2011, the Company, through IRES and its subsidiaries, entered into a Master Repurchase Agreement providing a $20 million warehouse facility. The interest rate on the warehouse facility is Prime plus 1.50% and it expires March 2012. Under the terms of the warehouse facility, the subsidiary is required to maintain various financial and other covenants, such as a tangible net worth of $5 million, a leverage ratio of 15 to 1, a liquidity percentage of 30% and a minimum liquidity and profitability. Upon an event of default, such as failure to repay any amounts when due, breach of any representation, warranty or covenant, insolvency, change of control and a material adverse effect, amounts outstanding will become immediately due and a default rate of up to 4% will be applied.
(a) Exhibits:
|
10.1 |
|
Master Repurchase Agreement between Excel Mortgage Servicing, Inc. and Alliance Bank of Arizona dated March 30, 2011. |
|
31.1 |
|
Certification of Chief Executive Officer pursuant to Item 601(b)(31) of Regulation S-K, as adopted pursuant to Section 302 of the Sarbanes-Oxley Act of 2002. |
|
31.2 |
|
Certification of Chief Financial Officer pursuant to Item 601(b)(31) of Regulation S-K, as adopted pursuant to Section 302 of the Sarbanes-Oxley Act of 2002. |
|
32.1* |
|
Certifications of Chief Executive Officer and Chief Financial Officer pursuant to 18 U.S.C. Section 1350 as adopted pursuant to Section 906 of the Sarbanes-Oxley Act of 2002. |
* This exhibit shall not be deemed “filed” for purposes of Section 18 of the Securities Exchange Act of 1934 or otherwise subject to the liabilities of that section, nor shall it be deemed incorporated by reference in any filing under the Securities Act of 1933 or the Securities Exchange Act of 1934, whether made before or after the date hereof and irrespective of any general incorporation language in any filings.
Pursuant to the requirements of the Securities Exchange Act of 1934, the Registrant has duly caused this report to be signed on its behalf by the undersigned, thereunto duly authorized.
|
IMPAC MORTGAGE HOLDINGS, INC. |
|
|
|
|
|
/s/ TODD R. TAYLOR |
|
|
Todd R. Taylor |
|
|
Chief Financial Officer |
|
|
(authorized officer of registrant and principal financial officer) |
|
May 16, 2011