Attached files
Table of Contents
UNITED STATES
SECURITIES AND EXCHANGE COMMISSION
Washington, D.C. 20549
FORM 10-Q
| x | QUARTERLY REPORT PURSUANT TO SECTION 13 OR 15(d) OF THE SECURITIES EXCHANGE ACT OF 1934 |
For the quarterly period ended March 31, 2011
OR
| ¨ | TRANSITION REPORT PURSUANT TO SECTION 13 OR 15(d) OF THE SECURITIES EXCHANGE ACT OF 1934 |
For the transition period from to
Commission file number: 001-35004
FleetCor Technologies, Inc.
(Exact name of registrant as specified in its charter)
| Delaware | 72-1074903 | |
| (State or other jurisdiction of incorporation or organization) | (I.R.S. Employer Identification No.) | |
| 655 Engineering Drive, Suite 300, Norcross, Georgia | 30092-2830 | |
| (Address of principal executive offices) | (Zip Code) | |
Registrant’s telephone number, including area code: (770) 449-0479
Indicate by check mark whether the registrant (1) has filed all reports required to be filed by Section 13 or 15(d) of the Securities Exchange Act of 1934 during the preceding 12 months (or for such shorter period that the registrant was required to file such reports), and (2) has been subject to such filing requirements for the past 90 days. Yes x No ¨
Indicate by check mark whether the registrant has submitted electronically and posted on its corporate Web site, if any, every Interactive Data File required to be submitted and posted pursuant to Rule 405 of Regulation S-T (§232.405 of this chapter) during the preceding 12 months (or for such shorter period that the registrant was required to submit and post such files). Yes ¨ No ¨
Indicate by check mark whether the registrant is a large accelerated filer, an accelerated filer, a non-accelerated filer, or a smaller reporting company. See the definitions of “large accelerated filer,” “accelerated filer” and “smaller reporting company” in Rule 12b-2 of the Exchange Act.
| Large accelerated filer |
¨ |
Accelerated filer |
¨ | |||
| Non-accelerated filer |
x (Do not check if a smaller reporting company) |
Smaller reporting company |
¨ |
Indicate by check mark whether the registrant is a shell company (as defined in Rule 12b-2 of the Exchange Act). Yes ¨ No x
Indicate the number of shares outstanding of each of the issuer’s classes of common stock, as of the latest practicable date.
| Class |
Outstanding at May 10, 2011 |
|||||
| Common Stock, $0.001 par value | 80,083,128 |
Table of Contents
FLEETCOR TECHNOLOGIES, INC. AND SUBSIDIARIES
FORM 10-Q
For The Quarter Ended March 31, 2011
INDEX
2
Table of Contents
FleetCor Technologies, Inc. and Subsidiaries
Consolidated Balance Sheets
(In Thousands, Except Share and Par Value Amounts)
| March 31, 2011 |
December 31, 2010 |
|||||||
| (Unaudited) | ||||||||
| Assets |
||||||||
| Current assets: |
||||||||
| Cash and cash equivalents |
$ | 119,779 | $ | 114,804 | ||||
| Restricted cash |
66,319 | 62,341 | ||||||
| Accounts receivable (less allowance for doubtful accounts of $15,187 and $14,256, respectively) |
378,951 | 260,163 | ||||||
| Securitized accounts receivable—restricted for securitization investors |
154,000 | 144,000 | ||||||
| Prepaid expenses and other current assets |
36,226 | 33,191 | ||||||
| Deferred income taxes |
4,594 | 4,484 | ||||||
| Total current assets |
759,869 | 618,983 | ||||||
| Property and equipment |
87,411 | 83,013 | ||||||
| Less accumulated depreciation and amortization |
(60,314) | (56,195) | ||||||
| Net property and equipment |
27,097 | 26,818 | ||||||
| Goodwill |
602,017 | 601,666 | ||||||
| Other intangibles, net |
190,066 | 193,861 | ||||||
| Other assets |
43,172 | 42,790 | ||||||
| Total assets |
$ | 1,622,221 | $ | 1,484,118 | ||||
| Liabilities and stockholders’ equity |
||||||||
| Current liabilities: |
||||||||
| Accounts payable |
$ | 250,765 | $ | 177,644 | ||||
| Accrued expenses |
59,002 | 49,176 | ||||||
| Customer deposits |
81,016 | 78,685 | ||||||
| Securitization facility |
154,000 | 144,000 | ||||||
| Current portion of notes payable and other obligations |
11,134 | 11,617 | ||||||
| Total current liabilities |
555,917 | 461,122 | ||||||
| Notes payable and other obligations, less current portion |
317,287 | 313,796 | ||||||
| Deferred income taxes |
81,350 | 83,255 | ||||||
| Total noncurrent liabilities |
398,637 | 397,051 | ||||||
| Commitments and contingencies (Note 10) |
||||||||
| Stockholders’ equity: |
||||||||
| Common stock, $0.001 par value; 475,000,000 shares authorized, 111,885,103 shares issued and 80,003,433 shares outstanding at March 31, 2011; and 475,000,000 shares authorized, 111,522,354 shares issued and 79,655,213 shares outstanding at December 31, 2010 |
112 | 112 | ||||||
| Additional paid-in capital |
427,849 | 421,991 | ||||||
| Retained earnings |
419,498 | 387,163 | ||||||
| Accumulated other comprehensive loss |
(4,129) | (8,101) | ||||||
| Less treasury stock (31,881,670 shares at March 31, 2011 and 31,867,141 at December 31, 2010) |
(175,663) | (175,220) | ||||||
| Total stockholders’ equity |
667,667 | 625,945 | ||||||
| Total liabilities and stockholders’ equity |
$ | 1,622,221 | $ | 1,484,118 | ||||
See accompanying notes to unaudited consolidated financial statements.
3
Table of Contents
FleetCor Technologies, Inc. and Subsidiaries
Unaudited Consolidated Statements of Income
(In Thousands, Except Share and Per Share Amounts)
| Three months ended March 31, |
||||||||
| 2011 | 2010 | |||||||
| Revenues, net |
$ | 111,005 | $ | 104,202 | ||||
| Expenses: |
||||||||
| Merchant commissions |
8,277 | 11,589 | ||||||
| Processing |
17,932 | 17,521 | ||||||
| Selling |
7,787 | 6,849 | ||||||
| General and administrative |
17,915 | 13,089 | ||||||
| 59,094 | 55,154 | |||||||
| Depreciation and amortization |
8,607 | 8,054 | ||||||
| Operating income |
50,487 | 47,100 | ||||||
| Other (income) loss, net |
(34) | 44 | ||||||
| Interest expense, net |
3,363 | 5,264 | ||||||
| Total other expense |
3,329 | 5,308 | ||||||
| Income before income taxes |
47,158 | 41,792 | ||||||
| Provision for income taxes |
14,823 | 14,447 | ||||||
| Net income |
32,335 | 27,345 | ||||||
| Calculation of income attributable to common shareholders: |
||||||||
| Convertible preferred stock accrued dividends |
— | (4,420) | ||||||
| Income attributable to common shareholders for basic earnings per share |
$ | 32,335 | $ | 22,925 | ||||
| Earnings per share: |
||||||||
| Basic earnings per share |
$ | 0.40 | $ | 0.67 | ||||
| Diluted earnings per share |
$ | 0.39 | $ | 0.34 | ||||
| Weighted average shares outstanding: |
||||||||
| Basic weighted average shares outstanding |
79,937 | 34,011 | ||||||
| Diluted weighted average shares outstanding |
83,378 | 80,489 | ||||||
See accompanying notes to unaudited consolidated financial statements.
4
Table of Contents
FleetCor Technologies, Inc. and Subsidiaries
Unaudited Consolidated Statements of Cash Flows
(In Thousands)
| Three months ended March 31, |
||||||||
| 2011 | 2010 | |||||||
| Operating activities |
||||||||
| Net income |
$ | 32,335 | $ | 27,345 | ||||
| Adjustments to reconcile net income to net cash (used in) provided by operating activities: |
||||||||
| Depreciation |
2,725 | 2,623 | ||||||
| Stock-based compensation |
4,141 | 853 | ||||||
| Provision for losses on accounts receivable |
3,847 | 5,303 | ||||||
| Amortization of deferred financing costs |
466 | 427 | ||||||
| Amortization of intangible assets |
4,600 | 4,188 | ||||||
| Amortization of premium on receivables |
816 | 816 | ||||||
| Deferred income taxes |
(340) | 684 | ||||||
| Changes in operating assets and liabilities (net of acquisitions): |
||||||||
| Restricted cash |
(3,978) | 2,634 | ||||||
| Accounts receivable |
(132,635) | (48,385) | ||||||
| Prepaid expenses and other current assets |
(3,035) | (8,859) | ||||||
| Other assets |
(1,114) | 692 | ||||||
| Excess tax benefits related to stock-based compensation |
(787) | — | ||||||
| Accounts payable, accrued expenses and customer deposits |
84,165 | 54,472 | ||||||
| Net cash (used in) provided by operating activities |
(8,794) | 42,793 | ||||||
| Investing activities |
||||||||
| Purchases of property and equipment |
(2,594) | (2,144) | ||||||
| Net cash used in investing activities |
(2,594) | (2,144) | ||||||
| Financing activities |
||||||||
| Excess tax benefits related to stock-based compensation |
787 | — | ||||||
| Borrowings (payments) on securitization facility, net |
10,000 | (22,000) | ||||||
| Deferred financing costs paid |
(550) | (1,067) | ||||||
| Proceeds from issuance of common stock |
484 | 321 | ||||||
| Principal payments on notes payable |
(1,729) | (12,625) | ||||||
| Principal payments on other obligations |
— | (6) | ||||||
| Net cash provided by (used in) financing activities |
8,992 | (35,377) | ||||||
| Effect of foreign currency exchange rates on cash |
7,371 | (3,616) | ||||||
| Net increase in cash and cash equivalents |
4,975 | 1,656 | ||||||
| Cash and cash equivalents, beginning of period |
114,804 | 84,701 | ||||||
| Cash and cash equivalents, end of period |
$ | 119,779 | $ | 86,357 | ||||
| Supplemental cash flow information |
||||||||
| Cash paid for interest |
$ | 4,182 | $ | 5,106 | ||||
| Cash paid for income taxes |
$ | 3,103 | $ | 6,634 | ||||
| Adoption of new accounting guidance related to asset securitization facility |
$ | — | $ | 218,000 | ||||
See accompanying notes to unaudited consolidated financial statements.
5
Table of Contents
FleetCor Technologies, Inc. and Subsidiaries
Notes to Unaudited Consolidated Financial Statements
March 31, 2011
1. Summary of Significant Accounting Policies
Basis of Presentation
Throughout this report, the terms “our,” “we,” “us,” and the “Company” refers to FleetCor Technologies Inc. and its subsidiaries. The Company prepared the accompanying interim consolidated financial statements in accordance with Rule 10-01 of Regulation S-X. Accordingly, they do not include all of the information and footnotes required by accounting principles generally accepted in the United States (“GAAP”). The unaudited consolidated financial statements reflect all adjustments considered necessary for fair presentation. These adjustments consist primarily of normal recurring accruals and estimates that impact the carrying value of assets and liabilities. Actual results may differ from these estimates. Operating results for the three month period ended March 31, 2011 are not necessarily indicative of the results that may be expected for the year ending December 31, 2011.
The unaudited consolidated interim financial statements should be read in conjunction with the audited consolidated financial statements and notes thereto included in the Company’s Annual Report on Form 10-K for the fiscal year ended December 31, 2010.
Derivative Financial Instruments
Derivative financial instruments are generally used to manage certain interest rate risks through the use of interest rate swaps. These instruments, when settled, impact the Company’s cash flows from operations. On the date in which the Company enters into a derivative, the derivative is designated as a hedge of the identified exposure. The Company measures effectiveness of its hedging relationships both at hedge inception and on an ongoing basis.
Gains and losses on interest rate swaps designated as cash flow hedges, to the extent that the hedge relationship has been effective, are deferred in other comprehensive income and recognized in interest expense over the period in which the Company recognizes interest expense on the related debt instrument.
Any ineffectiveness on these instruments is immediately recognized in interest expense in the period that the ineffectiveness occurs. No significant ineffectiveness was recorded on designated hedges in the three month period ended March 31, 2010.
All interest rate swaps had matured prior to the beginning of the three months ended March 31, 2011.
Foreign Currency Translation
Assets and liabilities of foreign subsidiaries are translated into U.S. dollars at the rates of exchange in effect at period-end. The related translation adjustments are made directly to accumulated other comprehensive income. Income and expenses are translated at the average monthly rates of exchange in effect during the period. Gains and losses from foreign currency transactions of these subsidiaries are included in net income. The Company recognized a foreign exchange gain of $37,000 for the three months ended March 31, 2011 and a foreign exchange loss of $66,000 for the three months ended March 31, 2010, respectively, which are classified within other income, net in the unaudited Consolidated Statements of Income.
Comprehensive Income (Loss)
Comprehensive income (loss) is defined as the total of net income and all other changes in equity that result from transactions and other economic events of a reporting period other than transactions with owners. The Company’s accumulated other comprehensive loss includes foreign currency translation losses of $4.1 million and $9.4 million and the unrealized loss on interest rate swaps of $0 and $3.0 million for the three months ended March 31, 2011 and 2010, respectively.
New Accounting Pronouncements
On January 21, 2010, the Financial Accounting Standards Board (“FASB”) issued ASU 2010-06, “Improving Disclosures About Fair Value Measurements,” which amends ASC 820, “Fair Value Measurements and Disclosures,” to add new requirements for disclosures about transfers into and out of Levels 1 and 2 of the fair value
6
Table of Contents
hierarchy and separate disclosures about purchases, sales, issuances, and settlements relating to Level 3 measurements within the fair value hierarchy. This ASU also clarifies existing fair value disclosures about the level of disaggregation and about inputs and valuation techniques used to measure fair value. This ASU was effective for the Company beginning January 1, 2010, except for the requirements to provide the Level 3 activity of purchases, sales, issuance, and settlements, if any, which were effective for the Company beginning January 1, 2011. Since ASU 2010-06 is a disclosure-only standard, its adoption had no impact on the Company’s results of operations, financial condition, or cash flows.
On October 7, 2009, the FASB issued ASU 2009-13, “Multiple Revenue Arrangements - a Consensus of the FASB Emerging Issues Task Force” which supersedes certain guidance in ASC 605-25, “Revenue Recognition-Multiple Element Arrangements,” and requires an entity to allocate arrangement consideration to all of its deliverables at the inception of an arrangement based on their relative selling prices (i.e., the relative-selling-price method). The use of the residual method of allocation will no longer be permitted in circumstances in which an entity recognized revenue for an arrangement with multiple deliverables subject to ASC 605-25. ASU 2009-13 also requires additional disclosures. The Company adopted the provisions of ASU 2009-13 beginning on January 1, 2011. Based on the Company’s current revenue arrangements, the adoption of ASU 2009-13 did not have a material impact on the Company’s financial condition, results of operations, or cash flows.
In April 2010, the FASB issued ASU 2010-13, “Compensation-Stock Compensation (Topic 718) — Effect of Denominating the Exercise Price of a Share-Based Payment Award in the Currency of the Market in Which the Underlying Equity Security Trades — a Consensus of the FASB Emerging Issues Task Force.” ASU 2010-13 addresses whether an entity should classify a share-based payment award as equity or a liability if the award’s exercise price is denominated in the currency in which the underlying security trades and that currency is different from the (1) entity’s functional currency, (2) functional currency of the foreign operation for which the employee provides services, and (3) payroll currency of the employee. Under the existing guidance in ASC 718-10, “Compensation-Stock Compensation,” the Company does not classify any of its stock-based compensation as liabilities. ASU 2010-13 was effective for the Company beginning on January 1, 2011.The adoption of ASU 2010-13 does not change the Company’s current accounting for its stock-based compensation awards as ASU 2010-13’s application contains an exception for share-based payments that, like the Company’s, use exercise prices denominated in the currency of the market in which substantial portions of the entity’s equity securities trade.
2. Accounts Receivable
The Company maintains a $500 million revolving trade accounts receivable securitization facility (the Facility). Pursuant to the terms of the Facility, the Company transfers certain of its domestic receivables, on a revolving basis, to FleetCor Funding LLC (Funding) a wholly-owned bankruptcy remote subsidiary. In turn, Funding sells, without recourse, on a revolving basis, up to $500 million of undivided ownership interests in this pool of accounts receivable to a multi-seller, asset-backed commercial paper conduit (Conduit). Funding maintains a subordinated interest, in the form of over-collateralization, in a portion of the receivables sold to the Conduit. Purchases by the Conduit are financed with the sale of highly-rated commercial paper. On February 24, 2011, the Company extended the term of its asset securitization facility to February 23, 2012. There were no other significant changes related to the extension. The Company capitalized $0.6 million in deferred financing fees in connection with this extension.
The Company utilizes proceeds from the sale of its accounts receivable as an alternative to other forms of debt, effectively reducing its overall borrowing costs. The Company has agreed to continue servicing the sold receivables for the financial institution at market rates, which approximates the Company’s cost of servicing. The Company retains a residual interest in the accounts receivable sold as a form of credit enhancement. The residual interest’s fair value approximates carrying value due to its short-term nature.
Funding determines the level of funding achieved by the sale of trade accounts receivable, subject to a maximum amount.
The Company’s accounts receivable and securitized accounts receivable include the following at March 31, 2011 and December 31, 2010 (in thousands):
7
Table of Contents
| March 31, 2011 |
December 31, 2010 |
|||||||
| Gross domestic accounts receivable |
$ | 230,785 | $ | 160,641 | ||||
| Securitized gross accounts receivable |
154,000 | 144,000 | ||||||
| Gross foreign receivables |
163,353 | 113,778 | ||||||
| Total gross receivables |
548,138 | 418,419 | ||||||
| Less allowance for doubtful accounts |
(15,187) | (14,256) | ||||||
| Net accounts and securitized accounts receivable |
$ | 532,951 | $ | 404,163 | ||||
A rollforward of the Company’s allowance for doubtful accounts related to accounts receivable for the three months ended March 31 is as follows (in thousands):
| 2011 | 2010 | |||||||
| Allowance for doubtful accounts beginning of period |
$ | 14,256 | $ | 14,764 | ||||
| Add: |
||||||||
| Provision for bad debts |
3,847 | 5,303 | ||||||
| Less: |
||||||||
| Write-offs |
(2,916) | (4,962) | ||||||
| Allowance for doubtful accounts end of period |
$ | 15,187 | $ | 15,105 | ||||
All foreign receivables are Company owned receivables and are not included in the Company’s receivable securitization program. At March 31, 2011 and December 31, 2010, there was $154 million and $144 million, respectively, of short-term debt outstanding under the Company’s accounts receivable securitization facility.
3. Fair Value Measurements
Fair value is a market-based measurement that is be determined based on assumptions that market participants would use in pricing an asset or liability. The authoritative guidance discusses valuation techniques, such as the market approach (comparable market prices), the income approach (present value of future income or cash flow), and the cost approach (cost to replace the service capacity of an asset or replacement cost). These valuation techniques are based upon observable and unobservable inputs. Observable inputs reflect market data obtained from independent sources, while unobservable inputs reflect the Company’s market assumptions.
As the basis for evaluating such inputs, a three-tier value hierarchy prioritizes the inputs used in measuring fair value as follows:
| • | Level 1: Observable inputs such as quoted prices for identical assets or liabilities in active markets. |
| • | Level 2: Observable inputs other than quoted prices that are directly or indirectly observable for the asset or liability, including quoted prices for similar assets or liabilities in active markets; quoted prices for similar or identical assets or liabilities in markets that are not active; and model-derived valuations whose inputs are observable or whose significant value drivers are observable. |
| • | Level 3: Unobservable inputs that reflect the reporting entity’s own assumptions. |
The Company’s financial assets and liabilities adjusted to fair value at least quarterly are its money market fund investments included in cash and cash equivalents and its derivative instrument, which is included in accrued expenses. The Company determines the fair value of its money market fund investments based on quoted market prices.
Level 2 fair value determinations are derived from directly or indirectly observable (market based) information. Such inputs are the basis for the fair values of the Company’s derivative instruments. There were no Level 2 assets which required fair value determinations at March 31, 2011 or December 31, 2010.
8
Table of Contents
Level 3 fair value determinations are derived from the Company’s estimate of recovery based on historical collection trends. There were no Level 3 assets or liabilities which required fair value determinations at March 31, 2011 or December 31, 2010.
The following table presents the Company’s financial assets and liabilities which are measured at fair value on a recurring basis and that are subject to the disclosure requirements of the authoritative guidance as of December 31, 2010 (in thousands). There were no financial assets and liabilities measured at fair value on a recurring basis as of March 31, 2011.
| Description | Fair Value | Level 1 | Level 2 | Level 3 | ||||||||||||
| December 31, 2010 |
||||||||||||||||
| Assets: |
||||||||||||||||
| Money market fund investments |
$12,634 | $12,634 | $ — | $ — | ||||||||||||
| Total |
$12,634 | $12,634 | $ — | $ — | ||||||||||||
The Company’s nonfinancial assets which are measured at fair value on a nonrecurring basis include property, plant and equipment, goodwill and other intangible assets. As necessary, the Company generally uses projected cash flows, discounted as necessary, to estimate the fair values of the assets using key inputs such as management’s projections of cash flows on a held-and-used basis (if applicable), management’s projections of cash flows upon disposition and discount rates. Accordingly, these fair value measurements fall in Level 3 of the fair value hierarchy. These assets and certain liabilities are measured at fair value on a nonrecurring basis as part of the Company’s impairment assessments and as circumstances require.
4. Share Based Compensation
The Company has Stock Incentive Plans (the Plans) pursuant to which the Company’s board of directors may grant stock options or restricted stock to key employees. The Company is authorized to issue grants of restricted stock and stock options to purchase up to 26,963,150 shares as of March 31, 2011 and December 31, 2010. There were 2,247,116 additional shares remaining available for grant under the Plans at March 31, 2011.
The table below summarizes the expense recognized related to share-based payments recognized for the three month periods ended March 31 (in thousands):
| 2011 | 2010 | |||||||
| Stock options |
$ | 2,460 | $ | 853 | ||||
| Restricted stock |
1,681 | — | ||||||
| Stock-based compensation |
$ | 4,141 | $ | 853 | ||||
The tax benefits recorded on stock based compensation were $0.7 million and $0.2 million for the three month periods ended March 31, 2011 and 2010, respectively.
The following table summarizes the Company’s total unrecognized compensation cost related to stock-based compensation as of March 31, 2011 (in thousands):
| Unrecognized Compensation Cost |
Weighted Average Period of Expense Recognition (in Years) |
|||||||
| Stock options |
$ | 32,498 | 3.38 | |||||
| Restricted stock |
25,084 | — | ||||||
| Total |
$ | 57,582 | ||||||
9
Table of Contents
Stock Options
Stock options are granted with an exercise price estimated to be greater than or equal to the fair market value on the date of grant. Options granted have vesting provisions ranging from two to six years. Stock option grants are generally subject to forfeiture if employment terminates prior to vesting. All options were granted at estimated fair market value as authorized by the Company’s board of directors.
The following summarizes the changes in the number of shares of common stock under option for the three month period ended March 31, 2011 (shares and aggregate intrinsic value in thousands):
| Shares | Weighted Average Exercise Price |
Options Exercisable at End of Period |
Weighted Average Exercise Price of Exercisable Options |
Weighted Average Fair Value of Options Granted During the Period |
Aggregate Intrinsic Value |
|||||||||||||||||||
| Outstanding at December 31, 2010 |
||||||||||||||||||||||||
| 10,229 | $ | 12.79 | 5,168 | 6.06 | 128,472 | |||||||||||||||||||
| Granted |
210 | 29.99 | $ | 9.90 | ||||||||||||||||||||
| Exercised |
(183) | 5.07 | 5,041 | |||||||||||||||||||||
| Forfeited |
(96) | 15.54 | ||||||||||||||||||||||
| Outstanding at March 31, 2011 |
10,160 | 13.26 | 5,309 | 6.58 | 1138,440 | |||||||||||||||||||
| Expected to vest as of March 31, 2011 |
10,160 | $ | 13.26 | |||||||||||||||||||||
The aggregate intrinsic value of stock options exercised during the three months ended March 31, 2010 was $1.0 million.
The fair value of stock option awards granted was estimated using the Black-Scholes option pricing model during the three months ended March 31, 2011 with the following weighted-average assumptions for grants during the period.
| March 31, 2011 | ||
| Risk-free interest rate |
1.76% | |
| Dividend yield |
— | |
| Expected volatility |
39.27% | |
| Expected life (in years) |
4.0 |
There were no stock option awards granted during the three months ended March 31, 2010.
The Company considered the retirement and forfeiture provisions of the options and utilized its historical experience to estimate the expected life of the options.
The risk-free interest rate is based on the yield of a zero coupon U.S. Treasury security with a maturity equal to the expected life of the option from the date of the grant. The Company estimates the volatility of the share price of the Company’s common stock by considering the historical volatility of the stock of similar public entities. In determining the appropriateness of the public entities included in the volatility assumption the Company considered a number of factors, including the entity’s life cycle stage, size, financial leverage, and products offered.
The weighted-average remaining contractual life for options outstanding was 1.84 and 1.92 years as of March 31, 2011 and December 31, 2010, respectively.
Restricted Stock
Awards of restricted stock and restricted stock units are independent of stock option grants and are generally subject to forfeiture if employment terminates prior to vesting. Prior to the Company’s initial public offering, the vesting of the shares granted in 2010 were contingent on the sale of the Company or a public offering of the Company’s
10
Table of Contents
common stock, subject to certain other conditions. The vesting of the shares granted in 2011 and 2010 are generally based on the passage of time, performance or market conditions. Shares vesting based on the passage of time have vesting provisions ranging from one to five years.
The fair value of restricted stock shares based on market conditions was estimated using the Monte Carlo option pricing model with the following assumptions for the three months ended March 31, 2011.
| March 31, 2011 | ||
| Risk-free interest rate |
2.20% | |
| Dividend yield |
— | |
| Expected volatility |
45.00% | |
| Expected life (in years) |
10.0 |
The risk-free interest rate and volatility assumptions were calculated consistently with those applied in the Black-Scholes options pricing model.
The following table summarizes the changes in the number of shares of restricted stock and restricted stock units for the quarter ended March 31, 2011 (shares in thousands):
| Shares | Weighted Average Grant Date Fair Value |
|||||||
| Unvested at December 31, 2010 |
1,250 | $21.93 | ||||||
| Granted |
180 | 29.99 | ||||||
| Vested |
(116) | 19.47 | ||||||
| Unvested at March 31, 2011 |
1,314 | $23.25 | ||||||
There were no restricted stock units granted or vested during the three months ended March 31, 2010.
5. Goodwill and Other Intangible Assets
As of March 31, 2011 and December 31, 2010 other intangible assets consisted of the following (in thousands):
| March 31, 2011 | December 31, 2010 | |||||||||||||||||||||||||||
| Useful Lives (Years) |
Gross Carrying Amounts |
Accumulated Amortization |
Net Carrying Amount |
Gross Carrying Amounts |
Accumulated Amortization |
Net Carrying Amount |
||||||||||||||||||||||
| Customer and vendor agreements |
5 to 20 | $ | 219,054 | $ | (47,346) | $ | 171,708 | $ | 218,250 | $ | (43,184) | $ | 175,066 | |||||||||||||||
| Trade names and trademarks—indefinite lived |
N/A | 12,626 | — | 12,626 | 12,626 | — | 12,626 | |||||||||||||||||||||
| Trade names and trademarks—other |
3 to 15 | 3,160 | (1,035) | 2,125 | 3,160 | (980) | 2,180 | |||||||||||||||||||||
| Software |
3 to 10 | 5,530 | (2,576) | 2,954 | 5,530 | (2,283) | 3,247 | |||||||||||||||||||||
| Non-compete agreements |
2 to 5 | 1,871 | (1,218) | 653 | 1,871 | (1,129) | 742 | |||||||||||||||||||||
| Total other intangibles |
$ | 242,241 | $ | (52,175) | $ | 190,066 | $ | 241,437 | $ | (47,576) | $ | 193,861 | ||||||||||||||||
Amortization expense related to intangible assets for the three month periods ended March 31, 2011 and 2010 was $4.6 million and $4.2 million, respectively.
11
Table of Contents
A summary of changes in the Company’s goodwill by reportable business segment is as follows (in thousands):
| December 31, 2010 |
Foreign Currency |
March 31, 2011 |
||||||||||
| Segment |
||||||||||||
| North America |
$ 275,929 | $ — | $ 275,929 | |||||||||
| International |
325,737 | 351 | 326,088 | |||||||||
| $ 601,666 | $ 351 | $ 602,017 | ||||||||||
6. Debt
The Company’s debt instruments consist primarily of term notes and a securitization facility as follows (in thousands):
| March 31, 2011 |
December 31, 2010 |
|||||||
| Term note payable—domestic(a) |
$ 269,600 | $ 270,350 | ||||||
| Term note payable—foreign(b) |
57,768 | 52,830 | ||||||
| Other debt |
1,053 | 2,233 | ||||||
| Total notes payable |
328,421 | 325,413 | ||||||
| Securitization facility(c) |
154,000 | 144,000 | ||||||
| Total notes payable, credit agreements and securitization facility |
$ 482,421 | $ 469,413 | ||||||
| Current portion |
$ 165,134 | $ 155,617 | ||||||
| Long-term portion |
317,287 | 313,796 | ||||||
| Total notes payable, credit agreements and securitization facility |
$ 482,421 | $ 469,413 | ||||||
| (a) | The Company entered into a $130 million term loan and a $30 million revolving line of credit on June 2, 2005. On April 30, 2007, the Company amended and restated the facility increasing the term loan to $250 million, increasing the revolving line of credit facility to $50 million and entering into a $50 million delayed draw term loan facility. In April 2008, the Company borrowed the additional $50 million from the delayed draw term loan facility. The revolving line of credit facility is comprised of a $30 million US tranche and a $20 million global tranche and is collateralized by the assets and operations of the respective country where the borrowings are incurred. At March 31, 2011, the Company had no borrowings on the revolving line of credit facility. Interest on the term loan is payable at a rate per annum equal to the sum of the Base Rate plus 1.25% or the Eurodollar Rate plus 2.25%. Interest on the line of credit ranges from the sum of the Base Rate plus 1.00% to 1.50% or the Eurodollar Rate plus 2.00% to 2.50%. The term loan is payable in quarterly installments of 0.25% of the initial aggregate principal amount of the loans and is due on the last business day of each March, June, September, and December with the final principal payment due in April 2013. Principal payments of $0.8 million were made on the term loan during the three month period ended March 31, 2011. We refer to this facility as the 2005 Credit Facility. |
| (b) | On December 7, 2006, one of the Company’s foreign subsidiaries entered into foreign term loans in the Czech Republic denominated in Czech Koruna. The Facility A term loan was for $47 million and the Facility B term loan was for $33 million. Interest on the Facility A term loan is payable at a rate per annum equal to the sum of PRIBOR (Prague Interbank Offered Rate) plus 1.75% to 0.95% (2.13% at March 31, 2011). Interest on the Facility B term loan is payable at a rate per annum equal to the sum of PRIBOR plus 2.9% to 2% (2.98% at March 31, 2011). The Facility A term loan is payable in semiannual payments in June and December of each year beginning in June 2007 and ending in December 2013. The Facility B term loan is payable in a lump sum in December 2014. The outstanding balance of the note payable increased $4.9 million in the first quarter of 2011 due to the change in translation in the exchange rate. The term loans have financial covenants, one of which requires the Company to maintain cash and cash equivalents to satisfy a specific liquidity ratio. We refer to this facility as the CCS Credit Facility. |
| (c) | The Company is party to a receivables purchase agreement (securitization facility) that was amended and restated for the fourth time as of October 29, 2007 and which has been amended four times since then to add or remove purchasers and to extend the facility termination date. The current purchase limit under the securitization facility is $500 million and the facility termination date is February 23, 2012. Interest on the |
12
Table of Contents
| securitization facility is payable at a rate per annum equal to 0.90% as of March 31, 2011. The unused facility fee is payable at a rate of 0.50% per annum as of March 31, 2011. The securitization facility provides for certain termination events, upon the occurrence of which the administrator may declare the facility termination date to have occurred, may exercise certain enforcement rights with respect to the receivables, and may appoint a successor servicer, among other things. Termination events include nonpayment, noncompliance with covenants, default under any indebtedness in excess of $10.0 million, the failure to maintain certain ratios related to defaults, delinquencies and dilution, change in control, failure to maintain a leverage ratio of not greater than 2.25 to 1 through December 31, 2010 and 2.00 to 1 for the periods thereafter (measured quarterly), failure to maintain an interest coverage ratio of not less than 4.00 to 1 (measured quarterly) and failure to perform under a performance guaranty. |
The Company was in compliance with all financial covenants at March 31, 2011.
In November 2007, the Company entered into an interest rate swap agreement with a notional value of $175 million which matured in November 2010. The agreement converted a portion of the Company’s variable rate debt exposure to a fixed rate.
7. Income Taxes
The provision for income taxes differs from amounts computed by applying the U.S. federal tax rate of 35% to income before income taxes for the three months ended March 31, 2011 and 2010 due to the following (in thousands):
| 2011 | 2010 | |||||||||||||||
| Computed “expected” tax expense |
$16,505 | 35.0% | $14,627 | 35.0 | % | |||||||||||
| Changes resulting from: |
||||||||||||||||
| Foreign income tax differential |
(1,905) | (4.0) | (1,389) | (3.3 | ) | |||||||||||
| State taxes net of federal benefits |
788 | 1.7 | 917 | 2.2 | ||||||||||||
| Foreign-sourced nontaxable income |
(764) | (1.6) | (1,046) | (2.5 | ) | |||||||||||
| Other |
199 | 0.4 | 1,338 | 3.2 | ||||||||||||
| Provision for income taxes |
$14,823 | 31.5% | $14,447 | 34.6 | % | |||||||||||
As of March 31, 2011 and December 31, 2010, notes payable and other obligations—noncurrent, included liabilities for unrecognized income tax benefits of $4.0 million and $3.9 million, respectively. During the three months ended March 31, 2011 and 2010 the Company recognized additional liabilities of $0.1 million and $0.2 million, respectively. During the three months ended March 31, 2011 and 2010, amounts recorded for accrued interest and penalty expense related to the unrecognized income tax benefits was not significant.
The Company files numerous consolidated and separate income tax returns in the U.S. federal jurisdiction and various state and foreign jurisdictions. The statute of limitations for the Company’s U.S. federal income tax returns has expired for years prior to 2007.
8. Earnings Per Share
The Company reports a dual presentation of basic and diluted earnings per share. Basic earnings per share is computed by dividing net income attributable to shareholders of the Company by the weighted average number of common shares outstanding during the reported period. Diluted earnings per share reflect the potential dilution related to equity-based incentives using the if-converted and treasury stock methods, where applicable.
The calculation and reconciliation of basic and diluted earnings per share for the three months ended March 31 (in thousands, except per share data):
13
Table of Contents
| 2011 | 2010 | |||||||
| Numerator for basic earnings per share: |
||||||||
| Net income |
$ | 32,335 | $ | 27,345 | ||||
| Convertible preferred stock accrued dividends |
— | (4,420) | ||||||
| Earnings attributable to common shareholders for basic earnings per share |
$ | 32,335 | $ | 22,925 | ||||
| Numerator for diluted earnings per share: |
||||||||
| Income attributable to common shareholders for basic earnings per share |
$ | 32,335 | $ | 22,925 | ||||
| Effect of convertible preferred stock |
— | 4,420 | ||||||
| Net earnings for diluted earnings per share |
$ | 32,335 | $ | 27,345 | ||||
| Denominator for basic and diluted earnings per share: |
||||||||
| Weighted-average shares outstanding |
78,575 | 32,329 | ||||||
| Share-based payment awards classified as participating securities |
1,362 | 1,682 | ||||||
| Denominator for basic earnings per share |
79,937 | 34,011 | ||||||
| Dilutive securities |
3,441 | 2,903 | ||||||
| Convertible preferred stock |
— | 43,575 | ||||||
| Denominator for diluted earnings per share |
83,378 | 80,489 | ||||||
| Basic earnings per share |
$ | 0.40 | $ | 0.67 | ||||
| Diluted earnings per share |
0.39 | 0.34 | ||||||
9. Segments
The Company’s reportable segments represent components of the business for which separate financial information is evaluated regularly by the chief operating decision maker in determining how to allocate resources and in assessing performance. The Company operates in two reportable segments, North America and International. The Company has identified these segments due to commonality of the products in each of their business lines having similar economic characteristics, services, customers and processes. There were no significant inter-segment sales.
The Company’s segment results are as follows as of and for the three month periods ended March 31 (in thousands):
| 2011 | 2010 | |||||||
| Revenues, net: |
||||||||
| North America |
$ 71,585 | $ 68,591 | ||||||
| International |
39,420 | 35,611 | ||||||
| $111,005 | $ 104,202 | |||||||
| Operating income: |
||||||||
| North America |
$ 31,192 | $ 30,913 | ||||||
| International |
19,295 | 16,187 | ||||||
| $ 50,487 | $ 47,100 | |||||||
| Depreciation and amortization: |
||||||||
| North America |
$ 4,942 | $ 4,750 | ||||||
| International |
3,665 | 3,304 | ||||||
| $ 8,607 | $ 8,054 | |||||||
| Capital expenditures: |
||||||||
| North America |
$ 1,485 | $ 1,494 | ||||||
| International |
1,109 | 650 | ||||||
| $ 2,594 | $ 2,144 | |||||||
14
Table of Contents
10. Commitments and Contingencies
In the ordinary course of business, the Company is involved in various pending or threatened legal actions. The Company has recorded reserves for certain legal proceedings. The amounts recorded are estimated and as additional information becomes available, the Company will reassess the potential liability related to its pending litigation and revise its estimate in the period that information becomes known. In the opinion of management, the amount of ultimate liability, if any, with respect to these actions will not have a material adverse effect on the Company’s consolidated financial position, results of operations, or liquidity.
15
Table of Contents
Item 2. Management’s Discussion and Analysis of Financial Condition and Results of Operations
The following discussion and analysis of our financial condition and results of operations should be read in conjunction with the unaudited consolidated financial statements and related notes appearing elsewhere in this report. In addition to historical information, this discussion contains forward-looking statements that involve risks, uncertainties and assumptions that could cause actual results to differ materially from management’s expectations. Factors that could cause such differences include, but are not limited to, those identified below and those described in Part I, Item 1A “Risk Factors” appearing in our Annual Report on Form 10-K. All foreign currency amounts that have been converted into U.S. dollars in this discussion are based on the exchange rate as reported by Oanda for the applicable periods.
This management’s discussion and analysis should also be read in conjunction with the management’s discussion and analysis and consolidated financial statements included in our Annual Report on Form 10-K for the year ended December 31, 2010.
Overview
FleetCor is a leading independent global provider of specialized payment products and services to businesses, commercial fleets, major oil companies, petroleum marketers and government entities in 18 countries in North America, Europe, Africa and Asia. Our payment programs enable our customers to better manage and control employee spending and provide card-accepting merchants with a high volume customer base that can increase their sales and customer loyalty. We believe that our size and scale, geographic reach, advanced technology and our expansive suite of products, services, brands and proprietary networks contribute to our leading industry position.
We provide our payment products and services in a variety of combinations to create customized payment solutions for our customers and partners. We sell these products and services directly and indirectly through partners with whom we have strategic relationships, such as major oil companies and petroleum marketers. We refer to these major oil companies and petroleum marketers as our “partners.” We provide our customers with various card products that typically function like a charge card to purchase fuel, lodging and related products and services at participating locations. Our payment programs enable businesses to better manage and control employee spending and provide card-accepting merchants with a high volume customer base that can increase their sales and customer loyalty.
In order to deliver our payment programs and services and process transactions, we own and operate six proprietary “closed-loop” networks through which we electronically connect to merchants and capture, analyze and report customized information. We also use third-party networks to deliver our payment programs and services in order to broaden our card acceptance and use. To support our payment products, we also provide a range of services, such as issuing and processing, as well as specialized information services that provide our customers with value-added functionality and data. Our customers can use this data to track important business productivity metrics, combat fraud and employee misuse, streamline expense administration and lower overall fleet operating costs.
Our segments, sources of revenue and expenses
Segments
We operate in two reportable segments, which we refer to as our North American and International segments. Our revenue is reported net of the wholesale cost for underlying products and services. In this report, we refer to this net revenue as “revenue.” For the quarters ended March 31, 2011 and 2010, our North American and International segments generated the following revenue:
16
Table of Contents
| Quarter ended March 31, | ||||||||||||||||
| 2011 | 2010 | |||||||||||||||
| (dollars in millions) | Revenue | % of total revenue |
Revenue | % of total revenue |
||||||||||||
| North America |
$ 71.6 | 64.5% | $ 68.6 | 65.8% | ||||||||||||
| International |
39.4 | 35.5% | 35.6 | 34.2% | ||||||||||||
| $111.0 | 100.0% | $104.2 | 100.0% | |||||||||||||
Sources of Revenue
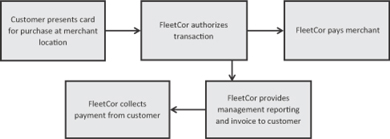
Transactions In both of our segments, we derive revenue from transactions and the related revenue per transaction. As illustrated in the diagram below, a transaction is defined as a purchase by a customer. Our customers include holders of our card products and those of our partners, for whom we manage card programs. Revenue from transactions is derived from our merchant and network relationships, as well as our customers and partners. Through our merchant and network relationships we primarily offer fuel, vehicle maintenance or lodging services to our customers. We also earn revenue from our customers and partners through program fees and charges. The following diagram illustrates a typical transaction flow.
Illustrative Transaction Flow
From our merchant and network relationships, we derive revenue from the difference between the price charged to a customer for a transaction and the price paid to the merchant or network for the same transaction. As illustrated in the table below, the price paid to a merchant or network may be calculated as (i) the merchant’s wholesale cost of fuel plus a markup; (ii) the transaction purchase price less a percentage discount; or (iii) the transaction purchase price less a fixed fee per unit. The difference between the price we pay to a merchant and the merchant’s wholesale cost for the underlying products and services is considered a “merchant commission” and is recognized as an expense. Approximately 44.5% of our revenue was derived from our merchant and network relationships during the first quarters of 2011 and 2010, respectively.
Illustrative Revenue Model for Fuel Purchases
(unit of one gallon)
|
Illustrative Revenue Model |
Merchant Payment Methods
|
|||||||||||||||||||||||||||
| Retail Price |
$ | 3.00 | i) Cost Plus Mark-up: | ii) Percentage Discount: | iii) Fixed Fee: | |||||||||||||||||||||||
| Wholesale Cost |
(2.86 | ) | Wholesale Cost | $ | 2.86 | Retail Price | $ | 3.00 | Retail Price | $ | 3.00 | |||||||||||||||||
| Mark-up | 0.05 | Discount (3%) | (0.09 | ) | Fixed Fee | (0.09 | ) | |||||||||||||||||||||
| FleetCor Revenue |
$ | 0.14 | ||||||||||||||||||||||||||
| Merchant Commission |
$ | (0.05 | ) | Price Paid to Merchant | $ | 2.91 | Price Paid to Merchant | $ | 2.91 | Price Paid to Merchant | $ | 2.91 | ||||||||||||||||
| Price Paid to Merchant |
$ | 2.91 | ||||||||||||||||||||||||||
17
Table of Contents
From our customers and partners, we derive revenue from a variety of program fees such as transaction fees, card fees, network fees and report fees. Our payment programs include other fees and charges associated with late payments and based on customer credit risk. Approximately 55.5% of our revenue was derived from customer and partner program fees and charges during the first quarters of 2011 and 2010, respectively.
Transaction volume and revenue per transaction Set forth below is revenue per transaction information for the quarters ended March 31, 2011 and 2010:
| Quarter ended March 31, | ||||||||||||
| 2011 | 2010 | |||||||||||
| Transactions (in millions) |
||||||||||||
| North America |
36.2 | 34.9 | ||||||||||
| International1 |
11.3 | 10.7 | ||||||||||
| Total transactions1 |
47.5 | 45.6 | ||||||||||
| Revenue per transaction |
||||||||||||
| North America |
$ 1.98 | $ 1.96 | ||||||||||
| International1 |
3.49 | 3.29 | ||||||||||
| Consolidated revenue per transaction1 |
2.34 | 2.28 | ||||||||||
| 1Calculation of revenue per transaction for our International segment and on a consolidated basis for the quarter ended March 31, 2010 excludes the impact of a non-renewed partner contract in Europe, inherited from an acquisition, which we chose not to renew. This non-renewed contract contributed approximately 1.6 million transactions and $0.3 million in revenues, net to our International segment in the quarter ended March 31, 2010. This contract had a high number of transactions and very little revenue and had a $0.40 negative impact on our International segment revenue per transaction in the quarter ended March 31, 2010. We believe that excluding the impact of this contract is a more effective measure for evaluating the Company’s revenue performance of its continuing business. Revenues, net, excluding the impact of a non-renewed partner contract in Europe, for our International segment and on a consolidated basis are supplemental non-GAAP financial measures of performance. See the heading entitled “Management’s Use of Non-GAAP Financial Measures.” |
|
|||||||||||
For the quarters ended March 31, 2010 and 2011, total transactions increased from 45.6 million to 47.5 million, excluding the impact of a non-renewed partner contract in Europe, an increase of 1.9 million, or 4.2%. We experienced an increase in transactions in our North American and International segments, excluding the impact of a non-renewed partner contract in Europe, primarily due to organic growth in certain of our payment programs. The non-renewed partner had a high number of transactions and very little revenue.
Revenue per transaction is derived from the various revenue types as discussed above and can vary based on geography, the relevant merchant relationship, the payment product utilized and the types of products or services purchased, the mix of which would be influenced by our acquisitions, organic growth in our business, and fluctuations in foreign currency exchange rates. Revenue per transaction per customer increases as the level of services we provide to a customer increases.
Our consolidated revenue per transaction increased from $2.28 for the quarter ended March 31, 2010 to $2.34 for the quarter ended March 31, 2011, excluding the impact of a non-renewed partner contract in Europe, an increase of $0.06 per transaction or 2.6%. During the quarter ended March 31, 2011, our consolidated revenue per transaction was impacted by:
| • | organic growth in certain of our payment programs; |
| • | higher average retail fuel prices as compared to the same period in 2010, which was mostly offset by a compression of the margin between the wholesale cost and retail price of fuel; and |
| • | the weakening of the U.S. dollar during the quarter ended March 31, 2011 relative to other foreign currencies, which resulted in favorable foreign exchange rates as compared to the quarter ended March 31, 2010, which increased our revenue per transaction during the quarter ended March 31, 2011. |
18
Table of Contents
Revenue per transaction in the International segment runs higher than the North America segment primarily due to higher margins and higher fuel prices in our international product lines.
North American segment revenue per transaction increased from $1.96 for the quarter ended March 31, 2010 to $1.98 for the quarter ended March 31, 2011, an increase of $0.02 per transaction or 1.0%. During the quarter ended March 31, 2011, our North American segment revenue per transaction was impacted by:
| • | organic growth in certain of our payment programs; and |
| • | higher average retail fuel prices as compared to the same period in 2010, which was mostly offset by a compression of the margin between the wholesale cost and retail price of fuel. |
International segment revenue per transaction increased from $3.29 for the quarter ended March 31, 2010 to $3.49 for the quarter ended March 31, 2011, an increase of $0.20 per transaction or 6.1%, excluding the impact of a non-renewed partner contract in Europe. During the quarter ended March 31, 2011, our International segment revenue per transaction was impacted by:
| • | organic growth in certain of our payment programs; |
| • | higher average retail fuel prices as compared to the same period in 2010, which was mostly offset by a compression of the margin between the wholesale cost and retail price of fuel; and |
| • | the weakening of the U.S. dollar during the quarter ended March 31, 2011 relative to other foreign currencies, which resulted in favorable foreign exchange rates as compared to the quarter ended March 31, 2010, which increased our revenue per transaction during the quarter ended March 31, 2011. |
Factors and trends impacting our business
We believe that the following factors and trends are important in understanding our financial performance:
| • | Fuel prices – Our fleet customers use our products and services primarily in connection with the purchase of fuel. Accordingly, our revenue is affected by fuel prices, which are subject to significant volatility. A change in retail fuel prices could cause a decrease or increase in our revenue from several sources, including fees paid to us based on a percentage of each customer’s total purchase. We believe that in the first quarter of 2011 and 2010, approximately 22.0% and 17.1% of our consolidated revenue was directly influenced by the absolute price of fuel, respectively. Changes in the absolute price of fuel may also impact unpaid account balances and the late fees and charges based on these amounts. |
| • | Fuel-price spread volatility – A portion of our revenue involves transactions where we derive revenue from fuel-price spreads, which is the difference between the price charged to a fleet customer for a transaction and the price paid to the merchant for the same transaction. In these transactions, the price paid to the merchant is based on the wholesale cost of fuel. The merchant’s wholesale cost of fuel is dependent on several factors including, among others, the factors described above affecting fuel prices. The fuel price that we charge to our customer is dependent on several factors including, among others, the fuel price paid to the merchant, posted retail fuel prices and competitive fuel prices. We experience fuel-price spread contraction when the merchant’s wholesale cost of fuel increases at a faster rate than the fuel price we charge to our customers, or the fuel price we charge to our customers decreases at a faster rate than the merchant’s wholesale cost of fuel. Approximately 16.4% and 20.5% of our consolidated revenue during the first quarter of 2011 and 2010, respectively, was derived from transactions where our revenue is tied to fuel-price spreads. |
| • | Acquisitions – Since 2002, we have completed over 40 acquisitions of companies and commercial account portfolios. Acquisitions have been an important part of our growth strategy, and it is our intention to continue to seek opportunities to increase our customer base and diversify our service offering through further strategic acquisitions. The impact of acquisitions has, and may continue to have, a significant impact on our results of operations and may make it difficult to compare our results between periods. |
| • | Interest rates – Our results of operations are affected by interest rates. We are exposed to market risk changes in interest rates on our cash investments and debt. |
| • | Global economic environment – Our results of operations are materially affected by conditions in the economy generally, both in North America and internationally. Factors affected by the economy include our transaction |
19
Table of Contents
| volumes and the credit risk of our customers. These factors affected our businesses in both our North American and International segments. |
| • | Foreign currency changes – Our results of operations are impacted by changes in foreign currency rates; namely, by movements of the British pound, the Czech koruna, the Russian ruble, the Canadian dollar and the Euro relative to the U.S. dollar. Approximately 64.3% and 65.6% of our revenue during the first quarter of 2011 and 2010, respectively, was derived in U.S. dollars and was not affected by foreign currency exchange rates. |
| • | Expenses – In connection with being a public company and complying with the Sarbanes-Oxley Act of 2002, we expect our general and administrative expense to increase and then remain relatively constant or increase slightly as a percentage of revenue. Over the long term, we expect that our general and administrative expense will decrease as a percentage of revenue as our revenue increases. To support our expected revenue growth, we plan to continue to incur additional sales and marketing expense by investing in our direct marketing, third-party agents, internet marketing, telemarketing and field sales force. |
Accounts receivable securitization
We utilize an accounts receivable securitization facility in the ordinary course of our business to finance a portion of our accounts receivable. Our off-balance sheet activity utilizes a qualified special-purpose entity, or QSPE, in the form of a limited liability company. The QSPE raises funds by issuing debt to third-party investors. The QSPE holds trade accounts receivable whose cash flows are the primary source of repayment for the liabilities of the QSPE. Investors only have recourse to the assets held by the QSPE. Our involvement in these arrangements takes the form of originating accounts receivable and providing servicing activities. Accounts receivable that we sell under the securitization facility are reported in our consolidated financial statements in accordance with relevant authoritative literature. Trade accounts receivable sold under this program are excluded from accounts receivable in our consolidated financial statements.
In June 2009, the Financial Accounting Standards Board, or FASB, issued authoritative guidance limiting the circumstances in which a financial asset may be derecognized when the transferor has not transferred the entire financial asset or has continuing involvement with the transferred asset. The concept of a QSPE entity, which had previously facilitated sale accounting for certain asset transfers, is removed by this standard. This guidance was effective for us as of January 1, 2010. As a result of the adoption of such guidance, effective January 1, 2010, we consolidated the QSPE and the securitization of accounts receivable related to the QSPE is accounted for as a secured borrowing rather than as a sale. Accordingly, we record accounts receivable and short-term debt related to the securitization facilities as assets and liabilities on our balance sheet. In addition, our statements of income no longer include securitization activities in revenue. Rather, we report provision for bad debts and interest expense associated with the debt securities issued by the QSPE.
As a result of the implementation of this guidance effective January 1, 2010, we recorded a $218.0 million increase in accounts receivable and a $218.0 million increase in current liabilities.
Results of Operations
Quarter ended March 31, 2011 compared to the quarter ended March 31, 2010
The following table sets forth selected consolidated statement of operations data for the quarters ended March 31, 2011 and 2010 (in thousands).
| Quarter ended | Quarter ended | |||||||||||||||||||||||
| March 31, |
% of total revenue |
March 31, |
% of total revenue |
Increase (decrease) |
% Change | |||||||||||||||||||
| Revenues, net: |
||||||||||||||||||||||||
| North America |
$71,585 | 64.5% | $68,591 | 65.8% | $ 2,994 | 4.4% | ||||||||||||||||||
| International |
39,420 | 35.5% | 35,611 | 34.2% | 3,809 | 10.7% | ||||||||||||||||||
| Total revenues, net |
111,005 | 100.0% | 104,202 | 100.0% | 6,803 | 6.5% | ||||||||||||||||||
| Consolidated operating expenses: |
||||||||||||||||||||||||
| Merchant commissions |
8,277 | 7.5% | 11,589 | 11.1% | (3,312 | ) | (28.6)% | |||||||||||||||||
| Processing |
17,932 | 16.2% | 17,521 | 16.8% | 411 | 2.3% | ||||||||||||||||||
| Selling |
7,787 | 7.0% | 6,849 | 6.6% | 938 | 13.7% | ||||||||||||||||||
| General and administrative |
17,915 | 16.1% | 13,089 | 12.6% | 4,826 | 36.9% | ||||||||||||||||||
20
Table of Contents
| Quarter ended March 31, 2011 |
% of total revenue |
Quarter ended March 31, 2010 |
% of total revenue |
Increase (decrease) |
% Change | |||||||||||||||||||
| Depreciation and amortization |
8,607 | 7.8% | 8,054 | 7.7% | 553 | 6.9% | ||||||||||||||||||
|
Operating income |
50,487 | 45.5% | 47,100 | 45.2% | 3,387 | 7.2% | ||||||||||||||||||
|
Other income, net |
(34 | ) | 0.0% | 44 | 0.0% | 78 | 177.3% | |||||||||||||||||
| Interest expense, net |
3,363 | 3.0% | 5,264 | 5.1% | (1,901 | ) | (36.11)% | |||||||||||||||||
| Provision for income taxes |
14,823 | 13.4% | 14,447 | 13.9% | 376 | 2.6% | ||||||||||||||||||
|
Net income |
$32,335 | 29.1% | $27,345 | 26.2% | $4,990 | 18.2% | ||||||||||||||||||
|
Operating income for segments: |
||||||||||||||||||||||||
| North America |
$31,192 | 43.6% | $30,913 | 45.1% | $ 279 | 0.9% | ||||||||||||||||||
| International |
19,295 | 48.9% | 16,187 | 45.5% | 3,108 | 19.2% | ||||||||||||||||||
|
Operating income |
$ 50,487 | 45.5% | $47,100 | 45.2% | $3,387 | 7.2% | ||||||||||||||||||
|
Operating margin for segments |
||||||||||||||||||||||||
| North America |
43.6% | 45.1% | (1.5)% | |||||||||||||||||||||
| International |
48.9% | 45.5% | 3.4% | |||||||||||||||||||||
Revenue
Our consolidated revenue increased from $104.2 million in the quarter ended March 31, 2010 to $111.0 million in the quarter ended March 31, 2011, an increase of $6.8 million, or 6.5%. During the first quarter of 2011, our consolidated revenue was impacted by:
| • | organic growth in certain of our payment programs of approximately $4.1 million or 3.9%, |
| • | higher average retail fuel prices as compared to the same period in 2010, which was mostly offset by a compression of the margin between the wholesale cost and retail price of fuel, resulting in a net increase in consolidated revenue of approximately $1.0 million; and |
| • | the weakening of the U.S. dollar during the quarter ended March 31, 2011, relative to other foreign currencies, which resulted in favorable foreign exchange rates as compared to the quarter ended March 31, 2010, which increased our revenue in the quarter ended March 31, 2011 by $1.3 million or 1.2%. |
North American segment revenue
North American revenue increased from $68.6 million in the quarter ended March 31, 2010 to $71.6 million in the quarter ended March 31, 2011, an increase of $3.0 million, or 4.4%. During the first quarter of 2011, our North American segment revenue was impacted by:
| • | organic growth in of our certain payment programs of approximately $3.1 million or 4.5%; and |
| • | higher average retail fuel prices as compared to the same period in 2010, which was mostly offset by a compression of the margin between the wholesale cost and retail price of fuel, resulting in a negligible impact to North American segment revenue. |
International segment revenue
International segment revenue increased from $35.6 million in the quarter ended March 31, 2010 to $39.4 million in the quarter ended March 31, 2011, an increase of $3.8 million, or 10.7%. During the first quarter of 2011, our International segment revenue was impacted by:
| • | organic growth in of our certain payment programs of approximately $1.1 million or 3.1%; |
| • | higher average retail fuel prices as compared to the same period in 2010, which was mostly offset by a compression of the margin between the wholesale cost and retail price of fuel, resulting in a net increase in International segment revenue of approximately $1.0 million; and |
21
Table of Contents
| • | the weakening of the U.S. dollar during the quarter ended March 31, 2011, relative to other foreign currencies, which resulted in favorable foreign exchange rates as compared to the quarter ended March 31, 2010, which increased our revenue in the quarter ended March 31, 2011 by $1.3 million or 3.7%. |
Consolidated operating expenses
Merchant commission Merchant commissions decreased from $11.6 million in the quarter ended March 31, 2010 to $8.3 million in the quarter ended March 31, 2011, a decrease of $3.3 million, or 28.6%. This decrease was due primarily to the compression of the margin between the wholesale cost and retail price of fuel, which impacted merchant commissions, as well as lower volume in those revenue streams where merchant commission are paid.
Processing Processing expenses increased from $17.5 million in the quarter ended March 31, 2010 to $17.9 million in the quarter ended March 31, 2011, an increase of $0.4 million, or 2.3%. During the quarter ended March 31, 2011, our processing expenses increased by $1.5 million due to volume increases and a conversion project in certain of our payment programs and $0.2 million due to the unfavorable impact of foreign exchange rates. These increases were partially offset by a decrease of $1.5 million for bad debt due to a lower percentage of uncollectible accounts.
Selling Selling expenses increased from $6.8 million in the quarter ended March 31, 2010 to $7.8 million in the quarter ended March 31, 2011, an increase of $0.9 million, or 13.7%. The increase was due primarily to additional sales and marketing expense intended to increase sales production.
General and administrative General and administrative expense increased from $13.1 million in the quarter ended March 31, 2010 to $17.9 million in the quarter ended March 31, 2011, an increase of $4.8 million, or 36.9%. The increase was primarily due to additional stock compensation expense related to our option plans and public company costs during the period.
Depreciation and amortization Depreciation and amortization increased from $8.1 million in the quarter ended March 31, 2010 to $8.6 million in the quarter ended March 31, 2011, an increase of $0.6 million, or 6.9%. The increase was primarily attributable to acquisitions completed during the fourth quarter of 2010, which resulted in an increase of $0.4 million related to the amortization of intangible assets for customer and vendor relationships, trade names and trademarks, non-compete agreements and software, as well as acquired fixed assets.
Operating income and operating margin
Consolidated operating income
Operating income increased from $47.1 million in the quarter ended March 31, 2010 to $50.5 million in the quarter ended March 31, 2011, an increase of $3.4 million, or 7.2%. Our operating margin was 45.2% and 45.5% for the quarter ended March 31, 2010 and 2011, respectively. The increase in operating income and margin from the quarter ended March 31, 2010 to the quarter ended March 31, 2011 was due primarily to a favorable impact of foreign exchange rates in 2011 compared to 2010, lower bad debt expense and an increase in revenue per transaction in our existing businesses.
For the purpose of segment operations, we calculate segment operating income by subtracting segment operating expenses from segment revenue. Similarly, segment operating margin is calculated by dividing segment operating income by segment revenue.
North American segment operating income
North American operating income increased from $30.9 million in the quarter ended March 31, 2010 to $31.2 million in the quarter ended March 31, 2011, an increase of $0.3 million, or 0.9%. North American operating margin was 45.1% and 43.6% for the quarter ended March 31, 2010 and 2011, respectively. The increase in operating income from the quarter ended March 31, 2010 to the quarter ended March 31, 2011 was due primarily to organic growth in transaction volumes. This increase in operating income was partially offset by the increase in expenses due to additional stock compensation expense related to our option plans and public company costs during the quarter ended March 31, 2011 compared to the quarter ended March 31, 2010, which had a negative impact on operating margin.
International segment operating income
International operating income increased from $16.2 million in the quarter ended March 31, 2010 to $19.3 million in the quarter ended March 31, 2011, an increase of $3.1 million, or 19.2%. International operating margin was 45.5% and 48.9% for the quarter ended March 31, 2010 and 2011, respectively. The increase in operating income and
22
Table of Contents
margin from the quarter ended March 31, 2010 to the quarter ended March 31, 2011 was due primarily to the impact of foreign exchange rates and organic growth in our revenue per transaction during the quarter ended March 31, 2011.
Other income, net
Other income increased from a loss of $0.04 million in the quarter ended March 31, 2010 to a gain of $0.03 million in the quarter ended March 31, 2011, an increase of $0.08 million. The increase was due primarily to foreign currency exchange gains recognized during the quarter ended March 31, 2011.
Interest expense, net
Interest expense, net reflects the amount of interest paid on our 2005 Credit Facility and CCS Credit Facility, offset by interest income. Interest expense decreased from $5.3 million in the quarter ended March 31, 2010 to $3.4 million in the quarter ended March 31, 2011, a decrease of $1.9 million, or 36.1%. This decrease was substantially due to the expiration of an interest rate swap agreement, which matured in November 2010 that created interest expense of $1.8 million in the quarter ended March 31, 2010. The remaining decrease is due to the decline in interest rates on our credit facilities. The average interest rate (including the effect of interest rate derivatives) on the 2005 Credit Facility was 2.41% in the quarter ended March 31, 2011 versus 5.60% in the quarter ended March 31, 2010. The average interest rate on the CCS Credit Facility was 2.46% in the quarter ended March 31, 2011 versus 3.01% in the quarter ended March 31, 2010.
Provision for income taxes
The provision for income taxes increased from $14.4 million in the quarter ended March 31, 2010 to $14.8 million in the quarter ended March 31, 2011, an increase of $0.4 million, or 2.6%. We provide for income taxes during interim periods based on an estimate of our effective tax rate for the year. Discrete items and changes in the estimate of the annual tax rate are recorded in the period they occur. Our effective tax rate for the quarter ended March 31, 2011 was 31.4 % as compared to 34.6% for the quarter ended March 31, 2010. The decrease in the effective tax rate for income taxes between March 31, 2011 and 2010 was primarily due to an unfavorable impact on the prior year rate from the controlled foreign corporation look-through exclusion, which expired on December 31, 2009, and was not extended until December 2010. For periods in which the look-through rules were effective, it generally resulted in excluding from U.S. federal income tax certain dividends, interest, rents and royalties received or accrued by one controlled foreign corporation (“CFC”) of a U.S. multinational enterprise from a related CFC.
We pay taxes in many different taxing jurisdictions, including the U.S., most U.S. states and many non-U.S. jurisdictions. The tax rates in non-U.S. taxing jurisdictions are lower than the U.S. tax rate. Consequently, as our earnings fluctuate between taxing jurisdictions our effective tax rate fluctuates.
Net income
For the reasons discussed above, our net income increased from $27.3 million in the first quarter of 2010 to $32.3 million in the first quarter of 2011, an increase of $5.0 million, or 18.2%.
Liquidity and capital resources
Our principal liquidity requirements are to service and repay our indebtedness, make acquisitions of businesses and commercial account portfolios and meet working capital, tax and capital expenditure needs.
Sources of liquidity
At March 31, 2011, our unrestricted cash and cash equivalent balance totaled $119.8 million. Our restricted cash balance at March 31, 2011 totaled $66.3 million. Restricted cash represents customer deposits in the Czech Republic, which we are restricted from using other than to repay customer deposits.
We utilize an accounts receivable securitization facility to finance a majority of our domestic fuel card receivables, to lower our cost of funds and more efficiently use capital. We generate and record accounts receivable when a customer makes a purchase from a merchant using one of our card products and generally pay merchants within seven days of receiving the merchant billing. As a result, we utilize the asset securitization facility as a source of liquidity to provide the cash flow required to fund merchant payments prior to collecting customer balances. These balances are primarily composed of charge balances, which are typically billed to the customer on a weekly, semimonthly or monthly basis, and are generally required to be paid within 30 days of billing. We also consider the
23
Table of Contents
undrawn amounts under our securitization facility and 2005 Credit Facility as funds available for working capital purposes and acquisitions. At March 31, 2011, we had the ability to generate approximately $157.0 million of additional liquidity under our securitization facility and $50.0 million available under the 2005 Credit Facility.
Based on our current forecasts and anticipated market conditions, we believe that our current cash balances, our available borrowing capacity and our ability to generate cash from operations, will be sufficient to fund our liquidity needs for at least the next twelve months, absent any major acquisition opportunities that might arise. However, we regularly evaluate our cash requirements for current operations, commitments, capital requirements and acquisitions, and we may elect to raise additional funds for these purposes in the future, either through the issuance of debt or equity securities. We may not be able to obtain additional financing on terms favorable to us, if at all.
Cash flows
The following table summarizes our cash flows for the quarters ended March 31, 2011 and 2010.
| (in millions) | Quarter ended March 31, | |||||||
| 2011 | 2010 | |||||||
| Net cash (used in) provided by operating activities |
$ | (8.8) | $ | 42.8 | ||||
| Net cash used in investing activities |
(2.6) | (2.1 | ) | |||||
| Net cash provided by (used in) financing activities |
9.0 | (35.4 | ) | |||||
Operating activities. Net cash used in operating activities for the quarter ended March 31, 2011 was $8.8 million compared to net cash provided by operating activities of $42.8 million for the quarter ended March 31, 2010. The decrease is attributable primarily to a decrease in working capital, driven mainly by an increase in restricted cash of $6.6 million related to the change in foreign currency exchange rates and an increase in the change in accounts receivable of approximately $84.3 million. The decrease was partially offset by higher net income of $5.0 million and an increase in accounts payable, accrued expenses, and customer deposits of $29.7 million primarily from the increased volume of purchases in the quarter ended March 31, 2011 compared to the volume of purchases in the quarter ended March 31, 2010 and the timing of vendor payments.
Investing activities. Net cash used in investing activities for the quarter ended March 31, 2011 was $2.6 million compared to $2.1 million for the quarter ended March 31, 2010. The increase is attributable to the increase in capital spending in the quarter ended March 31, 2011 compared to the same period in 2010.
Financing activities. Net cash provided by financing activities for the quarter ended March 31, 2011 was $9.0 million compared to net cash used in financing activities of $35.4 million for the quarter ended March 31, 2010. The increase is attributable primarily to payments on the securitization facility of $22.0 million in the quarter ended March 31, 2010 compared to borrowings on the securitization facility of $10.0 million in the quarter ended March 31, 2011, resulting in additional cash provided by financing activities of $32.0 million. In addition, during the quarter ended March 31, 2010 we made aggregate principal payments on the 2005 Credit Facility and the CCS Credit Facility of $12.6 million compared to aggregate principal payments of $0.8 million, as well as seller financing payments of $0.9 million, in the quarter ended March 31, 2011, resulting in additional cash provided by financing activities of $10.9 million.
Capital spending summary
Our capital expenditures were $2.6 million for the quarter ended March 31, 2011 compared to $2.1 million for quarter ended March 31, 2010. We anticipate our capital expenditures to increase to approximately $10.0 million for 2011 as compared to 2010, as we continue to enhance our existing processing systems.
2005 Credit Facility
We are a party to a credit agreement, dated as of June 29, 2005, which has been subsequently amended and restated on April 30, 2007, with a syndicate of banks. The 2005 Credit Facility provides for term loans in the amount of $250.0 million and two tranches of multicurrency revolving loans, each of which revolving loans may be made in U.S. dollars, British pounds or Euros; a U.S. tranche for the U.S. borrower of up to $30.0 million (with a $10.0 million sub-limit for letters of credit), and a global tranche for both the U.S. borrower and U.K. borrower of up to $20.0 million. The 2005 Credit Facility also includes a $10.0 million swing line facility which is available to the U.S. borrower. The credit agreement also provides for delayed draw term loans in the amount of up to $50.0 million, of which $50.0 million was borrowed in April 2008. The 2005 Credit Facility further provides for incremental term
24
Table of Contents
loans in an aggregate amount not to exceed $100.0 million. None of the incremental term loans have been made. As of March 31, 2011, we had $269.6 million in outstanding term loans and no borrowings on the revolving line under the 2005 Credit Facility.
Interest on the facilities may accrue, at our election, based on a base rate, EURIBOR or LIBOR, plus a margin. The margin with respect to term loans is fixed at 2.25% for LIBOR and EURIBOR loans and at 1.25% for base rate loans. With respect to revolving loans and letter of credit fees, the margin or fee is determined based on our leverage ratio and ranges from 2.00% to 2.50% for LIBOR and EURIBOR loans and from 1.00% to 1.50% for base rate loans. As of March 31, 2011 our term loans bore interest at LIBOR plus 2.25% and we had no U.S. revolving loans or multicurrency loans outstanding. Interest on overdue amounts accrues at a rate equal to the applicable interest rate plus 2% per annum.
The stated maturity date for our term loans is April 30, 2013 and the stated maturity date for our revolving loans and letters of credit is April 30, 2012. The term loans are payable in quarterly installments of 0.25% of the initial aggregate principal amount of the loans and are due on the last business day of each March, June, September, and December with the final principal payment due in April 2013. Principal payments of $0.8 million were made on the term loan during the three months ended March 31, 2011.
We have received commitments for an additional tranche of revolving loans in the amount of up to $85 million to be made under the terms of the 2005 Credit Facility. The additional revolving loans will be available only in U.S. dollars, and the commitments for the additional revolving loans will not be held pro rata with the commitments held by existing lenders for the revolving loans and term loans. The additional revolving loan commitments will have a maturity date of October 31, 2012. The maturity date of the existing commitments for revolving loans is April 30, 2012, and the lenders providing such commitments will be asked to extend the maturity date to October 31, 2012. The revolving commitments held by any lender not agreeing to the extension of the maturity date will remain April 30, 2012. In all other respects, we expect that the additional revolving loan commitments will be subject to the terms and conditions applicable to revolving loans made under the existing commitments for the U.S. tranche. The conditions for the additional revolving loan commitments include, among other things, the execution of definitive documentation on or before October 1, 2011.
In addition, J.P. Morgan Securities LLC has agreed to arrange an amendment to the 2005 Credit Facility to permit the additional revolving loans described above, to remove the mandatory prepayment requirement with respect to excess cash flow and certain equity issuances, to extend the maturity date on revolving loans with respect to consenting lenders to October 31, 2012, and to increase the interest rate margins for term loans. We expect that the proposed amendment will also include certain other covenant amendments, subject to the requisite consents of the other lenders. The conditions for the proposed amendments include, among other things, the execution of definitive documentation on or before October 1, 2011. A customary consent fee will be payable by us to consenting lenders, together with certain other amendment fees and expenses.
The 2005 Credit Facility contains certain negative covenants and financial covenants. As of March 31, 2011, we were in compliance with each of the covenants under the 2005 Credit Facility.
CCS Credit Facility
Certain of our subsidiaries are parties to a credit agreement, dated as of December 7, 2006, which was amended as of March 28, 2008, with a syndicate of banks. The CCS Credit Facility agreement provides for term loans in the total amount of CZK 1.675 billion ($80.3 million), which consists of a “Facility A” amortized term loan in the amount of CZK 990 million ($47.5 million) and a “Facility B” bullet term loan in the amount of CZK 685.0 million ($32.8 million). The unpaid principal balance of the term loans as of March 31, 2011 is approximately CZK 387.4 million ($22.3 million) for “Facility A” and approximately CZK 616.2 million ($35.5 million) for “Facility B”. The outstanding balance of CCS term notes payable increased by an aggregate of $4.9 million as of March 31, 2011 due to changes in the value of the Czech koruna versus the U.S. dollar.
Interest on the term loans may accrue, calculated according to the term selected by CCS, based on a base rate, PRIBOR (Prague Interbank Offered Rate), plus a margin and a mandatory cost. The margin is determined based on CCS’s leverage ratio and ranges from 0.95% to 1.75% for the “Facility A” term loan and from 2.00% to 2.90% for the “Facility B” term loan. As of March 31, 2011, the interest rate on “Facility A” equaled 2.13% and the interest rate on “Facility B” was 2.98%.
25
Table of Contents
The stated maturity date for CCS’s term loans is December 21, 2013 with respect to “Facility A” and December 21, 2014 with respect to “Facility B”. The “Facility A” term loan is payable in semiannual payments in June and December of each year and the “Facility B” term loan is payable in one lump sum on December 21, 2013. There were no principal payments made on these facilities during the three months ended March 31, 2011. CCS has the right to prepay the loans without premium or penalty on the last day of an interest period.
The CCS Credit Facility contains certain negative covenants and financial covenants. As of March 31, 2011, CCS was in compliance with each of the covenants under the CCS Credit Facility agreement.
Seller financing
One of our subsidiaries, FleetCor Luxembourg Holding2 S.à r.l. (“Lux 2”), entered into a Share Sale and Purchase Agreement dated April 24, 2008 (the “Purchase Agreement”) with ICP Internet Cash Payments B.V. for the purchase of ICP International Card Products B.V. The acquired business is now being operated in the Netherlands as FleetCor Technologieën B.V. In connection with the purchase Lux 2 agreed to make deferred payments in the aggregate amount of €1.0 million ($1.5 million), of which one remaining payments is due and payable on June 6, 2011 in the amount of €0.33 million ($0.46 million). The obligation to make such deferred payments is described in the Purchase Agreement, as modified by letter agreement dated August 11, 2008, and is not evidenced by a promissory note.
In connection with an acquisition by FleetCor Luxembourg Holding4 S.à r.l. in October 2010, the parties agreed to defer our payment of a portion of the purchase price, equal to approximately $1.1 million, which was paid in February 2011.
Securitization facility
We are a party to a receivables purchase agreement among FleetCor Funding LLC, as seller, PNC Bank, National Association as administrator, and the various purchaser agents, conduit purchasers and related committed purchasers parties thereto, which was amended and restated for the fourth time as of October 29, 2007 and which has been amended four times since then to add or remove purchasers and to extend the facility termination date, among other things. We refer to this arrangement as the securitization facility in this report. The current purchase limit under the securitization facility is $500.0 million. The facility was amended on February 24, 2011 and the facility termination date is now February 23, 2012.
Under a related purchase and sale agreement, dated as of December 20, 2004, and most recently amended on July 7, 2008, between FleetCor Funding LLC, as purchaser, and certain of our subsidiaries, as originators, the receivables generated by the originators are deemed to be sold to FleetCor Funding LLC immediately and without further action upon creation of such receivables. At the request of FleetCor Funding LLC, as seller, undivided percentage ownership interests in the receivables are ratably purchased by the purchasers in amounts not to exceed their respective commitments under the facility. Collections on receivables are required to be made pursuant to a written credit and collection policy and may be reinvested in other receivables, may be held in trust for the purchasers, or may be distributed. Fees are paid to each purchaser agent for the benefit of the purchasers and liquidity providers in the related purchaser group in accordance with the securitization facility and certain fee letter agreements.
The securitization facility provides for certain termination events, upon the occurrence of which the administrator may declare the facility termination date to have occurred, may exercise certain enforcement rights with respect to the receivables, and may appoint a successor servicer, among other things. Termination events include noncompliance with covenants, including financial covenants. As of March 31, 2011, we were in compliance with each of the covenants under our securitization facility.
Critical accounting policies and estimates
In applying the accounting policies that we use to prepare our consolidated financial statements, we necessarily make accounting estimates that affect our reported amounts of assets, liabilities, revenue and expenses. Some of these estimates require us to make assumptions about matters that are highly uncertain at the time we make the accounting estimates. We base these assumptions and the resulting estimates on historical information and other
26
Table of Contents
factors that we believe to be reasonable under the circumstances, and we evaluate these assumptions and estimates on an ongoing basis. In many instances, however, we reasonably could have used different accounting estimates and, in other instances, changes in our accounting estimates could occur from period to period, with the result in each case being a material change in the financial statement presentation of our financial condition or results of operations. We refer to estimates of this type as critical accounting estimates.
Accounting estimates necessarily require subjective determinations about future events and conditions. During the three months ended March 31, 2011, we have not adopted any new critical accounting policies that had a significant impact upon our consolidated financial statements, have not changed any critical accounting policies and have not changed the application of any critical accounting policies from the year ended December 31, 2010. You should read the Critical Accounting Estimates in Item 7 – Management’s Discussion and Analysis of Financial Condition and Results of Operations included in our Annual Report on Form 10-K for the year ended December 31, 2010 and our summary of significant accounting policies in Note 1 of our notes to the unaudited consolidated financial statements in this Form 10-Q.
Management’s Use of Non-GAAP Financial Measures
We have included in the discussion under the caption “Transaction volume and revenue per transaction” above a financial measure that was not prepared in accordance with GAAP. Any analysis of non-GAAP financial measures should be used only in conjunction with results presented in accordance with GAAP. Below, we define the non-GAAP financial measure, provide a reconciliation of the non-GAAP financial measure to the most directly comparable financial measure calculated in accordance with GAAP, and discuss the reasons that we believe this information is useful to management and may be useful to investors.
Revenues, net, excluding the impact of a non-renewed partner contract
We have defined the non-GAAP measure revenues, net, excluding the impact of a non-renewed contract, as revenues, net as reflected in our income statement and segment footnote less the revenues, net provided by the non-renewed partner in the three months ended March 31, 2010.
Our management uses revenues, net, excluding the impact of a non-renewed contract, along with other factors, to evaluate our financial performance. We believe that revenues, net, excluding the impact of a non-renewed contract is an appropriate supplemental measure of financial performance and may be useful to investors because it provides a more complete understanding of our revenue performance of continuing business. Revenues, net, excluding the impact of a non-renewed contract is not intended to be a substitute for GAAP financial measures and should not be used as such.
Set forth below is a reconciliation of revenues, net, excluding the impact of a non-renewed contract to the most directly comparable GAAP measure, Revenues, net (in thousands):
| Quarter Ended March 31, | ||||||||
| 2011 | 2010 | |||||||
| North America |
||||||||
| Revenues, net |
$ | 71,585 | $ | 68,591 | ||||
| Excluding non-renewed contract revenues |
- | - | ||||||
| Revenues, net, excluding the impact of a non-renewed contract |
$ | 71,585 | $ | 68,591 | ||||
| International |
||||||||
| Revenues, net |
$ | 39,420 | $ | 35,611 | ||||
| Excluding non-renewed contract revenues |
- | (314) | ||||||
| Revenues, net, excluding the impact of a non-renewed contract |
$ | 39,420 | $ | 35,297 | ||||
| Consolidated |
||||||||
| Revenues, net |
$ | 111,005 | $ | 104,202 | ||||
| Excluding non-renewed contract revenues |
- | (314) | ||||||
| Revenues, net, excluding the impact of a non-renewed contract |
$ | 111,005 | $ | 103,888 | ||||
27
Table of Contents
Special Cautionary Notice Regarding Forward-Looking Statements
This report contains statements that express our opinions, expectations, beliefs, plans, objectives, assumptions or projections regarding future events or future results, in contrast with statements that reflect historical facts. In some cases, we have identified such forward-looking statements with typical conditional words such as “anticipate,” “intend,” “believe,” “estimate,” “plan,” “seek,” “project” or “expect,” “may,” “will,” “would,” “could” or “should,” the negative of these terms or other comparable terminology.
These forward-looking statements are not a guarantee of performance, and you should not place undue reliance on such statements. We have based these forward-looking statements largely on our current expectations and projections about future events. Forward-looking statements are subject to many uncertainties and other variable circumstances, including those discussed in our Annual Report on Form 10-K in Item 1A, “Risk factors,” and in this report in Item 2, “Management’s Discussion and Analysis of Financial Condition and Results of Operations,” many of which are outside of our control, that could cause our actual results and experience to differ materially from any forward-looking statement. Given these risks and uncertainties, you are cautioned not to place undue reliance on these forward-looking statements. The forward-looking statements included in this report are made only as of the date hereof. We do not undertake, and specifically decline, any obligation to update any such statements or to publicly announce the results of any revisions to any of such statements to reflect future events or developments.
Item 3. Quantitative and Qualitative Disclosures About Market Risk
As of March 31, 2011, there have been no material changes to our market risk from that disclosed in our Annual Report on Form 10-K for the year ended December 31, 2010.
Item 4. Controls and Procedures
Under the supervision and with the participation of our management, including the Chief Executive Officer and Chief Financial Officer, we have evaluated the effectiveness of our disclosure controls and procedures as required by Exchange Act Rule 13a-15(e) as of the end of the period covered by this report. Based on that evaluation, the Chief Executive Officer and Chief Financial Officer have concluded that these disclosure controls and procedures are effective.
There were no changes in our internal control over financial reporting during the quarter ended March 31, 2011 that have materially affected, or are reasonably likely to materially affect, our internal control over financial reporting.
28
Table of Contents
As of the date of this filing, we are not involved in any legal proceedings or governmental inquiries or investigations that we consider to be material and were not involved in any material legal proceedings that were terminated during the first quarter of 2011. We are and may become, however, subject to lawsuits from time to time in the ordinary course of our business. We are currently involved in an investigation by the Office of Fair Trading in the United Kingdom, relating to our Keyfuels product line. This product line consists of our proprietary payment card and associated site network in the United Kingdom. A competitor alleged we are dominant in a relevant market with our Keyfuels product line. The Office of Fair Trading is investigating whether we are dominant and, if dominant, whether some of our contracts with some sites and dealers would constitute exclusive dealings requiring them to be reformed to eliminate exclusivity. The Office of Fair Trading has issued a statement of objections, which we are responding to. Although we do not currently anticipate an adverse result or material adverse impact from the investigation, if determined adversely, the regulator has authority to require us to reform contracts to eliminate exclusivity and impose significant fines.
In addition to the other information set forth in this report, you should carefully consider the factors discussed in Part I, Item 1A. “Risk Factors” in our Annual Report on Form 10-K for the year ended December 31, 2010, which could materially affect our business, financial condition or future results.
Item 2. Unregistered Sales of Equity Securities and Use of Proceeds
Items 2(a) and 2(b) are not applicable.
(c) The following table presents information with respect to the Company’s purchases of common stock made during the three months ended March 31, 2011:
| Period |
Total Number of Shares Purchased (1) |
Average Price Paid Per Share |
Total Number of Shares Purchased as Part of Publicly Announced Plans or Programs |
Maximum Dollar Amount of Shares That May Yet Be Purchased Under the Publicly Announced Plans or Programs |
||||||||||||
| January 1 - January 31, 2011 |
- | $ | - | - | $ | - | ||||||||||
| February 1 - February 28, 2011 |
14,529 | $ | 30.51 | - | $ | - | ||||||||||
| March 1 - March 31, 2011 |
- | $ | - | - | $ | - | ||||||||||
| 14,529 | $ | 30.51 | - | |||||||||||||
(1) Represents shares withheld for tax obligations upon the vesting of employee stock awards.
Item 3. Defaults Upon Senior Securities
Not applicable.
Item 4. (Removed and Reserved)
Not applicable.
29
Table of Contents
| Exhibit no. |
||
| 3.1 | Amended and Restated Certificate of Incorporation of FleetCor Technologies, Inc. (incorporated by reference to Exhibit 3.1 to the Registrant’s Annual Report on Form 10-K, File No. 001-35004, filed with the Securities and Exchange Commission (the “SEC”) on March 25, 2011) | |
| 3.2 | Amended and Restated Bylaws of FleetCor Technologies, Inc. (incorporated by reference to Exhibit 3.2 to the Registrant’s Annual Report on Form 10-K, File No. 001-35004, filed with the SEC on March 25, 2011) | |
| 4.1 | Form of Stock Certificate for Common Stock (incorporated by reference to Exhibit 4.1 to Amendment No. 3 to the Registrant’s Registration Statement on Form S-1, File No. 333-166092, filed with the SEC on June 29, 2010) | |
| 10.1 | Fourth Amendment to the Fourth Amended and Restated Receivables Purchase Agreement, dated February 24, 2011, among FleetCor Funding LLC, FleetCor Technologies Operating Company, LLC, the various purchaser agents, conduit purchasers and related committed purchasers listed on the signature pages thereto, and PNC Bank, National Association, as administrator, (incorporated by reference to Exhibit 10.1 to the Registrant’s Current Report on form 8-K, filed on March 1, 2011). | |
| 10.2 | Second Amendment to Performance Guaranty, dated February 24, 2011, among FleetCor Technologies, Inc., FleetCor Technologies Operating Company, LLC, PNC Bank, National Association, and Credit Agricole Corporate and Investment Bank (incorporated by reference to Exhibit 10.2 to the Registrant’s Current Report on form 8-K, filed on March 1, 2011). | |
| 31.1 | Certification of Chief Executive Officer pursuant to Rule 13a-14(a) and rule 15d-14(a) of the Securities Exchange Act, as amended | |
| 31.2 | Certification of Chief Financial Officer pursuant to Rule 13a-14(a) and rule 15d-14(a) of the Securities Exchange Act, as amended | |
| 32.1 | Certification of Chief Executive Officer pursuant to 18 U.S.C. 1350, as adopted pursuant to Section 906 of the Sarbanes-Oxley Act of 2001 | |
| 32.2 | Certification of Chief Financial Officer pursuant to 18 U.S.C. 1350, as adopted pursuant to Section 906 of the Sarbanes-Oxley Act of 2001 | |
30
Table of Contents
Pursuant to the requirements of the Securities Exchange Act of 1934, the Registrant has duly caused this report to be signed on its behalf by the undersigned; thereunto duly authorized, in their capacities indicated on May 16, 2011.
| FleetCor Technologies, Inc. (Registrant) |
| Signature |
Title | |
| /s/ Ronald F. Clarke |
President, Chief Executive Officer and Chairman of the Board of Directors | |
| Ronald F. Clarke | (Duly Authorized Officer and Principal Executive Officer) | |
| /s/ Eric R. Dey |
Chief Financial Officer | |
| Eric R. Dey | (Principal Financial Officer and Principal Accounting Officer) | |
31