Attached files
| file | filename |
|---|---|
| EX-10.1 - EXHIBIT 10.1 - PROSPER MARKETPLACE, INC | exhibit10d13d31d2011.htm |
| EX-10.2 - EXHIBIT 10.2 - PROSPER MARKETPLACE, INC | exhibit10d23d31d2011.htm |
| EX-32.1 - EXHIBIT 32.1 - PROSPER MARKETPLACE, INC | exhibit32d13d31d2011.htm |
| EX-31.1 - EXHIBIT 31.1 - PROSPER MARKETPLACE, INC | exhibit31d13d31d2011.htm |
| EX-31.2 - EXHIBIT 31.2 - PROSPER MARKETPLACE, INC | exhibit31d23d31d2011.htm |
UNITED STATES
SECURITIES AND EXCHANGE COMMISSION
Washington, D.C. 20549
FORM 10-Q/A
Amendment No. 1
(Mark One)
|
þ
|
QUARTERLY REPORT PURSUANT TO SECTION 13 OR 15(d) OF THE SECURITIES EXCHANGE ACT OF 1934
|
For the quarterly period ended March 31, 2011
or
|
o
|
TRANSITION REPORT PURSUANT TO SECTION 13 OR 15(d) OF THE SECURITIES EXCHANGE ACT OF 1934
|
For the transition period from to
Commission File Number: 333-147019
PROSPER MARKETPLACE, INC.
(Exact name of registrant as specified in its charter)
|
Delaware
|
6199
|
73-1733867
|
||
|
(State or other jurisdiction of
|
(Primary Standard Industrial
|
(I.R.S. Employer
|
||
|
incorporation or organization)
|
Classification Code Number
|
Identification Number)
|
111 Sutter Street, 22nd Floor
San Francisco, CA 94104
(415) 593-5400
(Address, including zip code, and telephone number, including area code, of registrant’s principal executive offices)
Indicate by check mark whether the registrant: (1) has filed all reports required to be filed by Section 13 or 15(d) of the Securities Exchange Act of 1934 during the preceding 12 months (or for such shorter period that the registrant was required to file such reports), and (2) has been subject to such
filing requirements for the past 90 days. Yes þ No o
Indicate by check mark whether the registrant has submitted electronically and posted on its corporate Web site, if any, every Interactive Data File required to be submitted and posted pursuant to Rule 405 of Regulation S-T during the preceding 12 months (or for such shorter period that the registrant
was required to submit and post such files). Yes o No o
Indicate by check mark whether the registrant is a large accelerated filer, an accelerated filer, a non-accelerated filer, or a smaller reporting company. See definitions of “large accelerated filer,” “accelerated filer,” and “smaller reporting company” in Rule 12b-2 of the Exchange Act. (Check one):
|
Large accelerated filer o
|
Accelerated filer o
|
|
Non-accelerated filer o(Do not check if a smaller reporting company)
|
Smaller reporting company þ
|
Indicate by check mark whether the registrant is a shell company (as defined in Rule 12b-2 of the Exchange Act). Yes o No þ
As of April 28, 2011, there were 4,588,832 shares of the registrant’s common stock outstanding.
TABLE OF CONTENTS
|
Page No.
|
|
|
i
|
|
|
1
|
|
|
2
|
|
|
3
|
|
|
4
|
|
|
5
|
|
|
23
|
|
|
42
|
|
|
42
|
|
|
43
|
|
|
43
|
|
|
50
|
|
|
50
|
|
| Item 4. Removed and Reserved | 50 |
|
50
|
|
|
50
|
|
|
52
|
|
|
53
|
|
EXPLANATORY PARAGRAPH
On May 11, 2011, Prosper Marketplace, Inc. (“we”, “us”, “our” or the “Company”) inadvertently filed a draft version of our Quarterly Report on Form 10-Q for the quarter ended March 31, 2011 (the “Draft 10-Q”). We are filing this amended quarterly report on Form 10-Q (the "Form 10-Q/A") to replace the Draft 10-Q. Investors should not rely on any information included in the Draft 10-Q, which is superseded in its entirety by this Form 10-Q/A.
FORWARD-LOOKING STATEMENTS
This Quarterly Report on Form 10-Q includes forward-looking statements within the meaning of Section 27A of the Securities Exchange Act of 1933 and Section 21E of the Securities Exchange Act of 1934. Forward-looking statements include all statements that do not relate solely to historical or current facts, and can generally be identified by the use of words such as “may,” “believe,” “will,” “expect,” “project,” “estimate,” “intend,” “anticipate,” “plan,” “continue” or similar expressions. In particular, information appearing under “Management’s Discussion and Analysis of Financial Condition and Results of Operations” includes forward-looking statements. Forward-looking statements inherently involve many risks and uncertainties that could cause actual results to differ materially from those projected in these statements.
Where, in any forward-looking statement, we express an expectation or belief as to future results or events, such expectation or belief is based on the current plans and expectations of our management and expressed in good faith and believed to have a reasonable basis, but there can be no assurance that the expectation or belief will result or be achieved or accomplished. More information on factors that could cause actual results or events to differ materially from those anticipated is included from time to time in our reports filed with the Securities and Exchange Commission (the “SEC”), including our Annual Report on Form 10-K for the year ended December 31, 2010, particularly under the caption “Risk Factors.”
All forward-looking statements speak only as of the date of this Quarterly Report on Form 10-Q and are expressly qualified in their entirety by the cautionary statements included in this Quarterly Report on Form 10-Q or our Annual Report on Form 10-K for the year ended December 31, 2010, particularly under the caption “Risk Factors.” We undertake no obligation to update or revise forward-looking statements that may be made to reflect events or circumstances that arise after the date made or to reflect the occurrence of unanticipated events, other than as required by law.
WHERE YOU CAN FIND MORE INFORMATION
We file annual, quarterly and current reports and other information with the SEC. You can inspect, read and copy these reports and other information at the SEC’s Public Reference Room at 100 F Street, N.E., Washington, D.C. 20549. You can obtain information regarding the operation of the SEC’s Public Reference Room by calling the SEC at 1-800-SEC-0330. The SEC also maintains a website at www.sec.gov that makes available reports, proxy statements and other information regarding issuers that file electronically.
PART I. Financial Information
Item 1. Financial Statements
|
Prosper Marketplace, Inc.
|
||||||||
|
Balance Sheets
|
||||||||
|
March 31,
|
December 31,
|
|||||||
|
2011
|
2010
|
|||||||
|
(Unaudited)
|
(Note 2)
|
|||||||
|
ASSETS
|
||||||||
|
Cash and cash equivalents
|
$ | 3,226,438 | $ | 4,284,228 | ||||
|
Restricted cash
|
2,977,743 | 2,566,631 | ||||||
|
Servicing rights
|
967 | 2,986 | ||||||
|
Receivables
|
22,205 | 6,306 | ||||||
|
Borrower Loans Receivable at fair value
|
30,359,534 | 23,689,950 | ||||||
|
Property and equipment, net
|
739,291 | 765,210 | ||||||
|
Prepaid and other assets
|
129,964 | 174,805 | ||||||
|
Intangible assets, net
|
20,123 | 50,306 | ||||||
|
Total assets
|
$ | 37,476,265 | $ | 31,540,422 | ||||
|
LIABILITIES AND STOCKHOLDERS' EQUITY
|
||||||||
|
Accounts payable
|
$ | 669,138 | $ | 554,347 | ||||
|
Accrued liabilities
|
1,518,447 | 1,219,239 | ||||||
|
Borrower Payment Dependent Notes at fair value
|
30,026,687 | 23,478,046 | ||||||
|
Repurchase obligation
|
13,001 | 71,001 | ||||||
|
Notes payable
|
294,297 | 288,594 | ||||||
|
Total liabilities
|
32,521,570 | 25,611,227 | ||||||
|
Commitments and contingencies (see Note 12)
|
||||||||
|
Stockholders' Equity
|
||||||||
|
Convertible preferred stock – Series A ($0.001 par value; 4,023,999 shares authorized, issued and outstanding as of March 31, 2011 and December 31, 2010)
|
4,024 | 4,024 | ||||||
|
Convertible preferred stock – Series B ($0.001 par value; 3,310,382 shares authorized, issued and outstanding as of March 31, 2011 and December 31, 2010)
|
3,310 | 3,310 | ||||||
|
Convertible preferred stock – Series C ($0.001 par value; 2,063,558 shares authorized, issued and outstanding as of March 31, 2011 and December 31, 2010)
|
2,064 | 2,064 | ||||||
|
Convertible preferred stock – Series D ($0.001 par value; 20,543,819 shares authorized; 20,340,705 issued and outstanding as of March 31, 2011 and December 31, 2010)
|
20,341 | 20,341 | ||||||
|
Convertible preferred stock – Series D-1 ($0.001 par value; 3,110,188 shares authorized, issued and outstanding as of March 31, 2011 and December 31, 2010)
|
3,110 | 3,110 | ||||||
|
Common stock ($0.001 par value; 43,860,321 shares authorized; 4,498,667 shares and 4,478,667 shares issued and outstanding as of March 31, 2011 and December 31, 2010, respectively)
|
4,485 | 4,480 | ||||||
|
Additional paid-in capital
|
56,745,700 | 56,659,849 | ||||||
|
Accumulated deficit
|
(51,828,339 | ) | (50,767,983 | ) | ||||
|
Total stockholders' equity
|
4,954,695 | 5,929,195 | ||||||
|
Total liabilities and stockholders' equity
|
$ | 37,476,265 | $ | 31,540,422 | ||||
|
The accompanying notes are an integral part of these financial statements.
|
||||||||
|
Prosper Marketplace, Inc.
|
||||||||
|
Statements of Operations
|
||||||||
|
(Unaudited)
|
||||||||
|
Three Months Ended March 31,
|
||||||||
|
2011
|
2010
|
|||||||
|
Revenues
|
||||||||
|
Origination fees
|
$ | 393,302 | $ | 148,605 | ||||
|
Loan servicing fees
|
12,019 | 65,085 | ||||||
|
Interest income on Borrower Loans and Payment Dependent Notes, net
|
80,274 | 25,874 | ||||||
|
Rebates and promotions
|
(166,404 | ) | (1,668 | ) | ||||
| 319,191 | 237,896 | |||||||
|
Cost of revenues
|
||||||||
|
Cost of services
|
(302,823 | ) | (182,391 | ) | ||||
|
Reversal of (Provision for) loan and Note repurchases
|
60,669 | (8,033 | ) | |||||
|
Net revenues
|
77,037 | 47,472 | ||||||
|
Operating expenses
|
||||||||
|
Compensation and benefits
|
1,558,209 | 1,174,825 | ||||||
|
Marketing and advertising
|
517,995 | 287,048 | ||||||
|
Depreciation and amortization
|
123,264 | 129,731 | ||||||
|
General and administrative
|
||||||||
|
Professional services
|
596,960 | 724,209 | ||||||
|
Facilities and maintenance
|
150,198 | 163,856 | ||||||
|
Other
|
227,694 | 315,327 | ||||||
|
Total expenses
|
3,174,320 | 2,794,996 | ||||||
|
Loss before other income
|
(3,097,283 | ) | (2,747,524 | ) | ||||
|
Other income
|
||||||||
|
Interest income
|
1,034 | 469 | ||||||
|
Change in fair value on Borrower Loans and Payment Dependent Notes, net
|
284,692 | 90,709 | ||||||
|
Insurance recoveries
|
1,728,273 | - | ||||||
|
Other income
|
22,929 | 13,626 | ||||||
|
Total other income, net
|
2,036,928 | 104,804 | ||||||
|
Loss before income taxes
|
(1,060,355 | ) | (2,642,720 | ) | ||||
|
Provision for income taxes
|
- | - | ||||||
|
Net loss
|
$ | (1,060,355 | ) | $ | (2,642,720 | ) | ||
|
Net loss per share – basic and diluted
|
$ | (0.24 | ) | $ | (0.59 | ) | ||
|
Weighted average shares - basic and diluted net loss per share
|
4,497,556 | 4,460,667 | ||||||
|
The accompanying notes are an integral part of these financial statements.
|
||||||||
|
Prosper Marketplace, Inc.
|
||||||||||||||||||||||||||||
|
Statements of Stockholders' Equity (Deficit)
|
||||||||||||||||||||||||||||
|
Preferred Stock
|
Common Stock
|
Additional Paid-In
|
Accumulated
|
|||||||||||||||||||||||||
|
Shares
|
Amount
|
Shares
|
Amount
|
Capital
|
Deficit
|
Total
|
||||||||||||||||||||||
|
Balance as of January 1, 2010 (Audited)
|
9,397,939 | $ | 9,398 | 4,460,667 | $ | 4,462 | $ | 41,406,457 | $ | (40,625,261 | ) | $ | 795,056 | |||||||||||||||
|
Exercise of stock options
|
- | |||||||||||||||||||||||||||
|
Issuance of common stock warrants
|
96,625 | 96,625 | ||||||||||||||||||||||||||
|
Compensation expense
|
59,222 | 59,222 | ||||||||||||||||||||||||||
|
Net loss
|
(2,642,720 | ) | (2,642,720 | ) | ||||||||||||||||||||||||
|
Balance as of March 31, 2010 (Unaudited)
|
9,397,939 | $ | 9,398 | 4,460,667 | $ | 4,462 | $ | 41,562,304 | $ | (43,267,981 | ) | $ | (1,691,817 | ) | ||||||||||||||
|
Balance as of January 1, 2011 (Audited)
|
32,848,832 | $ | 32,849 | 4,478,667 | $ | 4,480 | $ | 56,659,849 | $ | (50,767,983 | ) | $ | 5,929,195 | |||||||||||||||
|
Exercise of stock options
|
20,000 | 5 | 4,995 | 5,000 | ||||||||||||||||||||||||
|
Issuance of common stock warrants
|
8,958 | 8,958 | ||||||||||||||||||||||||||
|
Compensation expense
|
71,898 | 71,898 | ||||||||||||||||||||||||||
|
Net loss
|
(1,060,355 | ) | (1,060,355 | ) | ||||||||||||||||||||||||
|
Balance as of March 31, 2011 (Unaudited)
|
32,848,832 | $ | 32,849 | 4,498,667 | $ | 4,485 | $ | 56,745,700 | $ | (51,828,338 | ) | $ | 4,954,696 | |||||||||||||||
|
The accompanying notes are an integral part of these financial statements.
|
||||||||||||||||||||||||||||
|
Prosper Marketplace, Inc.
|
|||||||
|
Statements of Cash Flows
|
|||||||
|
(Unaudited)
|
|||||||
|
Three Months Ended March 31,
|
|||||||
|
2011
|
2010
|
||||||
|
Cash flows from operating activities:
|
|||||||
|
Net loss
|
$ | (1,060,355 | ) | $ | (2,642,720 | ) | |
|
Adjustments to reconcile net loss to net cash used in operating activities:
|
|||||||
|
Depreciation and amortization
|
123,264 | 129,731 | |||||
|
Change in fair value of Borrower Loans
|
295,451 | 634,691 | |||||
|
Change in fair value of Borrower Payment Dependent Notes
|
(580,143 | ) | (725,400 | ) | |||
|
Stock-based compensation expense
|
71,898 | 59,222 | |||||
|
Promotional and marketing expenses paid with warrants
|
8,958 | – | |||||
|
Provision for (Reversal of) loan and Note repurchases
|
(60,669 | ) | 8,033 | ||||
|
Change in fair value of servicing rights
|
2,019 | 7,114 | |||||
|
Amortization of discount on long-term debt
|
5,703 | 74,649 | |||||
|
Changes in operating assets and liabilities:
|
|||||||
|
Restricted cash
|
(411,112 | ) | 114,675 | ||||
|
Receivables
|
(15,899 | ) | 5,946 | ||||
|
Prepaid and other assets
|
44,841 | 42,330 | |||||
|
Accounts payable and accrued liabilities
|
413,999 | 241,187 | |||||
|
Loan and Note repurchases
|
2,669 | 1,967 | |||||
|
Net cash used in operating activities
|
(1,159,376 | ) | (2,048,575 | ) | |||
|
Cash flows from investing activities:
|
|||||||
|
Origination of Borrower Loans held at fair value
|
(11,471,874 | ) | (5,933,690 | ) | |||
|
Repayment of Borrower Loans held at fair value
|
4,506,839 | 1,337,679 | |||||
|
Purchases of property and equipment
|
(67,163 | ) | (144,162 | ) | |||
|
Net cash used in investing activities
|
(7,032,198 | ) | (4,740,173 | ) | |||
|
Cash flows from financing activities:
|
|||||||
|
Proceeds from issuance of Notes held at fair value
|
11,471,874 | 5,933,690 | |||||
|
Payment of Notes held at fair value
|
(4,343,090 | ) | (1,311,571 | ) | |||
|
Proceeds from the issuance of notes payable
|
– | 2,300,000 | |||||
|
Proceeds from issuance of common stock
|
5,000 | – | |||||
|
Net cash provided by financing activities
|
7,133,784 | 6,922,119 | |||||
|
Net increase (decrease) in cash and cash equivalents
|
(1,057,790 | ) | 133,371 | ||||
|
Cash and cash equivalents at beginning of the period
|
4,284,228 | 616,089 | |||||
|
Cash and cash equivalents at end of the period
|
$ | 3,226,438 | $ | 749,460 | |||
|
The accompanying notes are an integral part of these financial statements.
|
|||||||
PROSPER MARKETPLACE, INC.
Notes to Consolidated Financial Statements
(Unaudited)
1. Operations and Business
Prosper Marketplace, Inc. (“Prosper,” the “Company,” “we,” “us,” “our”) was incorporated in the state of Delaware on March 22, 2005. Prosper is an online marketplace for peer-to-peer lending. Prosper’s website provides an online marketplace for loans where people list and bid on loans with interest rates of return determined by Prosper. Lender members access our platform and “bid” the amount they are willing to commit to the purchase of a Note that is dependent for payment on the corresponding borrower loan, at interest rates set by Prosper. Loan terms are subject to minimum and maximum loan amounts determined by the borrower’s credit bureau score and Prosper score, at interest rates set by Prosper. Prosper facilitates the lending and borrowing activities and acts as an agent to the lender by maintaining its online marketplace. Prosper also handles all ongoing loan administration tasks, including loan servicing and collections on behalf of the lenders. Prosper generates revenue by collecting one-time fees from borrowers on funded loans and from loan servicing fees paid by lender members.
All loans requested and obtained by Prosper borrower members through our platform are unsecured obligations of individual borrower members with a fixed interest rate and a loan term set at one, three or five years as of March 31, 2011. All borrowers are funded by WebBank, an FDIC-insured, Utah-chartered industrial bank. After funding a loan, WebBank assigns the loan to Prosper, without recourse to WebBank, in exchange for the principal amount of the borrower loan. WebBank does not have any obligation to purchasers of the Notes.
On July 13, 2009, we implemented a new operating structure and began issuing Borrower Payment Dependent Notes (“Notes”). The post registration operating structure resulted in Prosper purchasing loans from WebBank, and holding the loans until maturity. Prosper issues new securities, the Notes, to the winning lenders. Prosper’s obligation to repay the Notes is conditioned upon the repayment of the associated borrower loan owned by Prosper. As a result of these changes, borrower loans and the Notes originated on or after July 13, 2009 are carried on Prosper’s balance sheet as assets and liabilities, respectively. Prosper has elected to carry the borrower loans and the Notes on its balance sheet at fair value.
As reflected in the accompanying financial statements, Prosper has incurred net losses and negative cash flows from operations since inception, and has an accumulated deficit of approximately $51.8 million as of March 31, 2011. For the three months ended March 31, 2011, the Company incurred a net loss of $1.1 million and the Company had negative cash flows from operations of $1.2 million. The Company does not believe that its cash resources are sufficient to sustain its operations through 2011 without obtaining additional financing. Since its inception, Prosper has financed its operations primarily through equity financing from various sources. The Company is dependent upon raising additional capital or debt financing to fund its current operating plan. Failure to obtain sufficient debt and equity financings and, ultimately, to achieve profitable operations and positive cash flows from operations could adversely affect Prosper’s ability to achieve its business objectives and continue as a going concern. Although, the Company does not currently have any agreements in place with respect to any such additional financing or strategic opportunity, management believes it will secure additional financing in the near future sufficient to meet its ongoing operations and strategic plan through 2011.
2. Summary of Significant Accounting Policies
Basis of Presentation
The Company’s unaudited interim financial statements have been prepared in accordance with U.S. generally accepted accounting principles (US GAAP) and disclosure requirements for interim financial information and the requirements of Rule 10-01 of Regulation S-X. Accordingly, they do not include all of the information and footnotes required by US GAAP for complete financial statements. The unaudited interim financial statements should be read in conjunction with the audited financial statements and notes included in our Annual Report on Form 10-K for the year ended December 31, 2010. The balance sheet at December 31, 2010 has been derived from the audited financial statements at that date. Management believes these unaudited interim financial statements reflect all adjustments, including those of a normal recurring nature, which are necessary for a fair presentation of the results for the interim periods presented. The results of operations for the interim periods are not necessarily indicative of the results that may be expected for the full year or any other interim period.
Use of Estimates
The preparation of financial statements in conformity with US GAAP requires management to make certain estimates, judgments and assumptions that affect the reported amounts of assets and liabilities and the related disclosures at the date of the financial statements and the reported amounts of revenues and expenses during the reporting periods. These estimates, judgments and assumptions include but are not limited to the following: valuation of borrower loans receivable and associated member payment dependent notes, valuation of servicing rights, valuation allowance on deferred tax assets, valuation and amortization periods of intangible assets, repurchase obligation, stock-based compensation expense, and contingent liabilities. Prosper bases its estimates on historical experience and on various other assumptions that Prosper believes to be reasonable under the circumstances. Actual results could differ from those estimates.
Certain Risks and Concentrations
In the normal course of its business, Prosper encounters two significant types of risk: credit and regulatory. Financial instruments that potentially subject Prosper to significant concentrations of credit risk consist primarily of cash, cash equivalents and restricted cash. The Company places cash, cash equivalents and restricted cash with high-quality financial institutions. Prosper is exposed to credit risk in the event of default by these institutions to the extent the amount recorded on the balance sheet exceeds FDIC insured amounts. Prosper performs periodic evaluations of the relative credit standing of these financial institutions and has not sustained any credit losses from instruments held at these financial institutions.
As previously described, beginning on July 13, 2009, loans originated by Prosper are carried on our balance sheet. The loans are funded by the Notes and repayment of the Notes is wholly dependent on the repayment of the loan associated with a Note. As a result, Prosper does not bear the risk associated with the repayment of principal on loans carried on its balance sheet. A decrease in the value of the loans carried on Prosper’s balance sheet associated with increased credit risk is directly offset by a reduction in the value of the Notes Prosper issued in association with the loan. However, Prosper charges a servicing fee that is deducted from loan payments. To the extent that loan payments are not made, Prosper’s servicing income will be reduced.
Prosper is subject to various regulatory requirements. The failure to appropriately identify and address these regulatory requirements could result in certain discretionary actions by regulators that could have a material effect on Prosper’s financial position and results of operations (See Note 12 — Commitments and Contingencies — Securities Law Compliance).
Cash and Cash Equivalents
Prosper invests its excess cash primarily in money market funds and in highly liquid debt instruments of U.S. municipalities, and the U.S. government and its agencies. All highly liquid investments with stated maturities of three months or less from date of purchase are classified as cash equivalents. Cash equivalents are recorded at cost, which approximates fair value. Such deposits periodically exceed amounts insured by the FDIC.
Restricted Cash
Restricted cash consists primarily of an irrevocable letter of credit held by a financial institution in connection with the Company’s office lease and cash deposits required to support the Company’s Automated Clearing House activities and secured corporate credit cards.
Servicing Rights
Prosper accounts for its servicing rights for loans originated prior to October 16, 2008 under the fair value measurement method of reporting in accordance with Financial Accounting Standards Board (FASB) Accounting Standards Codification (ASC) 860-50, Servicing Assets and Liabilities. Under the fair value method, Prosper measures its servicing rights at fair value at each reporting date and reports changes in fair value in earnings in the period in which the changes occur.
Prosper estimates the fair value of the servicing rights using a discounted cash flow model to project future expected cash flows based upon a set of valuation assumptions. Prosper believes market participants would use for similar rights. The primary assumptions Prosper uses to value its servicing rights include prepayment speeds, default rates, cost to service, profit margin, and discount rate. Prosper reviews these assumptions quarterly to ensure that they remain consistent with market conditions. Inaccurate assumptions in valuing servicing rights could affect Prosper’s results of operations.
Borrower Loans and Borrower Payment Dependent Notes
As of July 13, 2009, the Company implemented its new operating structure and began issuing Notes and purchasing loans from WebBank, and holding the loans until maturity. Prosper’s obligation to repay the Notes is conditioned upon the repayment of the associated borrower loan owned by Prosper. As a result of these changes, borrower loans and the Notes are carried on our balance sheet as assets and liabilities, respectively. In conjunction with our new operating structure, we adopted the provisions of ASC Topic 825, Financial Instruments. ASC Topic 825 permits companies to choose to measure certain financial instruments and certain other items at fair value on an instrument-by-instrument basis with unrealized gains and losses on items for which the fair value option has been elected reported in earnings. The fair value election, with respect to an item, may not be revoked once an election is made. In applying the provisions of ASC Topic 825, we recorded assets and liabilities measured using the fair value option in a way that separates these reported fair values from the carrying values of similar assets and liabilities measured with a different measurement attribute. We do not record a specific allowance account related to the borrower loans and Notes in which we have elected the fair value option, but rather estimate the fair value of the borrower loans and Notes using discounted cash flow methodologies adjusted for Prosper’s historical loss and recovery rates. We have reported the aggregate fair value of the borrower loans and Notes as separate line items in the assets and liabilities sections of the balance sheet using the methods described in ASC Topic 820, Fair Value Measurements and Disclosures– See Fair Value Measurement. We did not apply the provisions of ASC Topic 825 to loans issued prior to July 13, 2009.
Property and Equipment
Property and equipment consists of computer equipment, office furniture and equipment, and software purchased or developed for internal use. Property and equipment are stated at cost, less accumulated depreciation and amortization. Depreciation and amortization are computed using the straight-line method based on the estimated useful lives of the assets, which range from three to seven years. Prosper capitalizes expenditures for replacements and betterments and expenses amounts for maintenance and repairs as they are incurred. Depreciation and amortization commences once the asset is placed in service.
Internal Use Software and Website Development
Prosper accounts for internal use software costs, including website development costs, in accordance with ASC Topic 350-40, Internal Use Software and ASC Topic 350-50, Website Development Costs. In accordance with ASC Topic 350-40 and 350-50, the costs to develop software for Prosper’s website and other internal uses are capitalized when management has authorized and committed project funding, preliminary development efforts are successfully completed, and it is probable that the project will be completed and the software will be used as intended. Capitalized software development costs primarily include software licenses acquired, fees paid to outside consultants, and salaries for employees directly involved in the development efforts.
Costs incurred prior to meeting these criteria, together with costs incurred for training and maintenance, are expensed. Costs incurred for upgrades and enhancements that are considered to be probable to result in additional functionality are capitalized. Capitalized costs are included in Property and Equipment and amortized to expense using the straight-line method over their expected lives. The Company evaluates its software assets for impairment whenever events or changes in circumstances indicate that the carrying amount of such assets may not be recoverable. Recoverability of software assets to be held and used is measured by a comparison of the carrying amount of the asset to the future net undiscounted cash flows expected to be generated by the asset. If such software assets are considered to be impaired, the impairment to be recognized is the excess of the carrying amount over the fair value of the software asset.
Intangible Assets
Prosper records the purchase of intangible assets not purchased in a business combination in accordance with ASC Topic 350. Prosper has an intangible asset resulting from the purchase of the “Prosper.com” domain name. The intangible asset is amortized on a straight-line basis over five years.
Impairment of Long-Lived Assets Including Acquired Intangible Assets
In accordance with ASC Topic 360, Property Plant and Equipment, Prosper reviews property and equipment and intangible assets for impairment whenever events or changes in circumstances indicate that the carrying values of those assets may not be recoverable. Recoverability of assets to be held and used is measured by comparing the carrying value of the asset to future net undiscounted cash flows that the assets are expected to generate. If an asset is considered to be impaired, the impairment to be recognized equals the amount by which the asset’s carrying value exceeds its fair value. Fair value is estimated using discounted net cash flows.
Repurchase Obligation
Prosper is obligated to indemnify lenders and repurchase certain Notes sold to lenders in the event of Prosper’s violation of applicable federal, state, or local lending laws, or verifiable identify theft. The amount of the loan repurchase obligation is estimated based on historical experience. Prosper accrues a provision for the repurchase obligation when the loans are funded. Repurchased loans and Notes associated with federal, state, or local lending laws, or verifiable identity thefts are written off at the time of repurchase.
Revenue Recognition
Prosper recognizes revenue in accordance with ASC Topic 605, Revenue Recognition. Under ASC Topic 605, Prosper recognizes revenue when persuasive evidence of an arrangement exists, delivery has occurred or services have been rendered, the price of the services is fixed and determinable and collectability is reasonably assured.
Origination Fees
Origination fees are a percentage of the amount borrowed varying by Prosper Rating and are recognized when the loan is funded to the borrower. Effective July 26, 2010, borrowers with a Prosper Rating of AA are charged an origination fee of 0.5% of the aggregate principal balance of the loan with no minimum fee, borrowers with a Prosper Rating of A through B are charged an origination fee of 3% of the aggregate principal balance of the loan or $75 whichever is greater and borrowers with a Prosper Rating of C through HR are charged an origination fee of 4.5% of the aggregate principal balance of the loan or $75, whichever is greater. As of December 20, 2010, we eliminated the $75 minimum fee. Prior to July 26, 2010, borrowers with a Prosper Rating of AA were charged an origination fee of 0.5% of the aggregate principal balance of the loan with no minimum fee, borrowers with a Prosper Rating of A through HR were charged an origination fee of 3% of the aggregate principal balance of the loan or $50 whichever was greater.
Loan servicing fees
Loan servicing revenue includes monthly loan servicing fees and non-sufficient funds (NSF) fees on loans originated prior to October 16, 2008. Loan servicing fees are accrued daily based on the current outstanding loan principal balance of the borrower loan but are not recognized until payment is received due to the uncertainty of collection of borrower loan payments. Servicing fees for a loan vary based on the credit grade of the borrower. Prosper charges a NSF fee to borrowers on the first failed payment of each billing period. NSF fees are charged to the borrower and collected and recognized immediately.
Interest income (expense) on Borrower Loans receivable and Payment Dependent Notes
We recognize interest income on our borrower loan receivable using the accrual method based on the stated interest rate to the extent that we believe it to be collectable. We record interest expense on the corresponding Payment Dependent Note based on the contractual interest rate. Gross interest income earned and gross interest expense incurred was $1,458,204 and $1,377,930, and $459,491 and $433,617, for the three months ended March 31, 2011 and 2010, respectively.
Advertising and Promotional Expenses
Under the provisions of ASC Topic 720, Other Expenses, the costs of advertising are expensed as incurred. Advertising costs were approximately $518,000 and $287,000 for the three months ended March 31, 2011 and 2010, respectively.
Stock-Based Compensation
The Company accounts for its stock-based compensation for employees using fair-value-based accounting in accordance with ASC Topic 718, Stock Compensation. ASC Topic 718 requires companies to estimate the fair value of stock-based awards on the date of grant using an option-pricing model. The stock-based compensation related to awards that is expected to vest is amortized using the straight line method over the vesting term of the stock-based award, which is generally four years. Expected forfeitures of unvested options are estimated at the time of grant and reduce the recognized stock-based compensation expense. The forfeitures were estimated based on historical experience. The Company estimated its annual forfeiture rate to be 23.4% and 23.5% for the three months ended March 31, 2011 and 2010, respectively.
Prosper has granted options to purchase shares of common stock to nonemployees in exchange for services performed. Prosper accounts for stock options and restricted stock issued to nonemployees in accordance with the provisions of ASC Topic 505-50, Equity-Based Payments to Non-Employees, which requires that equity awards be recorded at their fair value. Under ASC Topic 718 and 505-50, Prosper uses the Black-Scholes model to estimate the value of options granted to nonemployees at each vesting date to determine the appropriate charge to stock-based compensation. The volatility of common stock was based on comparative company volatility.
The fair value of stock option awards for the three months ended March 31, 2011 and 2010 was estimated at the date of grant using the Black-Scholes model with the following average assumptions:
|
Three Months Ended
|
|||
|
March 31,
|
|||
|
2011
|
2010
|
||
|
Volatility of common stock
|
65.84%
|
**
|
|
|
Risk-free interest rate
|
1.70%
|
**
|
|
|
Expected life*
|
4.5 years
|
**
|
|
|
Dividend yield
|
0%
|
**
|
|
|
Weighted-average fair value of grants
|
$0.20
|
**
|
|
|
*For nonemployee stock option awards, the expected life is the contractual term of the award, which is generally ten years.
**No stock option awards were granted during the quarter ended March 31, 2010.
|
The Black-Scholes model requires the input of highly subjective assumptions, including the expected stock price volatility. Because Prosper’s equity awards have characteristics significantly different from those of traded options, the changes in the subjective input assumptions can materially affect the fair value estimate.
Total stock-based compensation expense for employee and non-employee stock-option awards reflected in the statements of operations for the three months ended March 31, 2011 and 2010 was $71,898 and $59,222, respectively. As of March 31, 2011, the unamortized stock-based compensation expense related to unvested stock-based awards was approximately $314,764 which will be recognized over the remaining vesting period of approximately 2.7 years.
Net Loss Per Share
Prosper computes net loss per share in accordance with ASC Topic 260 Earnings Per Share. Under ASC Topic 260, basic net loss per share is computed by dividing net loss per share available to common stockholders by the weighted average number of common shares outstanding for the period and excludes the effects of any potentially dilutive securities. Diluted earnings per share, if presented, would include the dilution that would occur upon the exercise or conversion of all potentially dilutive securities into common stock using the “treasury stock” and/or “if converted” methods as applicable. At March 31, 2011, there were outstanding convertible preferred stock, warrants and options convertible into 32,848,832, 572,703 and 6,716,503 common shares, respectively, which may dilute future earnings per share. Due to the Company reporting a net loss for the three months ended March 31, 2011 and 2010, there is no calculation of fully-diluted earnings per share as all common stock equivalents are anti-dilutive.
Income Taxes
Prosper uses the liability method to account for income taxes. Under this method, deferred income tax assets and liabilities are based on the differences between the financial statements and tax bases of assets and liabilities that will result in taxable or deductible amounts in the future based on enacted tax laws and rates applicable to the periods in which the differences are expected to affect taxable income. Valuation allowances are established when necessary to reduce deferred tax assets to the amount expected to be realized. Under ASC Topic 740, Income Taxes. our policy to include interest and penalties related to gross unrecognized tax benefits within our provision for income taxes did not change.
Fair Value Measurement
Prosper adopted ASC Topic 820 on January 1, 2008. ASC Topic 820 provides a framework for measuring the fair value of assets and liabilities. ASC Topic 820 also provides guidance regarding a fair value hierarchy, which prioritizes information used to measure fair value and the effect of fair value measurements on earnings and provides for enhanced disclosures determined by the level within the hierarchy of information used in the valuation. ASC Topic 820 applies whenever other standards require (or permit) assets or liabilities to be measured at fair value but does not expand the use of fair value in any new circumstances.
ASC Topic 820 defines fair value in terms of the price that would be received upon the sale of an asset or paid to transfer a liability in an orderly transaction between market participants at the measurement date.
The price used to measure the fair value is not adjusted for transaction costs while the cost basis of certain financial instruments may include initial transaction costs. Under ASC Topic 820, the fair value measurement also assumes that the transaction to sell an asset occurs in the principal market for the asset or, in the absence of a principal market, the most advantageous market for the asset. The principal market is the market in which the reporting entity would sell or transfer the asset with the greatest volume and level of activity for the asset. In determining the principal market for an asset or liability under ASC Topic 820, it is assumed that the reporting entity has access to the market as of the measurement date. If no market for the asset exists or if the reporting entity does not have access to the principal market, the reporting entity should use a hypothetical market.
Under ASC Topic 820, assets and liabilities carried at fair value in the balance sheets are
classified among three levels based on the observability of the inputs used to determine fair value:
|
Level 1 — The valuation is based on quoted prices in active markets for identical instruments.
|
|
|
Level 2 — The valuation is based on observable inputs such as quoted prices for similar instruments in active markets, quoted prices for identical or similar instruments in markets that are not active, and model-based valuation techniques for which all significant assumptions are observable in the market.
|
|
Level 3 — The valuation is based on unobservable inputs that are supported by little or no market activity and that are significant to the fair value of the instrument. Level 3 valuations are typically performed using pricing models, discounted cash flow methodologies, or similar techniques, which incorporate management’s own estimates of assumptions that market participants would use in pricing the instrument or valuations that require significant management judgment or estimation.
|
Prosper determines the fair values of its financial instruments based on the fair value hierarchy established in that standard, which requires an entity to maximize the use of quoted prices and observable inputs and to minimize the use of unobservable inputs when measuring fair value. Various valuation techniques are utilized, depending on the nature of the financial instrument, including the use of market prices for identical or similar instruments, or discounted cash flow models. When possible, active and observable market data for identical or similar financial instruments are utilized. Alternatively, fair value is determined using assumptions that management believes a market participant would use in pricing the asset or liability.
The Company’s financial instruments consist principally of cash and cash equivalents, restricted cash, receivables, borrower loans, servicing rights, accounts payable and accrued liabilities, Borrower Payment Dependent Notes and long-term debt. The estimated fair values of cash and cash equivalents, restricted cash, accounts payable and accrued liabilities approximate their carrying values because of their short term nature.
The following tables present the assets and liabilities measured at fair value on a recurring basis as of March 31, 2011 and December 31, 2010:
|
December 31, 2010
|
Level 1 Inputs
|
Level 2 Inputs
|
Level 3 Inputs
|
Fair Value
|
|||||||||
|
Assets
|
|||||||||||||
|
Servicing rights
|
—
|
—
|
$
|
2,986
|
$
|
2,986
|
|||||||
|
Borrower Loans receivable
|
—
|
—
|
23,689,950
|
23,689,950
|
|||||||||
|
Liabilities
|
|||||||||||||
|
Borrower Payment Dependent Notes
|
—
|
—
|
$
|
23,478,046
|
$
|
23,478,046
|
|||||||
|
March 31, 2011
|
Level 1 Inputs
|
Level 2 Inputs
|
Level 3 Inputs
|
Fair Value
|
|||||||||
|
Assets
|
|||||||||||||
|
Servicing rights
|
—
|
—
|
$
|
967
|
$
|
967
|
|||||||
|
Borrower Loans receivable
|
—
|
—
|
30,359,534
|
30,359,534
|
|||||||||
|
Liabilities
|
|||||||||||||
|
Borrower Payment Dependent Notes
|
—
|
—
|
$
|
30,026,687
|
$
|
30,026,687
|
|||||||
As observable market prices are not available for the borrower loans and Notes we hold, or for similar assets and liabilities, we believe the borrower loans and Notes should be considered Level 3 financial instruments under ASC Topic 820. In a hypothetical transaction as of the measurement date, the Company believes that differences in the principal marketplace in which the loans are originated and the principal marketplace in which the Company might offer those loans may result in differences between the originated amount of the loans and their fair value as of the transaction date. For borrower loans, the fair value is estimated using discounted cash flow methodologies based upon valuation assumptions including prepayment speeds, roll rates, recovery rates and discount rates based on the perceived credit risk within each credit grade.
Our obligation to pay principal and interest on any Note is equal to the loan payments, if any, we receive on the corresponding borrower loan, net of our 1.0% servicing fee. As such, the fair value of the Note is approximately equal to the fair value of the borrower loans, adjusted for the 1.0% servicing fee. Any unrealized gains or losses on the borrower loans and Notes for which the fair value option has been elected is recorded as a separate line item in the statement of operations. The effective interest rate associated with the Notes will be less than the interest rate earned on the borrower loans due to the 1.0% servicing fee. See Note 4 for a rollforward and further discussion of the significant assumptions used to value borrower loans and Notes.
Servicing rights related to loans originated prior to October 16, 2008 do not trade in an active open market with readily observable prices. Although sales of servicing assets do occur, the nature and character of the assets underlying those transactions are not similar to those held by the Company and, therefore, the precise terms and conditions typically seen in the marketplace would likely not be available to the Company. Accordingly, management determines the fair value of its servicing rights using a discounted cash flow model to project future expected cash flows based upon a set of valuation assumptions Prosper believes market participants would use for similar rights. The primary assumptions Prosper uses for valuing its servicing asset include prepayment speeds, default rates, cost to service, profit margin, and discount rate.
Prosper reviews these assumptions to ensure that they remain consistent with the market conditions. Inaccurate assumptions in valuing the servicing rights could affect Prosper’s results of operations. Due to the nature of the valuation inputs, servicing assets are classified as Level 3. The change in the fair-value of servicing rights is included in cost of services in the statement of operations. See Note 3 for a further discussion of the significant assumptions used to value servicing rights.
The changes in Level 3 assets measured at fair value on a recurring basis are as follows:
|
Fair Value Measurements Using Significant Unobservable Inputs (Level 3)
|
||||||||||||
|
Servicing Rights
|
Borrower Loans
|
Borrower Payment Dependent Notes
|
Total
|
|||||||||
|
Balance at January 1, 2010
|
$
|
24,319
|
|
$ |
7,020,363
|
$ |
(6,903,173)
|
$
|
141,509
|
|||
|
Originations
|
5,933,690
|
(5,933,690)
|
—
|
|||||||||
|
Principal repayments
|
(1,337,679)
|
1,311,571
|
(26,108)
|
|||||||||
|
Change in fair value on borrower loans and Payment Dependent Notes
|
(634,691)
|
725,400
|
90,709
|
|||||||||
|
Change in fair value of servicing rights
|
(7,114)
|
—
|
—
|
(7,114)
|
||||||||
|
Balance at March 31, 2010
|
$
|
17,205
|
$
|
10,981,683
|
$
|
(10,799,892)
|
$
|
198,996
|
||||
|
Balance at January 1, 2011
|
$
|
2,986
|
$
|
23,689,950
|
$
|
(23,478,046)
|
$
|
214,890
|
||||
|
Originations
|
11,471,874
|
(11,471,874)
|
—
|
|||||||||
|
Principal repayments
|
(4,506,839)
|
4,343,090
|
(163,749)
|
|||||||||
| Change in fair value on borrower loans and Payment Dependent Notes | (295,451) | 580,143 | 284,692 | |||||||||
|
Change in fair value of servicing rights
|
(2,019)
|
—
|
—
|
(2,019)
|
||||||||
|
Balance at March 31, 2011
|
$ | 967 | $ | 30,359,534 | $ | (30,026,687) | $ | 333,814 | ||||
New Accounting Pronouncements
In January 2010, FASB issued ASU No. 2010-06, “Fair Value Measurements and Disclosures,” that requires reporting entities to make new disclosures about recurring or nonrecurring fair-value measurements including significant transfers into and out of Level 1 and Level 2 fair-value measurements and information on purchases, sales, issuances, and settlements on a gross basis in the reconciliation of Level 3 fair-value measurements. The FASB also clarified existing fair-value measurement disclosure guidance about the level of disaggregation, inputs, and valuation techniques. The new and revised disclosures are required to be implemented in fiscal years beginning after December 15, 2009. The adoption of this standard did not have a material impact on our financial statements.
3. Servicing Rights
Prosper calculates the fair value of the servicing asset based on the following assumptions:
|
March 31,
|
|||
|
2011
|
2010
|
||
|
Unpaid principal loan balance under service
|
$2,200,000
|
$20,100,000
|
|
|
Servicing fees
|
0.0% - 1.0%
|
0.0% - 1.0%
|
|
|
Projected prepayment speed
|
2.32%
|
1.20%
|
|
|
Discount rate
|
25%
|
25%
|
|
No servicing rights were purchased or sold during the three months ended March 31, 2011.
4. Borrower Loans and Borrower Payment Notes Held at Fair Value
Prosper estimates the fair value of the borrower loans and Notes using discounted cash flow methodologies based upon a set of valuation assumptions. The main assumptions Prosper used to value the borrower loans and Notes include prepayment rates derived from historical prepayment rates for each credit score, default rates derived from historical performance, recovery rates and discount rates applied to each credit tranche based on the perceived credit risk of each credit grade. Our obligation to pay principal and interest on any Note is equal to the loan payments, if any, we receive on the corresponding borrower loan, net of our 1.0% servicing fee. As such, the fair value of the Note is approximately equal to the fair value of the borrower loans, adjusted for the 1.0% servicing fee. The effective interest rate associated with the Notes will be less than the interest rate earned on the borrower loans due to the 1.0% servicing fee.
For borrower loans originated and Notes issued after July 13, 2009, we used the following average assumptions to determine the fair value as of March 31, 2011:
|
Monthly prepayment rate speed
|
0.49%
|
|
Recovery rate
|
5.32%
|
|
Discount rate *
|
19.07%
|
|
Weighted average default rate
|
9.30%
|
|
* This is the average discount rate among all of Prosper’s credit grades
|
|
The following table presents additional information about borrower loans and Notes measured at fair value on a recurring basis for the three months ended March 31, 2011:
|
Borrower Loans
|
Notes
|
|||||||
|
Fair value at January 1, 2011
|
$
|
23,689,950
|
$
|
23,478,046
|
||||
|
Originations
|
11,471,874
|
11,471,874
|
||||||
|
Principal repayments
|
(4,175,417)
|
(4,011,668)
|
||||||
|
Borrower Loans and Notes charged-off during the period
|
(331,422)
|
(331,422)
|
||||||
|
Realized and unrealized losses included in earnings
|
(295,451)
|
—
|
||||||
|
Realized and unrealized gains included in earnings
|
—
|
(580,143)
|
||||||
|
Fair value at March 31, 2011
|
$
|
30,359,534
|
$
|
30,026,687
|
||||
Due to the recent origination of the borrower loans and Notes, the change in fair value attributable to instrument-specific credit risk is immaterial. The Company had no originations of borrower loans or issuances of Notes prior to July 13, 2009. Of the loans originated from July 13, 2009 to March 31, 2011, the Company had 333 loans which were 90 days or more delinquent for an aggregate principal amount of $1,213,774 and a fair value of $55,971 as of March 31, 2011.
5. Notes Payable
As of March 31, 2011 and December 31, 2010, notes payable consist of the following:
|
March 31, 2011
|
December 31, 2010
|
|||||||
|
Non-interest bearing promissory note
|
$ | 300,000 | $ | 300,000 | ||||
|
Unamortized discount on the non-interest bearing note
|
(5,703 | ) | (11,046 | ) | ||||
|
Total promissory notes payable
|
$ | 294,297 | $ | 288,594 | ||||
Non-interest bearing promissory note
In 2006, we entered into a non-interest bearing promissory note in the amount of $380,000 for the purchase of the “Prosper.com” domain name. The note was discounted by $109,583 for a net payable of $270,417. The promissory note includes both principal and interest and is payable in annual installments of $20,000 due on the first, second, third, and fourth anniversary of the note and $300,000 due on the fifth anniversary of the note. Interest on the note was imputed at an 8% annual rate and is amortized to interest expense over the five year life of the loan. The carrying value at March 31, 2011 and 2010 is $294,297 and $292,051, respectively. The fair value is calculated based on discounted cash flows and is estimated to be $289,025 and $268,266 at March 31, 2011 and 2010, respectively. We recorded amortized interest expense of $5,703 and $5,514 for the three months ended March 31, 2011 and 2010, respectively.
6. Accrued Liabilities
As of March 31, 2011 and December 31, 2010, accrued liabilities consist of the following:
|
March 31,
|
December 31,
|
|||||||
|
2011
|
2010
|
|||||||
|
Legal accruals and fees
|
$ | 525,775 | $ | 373,572 | ||||
|
Audit, tax and accounting
|
334,951 | 411,256 | ||||||
|
Payroll and benefits
|
199,316 | 161,732 | ||||||
|
Loan servicing costs
|
120,216 | 115,364 | ||||||
|
Other
|
338,189 | 157,315 | ||||||
| $ | 1,518,447 | $ | 1,219,239 | |||||
7. Repurchase Obligation
Changes in the repurchase obligation are summarized below:
|
Balance at January 1, 2011
|
$
|
71,001
|
||
|
Reversal of provision for Loans and Notes repurchases
|
(55,331)
|
|||
|
Repurchased Loans and Notes recoveries during the period
|
(2,669)
|
|||
|
Balance at March 31, 2011
|
$
|
13,001
|
As mentioned in Note 2, the Company computes net loss per share in accordance with ASC Topic 260. Under ASC Topic 260, basic net loss per share is computed by dividing net loss per share available to common stockholders by the weighted average number of common shares outstanding for the period and excludes the effects of any potentially dilutive securities. Diluted earnings per share, if presented, would include the dilution that would occur upon the exercise or conversion of all potentially dilutive securities into common stock using the “treasury stock” and/or “if converted” methods as applicable.
Basic and diluted loss per share was calculated as follows:
|
Three Months Ended March 30,
|
||||||||
|
2011
|
2010
|
|||||||
|
Numerator:
|
||||||||
|
Net loss
|
$
|
(1,060,355)
|
$
|
(2,642,720)
|
||||
|
Denominator:
|
||||||||
|
Weighted average shares used in computing basic and diluted net loss per share
|
4,497,556
|
4,460,667
|
||||||
|
Basic and diluted net loss per share
|
$
|
(0.24)
|
$
|
(0.59)
|
||||
|
March 31,
|
||||
|
2011
|
2010
|
|||
|
Excluded Securities:
|
||||
|
Convertible preferred stock issued and outstanding
|
32,848,832
|
9,397,939
|
||
|
Stock options issued and outstanding
|
6,716,503
|
1,757,440
|
||
| Warrant issued and outstanding | 572,703 | - | ||
|
Total common stock equivalents excluded from diluted net loss per common share computation
|
40,138,038
|
11,155,379
|
||
Preferred Stock
Under Prosper’s certificate of incorporation, preferred stock is issuable in series, and the Board of Directors is authorized to determine the rights, preferences, and terms of each series.
In April 2005, Prosper issued and sold 4,023,999 shares of Series A convertible preferred stock (Series A) in a private placement for $7,464,450, net of issuance costs of $80,550. In February 2006, Prosper issued and sold 3,310,382 shares of Series B convertible preferred stock (Series B) in a private placement for $12,412,302, net of issuance costs of $87,700. In June 2007, Prosper issued and sold 2,063,558 shares of Series C convertible preferred stock (Series C) in a private placement for $19,919,009, net of issuance costs of $80,996. In April 2010, Prosper issued and sold 20,340,705 shares of Series D (Series D) and 3,110,188 shares of Series D-1 (Series D-1) convertible preferred stock in a private placement for $14,595,709, which is net of issuance costs of $125,903.
Dividends
The holders of the Series A, Series B, Series C and Series D preferred stock are entitled to receive dividends at an annual rate of 8% per share for the preferred stock times the Liquidation Preference for such shares of preferred stock payable in preference and priority to any declaration or payment of any distribution on common stock or Series D-1 preferred stock. The Series D-1 preferred stock are not entitled to receive dividends in preference and priority to or on a pari passu basis with the other preferred stock. In addition, the Series D-1 preferred stock are not entitled to receive dividends in preference and priority to any distribution of common stock. Such dividends shall be payable only when, as, and if declared by the Board of Directors. To date, no dividends have been declared, and there are no dividends in arrears at March 31, 2011. The right to receive dividends on shares of Series D shall be cumulative from and after the date of issuance of the Series D preferred stock. The right to receive dividends of Series A, Series B and Series C are not cumulative. No right to such dividends shall accrue to holders of Preferred Stock by reason of the fact that dividends on said shares are not declared or paid in any calendar year.
Conversion
Each share of preferred stock shall automatically be converted into fully-paid, non-assessable shares of common stock at the conversion rate for such share (i) immediately prior to the closing of a firm commitment underwritten initial public offering with aggregate proceeds to Prosper of at least $25,000,000 (after deducting underwriters commissions and expenses), pursuant to an effective registration statement filed under the Securities Act of 1933, as amended (the “Securities Act”), covering the offer and sale of Prosper’s common Stock, or (ii) upon the receipt of a written request for such conversion from the holders of more than sixty percent (60%) of the voting power of all then outstanding shares of preferred stock, or, if later, the effective date for conversion specified in such requests, provided that shares of Series D shall not be automatically converted pursuant to this clause (ii) unless the holders of eighty-two percent (82%) of the outstanding shares of Series D approve such conversion. In addition, in the event shares of Series C Preferred Stock are converted in connection with a Liquidation Event and as a result there are fewer than 1,000,000 shares of Series C Preferred Stock outstanding, each share of Series D-1 Preferred Stock shall automatically be converted into fully-paid, non-assessable shares of Common Stock at the then effective Conversion Rate for such shares.
Liquidation Rights
In the event of any liquidation, dissolution, or winding up of Prosper, whether voluntary or involuntary, Series D preferred stock shall be entitled to receive, prior and in preference to any distribution of the proceeds to the holders of Series A, Series B, Series C, Series D-1 or Common Stock by reason of their ownership of such stock, an amount per share for each share of Series D Preferred Stock held by them equal to the sum of $0.7385 (as adjusted for any stock dividends, combinations, or splits), plus all declared but unpaid dividends (if any) on each share of preferred stock. If upon such Liquidation Event, the assets of the Company legally available for distribution to the holders of the Series D Preferred Stock are insufficient to pay the preferential amount, then the entire assets of the Corporation legally available for distribution shall be distributed with equal priority and pro rata among the holders of the Series D Preferred Stock.
After the payment or setting aside for payment to the holders of Series D Preferred Stock of the preferential amount, then the entire assets and funds of Prosper legally available for distribution will be distributed ratably among the holders of the Series A, Series B and Series C and Series D-1 in proportion to the preferential amount each such holder is otherwise entitled to receive ($0.938 for each share of Series A, $1.888 for each share of Series B, $4.846 for each share of Series C, and $1.00 for each share of Series D-1).
Voting
Each holder of shares of the preferred stock shall be entitled to the number of votes equal to the number of shares of common stock into which such shares of preferred stock could be converted and shall have voting rights and powers equal to the voting rights and powers of the common stock (except as otherwise expressly provided herein or as required by law), voting together with the common stock as a single class, and shall be entitled to notice of any stockholders’ meeting in accordance with the Bylaws of Prosper. The holders of the preferred stock shall vote as one class with the holder of the common stock except with respect to certain matters that require separate votes.
Common Stock
Prosper is authorized to issue up to 43,860,321 shares of common stock, $0.001 par value, of which 4,498,667 and 4,478,667 shares were issued and outstanding as of March 31, 2011, and December 31, 2010, respectively. Each holder of common stock shall be entitled to one vote for each share of common stock held.
Common Stock Issued upon Exercise of Stock Options
For the three months ended March 31, 2011, the Company issued 20,000 shares upon the exercise of options for cash proceeds of $5,000.
10. Stock Option Plan and Other Stock Compensation
In 2005, Prosper’s Board of Directors, which at such time was comprised of the Company’s sole stockholders, approved the adoption of the 2005 Stock Option Plan (the “Plan”). Under the Plan, options to purchase up to 1,879,468 shares of common stock were reserved for grants to employees, directors, and consultants by the Board of Directors to promote the success of Prosper’s business. On January 31, 2008, the Board of Directors increased the total number of options under the Plan by 500,000 for a total of 2,379,468 options available for grant. On October 6, 2009, the Board of Directors increased the total number of options under the Plan by an additional 500,000 for a total of 2,879,468 options available for grant. On April 15, 2010, the Board of Directors increased the total number of options under the Plan by an additional 6,109,321 for a total of 8,988,789 options available to grant.
Incentive stock options are granted to employees at an exercise price not less than 100% of the fair value of Prosper’s common stock on the date of grant. Nonstatutory stock options are granted to consultants and directors at an exercise price not less than 85% of the fair value of Prosper’s common stock on the date of grant. If options are granted to stockholders who hold 10% or more of Prosper’s common stock on the option grant date, then the exercise price shall not be less than 110% of the fair value of Prosper’s common stock on the date of grant. The fair value is based on a good faith estimate by the Board of Directors at the time of each grant. As there is no active trading market for these options, such estimates may ultimately differ from valuations completed by an independent party. The options generally vest over four years, which is the same as the performance period. In no event are options exercisable more than ten years after the date of grant.
Option activity under the Option Plan is summarized as follows for the periods below:
|
Options Issued and Outstanding
|
Weighted-Average Exercise Price
|
|||||||
|
Balance as of January 1, 2010
|
1,897,126 | $ | 0.96 | |||||
|
Options granted (weighted average fair value of $0.00)
|
- | $ | 0.00 | |||||
|
Options exercised
|
- | $ | 0.00 | |||||
|
Options canceled
|
(139,686 | ) | $ | 1.05 | ||||
|
Balance as of March 31, 2010
|
1,757,440 | $ | 0.95 | |||||
|
Balance as of January 1, 2011
|
5,766,859 | $ | 0.30 | |||||
|
Options granted (weighted average fair value of $0.20)
|
1,112,978 | $ | 0.20 | |||||
|
Options exercised
|
(20,000 | ) | $ | 0.25 | ||||
|
Options canceled
|
(143,334 | ) | $ | 0.39 | ||||
|
Balance as of March 31, 2011
|
6,716,503 | $ | 0.28 | |||||
|
Options outstanding and exercisable at March 31, 2011
|
764,827 | $ | 0.73 | |||||
Other Information Regarding Stock Options
Additional information regarding common stock options outstanding as of March 31, 2011 is as follows:
|
Options Outstanding
|
Options Exercisable
|
|||||||||||||||||||||||||||
|
Range of Exercise Prices
|
Number Outstanding
|
Weighted Avg. Remaining Life
|
Weighted Avg. Exercise Price
|
Intrinsic Value
|
Number Exercisable
|
Weighted Avg. Exercise Price
|
Intrinsic Value
|
|||||||||||||||||||||
|
$0.20 - $0.20
|
5,842,917 | 9.36 | $ | 0.20 | $ | – | 127,290 | $ | 0.20 | $ | – | |||||||||||||||||
|
$0.25 - $0.25
|
34,158 | 4.43 | 0.25 | – | 34,158 | 0.25 | – | |||||||||||||||||||||
|
$0.50 - $0.50
|
304,117 | 5.62 | 0.50 | – | 303,595 | 0.50 | – | |||||||||||||||||||||
|
$0.56 - $0.56
|
365,000 | 8.34 | 0.56 | – | 154,685 | 0.56 | – | |||||||||||||||||||||
|
$1.94 - $1.94
|
125,311 | 7.76 | 1.94 | – | 110,829 | 1.94 | – | |||||||||||||||||||||
|
$2.17 - $2.17
|
45,000 | 6.94 | 2.17 | – | 34,270 | 2.17 | – | |||||||||||||||||||||
| 6,716,503 | 9.06 | $ | 0.28 | $ | – | 764,827 | $ | 0.73 | $ | – | ||||||||||||||||||
The intrinsic value is calculated as the difference between the value of Prosper's common stock at March 31, 2011, which was $0.20 per share, and the exercise price of the options.
No compensation expense is recognized for unvested shares that are forfeited upon termination of service, and the stock-based compensation expense for the three months ended March 31, 2011 and 2010 reflect the expenses that Prosper expects to recognize after the consideration of estimated forfeitures.
11. Income Taxes
As part of the process of preparing the Company’s financial statements, the Company is required to estimate its income taxes in each of the jurisdictions in which it operates. This process involves determining the Company’s income tax expense (benefit) together with calculating the deferred income tax expense (benefit) related to temporary differences resulting from differing treatment of items, such as deferred revenue or deductibility of certain intangible assets, for tax and accounting purposes. These differences result in deferred tax assets and liabilities, which are included within the accompanying balance sheet. The Company must then assess the likelihood that the deferred tax assets will be recovered through the generation of future taxable income.
Due to the book and tax net losses incurred during the three months ended March 31, 2011 and 2010, Prosper has not incurred any income tax expense during those periods. In addition, Prosper has maintained a full valuation allowance against its net deferred tax assets because the realization of those deferred tax assets is dependent upon future earnings, and the amount and timing of those earnings, if any is uncertain.
12. Commitments and Contingencies
Future minimum lease payments and other commitments
Prosper leases its corporate office and co-location facility under noncancelable operating leases that expire in July 2011 and August 2011, respectively. Prosper’s corporate office lease has the option to renew for an additional three years. On February 25, 2011, we exercised our option to extend our corporate office lease term by two years so that the lease will expire on July 31, 2013. Future minimum rental payments under these leases as of March 31, 2011 are as follows:
|
Remaining nine months ended December 31, 2011
|
$
|
278,371
|
||
|
Years ended December 31:
|
||||
|
2012
|
293,184
|
|||
|
2013
|
171,024
|
|||
|
Total future operating lease obligations
|
$
|
742,579
|
Rental expense under premises-operating lease arrangements was approximately $102,400 for both the three months ended March 31, 2011, and March 31, 2010, respectively.
On April 14, 2008, the Company entered into an agreement with a WebBank, Utah-chartered industrial bank whereby all loans originated through the Prosper marketplace resulting from listings posted on or after April 15, 2008 are made by WebBank under its bank charter. The arrangement allows for loans to be offered to borrowers at uniform nationwide terms. The Company is required to pay WebBank the greater of a monthly minimum fee or a fee calculated based on a certain percentage of monthly loan origination volume.
On March 3, 2009, the Company entered into an agreement with a third party broker-dealer in which the third party agreed to operate and maintain Prosper’s Note Trader Platform on which lender members may offer their Notes for sale to other lender members. The Company, if any, is required to pay the third party broker-dealer an agreed upon monthly fee which equals the difference between the minimum monthly fee and the transaction fees collected by the third party provider during that month.
Securities Law Compliance
From inception through October 16, 2008, the Company sold approximately $178.1 million of loans to unaffiliated lender members, and $1.0 million of loans to affiliated lender members through the Prosper platform whereby the Company assigned promissory notes directly to lender members. The Company did not register the offer and sale of the promissory notes offered and sold through the Prosper platform under the Securities Act of 1933 or under the registration or qualification provisions of the state securities laws. The Company’s management believes that the question of whether or not the operation of the Prosper platform involved an offer or sale of a “security” involved a complicated factual and legal analysis and was uncertain. If the sales of promissory notes offered through the Company’s platform were viewed as a securities offering, the Company would have failed to comply with the registration and qualification requirements of federal and state laws and lender members who hold these promissory notes may be entitled to rescission of unpaid principal, plus statutory interest. Generally, the federal statute of limitations for noncompliance with the requirement to register securities under the Securities Act of 1933 is one year from the violation.
The Company’s decision to restructure its operations and cease sales of promissory notes offered through the platform effective October 16, 2008 limited this contingent liability to the period covering Prosper's activities prior to October 16, 2008, the date on which the Company ceased sales of promissory notes offered through the platform.
The Company has not recorded an accrued loss contingency in connection with the sale of promissory notes to lender members. Accounting for loss contingencies involves the existence of a condition, situation or set of circumstances involving uncertainty as to possible loss that will ultimately be resolved when one or more future event(s) occur or fail to occur. An estimated loss in connection with a loss contingency shall be recorded by a charge to current operations if both of the following conditions are met: first, the amount can be reasonably estimated; and second, the information available prior to issuance of the financial statements indicates that it is probable that a liability has been incurred at the date of the financial statements.
The Company has assessed the contingent liability related to prior sales of loans on the platform and has determined that the occurrence of the contingency is reasonably possible but not probable and that contingent liability ranges from $0 in the event the Company prevails to a maximum of $47.2 million which represents the remaining outstanding principal amount of $2.1 million and loans charged off of $45.1 million as of March 31, 2011.
On November 25, 2008, the Company signed a settlement agreement with the North American Securities Administrators Association (“NASAA”) to pay penalties not to exceed $1.0 million to the States in order to resolve matters relating to Prosper’s alleged unregistered offer and sale of securities. The $1.0 million penalty would be allocated among the states where Prosper conducts business, based on the loan sale transaction volume in each state. However, Prosper will not be required to pay any portion of the fine to those states which elect not to participate in the settlement. As of March 31, 2011 and December 31, 2010, the Company had accrued approximately $282,000 and $284,000, respectively, in connection with this contingent liability in accordance with ASC Topic 450, Contingencies. The methodology applied to estimate the accrual was to divide the $1,000,000 maximum fee pro-rata by state using the Company’s originations since inception. A weighting was then applied by state to assign a likelihood that the penalty will be claimed. In estimating the probability of a claim being made, we considered factors such as the nature of the settlement agreement, whether the states had given any indication of their concern regarding the sale of the promissory notes, and the probability of states opting out of the settlement to pursue their own litigation against the Company, whether penalty is sufficient to compensate these states for the cost of processing the settlement and finally the impact that current economic conditions have had on state governments. The Company will continue to evaluate this accrual and related assumptions as new information becomes known. Penalties will be paid promptly after a state reviews and agrees to the language of the consent order. There is no deadline for the states to decide whether to enforce the consent order. On April 21, 2009, the Company and NASAA finalized a template consent order, which NASAA is recommending that the states adopt in settling any state initiated matters with the Company. As of March 31, 2011, the Company entered into 32 consent order agreements and has paid an aggregate of $431,663 in penalties.
On November 26, 2008, plaintiffs, Christian Hellum, William Barnwell and David Booth, individually and on behalf of all other plaintiffs similarly situated, filed a class action lawsuit against us, certain of our executive officers and our directors in the Superior Court of California, County of San Francisco, California. The suit was brought on behalf of all loan note purchasers in our online lending platform from January 1, 2006 through October 14, 2008. The lawsuit alleges that Prosper offered and sold unqualified and unregistered securities in violation of the California and federal securities laws. The lawsuit seeks class certification, damages and the right of rescission against Prosper and the other named defendants, as well as treble damages against Prosper and the award of attorneys’ fees, experts’ fees and costs, and pre-judgment and post-judgment interest.
Some of the individual defendants filed a demurrer to the First Amended Complaint, which was heard on June 11, 2009 and sustained by the court with leave to amend until July 10, 2009. The plaintiffs filed a Second Amended Complaint on July 10, 2009, to which the same individual defendants demurred. On September 15, 2009, this demurrer was sustained by the court without leave to amend. On February 25, 2011, the plaintiffs filed a Third Amended Complaint, which removed David Booth as a plaintiff and added Brian Russom and Michael Del Greco as plaintiffs. The new plaintiffs are representing the same putative class and prosecuting the same claims as the previously named plaintiffs.
Prosper’s insurance carrier with respect to the class action lawsuit, Greenwich Insurance Company (“Greenwich”), has denied coverage. On August 21, 2009, Prosper filed suit against Greenwich in the Superior Court of California, County of San Francisco, California. The lawsuit seeks a declaration that Prosper is entitled to coverage under its policy with Greenwich for losses arising out of the class action lawsuit as well as damages and the award of attorneys’ fees and pre-judgment and post-judgment interest.
On January 26, 2011, the court issued a final statement of decision finding that Greenwich has a duty to defend the class action lawsuit, and requiring that Greenwich pay Prosper's past and future defense costs in the class action suit up to $2 million. On February 24, 2011, Greenwich made a payment to Prosper in the amount of $1,728,273 to reimburse Prosper for the defense costs it had already incurred in the class action suit. This reimbursement is reflected in Other Income in our Statement of Operations. Greenwich is required to reimburse Prosper for up to an additional $271,727 in defense costs for the class action suit going forward. Each such reimbursement will be due within 30 days of Prosper incurring any such costs and presenting the applicable invoice to Greenwich. Greenwich is also required to pay Prosper pre-judgment interest on the defense costs incurred by Prosper in the class action suit prior to the Court’s decision. The amount of this pre-judgment interest is $164,828. Greenwich will be required to make this pre-judgment interest payment to Prosper when a final judgment has been entered in the insurance suit.
We intend to vigorously defend the class action lawsuit and vigorously prosecute our suit against Greenwich. We cannot, however, presently determine or estimate the final outcome of either lawsuit, and there can be no assurance that either matter will be finally resolved in our favor. If the class action lawsuit is not resolved in our favor, we might be obliged to pay damages, and might be subject to such equitable relief as a court may determine. If our lawsuit against Greenwich is not resolved in our favor, we might not be able to recover proceeds from Greenwich that are sufficient to offset any losses we incur in the class action lawsuit.
As of March 31, 2011, the lawsuits are in their preliminary stages and their probable outcomes cannot presently be determined, nor can the amount of damages or other costs that might be borne by Prosper be estimated.
13. Related Parties
Prosper’s executive officers, directors and certain affiliates participate on the Company’s lending platform by placing bids and purchasing loans originated from Prosper. The aggregate amount of loans purchased and the income earned by these related parties as of March 31, 2011 and 2010 are summarized below:
|
Related Party
|
Aggregate Amount of Loans Purchased
|
Interest Earned on Loans for the Three Months ended,
|
|||||||||||||
|
March 31,
|
March 31,
|
March 31,
|
March 31,
|
||||||||||||
|
2011
|
2010
|
2011
|
2010
|
||||||||||||
|
Executive officers & management
|
$ | 827,791 | $ | 519,190 | $ | 8,925 | $ | 2,878 | |||||||
|
Directors
|
395,388 | 553,193 | 4,272 | 4,134 | |||||||||||
|
Affiliate
|
706,335 | 167,259 | 14,651 | 129 | |||||||||||
| $ | 1,929,514 | $ | 1,239,642 | $ | 27,848 | $ | 7,141 | ||||||||
14. Postretirement Benefit Plans
Prosper has a 401(k) plan that covers all employees meeting certain eligibility requirements. The 401(k) plan is designed to provide tax-deferred retirement benefits in accordance with the provisions of Section 401(k) of the Internal Revenue Code. Eligible employees may defer up to 90% of eligible compensation up to the annual maximum as determined by the Internal Revenue Service. Prosper’s contributions to the plan are discretionary. Prosper has not made any contributions to the plan to date.
MANAGEMENT’S DISCUSSION AND ANALYSIS OF
This management’s discussion and analysis of financial condition and results of operations, or MD&A, contains forward-looking statements that involve risks and uncertainties. Please see “Forward-Looking Statements” in this Quarterly Report on Form 10-Q for a discussion of the uncertainties, risks and assumptions associated with these statements. This discussion should be read in conjunction with our historical financial statements and related notes thereto and the other disclosures contained elsewhere in this Quarterly Report on Form 10-Q. The results of operations for the periods reflected herein are not necessarily indicative of results that may be expected for future periods, and our actual results may differ materially from those discussed in the forward-looking statements as a result of various factors, including but not limited to those included elsewhere in this Quarterly Report on Form 10-Q and those included in the “Risk Factors” section and elsewhere in our Annual Report on Form 10-K.
Overview
We provide a peer-to-peer online credit marketplace that permits our borrow members to apply for loans and lender members to purchase Notes issued by Prosper, the proceeds of which facilitate the funding of specific loans made to borrowers. Our platform enables our borrower members to request and obtain personal, unsecured loans by posting anonymous “listings” on the platform indicating the principal amount of the desired loan. Loan terms are subject to minimum and maximum loan amounts determined by the borrower’s credit bureau score and Prosper score, at interest rates set by Prosper. We assign a Prosper Rating consisting of letter credit grades, based in part on the borrower’s credit score, to each borrower who requests a borrower loan. Prosper borrower members’ Prosper Rating, credit score range, debt-to-income ratios and other credit data are displayed with their listings and are available for viewing by lender members on an anonymous basis. Lender members access our platform and “bid” the amount they are willing to commit to the purchase of a Note that is dependent for payment on the corresponding borrower loan, at interest rates set by Prosper. By making a bid on a listing, a lender member is committing to purchase from Prosper a Note in the principal amount of the lender’s winning bid. Lender members who purchase the Notes will designate that the sale proceeds be applied to facilitate the funding of a corresponding borrower loan listed on our platform. Loans originated to borrower members are made by WebBank, an FDIC-insured, Utah-chartered industrial bank, and sold and assigned to Prosper.
All loans requested and obtained by Prosper borrower members through our platform are unsecured obligations of individual borrower members with a fixed interest rate and a loan term currently set at one, three or five years, which Prosper may in the future extend to between three months to seven years. With respect to loans resulting from listings posted by Prosper borrower members prior to April 15, 2008 Prosper is the originating lender for licensing and regulatory purposes. All borrower loans resulting from listings posted on or after April 15, 2008 are funded by WebBank, an FDIC-insured, Utah-chartered industrial bank. After funding a loan, WebBank assigns the loan to Prosper, without recourse to WebBank, in exchange for the principal amount of the borrower loan. WebBank does not have any obligation to purchasers of the Notes. Prosper verifies the identity of 100% borrowers using a variety of methods including credit bureau data, other electronic data sources and offline documentary procedures. Prosper verifies income and or employment on a subset of borrowers based on a proprietary algorithm. The intention of the algorithm is to verify income and/or employment in cases where the self reported income of the borrower is highly determinant of the borrowers risk rating. This verification is normally done after the listing has already been created and bidding is substantially completed and, therefore, the results of our verification are not reflected in the listings.
Our Operating History
We incorporated in Delaware in March 2005 and launched our public website, www.prosper.com on February 13, 2006. As of March 31, 2011, our platform has facilitated 38,443 borrower loans since its launch.
We made significant changes to the operation of our lending platform that became effective on July 10, 2009, and on July 13, 2009, we began accepting new commitments from our lender members on our platform. Prior to October 16, 2008, we purchased loans from WebBank and then sold and assigned the loans to the lender members who bid on the listings for those loans. Since July 10, 2009, we retain the loans and issue new securities, the Notes, to the winning lenders. Our obligation to repay the Notes is conditioned upon the repayment of the associated borrower loan. We expect to generate increased revenue from borrower origination fees and non-sufficient funds fees and lender members’ servicing fees as our transaction volume increases. Over time, we expect that the number of borrowers and lender members and the volume of borrower loans originated through our platform will increase.
We have a limited operating history and have incurred net losses since our inception. Our net loss was $1,060,355 and $2,642,720 for the three months ended March 31, 2011 and 2010, respectively. We earn revenues primarily from borrower origination fees, non-sufficient funds fees and lender member service fees. At this stage of our development, we have funded our operations primarily with proceeds from equity financings, which are described below under “Liquidity and Capital Resources.”
Our operating plan calls for a continuation of the current strategy of increasing transaction volume to increase revenue until we reach profitability and become cash-flow positive, which we do not expect to occur before the close of 2012. In addition, our 2011 operating plan calls for continued investment in the development of our website, loan servicing platform, loan scoring and marketing efforts before we reach profitability.
Our historical financial results and this discussion reflect the structure of our lending platform and our operations both prior to and after July 10, 2009. For a discussion of the effect of our new structure on our financial statements, see “Borrower Loans and Payment Dependent Notes” under Critical Accounting Policies and Estimates below.
Trends and Uncertainties
The Peer to Peer lending industry remains a very innovative and unique industry that is still in its infancy. We are vulnerable to legislative or regulatory developments that may impact our business model in a positive or negative manner. For example, we continue to discuss with the SEC how federal securities law and evolving staff positions impact the manner in which we operate our platform. We will continue to monitor legislative and regulatory developments that we may encounter in the future in order to better respond to effects it may have on our business platform.
During the first quarter of 2011, we have increased our origination volume consistently month over month. We hope to continue that trend of growth as our borrower and lender bases continue to strengthen and become more familiar with our platform. Overtime we expect our lender base to grow as we gain more exposure to potential lenders and establish our notes as a viable investment alternative. We continue to make developments to our website to better serve our customers and provide an intuitive and straightforward way to borrow and lend money at a peer to peer level.
Critical Accounting Policies and Estimates
Management’s discussion and analysis of our financial condition and results of operations is based on our financial statements, which we have prepared in accordance with U.S. generally accepted accounting principles. The preparation of financial statements requires management to make estimates, judgments and assumptions that affect the reported amounts of assets and liabilities, revenues and expenses and the related disclosures. Prosper bases its estimates on historical experience and on various other assumptions that Prosper believes to be reasonable under the circumstances. Actual results could differ from those estimates. Our significant accounting policies are more fully described in Note 2 to our financial statements included elsewhere in this quarterly report.
Critical accounting policies are those policies that we believe present the most complex or subjective measurements and have the most potential to impact our financial position and operating results. While all decisions regarding accounting policies are important, we believe that the following policies could be considered critical. These critical policies relate to fair value measurement, borrower loans and Payment Dependent Notes, servicing rights, repurchase obligation, revenue recognition, stock-based compensation, and income taxes.
Fair Value Measurement
Under Financial Accounting Standards Board (FASB) Accounting Standards Codification (ASC) Topic 820 Fair Value Measurements and Disclosures on January 1, 2008 we determine the fair values of our financial instruments based on the fair value hierarchy established in that standard, which requires an entity to maximize the use of quoted prices and observable inputs and to minimize the use of unobservable inputs when measuring fair value. We use various valuation techniques depending on the nature of the financial instrument, including the use of market prices for identical or similar instruments, or discounted cash flow models. When possible, active and observable market data for identical or similar financial instruments are utilized. Alternatively, we determine fair value using assumptions that we believe a market participant would use in pricing the asset or liability.
The Company’s financial instruments consist principally of cash and cash equivalents, restricted cash, receivables, borrower loans, servicing rights, accounts payable and accrued liabilities, Borrower Payment Dependent Notes and long-term debt. The estimated fair values of cash and cash equivalents, restricted cash, accounts payable and accrued liabilities approximate their carrying values because of their short term nature.
For additional information and discussion, see Note 2 and Note 4 to the financial statements included elsewhere in this report.
Borrower Loans and Payment Dependent Notes
On July 13, 2009, we implemented our new operating structure and began issuing Notes. The post registration operating structure resulted in Prosper purchasing loans from WebBank, and holding the loans until maturity. Prosper issues new securities, the Notes, to the winning lenders. Prosper’s obligation to repay the Notes is conditioned upon the repayment of the associated borrower loan owned by Prosper. As a result of these changes, Prosper carries the borrower loans and the Notes on its balance sheet as assets and liabilities, respectively.
In conjunction with our new operating structure effective July 13, 2009, we adopted the provisions of ASC Topic 825, Financial Instruments. ASC Topic 825 permits companies to choose to measure certain financial instruments and certain other items at fair value. The standard requires that unrealized gains and losses on items for which the fair value option has been elected be reported in earnings. We applied the provisions of ASC Topic 825 to the borrower loans and Notes issued subsequent to July 13, 2009 on an instrument by instrument basis. We did not apply the provisions of ASC Topic 825 to loans issued prior July 13, 2009. The aggregate fair value of the borrower loans and Notes are reported as separate line items in the assets and liabilities sections of the balance sheet using the methods described in ASC Topic 820.
We determine the fair value of the borrower loans and Notes in accordance with the fair value hierarchy established in ASC Topic 820, which requires an entity to maximize the use of observable inputs and minimize the use of unobservable inputs when measuring fair value. As observable market prices are not available for the borrower loans and Notes we hold or for similar assets and liabilities, we believe the borrower loans and Notes should be considered Level 3 financial instruments under ASC Topic 820. ASC Topic 820 defines fair value as the exchange price that would be received for an asset or paid to transfer a liability (an exit price) in the principal or most advantageous market for the asset or liability in an orderly transaction between market participants on the measurement date.
In a hypothetical transaction as of the measurement date, we believe that differences in the principal marketplace in which the loans are originated and the principal marketplace in which we might offer those loans may result in differences between the originated amount of the loans and their fair value as of the transaction date. Changes in the fair value of borrower loans and Notes subject to the provisions of ASC Topic 820 are recognized in earnings; fees and costs associated with the origination or acquisition of borrower loans are recognized as incurred. Prosper estimates the fair value of the borrower loans and Notes using a discounted cash flow methodology based upon a set of valuation assumptions Prosper believes market participants would use for similar assets and liabilities. The main assumptions used to value the borrower loans and Notes include default rates, discount rates applied to each credit tranche/grade, prepayment rates, and recovery rates.
For borrower loans and Notes issued after July 13, 2009, we used the following average assumptions to determine fair value measurement the fair value as of March 31, 2011:
|
Monthly prepayment rate speed
|
0.49%
|
|
Recovery rate
|
5.32%
|
|
Discount rate *
|
19.07%
|
|
Weighted average default rate
|
9.30%
|
|
* This is the average discount rate among all of Prosper’s credit grades
|
|
Key economic assumptions and the sensitivity of the current fair value to immediate adverse changes in those assumptions at March 31, 2011 for borrower loans and Notes are presented in the following table:
|
Payment
|
||||||||
|
Borrower
|
Dependent
|
|||||||
|
Loans
|
Notes
|
|||||||
|
Discount rate assumption:
|
9.30
|
%
|
9.30
|
%
|
||||
|
Decrease in fair value and income (loss) to earnings from:
|
||||||||
|
100 basis point increase
|
$
|
(559,600
|
)
|
$
|
554,700
|
|||
|
200 basis point increase
|
(1,098,400
|
)
|
1,088,700
|
|||||
|
Increase in fair value and income (loss) to earnings from:
|
||||||||
|
100 basis point decrease
|
$
|
581,700
|
$
|
(576,600
|
)
|
|||
|
200 basis point decrease
|
1,186,700
|
(1,176,300
|
)
|
|||||
|
Default rate assumption:
|
19.07
|
%
|
19.07
|
%
|
||||
|
Decrease in fair value and income (loss) to earnings from:
|
||||||||
|
10% higher default rates
|
$
|
(280,400
|
)
|
$
|
304,000
|
|||
|
20% higher default rates
|
(558,100
|
)
|
580,000
|
|||||
|
Increase in fair value and income (loss) to earnings from:
|
||||||||
|
10% lower default rates
|
$
|
281,700
|
$
|
(254,400
|
)
|
|||
|
20% lower default rates
|
565,400
|
(536,200
|
)
|
|||||
Overall, if the fair value of the borrower loans decrease or increase due to any changes in our assumptions, there will also be a corresponding decrease or increase in the fair value of the linked Notes. As a result, the effect on Prosper’s earnings of adverse changes in key assumptions is mitigated. However, the impact of these changes in fair value could have a material adverse impact on lender member's investments in the Notes.
As we receive scheduled payments of principal and interest on the borrower loans we will in turn make principal and interest payments on the Notes. These principal payments will reduce the carrying value of the borrower loans and Notes. If we do not receive payments on the borrower loans, we are not obligated to and will not make payments on the Notes. The fair value of a Note is approximately equal to the fair value of the corresponding borrower loan, less the 1.0% service fee. If the fair value of the borrower loan decreases due to our expectation of both the rate of default of the loan and the amount of loss in the event of default, there will also be a corresponding decrease in the fair value of the Note (an unrealized gain related to the Note and an unrealized loss related to the borrower loan).
For additional information and discussion, see Note 2 and Note 4 to the financial statements included elsewhere in this report.
Servicing Rights
We account for our servicing rights under the fair value measurement method of reporting in accordance with ASC Topic 860, Transfers and Servicing. Under the fair value method, we measure servicing rights at fair value at each reporting date and report changes in fair value in earnings in the period in which the changes occur.
We estimate the fair value of the servicing rights as it relates to loans originated prior to July 13, 2009, using a discounted cash flow model to project future expected cash flows based upon a set of valuation assumptions that we believe market participants would use for similar rights. The primary assumptions we use for valuing our servicing rights include prepayment speeds, default rates, cost to service, profit margin, and discount rate. We review these assumptions to ensure that they remain consistent with the market conditions. Inaccurate assumptions in valuing servicing rights could affect our results of operations.
For additional information and discussion, see Note 2 and Note 3 to the financial statements included elsewhere in this report.
Repurchase Obligation
We are obligated to indemnify lenders and repurchase the Notes sold to the lenders in the event of violation of the applicable federal/state/local lending laws or verifiable identify theft. Our limited operating history, the lack of industry comparables and the potential to impact financial performance make the repurchase obligation a critical accounting policy.
We accrue a provision for the repurchase obligation when the Notes are sold to the lender members in an amount considered appropriate to reserve for our repurchase obligation related to the Notes in the event of violation of the applicable federal/state/local lending laws or verifiable identify theft. The repurchase obligation is evaluated at least once a quarter and represents an estimate based on the rate of historical repurchases as a percentage of originations (which generally occur within six to nine months of origination). The repurchase obligation may include a judgmental management adjustment due to our limited operating history, changes in current economic conditions, the risk of new and as yet undetected fraud schemes, origination unit and dollar volumes, and the lack of industry comparables.
Revenue Recognition
The Company recognizes revenue in accordance with ASC Topic 605, Revenue Recognition. Under ASC Topic 605, Prosper recognizes revenue when persuasive evidence of an arrangement exists, delivery has occurred or services have been rendered, the price of the services is fixed and determinable and collectability is reasonably assured.
Origination Fees
From our relaunch in July of 2009 until July 2010, borrowers with a Prosper Rating of AA were charged an origination fee of 0.5% of the aggregate principal balance of the loan with no minimum fee and borrowers with a Prosper Rating of A through HR were charged an origination fee of 3% of the aggregate principal balance of the loan or $50, whichever was greater. In July of 2010, we implemented a new fee structure, under which borrowers with a Prosper Rating of AA are charged an origination fee of 0.5% of the aggregate principal balance of the loan with no minimum fee, borrowers with a Prosper Rating of A or B are charged an origination fee of 3.0% of the aggregate principal balance of the loan or $75, whichever is greater, and borrowers with a Prosper Rating of C through HR are charged an origination fee of 4.5% of the aggregate principal balance of the loan or $75, whichever is greater. Beginning December 20, 2010, we eliminated the $75.00 minimum fee for all listings. Origination fees are charged by WebBank and we receive amounts equal to these fees as compensation for our marketing and underwriting activities.
Servicing Fees
Loan servicing revenue includes loan servicing fees and non-sufficient funds fees on loans originated prior to October 16, 2008. Loan servicing fees are accrued daily based on the current outstanding loan principal balance of (a) borrower loan(s), but are not recognized until payment is received due to uncertainty of collection of borrower loan payments. Currently, we charge servicing fees at an annualized rate of 1.0% of the outstanding principal balance of a Prosper borrower member’s loan, which we deduct from each lender member’s share of borrower loan payments. Overtime, we expect that the servicing fees that we receive will ultimately decrease to zero as the loans originated prior to October 16, 2008 mature.
We charge a non-sufficient funds fee to borrowers on the first failed payment of each billing period. Non-sufficient funds fees are charged to the borrower and collected and recognized immediately.
Our procedures generally require the automatic debiting of borrower member bank accounts by automated clearing house (ACH) transfer, although we allow payment by check and bank draft. We charge a non-sufficient funds fee to a borrower member to cover the cost we incur if an automatic payment fails and is rejected by the borrower member’s bank, for example if there is an insufficient balance in the bank account or if the account has been closed or otherwise suspended. If an automatic payment fails we make up to two additional attempts to collect; however, there is no additional fee charged to the borrower if these attempts fail. We retain the entire amount of the non-sufficient funds fee, which is currently $15.00 per initial payment failure, or such lesser amount required by law, to cover our costs.
Interest Income (expense) on Borrower Loans Receivable and Payment Dependent Notes
We recognize interest income on our borrower loans using the accrual method based on the stated interest rate to the extent that we believe it to be collectable. We record interest expense on the corresponding Note based on the contractual interest rate. Interest income and interest expense will continue to increase as our loan and Note volume grows.
Stock-Based Compensation
We account for stock-based compensation for employees using fair-value based accounting in accordance with ASC Topic 718, Stock Compensation. ASC Topic 718 requires companies to estimate the fair value of stock-based awards on the date of grant using an option-pricing model. The Company uses the Black-Scholes model to determine the fair value of stock options granted to employees. The stock-based compensation expense related to awards that are expected to vest is amortized over the vesting term of the stock-based award, which is generally four years.
Expected forfeitures of unvested options are estimated at the time of grant and reduce the recognized stock-based compensation expense. The forfeiture rate is estimated based on historical experience and revised on a quarterly basis. The significant assumptions used in the calculation of stock based compensation are discussed in detail in Note 2 to our financial statements included elsewhere in this report.
We use the Black-Scholes model to estimate the value of options granted to non-employees at each vesting date to determine the appropriate charge to stock-based compensation. The volatility of common stock was based on comparative company volatility. The Black-Scholes model requires the input of highly subjective assumptions, including the expected stock price volatility. Because Prosper’s equity awards have characteristics significantly different from those of traded options, the changes in the subjective input assumptions can materially affect the fair value estimate.
Income Taxes
ASC Topic 740, Income Taxes provides for the recognition of deferred tax assets if realization of such assets is more likely than not. Based upon the weight of available evidence, which includes our historical operating performance and the reported cumulative net losses in all prior years, we have provided a full valuation allowance against our net deferred tax assets. We will continue to evaluate the realizability of the deferred tax assets on a quarterly basis.
Results of Operations
Our results of operations for the three months ended March 31, 2011 and 2010, together with the percentage change between periods, are set forth below.
|
Prosper Marketplace, Inc.
|
|||||||||||||||||||||||
|
Statement of Operations
|
|||||||||||||||||||||||
|
(Unaudited)
|
|||||||||||||||||||||||
|
Three Months Ended March 31,
|
|||||||||||||||||||||||
|
2011
|
2010
|
Change from prior period
|
|||||||||||||||||||||
| $ |
As % of sales
|
$ |
As % of sales
|
$ Increase / (Decrease)
|
%
|
||||||||||||||||||
|
Revenues
|
|||||||||||||||||||||||
|
Origination fees
|
$ | 393,302 | $ | 148,605 | $ | 244,697 | 165 | % | |||||||||||||||
|
Loan servicing fees
|
12,019 | 65,085 | (53,066 | ) | (82 | %) | |||||||||||||||||
|
Interest income on Borrower Loans and Borrower Payment Dependent Notes, net
|
80,274 | 25,874 | 54,400 | 210 | % | ||||||||||||||||||
|
Rebates and promotions
|
(166,404 | ) | (1,668 | ) | (164,736 | ) | 9876 | % | |||||||||||||||
| 319,191 | 237,896 | 81,295 | 34 | % | |||||||||||||||||||
|
Cost of Revenues
|
|||||||||||||||||||||||
|
Cost of services
|
(302,823 | ) | (95 | %) | (182,391 | ) | (77 | %) | (120,432 | ) | 66 | % | |||||||||||
|
Reversal of (Provision for) loan and Note repurchases
|
60,669 | 19 | % | (8,033 | ) | (3 | %) | 68,702 | (855 | %) | |||||||||||||
|
Total revenues, net
|
77,037 | 47,472 | 29,565 | 62 | % | ||||||||||||||||||
|
Operating expenses
|
|||||||||||||||||||||||
|
Compensation and benefits
|
1,558,209 | 488 | % | 1,174,825 | 494 | % | 383,384 | 33 | % | ||||||||||||||
|
Marketing and advertising
|
517,995 | 162 | % | 287,048 | 121 | % | 230,947 | 80 | % | ||||||||||||||
|
Depreciation and amortization
|
123,264 | 39 | % | 129,731 | 55 | % | (6,467 | ) | (5 | %) | |||||||||||||
|
General and administrative
|
|||||||||||||||||||||||
|
Professional services
|
596,960 | 187 | % | 724,209 | 304 | % | (127,249 | ) | (18 | %) | |||||||||||||
|
Facilities and maintenance
|
150,198 | 47 | % | 163,856 | 69 | % | (13,658 | ) | (8 | %) | |||||||||||||
|
Other
|
227,694 | 71 | % | 315,327 | 133 | % | (87,633 | ) | (28 | %) | |||||||||||||
|
Total expenses
|
3,174,320 | 2,794,996 | 379,324 | 14 | % | ||||||||||||||||||
|
Loss before other income
|
(3,097,283 | ) | (2,747,524 | ) | (349,759 | ) | 13 | % | |||||||||||||||
|
Other income
|
|||||||||||||||||||||||
|
Interest Income
|
1,034 | 0 | % | 469 | 0 | % | 565 | 120 | % | ||||||||||||||
|
Change in fair value on Borrower Loan and Borrower Payment Dependent Notes, net
|
284,692 | 89 | % | 90,709 | 38 | % | 193,983 | 214 | % | ||||||||||||||
|
Insurance recoveries
|
1,728,273 | 541 | % | - | 0 | % | 1,728,273 | n/a | |||||||||||||||
|
Other income
|
22,929 | 7 | % | 13,626 | 6 | % | 9,303 | 68 | % | ||||||||||||||
|
Total other income
|
2,036,928 | 104,804 | 1,932,124 | 1844 | % | ||||||||||||||||||
|
Loss before income taxes
|
(1,060,355 | ) | (2,642,720 | ) | 1,582,365 | (60 | %) | ||||||||||||||||
|
Provision for Income taxes
|
- | 0 | % | - | 0 | % | - | n/a | |||||||||||||||
|
Net Loss
|
$ | (1,060,355 | ) | $ | (2,642,720 | ) | $ | 1,582,365 | (60 | %) | |||||||||||||
Revenues
Origination Fees
Origination fees for the three months ended March 31, 2011 were $393.3 thousand, representing an increase of $244.7 thousand, as compared to $148.6 thousand for the three months ended March 31, 2010. The significant increase in origination fees for the three months ended March 31, 2011 was primarily due to the Company increasing origination volume in the three months ended March 31, 2011 as compared to March 31, 2010. The Company originated 1,744 loans totaling $11.5 million during the three months ended March 31, 2011 as compared to 1,243 loans totaling $5.9 million originated in the three months ended March 31, 2010. The Company also altered its origination fees in late December 2010, as we eliminated minimum fee amounts for any borrowers with a Prosper Rating of A through HR. In the first quarter of 2011 our origination volume increased due to a shift in various marketing avenues and refining operational processes which yielded greater listing and bidding activity. As our company matures, our borrower and lender bases have become more familiar with our site as evidenced by an increase in the reinvestment of lender funds, additional capital being placed on the platform as well as borrowers securing second loans.
Loan Servicing Fees
For the three months ended March 31, 2011, loan servicing fees were $12.0 thousand, representing a decrease of $53.1 thousand, as compared to $65.1 thousand for the three months ended March 31, 2010. The decrease in loan servicing fees is attributed primarily to the overall decrease in the outstanding principal balance of loans serviced from the comparable prior year periods. As our loan servicing revenue primarily consists of loan servicing fees and non-sufficient funds fees on loans originated prior to October 16, 2008, we expect that over time servicing fee revenue will ultimately decrease to zero as the loans originated prior to October 16, 2008 mature.
Interest Income on Borrower Loans and Payment Dependent Notes
Gross interest income earned and gross interest expense incurred were approximately $1.5 million and $1.4 million, respectively for the three months ended March 31, 2011, resulting in net interest income of $80.3 thousand. Gross interest income earned and gross interest expense incurred for the three months ended March 31, 2010 were approximately $459.5 thousand and $433.6 thousand, netting to $25.9 thousand in interest income. The primary driver of this increase is the overall increase in the amount of loans that we originate and service at any given point. As discussed earlier, our origination revenue has increased 165% which will inherently increase our gross interest income and expense. Over time, we expect that revenues and expenses related to borrower loans and Notes will increase as we grow our platform.
Cost of Revenues
Cost of Services
Our cost of services are comprised primarily of credit bureau fees, payments to strategic partners, collection expenses, the change in fair value of servicing rights, referral program fees for certain partners and other expenses directly related to loan funding and servicing. Cost of service expenses were $302.8 thousand for the three months ended March 31, 2011, an increase of $120.4 thousand, as compared to $182.4 thousand for the three months ended March 31, 2010. The increase in our cost of services was due in part to an increase of $26.0 thousand in our credit bureau fees, as the Company experienced a proportional increase in loan listing volume for the three months ended March 31, 2011 as compared to the prior year period. Strategic partnership fees paid to WebBank and Foliofn increased by $90.0 thousand over the prior year quarter as a result of the renegotiation of contractual terms. These increases as well as other small increases in referral program fees and other expenses directly related to loan funding and servicing contributed to the overall increase in our cost of services.
Loan and Note Repurchases
Judgments in our favor have led to recoveries during the period which correspond to certain loan repurchases. For the three months ended March 31, 2011 and 2010, we received recoveries on prior repurchased loans of approximately $3.5 thousand and $2.0 thousand, respectively. For the three months ended March 31, 2011 and 2010, we recorded no repurchase losses. Based on our analysis of our past loan repurchase history, we decreased our loan repurchase obligation to approximately $13.0 thousand from a previously recorded obligation of $71.0 thousand at December 31, 2010. This resulted in a gain due to a reversal of prior estimates in our statement of operations of approximately $58.0 thousand. We continue to devote a significant amount of attention to fraud prevention and will continue to enhance our fraud control procedures to maintain a low level of repurchased loans.
Other Income
Interest Income
Interest income on cash and cash equivalents was $1.0 thousand for the three months ended March 31, 2011 an increase of $0.5 thousand, as compared to $0.5 thousand for the three months ended March 31, 2010, respectively. The increase in interest income for the three months ended March 31, 2011 as compared to the three months ended March 31, 2010 was primarily attributable to higher average cash balances in the first quarter of 2011, as compared to our average cash balances during the first quarter of 2010.
Change in Fair Value on Borrower Loans and Payment Dependent Notes, net
Under the methods described in ASC Topic 820, Fair Value Measurements and Disclosures, we elected to account for unrealized gains or losses on the borrower loans and borrower payment dependent notes on a fair value basis. These amounts are included as a component of other income (expense) in our statement of operations. The total fair value adjustment was $295.4 thousand and $580.1 thousand for the borrower loans and Notes, respectively, resulting in a net unrealized gain of $284.7 thousand for the three months ended March 31, 2011. The total fair value adjustment was $634.7 thousand and $725.4 thousand for the borrower loans and Notes, respectively, resulting in a net unrealized gain of $90.7 thousand for the three months ended March 31, 2010.
Insurance recoveries
During the first quarter of 2011 the Superior Court of California issued a final statement of decision finding that Greenwich, our insurance carrier with respect to our class action lawsuit, has a duty to defend the class action lawsuit, and requiring that Greenwich pay Prosper's past and future defense costs in the class action suit. On February 24, 2011, Greenwich made a payment to us in the amount of $1,728,273 to reimburse us for the defense costs we had already incurred in the class action suit. Please see our Note 12 “Commitment and Contingencies” in the notes to our financial statements contained elsewhere in this report for further information related to this payment by our former insurance carrier.
Other Income
Other income consists primarily of credit referral fees, where partner companies pay us an agreed upon amount for referrals of customers from our website. Other income was $22.9 thousand for the three months ended March 31, 2011, an increase of $9.3 thousand, as compared to $13.6 thousand for the three months ended March 31, 2010. The increase in other income for the three months ended March 31, 2010 compared to the three months ended March 31, 2011 was due to the addition of a number of new partners as well as increased traffic to existing credit referral partners which represented the increase in credit referral volume in the first quarter of 2011.
Operating Expenses
Compensation and benefits were $1.6 million for the three months ended March 31, 2011, an increase of $383.4 thousand, as compared to $1.2 million for the three months ended March 31, 2010. This increase was due to the increased employee headcount during the three months March 31, 2011 as compared to the three months ended March 31, 2010, which resulted in increases to salary and wages, payroll taxes, healthcare, accrued vacation, sick and holiday expenses. The overall increase in compensation and benefits was also caused by an increase in contractor and bonus expense, the increase in the amount recognized for stock based compensation and a decrease in the amount of salaries capitalized related to the development of internal use software.
Marketing and advertising costs consist primarily of search engine marketing, online and offline campaigns, marketing promotions, affiliate marketing, public relations and direct mail marketing. Marketing and advertising costs were $518.0 thousand for the three months ended March 31, 2011, an increase of $230.9 thousand, as compared to $287.1 thousand for the three months ended March 31, 2010. This increase was primarily due to the increase in our affiliate programs, public relation, offline marketing and direct mail expenses. During the first quarter of 2011 we have focused our marketing efforts on these avenues in order to increase our investor and borrower volume.
Depreciation and amortization expense was $123.3 thousand for the three months ended March 31, 2011, a decrease of $6.4 thousand, compared to $129.7 thousand for the three months ended March 31, 2010. The decrease was primarily due to assets becoming fully depreciated during the period, however these decreases were partially offset by the capitalization of various internally developed software projects placed in service during 2010.
General and Administrative Expenses
Professional service expenses are comprised of legal expenses, audit and accounting fees, consulting services, and other outside costs. For the three months ended March 31, 2011 were $597.0 thousand, a decrease of $127.2 thousand, compared to $724.2 thousand for the three months ended March 31, 2010. The large decrease in professional services expense was due to decreases in legal expenses related to our class action lawsuit and insurance carrier lawsuit, as discussed above. Legal expenses related to regulatory and compliance matters and other outside costs which primarily consisted of lobbying expenses during 2010 also contributed to the overall decrease in professional services. These decreases were partially offset by increases in consulting, accounting and tax expenses related to an increase in SEC filings for the three months ending March 31, 2011 as compared to the three months ended March 31, 2010.
Facilities and maintenance expenses consist primarily of rents paid for our corporate office lease and data co-location facility, office supply expenses, repairs and maintenance expense and equipment and software costs that did not meet capitalization criteria. Facilities and maintenance expenses for the three months ended March 31, 2011 were $150.2 thousand, a decrease of $13.7 thousand, as compared to $163.9 thousand for the three months ended March 31, 2010. The slight decline in facilities and maintenance expenses is due to a reduction in office supply expense, repairs and maintenance expenses, and a reduction in software costs that did not meet capitalization criteria.
Other general and administrative expenses consist of bank service charges, NASAA state penalty settlement expenses, travel and entertainment expenses, taxes and licenses costs, communications costs, interest expense related to our convertible promissory notes, recruiting costs and other miscellaneous expenses. For the three months ended March 31, 2011, other general administrative expenses were $227.7 thousand, a decrease of $87.6 thousand, as compared to $315.3 thousand for the three months ended March 31, 2010. The decrease in other general administrative expenses from the three months ended March 31, 2010 to the three months ended March 31, 2011 was primarily due to the decrease in expense incurred in the first quarter of 2010 related to our convertible promissory notes which was partially offset by an increase in expenses paid to recruiting services.
Liquidity and Capital Resources
We have incurred operating losses since our inception and we anticipate that we will continue to incur net losses through the end of 2011. We had negative cash flows from operations of $1.2 million and $2.0 million for the three months ended March 31, 2011 and 2010, respectively.
As reflected in the accompanying financial statements, Prosper has incurred net losses and negative cash flows from operations since inception, and has an accumulated deficit of approximately $51.8 million as of March 31, 2011. At March 31, 2011, the Company had approximately $3.2 million in cash and cash equivalents. The Company does not believe that its cash resources are sufficient to sustain its operations through 2011 without obtaining additional financing. Since its inception, Prosper has financed its operations primarily through equity financing from various sources. The Company is dependent upon raising additional capital or debt financing to fund its current operating plan. Failure to obtain sufficient debt and equity financings and, ultimately, to achieve profitable operations and positive cash flows from operations could adversely affect Prosper’s ability to achieve its business objectives and continue as a going concern. Although, the Company does not currently have any agreements in place with respect to any such additional financing or strategic opportunity, management believes it will secure additional financing in the near future sufficient to meet its ongoing operations and strategic plan through 2011.
Net cash used in operating activities was $1.2 million and $2.0 million for the three months ended March 31, 2011 and 2010, respectively. Net cash used in operating activities was used to fund ongoing operations such as headcount cost, legal and accounting services, marketing expenses and cost of service expenses. The anticipated increase in origination revenue is expected to reduce our on-going cash requirements.
Net cash used in investing activities for the three months ended March 31, 2011 was $7.0 million which consisted of $11.5 million in borrower loans originations offset by $4.5 million in borrower loan principal repayments and purchases of property and equipment of $67.2 thousand.
Net cash provided by financing activities for the three months ended March 31, 2011 was $7.1 million which consisted of proceeds from the issuance of Borrower Payment Dependent Notes of $11.5 million offset by $4.4 million in repayment of Borrower Payment Dependent Notes and proceeds from the exercise of fully vested stock options of $5.0 thousand.
In 2006, we entered into a non-interest bearing promissory note in the amount of $380,000 for the purchase of the “Prosper.com” domain name. As of March 31, 2011 the remaining principal balance remaining on the note was $300,000. We paid a principal payment in the amount of $20,000 in June 2010 with the remaining principal amount of $300,000 due in June 2011.
On November 10, 2009, the Company and QED Fund I, L.P., a Delaware limited partnership (“QED”), entered into a Note and Warrant Purchase Agreement (the “QED Purchase Agreement”), pursuant to which, we issued to QED a Convertible Promissory Note (the “QED Note”) dated as of November 10, 2009. The QED Note had a principal amount of $1,000,000. Interest on the QED Note accrued at a per annum rate of 15.0%. In connection with the consummation of the Series D Financing, the QED Note and all accrued interest thereunder was converted into Series D preferred stock equal to principal and accrued interest of $1,064,521 on the QED Note, plus $300,000 which represented consideration for QED’s agreement to convert the QED Note prior to its maturity date.
In connection with the QED Purchase Agreement, we also issued to QED a fully vested warrant (the “QED Warrant”) to purchase 164,178 shares of our common stock at an exercise price of $0.56 per share. The QED Warrant is exercisable any time from the date of issuance and will expire on November 10, 2014. The Company allocated the QED Note proceeds to the QED Note and QED Warrants based on their relative fair values. The relative fair value attributable to the QED Warrant is $37,740, which was recorded as a discount to the QED Note and a corresponding credit to additional paid-in capital. The remaining debt discount of $34,595 was fully amortized to interest expense upon the conversion of the QED Note.
On February 1, 2010, we entered into a Note and Warrant Purchase Agreement (the “February Bridge Purchase Agreement”) with certain of our existing investors, pursuant to which, we issued and sold to such investors a series of Convertible Promissory Notes (the “February Bridge Notes”) in the aggregate principal amount of $2,000,000. Interest on the February Bridge Notes accrued at a per annum rate of 15.0%. In connection with the consummation of the Series D financing, the principal and accrued interest of $2,060,822 under the February Bridge Notes were converted into Series D preferred stock.
In connection with the February Bridge Purchase Agreement, we issued to the February Bridge Note purchasers fully vested warrants (the “February Bridge Warrants”) to purchase an aggregate of 328,356 shares of our Common Stock at an exercise price of $0.56 per share. The February Bridge Warrants are exercisable any time from the date of issuance and will expire on February 1, 2015. We allocated the February Bridge Note proceeds to the convertible February Bridge Note and February Bridge Warrants based on their relative fair values. The relative fair value attributable to the February Bridge Warrants is $96,625, which was recorded as a discount to the February Bridge Note and a corresponding credit to additional paid-in capital. The debt discount of $96,625 was fully amortized to interest expense upon the conversion of the February Bridge note.
On March 15, 2010, we entered into a Note Option Agreement (the “Larsen Option Agreement”) with Christian A. Larsen, our Chairman and Chief Executive Officer as well as one of our principal stockholders, pursuant to which, Mr. Larsen granted the Company an option (the “Option”) to sell him an aggregate principal amount of up to $300,000 of unsecured Convertible Promissory Notes (the “Larsen Bridge Notes”), in $100,000 increments. On March 22, 2010, we exercised the Option in full and sold to Mr. Larsen, Larsen Bridge Notes in the aggregate principal amount of $300,000. Interest on the Larsen Bridge Notes accrued at a per annum rate of 15.0%. Principal and accrued interest of $303,575 was paid in a single payment on April 19, 2010.
On April 1, 2010, we entered into a Note Purchase Agreement with certain of our existing investors, pursuant to which, we issued and sold an additional series of unsecured Convertible Promissory Notes (the “April Bridge Notes”), dated as of April 1, 2010, in the aggregate principal amount of $250,000. Interest on the April Bridge Notes accrued at a per annum rate of 15.0%. All principal and accrued interest of $251,541 was converted into Series D preferred stock.
On April 15, 2010, we entered into a Stock Purchase Agreement with certain new investors and certain of our existing investors pursuant to which, we issued and sold 20,340,705 shares of the Company’s Series D preferred stock for an aggregate purchase price of $14.7 million.
We have assessed the contingent liability related to prior sales of loans on the platform and have determined that the occurrence of the contingency is reasonably possible but not probable and that contingent liability ranges from $0 in the event the company prevails to a maximum of $47.2 million, which represents the remaining outstanding principal amount of $2.1 million and loans charged off of $45.1 million as of March 31, 2011. For more information, see Note 12 of our financial statements located elsewhere in this report.
Since our inception, inflation and changing prices have not had a material effect on our business and we do not expect that inflation or changing prices will materially affect our business in the foreseeable future.
Income Taxes
We incurred no income tax provision for the three months ended March 31, 2011 and 2010. Given our history of operating losses and inability to achieve profitable operations, it is difficult to accurately forecast how results will be affected by the realization and use of net operating loss carry forwards.
ASC Topic 740, Income Taxes provides for the recognition of deferred tax assets if realization of such assets is more likely than not. Based upon the weight of available evidence, which includes our historical operating performance and the reported cumulative net losses in all prior years, we have provided a full valuation allowance against our net deferred tax assets. We will continue to evaluate the realizability of the deferred tax assets on a quarterly basis.
Off-Balance Sheet Arrangements
As of March 31, 2011, we have not engaged in any off-balance sheet financing activities. We do not have any interest in entities referred to as variable interest entities, which include special purpose entities and other structured finance entities.
Additional Information about the Prosper Marketplace Loan Platform
Prosper Rating
Each listing is assigned a Prosper Rating. The Prosper Rating is a letter that indicates the level of risk associated with a listing and corresponds to an estimated average annualized loss rate range, or loss rate, for the listing. This rating system allows Prosper to maintain consistency when assigning a rating to the listing. There are currently seven Prosper Ratings, but this, as well as the associated loss may change over time as the marketplace dictates.
The Prosper Ratings that were in place as of March 31, 2011 and the associated estimated loss ranges associated with them are as follows:
|
Prosper Rating
|
Est. Avg. Annual Loss Rate
|
|
|
AA
|
0.00% - 1.99 %
|
|
|
A
|
2.00% - 3.99%
|
|
|
B
|
4.00% - 5.99%
|
|
|
C
|
6.00% - 8.99%
|
|
|
D
|
9.00% - 11.99%
|
|
|
E
|
12.00% - 14.99%
|
|
|
HR
|
>=15.00%
|
The loss rate is based on the historical performance of Prosper borrower loans with similar characteristics and is determined by two scores: (1) a custom Prosper score, discussed below, and (2) a credit score obtained from a credit reporting agency (currently, Experian’s Scorex PLUS score). The use of these two scores determines a base loss rate for each listing. This base loss rate is subject to adjustment based on additional factors, such as whether the borrower has previously received a loan on our platform. These adjustments result in an estimated loss rate, which then determines the Prosper Rating.
Recent Loan Originations
The table below shows loan volume and average lender yield by Prosper Rating for originations from July 13, 2009 to March 31, 2011.
|
Prosper Rating
|
Number
|
Amount
|
Average Loan Size
|
Weighted Average Borrower APR
|
||||||||||||
|
AA
|
1,129 | $ | 8,016,000 | $ | 7,100 | 9.28 | % | |||||||||
|
A
|
1,638 | 9,559,269 | 5,836 | 12.60 | % | |||||||||||
|
B
|
905 | 6,981,642 | 7,715 | 16.93 | % | |||||||||||
|
C
|
1,155 | 5,093,538 | 4,410 | 23.71 | % | |||||||||||
|
D
|
2,286 | 9,892,757 | 4,328 | 29.80 | % | |||||||||||
|
E
|
1,099 | 4,032,968 | 3,670 | 35.65 | % | |||||||||||
|
HR
|
1,218 | 3,722,481 | 3,056 | 35.60 | % | |||||||||||
|
Total
|
9,430 | $ | 47,298,656 | $ | 5,016 | 21.25 | % | |||||||||
Historical Performance of Prosper Borrower Loans
The performance of borrower loans is a function of the credit quality of our borrower members and the risk and return preferences of our lender members. Lender members can choose to pursue a variety of bidding strategies, including strategies that may or may not maximize the return on their investment. When making commitment decisions, lender members consider borrowers’ Prosper Rating, credit score, debt-to-income ratios and other credit data and information displayed with listings. Prior to 2009, borrower loans did not have a Prosper Rating. We have assigned a Prosper Rating retroactively to these loans in certain of the following tables in order to provide more meaningful historical performance data. These retroactive Prosper Ratings were assigned based on the credit bureau data available at the time of the loan listing and the Prosper score in place on July 10, 2009. The portions of the historical information below regarding the performance of loans to which we have assigned a Prosper Rating retroactively should not be used in determining how Notes with the same Prosper Rating can be expected to perform in the future.
The following seven graphs show loan performance through March 31, 2011 by delinquency rates and cumulative principal default rates. Loans originated prior to July 13, 2009 were not assigned a Prosper Rating at the time of origination. In order to view performance on a comparable basis, we have retroactively assigned a Prosper Rating to these loans based upon their applicable listing characteristics. The “N/A” category includes loans with a credit score of less than the minimum score now required as well as loans for which we could not generate a Prosper Rating because the credit variables needed to determine the rating were not available.
The graph below shows 1-30 and 31-120 day delinquency rates for loans originated prior to July 13, 2009 by quarter. This graph shows delinquencies as a percentage of total outstanding principal balance. We consider loans more than 30 days past due to be severely delinquent due to the significant decrease in the likelihood of receiving future payment once a loan has missed two payments.
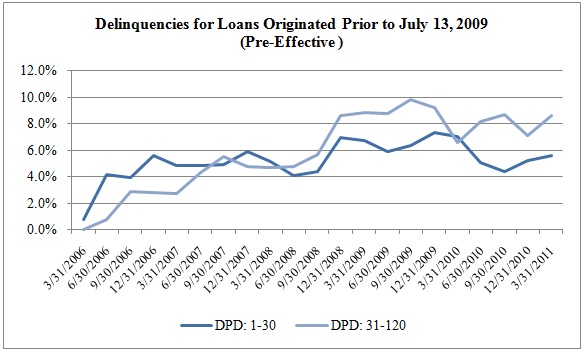
The table below shows 1-30 and 31-120 day delinquency rates by quarter for loans originated between July 13, 2009 and March 31, 2011. This graph shows delinquencies as a percentage of total outstanding principal balance. We consider loans more than 30 days past due to be severely delinquent due to the significant decrease in the likelihood of receiving future payment once a loan has missed two payments.
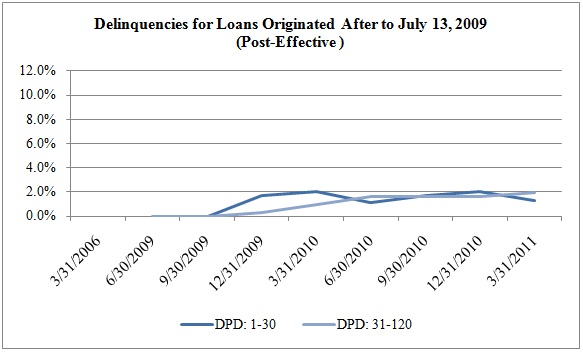
The following graphs show cumulative principal default rates for borrower loans originated by year. The cumulative charge-off rate is calculated as the sum of the cumulative principal balance charged-off divided by the original amount borrowed. The vertical axis shows the percentage of principal charged-off. The horizontal axis shows the age of the loan in monthly cycles. We only include data for a point along the horizontal axis if at least 70% of the original amount borrowed in that vintage has been outstanding for at least that number of cycles. For example, in our graph for Loans Funded During 2009, 70% or more of the original amount borrowed in that vintage has been outstanding for 13 or more cycles, but less than 70% of the original amount borrowed has been outstanding for 14 or more cycles. So, that graph includes a data point for cycle 13 but not for cycle 14.
The following table shows cumulative principal default rates for loans originated from January 1, 2006 to December 31, 2006, as of March 31, 2011. Loans originated during this period cannot be assigned a Prosper Ratings because the requisite credit variables needed to determine the Prosper Score were unavailable.
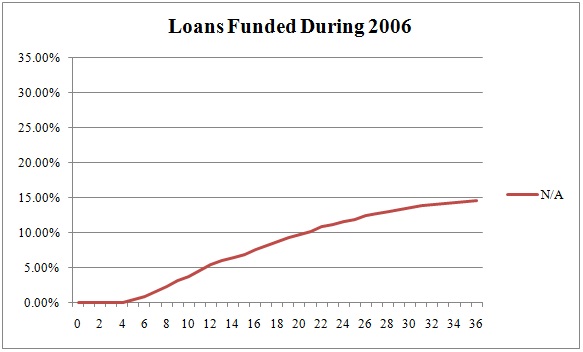
The following table shows cumulative principal default rates for loans originated from January 1, 2007 to December 31, 2007, as of March 31, 2011. The “N/A” category consists of loans originated during this period that cannot be assigned a Prosper Rating because the requisite credit variables needed to determine the Prosper Score were unavailable.
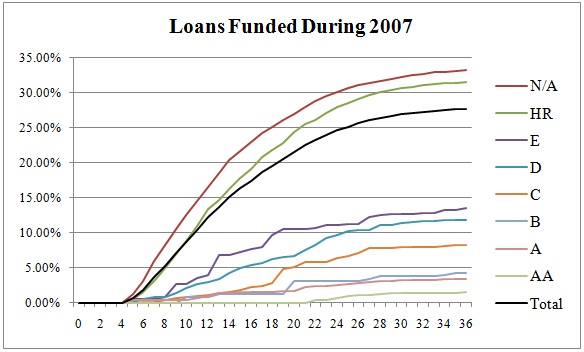
The following table shows cumulative principal default rates for loans originated from January 1, 2008 to December 31, 2008, as of March 31, 2011. The “N/A” category consists of loans originated during this period that cannot be assigned a Prosper Rating because the requisite credit variables needed to determine the Prosper Score were unavailable.
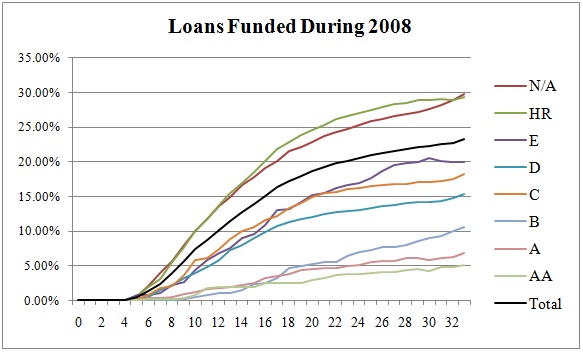
The following table shows cumulative principal default rates for loans originated from January 1, 2009 to December 31, 2009, as of March 31, 2011.
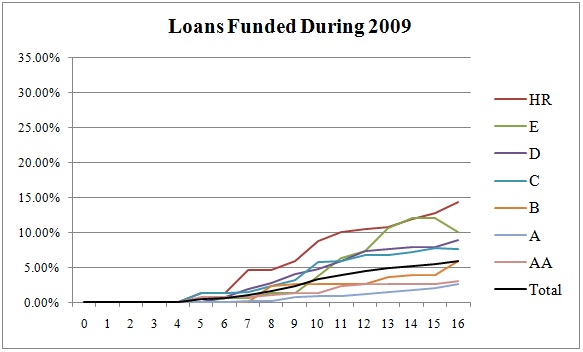
The following table shows cumulative principal default rates for loans originated from January 1, 2010 through June 30, 2010, as of March 31, 2011.

The following table presents additional aggregated information as of March 31, 2011 regarding delinquencies, defaults and borrower payments, grouped by Prosper Rating, for all loans originated on our website from November 2005 through July 12, 2009. With respect to delinquent borrower loans, the table shows the entire amount of the principal remaining due (not just that particular payment) as of March 31, 2011.
| Loan Originations | ||||||||||||||||||||||||||||||||||||
|
November 2005 - July 12th, 2009
|
||||||||||||||||||||||||||||||||||||
|
(as of March 31, 2011)
|
||||||||||||||||||||||||||||||||||||
|
Total Loan Originations
|
Current Loans
|
1-30 Days Past Due
|
||||||||||||||||||||||||||||||||||
|
Prosper Rating
|
Number
|
Amount
|
Number
|
Origination Amount
|
Outstanding Principal
|
Number
|
Origination Amount
|
Outstanding Principal
|
||||||||||||||||||||||||||||
|
AA
|
1,148 | $ | 5,610,741 | 136 | $ | 755,279 | $ | 86,868 | 4 | $ | 40,000 | $ | 5,877 | |||||||||||||||||||||||
|
A
|
1,241 | 6,315,414 | 195 | 1,089,790 | 122,177 | 5 | 33,200 | 4,770 | ||||||||||||||||||||||||||||
|
B
|
319 | 2,254,565 | 47 | 293,250 | 34,473 | - | - | - | ||||||||||||||||||||||||||||
|
C
|
1,448 | 11,287,831 | 265 | 1,804,266 | 221,761 | 9 | 94,818 | 18,627 | ||||||||||||||||||||||||||||
|
D
|
2,048 | 14,156,042 | 365 | 2,277,878 | 289,082 | 21 | 163,600 | 19,687 | ||||||||||||||||||||||||||||
|
E
|
622 | 3,750,560 | 123 | 641,198 | 80,400 | 1 | 7,000 | 480 | ||||||||||||||||||||||||||||
|
HR
|
6,914 | 67,881,305 | 720 | 5,703,532 | 703,706 | 32 | 253,300 | 44,004 | ||||||||||||||||||||||||||||
|
N/A1
|
15,273 | 67,881,166 | 837 | 2,450,039 | 332,449 | 51 | 147,023 | 28,882 | ||||||||||||||||||||||||||||
| 29,013 | 179,137,624 | 2,688 | $ | 15,015,232 | $ | 1,870,916 | 123 | $ | 738,941 | $ | 122,327 | |||||||||||||||||||||||||
|
avg loan size:
|
$ | 6,174 | ||||||||||||||||||||||||||||||||||
|
percent of total
|
9.3 | % | 8.4 | % | 0.4 | % | 0.4 | % | ||||||||||||||||||||||||||||
|
Paid In Full
|
31+ Days Past Due
|
Defaulted 2
|
||||||||||||||||||||||||||||||||||
|
Prosper Rating
|
Number
|
Origination Amount
|
Number
|
Origination Amount
|
Outstanding Principal
|
Number
|
Origination Amount
|
Net Charged Off Principal
|
||||||||||||||||||||||||||||
|
AA
|
963 | $ | 4,431,508 | 2 | $ | 14,000 | $ | 2,581 | 41 | $ | 361,954 | $ | 199,676 | |||||||||||||||||||||||
|
A
|
923 | 4,534,874 | 4 | 21,100 | 4,229 | 111 | 630,700 | 345,168 | ||||||||||||||||||||||||||||
|
B
|
234 | 1,665,815 | 2 | 9,500 | 2,080 | 36 | 286,000 | 158,208 | ||||||||||||||||||||||||||||
|
C
|
875 | 6,632,313 | 10 | 85,100 | 18,893 | 280 | 2,600,234 | 1,629,657 | ||||||||||||||||||||||||||||
|
D
|
1,219 | 8,523,975 | 12 | 74,750 | 18,062 | 428 | 3,108,039 | 1,949,748 | ||||||||||||||||||||||||||||
|
E
|
337 | 1,967,837 | 4 | 29,000 | 4,919 | 156 | 1,104,525 | 689,069 | ||||||||||||||||||||||||||||
|
HR
|
3,246 | 30,153,472 | 64 | 559,198 | 95,575 | 2,840 | 30,999,603 | 20,857,124 | ||||||||||||||||||||||||||||
|
N/A1
|
7,787 | 35,478,509 | 65 | 182,757 | 42,505 | 6,486 | 29,351,286 | 19,465,694 | ||||||||||||||||||||||||||||
| 15,584 | $ | 93,388,303 | 163 | $ | 975,405 | $ | 188,845 | 10,378 | $ | 68,442,342 | $ | 45,294,344 | ||||||||||||||||||||||||
|
percent of total
|
53.7 | % | 52.1 | % | 0.6 | % | 0.5 | % | 35.8 | % | 38.2 | % | ||||||||||||||||||||||||
|
Repurchased
|
Default due to Delinquency:
|
|||||||||||||||||||||||||||||||||||
|
Prosper Rating
|
Number
|
Origination Amount
|
9,229 | $ | 39,853,113 | |||||||||||||||||||||||||||||||
|
AA
|
2 | $ | 8,000 | |||||||||||||||||||||||||||||||||
|
A
|
3 | 5,750 | ||||||||||||||||||||||||||||||||||
|
B
|
- | - |
Default due to Bankruptcy3 :
|
|||||||||||||||||||||||||||||||||
|
C
|
9 | 71,100 | 1,149 | $ | 5,441,231 | |||||||||||||||||||||||||||||||
|
D
|
3 | 7,800 | ||||||||||||||||||||||||||||||||||
|
E
|
1 | 1,000 | ||||||||||||||||||||||||||||||||||
|
HR
|
12 | 212,200 | ||||||||||||||||||||||||||||||||||
|
N/A1
|
47 | 271,552 | ||||||||||||||||||||||||||||||||||
| 77 | $ | 577,402 | ||||||||||||||||||||||||||||||||||
|
percent of total
|
0.3 | % | 0.3 | % | ||||||||||||||||||||||||||||||||
|
1
|
includes loans with Credit Score<640 or insufficient credit data to determine Prosper Rating
|
||||||
|
2
|
includes all loans >120 days past due
|
||||||
|
3
|
Only includes loans where the bankruptcy notification date is prior to the date the loan became 121 days past due. If we were notified of a bankruptcy after the loan reached 121 days past due, it is included in the "Default due to Delinquency" totals.
|
||||||
From November 2005 through July 12, 2009, we facilitated 29,013 borrower loans with an average original principal amount of $6,174 and an aggregate original principal amount of $179,137,624. As of March 31, 2011, 9.3% of the borrower loans were current, 53.7% were paid in full, 0.4% were 1 to 30 days past due, 0.6% were more than 30 days past due, and 35.8% had defaulted. A borrower loan is considered to have defaulted when it is more than 120 days past due or has been discharged in bankruptcy. Of these 29,013 borrower loans, 13,287 loans, or 46%, have been greater than 15 days past due at any time, 12,211 loans, or 42%, have been more than 30 days past due at any time, and 11,488 or 40%, have been more than 60 days past due at any time. We repurchased a total of 77 of these loans, with an aggregate original principal amount of $577,402 (0.3% of total), due to identification theft or operational issues.
Of loans originated prior to July 13, 2009, 10,378 had defaulted as of March 31, 2011, equaling a total net defaulted amount of $45,294,344. Of these 10,378 defaulted loans, the borrowers of 1,149 of the loans have filed for bankruptcy, resulting in a net defaulted amount of $5,441,231.
The following table presents additional aggregated information as of March 31, 2011, grouped by Prosper Rating, for all loans originated on our website from July 13, 2009 through March 31, 2011. With respect to delinquent borrower loans, the table shows the entire amount of the principal remaining due (not just that particular payment) as of March 31, 2011.
| Loan Originations | ||||||||||||||||||||||||||||||||||||
|
July 13, 2009 - March 31, 2011
|
||||||||||||||||||||||||||||||||||||
|
(as of March 31, 2011)
|
||||||||||||||||||||||||||||||||||||
|
Total Loan Originations
|
Current Loans
|
1-30 Days Past Due
|
||||||||||||||||||||||||||||||||||
|
Prosper Rating
|
Number
|
Amount
|
Number
|
Origination Amount
|
Outstanding Principal
|
Number
|
Origination Amount
|
Outstanding Principal
|
||||||||||||||||||||||||||||
|
AA
|
1,129 | $ | 8,016,000 | 893 | $ | 6,650,703 | $ | 5,119,132 | 4 | $ | 43,000 | $ | 36,155 | |||||||||||||||||||||||
|
A
|
1,638 | 9,559,269 | 1,364 | 8,294,702 | 6,210,371 | 13 | 49,000 | 34,735 | ||||||||||||||||||||||||||||
|
B
|
905 | 6,981,642 | 805 | 6,279,815 | 5,430,208 | 9 | 47,100 | 35,908 | ||||||||||||||||||||||||||||
|
C
|
1,155 | 5,093,538 | 892 | 3,860,115 | 2,968,350 | 21 | 82,225 | 62,057 | ||||||||||||||||||||||||||||
|
D
|
2,286 | 9,892,757 | 1,889 | 8,409,019 | 7,342,788 | 37 | 179,200 | 142,612 | ||||||||||||||||||||||||||||
|
E
|
1,099 | 4,032,968 | 881 | 3,320,303 | 2,946,070 | 27 | 91,950 | 76,677 | ||||||||||||||||||||||||||||
|
HR
|
1,218 | 3,722,481 | 946 | 2,840,874 | 2,362,554 | 21 | 60,800 | 53,886 | ||||||||||||||||||||||||||||
| 9,430 | $ | 47,298,656 | 7,670 | $ | 39,655,532 | $ | 32,379,473 | 132 | $ | 553,275 | $ | 442,030 | ||||||||||||||||||||||||
|
avg loan size:
|
$ | 5,016 | ||||||||||||||||||||||||||||||||||
|
percent of total
|
81.3 | % | 83.8 | % | 1.4 | % | 1.2 | % | ||||||||||||||||||||||||||||
|
Paid In Full
|
31+ Days Past Due
|
Defaulted 1
|
||||||||||||||||||||||||||||||||||
|
Prosper Rating
|
Number
|
Origination Amount
|
Number
|
Origination Amount
|
Outstanding Principal
|
Number
|
Origination Amount
|
Net Charged Off Principal
|
||||||||||||||||||||||||||||
|
AA
|
218 | $ | 1,187,897 | 5 | $ | 54,000 | $ | 41,864 | 9 | $ | 80,400 | $ | 69,545 | |||||||||||||||||||||||
|
A
|
206 | 976,080 | 21 | 95,700 | 72,606 | 34 | 143,787 | 116,872 | ||||||||||||||||||||||||||||
|
B
|
74 | 513,677 | 4 | 57,500 | 53,481 | 13 | 83,550 | 70,604 | ||||||||||||||||||||||||||||
|
C
|
183 | 830,648 | 14 | 95,300 | 81,459 | 45 | 225,250 | 199,531 | ||||||||||||||||||||||||||||
|
D
|
233 | 859,079 | 49 | 168,599 | 145,035 | 78 | 276,860 | 231,552 | ||||||||||||||||||||||||||||
|
E
|
119 | 376,255 | 27 | 117,375 | 111,021 | 45 | 127,085 | 108,884 | ||||||||||||||||||||||||||||
|
HR
|
142 | 461,955 | 45 | 160,999 | 144,796 | 64 | 197,853 | 182,452 | ||||||||||||||||||||||||||||
| 1,175 | $ | 5,205,591 | 165 | $ | 749,473 | $ | 650,262 | 288 | $ | 1,134,785 | $ | 979,440 | ||||||||||||||||||||||||
|
percent of total
|
12.5 | % | 11.0 | % | 1.7 | % | 1.6 | % | 3.1 | % | 2.4 | % | ||||||||||||||||||||||||
|
Repurchased
|
Default due to Delinquency:
|
|||||||||||||||||||||||||||||||||||
|
Prosper Rating
|
Number
|
Origination Amount
|
255 | $ | 881,603 | |||||||||||||||||||||||||||||||
|
AA
|
- | - | ||||||||||||||||||||||||||||||||||
|
A
|
- | - | ||||||||||||||||||||||||||||||||||
|
B
|
- | - |
Default due to Bankruptcy2 :
|
|||||||||||||||||||||||||||||||||
|
C
|
- | - | 33 | $ | 97,837 | |||||||||||||||||||||||||||||||
|
D
|
- | - | ||||||||||||||||||||||||||||||||||
|
E
|
- | - | ||||||||||||||||||||||||||||||||||
|
HR
|
- | - | ||||||||||||||||||||||||||||||||||
| - | - | |||||||||||||||||||||||||||||||||||
|
percent of total
|
0.0 | % | 0.0 | % | ||||||||||||||||||||||||||||||||
|
1
|
includes all loans >120 days past due
|
||||||
|
2
|
Only includes loans where the bankruptcy notification date is prior to the date the loan became 121 days past due. If we were notified of a bankruptcy after the loan reached 121 days past due, it is included in the "Default due to Delinquency" totals.
|
||||||
From July 13, 2009 through March 31, 2011, Prosper facilitated 9,430 borrower loans with an average original principal amount of $5,016 and an aggregate original principal amount of $47,298,656. As of March 31, 2011, 81.3% of the borrower loans were current or had not reached their first billing cycle and 12.5% were paid in full, 1.4% were 1 to 30 days past due, 1.7% were more than 30 days past due, and 3.1% had defaulted. A borrower loan is considered to have defaulted when it is more than 120 days past due or has been discharged in bankruptcy. Of these 9,430 borrower loans, 707 loans, or 7%, have been greater than 15 days past due at any time, 511 loans, or 5%, have been more than 30 days past due at any time, and 406 or 4%, have been more than 60 days past due at any time.
Of loans originated after July 13, 2009, 288 have defaulted as of March 31, 2011, equaling a total net defaulted amount of $979,440. Of these 288 defaulted loans, the borrowers of 33 of the loans have filed for bankruptcy, resulting in a net defaulted amount of $97,837.
Because of our limited operating history, the data in the preceding tables regarding loss experience may not be representative of the loss experience that will develop over time as additional borrower loans are originated through our platform and the borrower loans already originated through our platform have longer payment histories. In addition, because of our limited operating history, the data in the preceding tables regarding prepayments may not be representative of the prepayments we expect over time; as additional borrower loans are originated through our platform and the borrower loans already originated through our platform have longer payment histories.
The following table presents aggregate information, as of March 31, 2011 on the results of our collection efforts for loans originated prior to July 13, 2009 that became more than 30 days past due at any time, grouped by Prosper Rating. For purposes of this analysis, we have excluded the 77 loans that we repurchased due to identity theft or operational issues.
|
Prosper Rating
|
Loans In Collections
|
Origination Amount
|
Aggregate Amount Sent to Collections
|
Gross Amount Collected on Accounts sent to Collections
|
Number of Loans Charged-off
|
Gross Aggregate Principal Balance of Loans Charged-Off
|
Gross Amount Recovered on Loans Charged-Off
|
Net Aggregate Charge-Off
|
||||||||||||||||||||||||
|
AA
|
54 | $ | 442,054 | $ | 28,545 | $ | 24,845 | 41 | $ | 210,296 | $ | 10,620 | $ | 199,676 | ||||||||||||||||||
|
A
|
145 | 808,233 | 52,769 | 37,460 | 111 | 372,373 | 27,205 | 345,168 | ||||||||||||||||||||||||
|
B
|
44 | 336,300 | 22,091 | 7,917 | 36 | 161,824 | 3,615 | 158,208 | ||||||||||||||||||||||||
|
C
|
335 | 3,083,477 | 208,018 | 143,184 | 280 | 1,718,020 | 88,364 | 1,629,657 | ||||||||||||||||||||||||
|
D
|
518 | 3,787,210 | 259,491 | 184,946 | 428 | 2,045,588 | 95,840 | 1,949,748 | ||||||||||||||||||||||||
|
E
|
177 | 1,231,124 | 88,321 | 48,843 | 156 | 730,612 | 41,544 | 689,069 | ||||||||||||||||||||||||
|
HR
|
3,177 | 34,489,952 | 2,492,616 | 1,443,547 | 2840 | 21,689,454 | 832,330 | 20,857,124 | ||||||||||||||||||||||||
|
N/A1
|
7,245 | 32,756,527 | 2,460,711 | 1,538,183 | 6486 | 20,724,559 | 1,258,865 | 19,465,694 | ||||||||||||||||||||||||
|
Total
|
11,695 | $ | 76,934,878 | $ | 5,612,562 | $ | *3,428,924 | 10,378 | $ | 47,652,726 | $ | 2,358,383 | $ | 45,294,344 | ||||||||||||||||||
|
* This amount excludes collection agency payments that were subsequently returned by the bank
|
||||||||||||||||||||||||||||||||
| 1 includes loans with Credit Score<640 or insufficient credit data to determine Prosper Rating | ||||||||||||||||||||||||||||||||
The following table presents aggregate information, as of March 31, 2011 regarding the results of our collection efforts for loans originated after July 13, 2009 that became more than 30 days past due at any time, grouped by Prosper Rating.
|
Prosper Rating
|
Loans In Collections
|
Origination Amount
|
Aggregate Amount Sent to Collections
|
Gross Amount Collected on Accounts sent to Collections
|
Number of Loans Charged-off
|
Gross Aggregate Principal Balance of Loans Charged-Off
|
Gross Amount Recovered on Loans Charged-Off
|
Net Aggregate Charge-Off
|
||||||||||||||||||||||||
|
AA
|
20 | $ | 154,400 | $ | 10,168 | $ | 4,052 | 9 | $ | 69,545 | $ | - | $ | 69,545 | ||||||||||||||||||
|
A
|
69 | 298,012 | 19,411 | 5,264 | 34 | 120,340 | 3,468 | 116,872 | ||||||||||||||||||||||||
|
B
|
21 | 162,550 | 11,279 | 2,860 | 13 | 71,527 | 923 | 70,604 | ||||||||||||||||||||||||
|
C
|
79 | 377,975 | 29,054 | 14,566 | 45 | 202,614 | 3,083 | 199,531 | ||||||||||||||||||||||||
|
D
|
155 | 542,209 | 44,536 | 22,222 | 78 | 234,936 | 3,384 | 231,552 | ||||||||||||||||||||||||
|
E
|
87 | 290,855 | 25,621 | 8,019 | 45 | 117,166 | 8,282 | 108,884 | ||||||||||||||||||||||||
|
HR
|
128 | 405,102 | 35,920 | 15,115 | 64 | 184,651 | 2,199 | 182,452 | ||||||||||||||||||||||||
|
Total
|
559 | $ | 2,231,103 | $ | 175,990 | $ | *72,098 | 288 | $ | 1,000,779 | $ | 21,339 | $ | 979,440 | ||||||||||||||||||
| * This amount excludes collection agency payments that were subsequently returned by the bank | ||||||||||||||||||||||||||||||||
Prosper has not altered the terms or made any principal reductions on any loans prior to charge-off except as required by law (such as in situations where the Servicemembers’ Civil Relief Act requires interest rates to be reduced to 6% while a borrower in the armed forces is on active duty). In order to comply with the Servicemembers’ Civil Relief Act, Prosper has elected to make “pre-refunds” of the interest differential to the affected borrower for the period of deployment. The borrower then continues to make their regular payments. In these cases, Prosper has refunded the interest to the borrower from Prosper’s own funds and, as a result, the payments received by the applicable lenders are unchanged.
Not applicable for smaller reporting companies.
We establish and maintain disclosure controls and procedures that are designed to ensure that information required to be disclosed in our Exchange Act reports is recorded, processed, summarized and reported within the time periods specified in the SEC’s rules and forms and that such information is accumulated and communicated to our management, including our Chief Executive Officer and our Chief Financial Officer and Chief Operating Officer, as appropriate, to allow for timely decisions regarding required disclosure. In designing and evaluating the disclosure controls and procedures, we recognize that any controls and procedures, no matter how well designed and operated, can provide only reasonable assurance of achieving the desired control objectives, and we are required to apply our judgment in evaluating the cost-benefit relationship of possible controls and procedures.
As required by Exchange Act Rule 15d-15(b), we carried out an evaluation, under the supervision and with the participation of our management, including our Chief Executive Officer and our Chief Financial Officer and Chief Operating Officer, of the effectiveness of the design and operation of our disclosure controls and procedures as of the end of the fiscal quarter covered by this report. Based on the foregoing, our Chief Executive Officer and our Chief Financial Officer and Chief Operating Officer, have concluded that our disclosure controls and procedures were effective at the reasonable assurance level.
There has been no change in our internal control over financial reporting during our most recent fiscal quarter that has materially affected, or is reasonably likely to materially affect, our internal control over financial reporting.
PART II. OTHER INFORMATION
The discussion of the NASAA settlement agreement and the class action lawsuit set forth in “Note 12 Commitment and Contingencies” of the Notes to the Financial Statements contained in Part I, Item 1 of this report is incorporated herein by reference. From time to time, we may be involved in various legal proceedings arising in the ordinary course of our business. While any litigation contains an element of uncertainty, management believes that the outcome of all pending legal proceedings will not have a material adverse effect on our results of operation or financial position. However, because of the nature and inherent uncertainties of litigation, should the outcome of any legal actions be unfavorable, we may be required to pay damages and other expenses, which could have a material adverse effect on our financial position and results of operations. We are not currently subject to any other material legal proceedings. Except for the above matters, we are not aware of any litigation matters which have had, or are expected to have, a material adverse effect on us.
The discussion in this Quarterly Report on Form 10-Q should be read together with the risk factors contained in Part 1, Item 1A, “Risk Factors,” of our Annual Report on Form 10-K for the fiscal year ended December 31, 2010. These risk factors describe various risks and uncertainties. These risks and uncertainties have the potential to affect our business, financial condition, results of operations, cash flows, strategies or prospects in a material and adverse manner. In addition, these risks could have a material adverse effect on the value of the Notes you purchase and could cause you to lose all or part of your initial purchase price or future principal and interest payments you expect to receive. You should also refer to the individual borrower profiles and borrower credit information provided on our platform.
In addition, you should consider the following:
Some of the borrowers on our platform have “subprime” credit ratings, are considered higher than average credit risks, and may present a high risk of loan delinquency or default.
Some of the borrowers on our platform are people who have had difficulty obtaining loans from other sources, including banks and other financial institutions on favorable terms, or on any terms at all, due to credit problems, limited credit histories, adverse financial circumstances, or high debt-to-income ratios. Therefore, acquiring Notes that are dependent on payments we receive on the corresponding borrower loans of such borrowers may present a high risk of loan delinquency or default. From our inception in November 2005 through July 12, 2009, we facilitated 29,013 borrower loans with an average original principal amount of $6,174 and an aggregate original principal amount of $179,137,624 on our platform. Of these 29,013 loans, a total of 77 loans were repurchased by Prosper due to identify theft or operational issues. As of March 31, 2011, of the 29,013 borrower loans, 9.3% were current, 53.7% were paid in full, 0.4% were 1 to 30 days late, and 0.6% were more than 30 days late. In addition, of these 29,013 loans:
|
·
|
13,287 loans, or 46%, have been more than 15 days past due on at least one occasion;
|
|
·
|
12,211 loans, or 42%, have been more than 30 days past due on at least one occasion;
|
|
·
|
11,488 loans, or 40% have been more than 60 days past due on at least one occasion;
|
|
·
|
10,378 loans or 36% had defaulted (a borrower loan is considered to have defaulted when it is more than 120 days past due or has been discharged in bankruptcy).
|
From July 13, 2009 to March 31, 2011, we facilitated 9,430 borrower loans with an average original principal amount of $5,016 and an aggregate original principal amount of $47,298,656 on our platform.
There have been no repurchases by Prosper due to identity theft or operational issues during that timeframe. As of March 31, 2011, of these 9,430 borrower loans, 81.3% were current or had not reached their first billing cycle, 12.5% were paid in full, 1.4% were 1-30 days past due, and 1.7% were more than 31 days past due. In addition, of these 9,430 loans:
|
·
|
707 loans, or 7%, have been more than 15 days past due on at least one occasion;
|
|
·
|
511 loans, or 5%, have been more than 30 days past due on at least one occasion;
|
|
·
|
406 loans, or 4% have been more than 60 days past due on at least one occasion;
|
|
·
|
288 loans or 3.1% had defaulted (a borrower loan is considered to have defaulted when it is more than 120 days past due or has been discharged in bankruptcy).
|
Selected historical loss rates on the Notes can be found in Part 1, Item 2 of this report under "Historical Information about Our Prosper Borrower Members and Outstanding Borrower Loans.” There can be no assurance that such historical loss rates will be indicative of future loss rates or the likelihood of the delinquency or default by a borrower under a borrower loan upon which a series of Notes is dependent for payment.
If payments on the corresponding borrower loans relating to the Notes become more than 30 days overdue, it is likely that purchasers of such Notes will not receive the full principal and interest payments that they expect to receive on the Notes, and they may not recover any of their original purchase price.
If a borrower fails to make a required payment on a borrower loan within 30 days of the due date, we will pursue reasonable collection efforts in respect of the borrower loan. Referral of a delinquent borrower loan to a collection agency within five (5) business days after it becomes thirty days past due will be considered reasonable collection efforts. From our inception in November 2005 through July 12, 2009, we facilitated 29,013 borrower loans. A total of 77 loans were repurchased by Prosper due to identity theft or operational issues with respect to the 29,013 borrower loans. With respect to these 29,013 borrower loans as of March 31, 2011:
|
·
|
0.4% were 1 to 30 days late and 46% had been more than 15 days past due on at least one occasion; and
|
|
·
|
0.6% were more than 30 days late and 42% had been more than 30 days past due on at least one occasion.
|
From July 13, 2009 to March 31, 2011, we facilitated 9,430 borrower loans. Of these 9,430 borrower loans, there were no loans repurchased by Prosper due to identity theft or operational issues, as of March 31, 2011. With respect to these 9,430 borrower loans as of March 31, 2011:
|
·
|
1.4% were 1 to 30 days late and 7% had been more than 15 days past due on at least one occasion; and
|
|
·
|
1.7% were more than 30 days late and 5% had been more than 30 days past due on at least one occasion.
|
If we refer a borrower loan to a collection agency, Prosper will not have any other obligation to attempt to collect that borrower loan. We may also handle collection efforts in respect of a delinquent borrower loan directly. If payment amounts on a delinquent borrower loan are received from a borrower more than 30 days after their due date, if the delinquent loan is referred to an outside collection agency, that collection agency will retain a percentage of any funds recovered from such borrower as a servicing fee before any principal or interest becomes payable to lender members from recovered amounts in respect of Notes related to the corresponding borrower loan. Collection fees range from 17% to 30% of recovered amounts.
Neither Prosper nor the collection agency may be able to recover some or all of the unpaid balance of a non-performing borrower loan, and a lender member who has purchased a Note dependent for payment on the non-performing borrower loan would then receive nothing or a small fraction of the unpaid principal and interest payable under the Note. A lender member must rely on the collection efforts of Prosper or the applicable collection agency to which such borrower loans are referred. No lender member is permitted to attempt to collect payments on the borrower loans in any manner.
We face a contingent liability for securities law violations in respect of loans sold to our lender members from inception until October 16, 2008. This contingent liability may impair our ability to operate our platform and service the borrower loans that correspond to the Notes.
Loans sold to lender members through our platform from our inception until October 16, 2008 may be viewed as involving an offering of securities that was not registered or qualified under federal or state securities laws. To date, the following litigation has resulted from our prior operations.
| · |
|
In November of 2008, the SEC instituted cease and desist proceedings, pursuant to Section 8A of the Securities Act, against us. In connection with such proceedings, we agreed to a settlement with the SEC and consented to the entry of a Cease and Desist order, in which we neither admitted nor denied liability, which was approved by the SEC on November 20, 2008. The Cease and Desist order included a finding that we violated the registration requirements of the Securities Act, and required that we cease and desist from committing or causing any violations or any future violations.
|
|
·
|
|
On November 26, 2008, Prosper and the North American Securities Administrators Association, or “NASAA,” executed a settlement term sheet. The term sheet sets forth the material terms of a consent order to resolve matters relating to our sale and offer of unregistered securities and the omission of material facts in connection with such offers and sales. NASAA has recommended that each state adopt the terms of the settlement, however, the settlement is not binding on any state. The terms of the settlement involve our payment of up to $1 million, which NASAA has allocated among the 50 states and the District of Columbia, based on our loan sale transaction volume in each state prior to November 24, 2008. We will not be required to pay any portion of the fine allocated to those states that do not execute a consent order with Prosper. The terms of the settlement require the states to terminate their investigation of our activities related to the sale of securities before November 24, 2008. If a state does not elect to participate in the NASAA settlement, such state would not be prevented from pursuing its own remedies in connection with our sale of securities before November 24, 2008. On April 21, 2009, we reached agreement with NASAA on the final terms of the consent order for consideration by the states. As of March 31, 2011 and December 31, 2010, the Company had accrued approximately $282,000 and $284,000, respectively, in connection with this contingent liability in accordance with ASC Topic 450 “Contingencies”. As of March 31, 2011, the Company has entered into 32 consent order agreements and has paid an aggregate of $431,663 in penalties.
|
|
·
|
|
On November 26, 2008, plaintiffs, Christian Hellum, William Barnwell and David Booth, individually and on behalf of all other plaintiffs similarly situated, filed a class action lawsuit against us, and certain of our executive officers and directors in the Superior Court of California, County of San Francisco, California. The suit was brought on behalf of all loan note purchasers in our online lending platform from January 1, 2006 through October 14, 2008. The lawsuit alleges that Prosper offered and sold unqualified and unregistered securities in violation of the California and federal securities laws. The lawsuit seeks class certification, damages and the right of rescission against Prosper and the other named defendants, as well as treble damages against Prosper and the award of attorneys’ fees, experts’ fees and costs, and pre-judgment and post-judgment interest.
Some of the individual defendants filed a demurrer to the First Amended Complaint, which was heard on June 11, 2009 and sustained by the court with leave to amend until July 10, 2009. The plaintiffs filed a Second Amended Complaint on July 10, 2009, to which the same individual defendants demurred. On September 15, 2009, this demurrer was sustained by the court without leave to amend. On February 25, 2011, the plaintiffs filed a Third Amended Complaint, which removed David Booth as a plaintiff and added Brian Russom and Michael Del Greco as plaintiffs. The new plaintiffs are representing the same putative class and prosecuting the same claims as the previously named plaintiffs.
Prosper’s insurance carrier with respect to the class action lawsuit, Greenwich Insurance Company (“Greenwich”), has denied coverage. On August 21, 2009, Prosper filed suit against Greenwich in the Superior Court of California, County of San Francisco, California. The lawsuit seeks a declaration that Prosper is entitled to coverage under its policy with Greenwich for losses arising out of the class action lawsuit as well as damages and the award of attorneys’ fees and pre-judgment and post-judgment interest.
On January 26, 2011, the court issued a final statement of decision finding that Greenwich has a duty to defend the class action lawsuit, and requiring that Greenwich pay Prosper's past and future defense costs in the class action suit up to $2 million. On February 24, 2011, Greenwich made a payment to Prosper in the amount of $1,728,273 to reimburse Prosper for the defense costs it had already incurred in the class action suit. Greenwich is required to reimburse Prosper for up to an additional $271,727 in defense costs for the class action suit going forward. Each such reimbursement will be due within 30 days of Prosper incurring any such costs and presenting the applicable invoice to Greenwich. Greenwich is also required to pay Prosper pre-judgment interest on the defense costs incurred by Prosper in the class action suit prior to the Court’s decision. The amount of this pre-judgment interest is $164,828. Greenwich will be required to make this pre-judgment interest payment to Prosper when a final judgment has been entered in the insurance suit.
We intend to vigorously defend the class action lawsuit and vigorously prosecute our suit against Greenwich. We cannot, however, presently determine or estimate the final outcome of either lawsuit, and there can be no assurance that either matter will be finally resolved in our favor. If the class action lawsuit is not resolved in our favor, we might be obliged to pay damages, and might be subject to such equitable relief as a court may determine. If our lawsuit against Greenwich is not resolved in our favor, we might not be able to recover proceeds from Greenwich that are sufficient to offset any losses we incur in the class action lawsuit.
|
As a result of our prior operations, a lender member who holds a loan originated on our platform prior to October 15, 2008 may be entitled to rescind her purchase and be paid the unpaid principal amount of her borrower loan, plus statutory interest. The aggregate principal amount of loans we originated on our platform from inception through October 14, 2008 by non affiliated purchasers is $178.0 million ($179.1 million total originations). Of this amount, as of March 31, 2011, $45.1 million had defaulted ($45.3 million total defaulted), and $2.1 million remained outstanding ($2.2 million total remained outstanding). Prosper is potentially liable for the remaining outstanding principal amount if the current borrowers stop making payments. We have not recorded an accrued loss contingency in respect of this contingent liability, although we intend to continue to monitor the situation. Generally, the federal statute of limitations for noncompliance with the requirement to register securities under the Securities Act is one year from the violation; however, the statute of limitations periods under state laws may extend for a longer period of time. If a significant number of our lender members sought rescission, or if the class action securities lawsuit is successful, our ability to maintain our platform and service the borrower loans to which the Notes correspond may be adversely affected.
We have incurred operating losses since our inception and we anticipate that we will continue to incur net losses through at least 2011.
Our failure to obtain sufficient debt and equity financings and, ultimately, to achieve profitable operations and positive cash flows from operations could adversely affect Prosper’s ability to achieve its business objectives and continue as a going concern.
We have incurred operating losses since our inception and we anticipate that we will continue to incur net losses for a number of years as we grow our business. For the three months ended March 31, 2011 and 2010 we had negative cash flows from operations of $1.2 million and $2.0 million, respectively. Additionally, since our inception through March 31, 2011, we have an accumulated deficit of $51.8 million.
We have financed our operations to date primarily with proceeds from the sale of equity securities. At March 31, 2011, we had approximately $3.2 million in unrestricted cash and cash equivalents. We are dependent upon raising additional capital or debt financing to fund our current operating plan. Our failure to obtain sufficient debt and equity financings and, ultimately, to achieve profitable operations and positive cash flows from operations could adversely affect our ability to achieve our business objectives and continue as a going concern. Further, an unfavorable outcome of the class action lawsuit at the high end of the range could hinder Prosper’s ability to continue operations, absent other extenuating circumstances. Further, we can provide no assurances as to the availability or terms upon which the required financing and capital might be available.
The Company has assessed the contingent liability related to prior sales of loans on the platform and has determined that the occurrence of the contingency is reasonably possible but not probable and that contingent liability ranges from $0 in the event the company prevails to a maximum of $47.2 million, which represents the remaining outstanding principal amount of $2.1 million and loans charged off of $45.1 million as of March 31, 2011.
Our platform represents a novel approach to borrowing and lending that may fail to comply with federal and state securities laws, borrower protection laws, such as state lending laws, federal consumer protection laws, such as the Truth in Lending Act, the Equal Credit Opportunity Act, the Fair Credit Reporting Act and the Fair Debt Collection Practices Act, and the state counterparts to such consumer protection laws. Borrowers may make counterclaims regarding the enforceability of their obligations under borrower or consumer protection laws after collection actions have commenced, or otherwise seek damages under these laws. Lenders may attempt to rescind their Note purchases under securities laws. Compliance with such regulatory regimes is also costly and burdensome.
Our platform operates a novel program that must comply with regulatory regimes applicable to consumer credit transactions as well as with regulatory regimes applicable to securities transactions. The novelty of our platform means compliance with various aspects of such laws is untested. Certain state laws generally regulate interest rates and other charges and require certain disclosures, and also require licensing for certain activities. In addition, other state laws, public policy and general principles of equity relating to
the protection of consumers, unfair and deceptive practices and debt collection practices may apply to the origination, servicing and collection of borrower loans on our platform. Our platform is also subject to other laws, such as:
|
·
|
the Federal Truth-in-Lending Act and Regulation Z promulgated thereunder, which require certain disclosures to borrowers regarding the terms of their loans;
|
|
·
|
the Federal Equal Credit Opportunity Act and Regulation B promulgated thereunder, which prohibit discrimination in the extension of credit on the basis of age, race, color, sex, religion, marital status, national origin, receipt of public assistance or the exercise of any right under the Consumer Credit Protection Act;
|
|
·
|
the Federal Fair Credit Reporting Act, which regulates the use and reporting of information related to each borrower member’s credit history;
|
|
·
|
the Federal Fair Debt Collection Practices Act, which regulate debt collection practices by “debt collectors” and prohibit debt collectors from engaging in certain practices in collecting, and attempting to collect, outstanding consumer loans;
|
|
·
|
state counterparts to the above consumer protection laws; and
|
|
·
|
state and federal securities laws, which require that we register any non-exempt offers and sales of Notes.
|
We may not always have been, and may not always be, in compliance with these laws. Our borrowers may make counterclaims regarding the enforceability of their obligations under borrower or consumer protection laws after collection actions have commenced, or otherwise seek damages under these laws. Lenders may attempt to rescind their Note purchases under securities laws, and our failure to comply with such laws could also result in civil or criminal liability. For example, in 2010 we failed to timely renew our applications to offer and sell Notes in several states, resulting in $30,800 in penalties in four states, and the repurchase of $21.9 thousand of Notes from Florida residents pursuant to a rescission offer. Compliance with these requirements is also costly, time-consuming and limits our operational flexibility. See “Government Regulation—Regulation of Consumer Protection Laws” in our annual report for more information.
Prosper’s administration of the automated bidding plan system and its new loan search tool could create additional liability for Prosper and such liability could be material
Our automated plan system allows lender members to create their own automated bidding plans. By creating such a plan, a lender member can have bids placed automatically on her behalf on loan listings that meet loan criteria selected by her. In creating an automated bidding plan, the member can design these criteria herself, use a group of model criteria selected by Prosper, or customize one of those groups of model criteria as she sees fit. Each automated bidding plan consists of a group of loan criteria, such as loan amount, minimum yield percentage, Prosper Rating, income and employment characteristics, group affiliations and debt-to-income ratio. This group of criteria is divided into sub-groups, each of which we refer to as a “slice”. The specific loans on which the lender member bids through her automated bidding plan are determined by the criteria in each of her plan slices. If a loan listing is posted that satisfies all of the criteria in any one of her plan slices, a bid will automatically be placed on the listing on her behalf. Each automated plan expires on the earlier of thirty days after the plan was created or the first date on which all funds allocated to the plan by the lender member have been successfully bid. Since the re-launch of our platform in July 2009, approximately 57% of the bids made on our platform (measured in terms of dollar volume) have been made by members using automated plans as of March 31, 2011.
On June 30, 2011, we intend to replace our automated plan system with a new loan search tool. Beginning on that date, lenders will no longer be able to create automated plans, but will instead be able to use the loan search tool to identify Notes that meet their investment criteria. A lender using the search tool will be asked to indicate (i) the Prosper Rating or Ratings she wishes to use as search criteria, (ii) the total amount she wishes to invest and (iii) the amount she wishes to invest per Note. The search tool will then compile a basket of Notes for her consideration that meet her search criteria. If the supply of Notes that meet her criteria exceeds the total amount she wishes to invest, the search tool will select Notes for her basket based on the principle of first in, first out, i.e., the Note with the corresponding listing that was posted on our website earliest will be the first included in her basket, then the Note with the next oldest corresponding listing will be included, and so on, until the aggregate principal amount of Notes in her basket equals the amount she wishes to invest. If her search criteria include multiple Prosper Ratings, the search tool will divide her basket into equal portions, one portion representing each Prosper Rating selected. To the extent available Notes with these Prosper Ratings are insufficient to fill the lender’s order, the lender will be advised of this shortfall and given an opportunity either to reduce the size of her order or modify her search criteria to make her search more expansive. See “About Prosper—How to Bid to Purchase Notes—Our Automated Plan System and Our New Loan Search Tool.”
Since the Notes purchased through an automated plan or the loan search tool are the same as Notes purchased manually, they present the same risks of non-payment as all Notes that may be purchased on Prosper’s website. For example, there is a risk that a loan identified through an automated plan or the loan search tool may become delinquent or default, and the estimated return and estimated loss for that loan individually, or the estimated loss or return for the plan or the basket of Notes selected by the search tool as a whole, may not accurately reflect the actual return or loss on such loan. If this were to occur, a lender who purchases a Note through an automated plan or the loan search tool could pursue a claim against Prosper in connection with its representations regarding the performance of the loans bid upon through the plan or search tool. An investor could pursue such a claim under various antifraud theories under federal and state securities law. In addition, the SEC or an investor may take the position that the plans created pursuant to the automated bidding plan model involve the offer and sale of a separate security. Since we did not register the automated bidding plans as separate securities, such a claim, if successful, could give investors who invested in Notes through such plans a rescission right under state or federal law and possibly subject us to civil fines or criminal penalties under federal or state law. If such a theory was sustained, we could be liable for sales through automated bidding plans that take place prior to June 30, 2011. To date, no actions have been taken or threatened against us on this theory. However, such actions could have a material adverse effect on our business.
We may face liability under state and federal securities law for statements in our prospectus and in other communications that could be deemed to be an offer to the extent that such statements are deemed to be false or misleading.
Loan listings and other borrower information available on our website as well as in our sales and listing reports are statements made in connection with the purchase and sale of securities that are subject to the antifraud provisions of the Exchange Act and the Securities Act. In general, these liability provisions provide a purchaser of Notes with a right to bring a claim against Prosper for damages arising from any untrue statement of material fact or failure to state a material fact necessary to make any statements made not misleading. Even though we have advised you of what we believe to be the material risks associated with an investment in the Notes, the SEC or a court could determine that we have not advised you of all of the material facts regarding an investment in the Notes, which could give you the right to rescind your investment and obtain damages, and could subject us to civil fines or criminal penalties in addition to any such rescission rights or damages.
On July 13, 2009, we commenced a public offering of up to $500,000,000 in principal amount of our Borrower Payment Dependent Notes pursuant to a Registration Statement on Form S-1 (File No. 333-147019). The offering is a continuous offering and remains ongoing. The registration statement was declared effective by the SEC on July 10, 2009. From July 13, 2009 to April 27, 2011, we sold $51,247,470 in principal amount of Notes at 100% of their principal amount. The Notes are offered only through our website, and there are no underwriters or underwriting discounts. We have incurred estimated expenses of approximately $1,953,317 in connection with the offering, none of which are being paid by us to our directors, officers, persons owning 10% or more of any class of our equity securities or affiliates. As set forth in the prospectus for the offering, we are using the proceeds of each series of Notes to fund a borrower loan through our platform designated by the lender members purchasing such series of Notes. None of the proceeds from the Notes are paid by us to our directors, officers, persons owning 10% or more of any class of our equity securities or affiliates.
Item 3. Defaults upon Senior Securities
Not applicable.
Item 4. Removed and Reserved
Item 5. Other Information
Not applicable.
The exhibits listed on the accompanying Exhibit Index are filed or incorporated by reference as a part of this report and such Exhibit Index is incorporated herein by reference.
SIGNATURES
Pursuant to the requirements of the Securities Exchange Act of 1934, the registrant has duly caused this report to be signed on its behalf by the undersigned thereunto duly authorized.
|
Prosper Marketplace, Inc.
|
||||
|
Date: May 13, 2011
|
By:
|
/s/ Christian A. Larsen
|
||
|
Name:
|
Christian A. Larsen
|
|||
|
Title:
|
Chief Executive Officer
(Principal Executive Officer)
|
|||
|
Prosper Marketplace, Inc.
|
||||
|
Date: May 13, 2011
|
By:
|
/s/ Kirk T. Inglis
|
||
|
Name:
|
Kirk T. Inglis
|
|||
|
Title:
|
Chief Financial Officer and Chief Operating Officer
(Principal Financial and Accounting Officer)
|
|||
|
EXHIBIT INDEX
|
|
Exhibit
|
||
|
Number
|
Exhibit Description
|
|
|
3.1
|
Amended and Restated Certificate of Incorporation of the Registrant (incorporated by reference to Exhibit 3.1 of the Company’s Form 10-K, filed on March 29, 2011
|
|
|
3.2
|
Bylaws of the Registrant, dated March 22, 2005 (incorporated by reference to Exhibit 3.2 of the Company’s Form S-1, filed October 30, 2007)
|
|
|
10.1
|
Form of Borrower Registration Agreement
|
|
|
10.2
|
Form of Lender Registration Agreement (Note Commitment, Purchase and Sale Agreement)
|
|
|
31.1
|
Certification of Principal Executive Officer pursuant to Section 302 of the Sarbanes-Oxley Act of 2002, with respect to the Company’s Quarterly Report on Form 10-Q for the quarter ended March 31, 2011.
|
|
|
31.2
|
Certification of Principal Financial Officer pursuant to Section 302 of the Sarbanes-Oxley Act of 2002, with respect to the Company’s Quarterly Report on Form 10-Q for the quarter ended March 31, 2011.
|
|
|
32.1
|
Certification of Principal Executive Officer and Principal Financial Officer pursuant to Section 906 of the Sarbanes-Oxley Act of 2002, with respect to the Company’s Quarterly Report on Form 10-Q for the quarter ended March 31, 2011.
|
|
52