Attached files
| file | filename |
|---|---|
| 8-K - COMPUTER SCIENCES CORP | form8-k.htm |

*
INVESTOR CONFERENCE 2011
© 2011
May 11, 2011
Investor Conference

*
INVESTOR CONFERENCE 2011
© 2011
All written or oral statements made by CSC at this meeting or in these presentation materials
that do not directly and exclusively relate to historical facts constitute “forward-looking
statements” within the meaning of the Private Securities Litigation Reform Act of 1995. These
statements represent CSC’s expectations and beliefs, and no assurance can be given that
the results described in such statements will be achieved. These statements are subject to
risks, uncertainties, and other factors, many outside of CSC’s control, that could cause actual
results to differ materially from the results described in such statements. For a description of
these factors, please see CSC’s most recent Annual Report on Form 10-K and Quarterly
Reports on Form 10-Q.
Fiscal Year 2011 information presented herein is based on CSC’s revised guidance issued on
May 2, 2011. Actual results for Fiscal Year 2011 are scheduled to be released on May 25,
2011. Actual Fiscal Year 2011 results could vary from such guidance information.
May 2, 2011. Actual results for Fiscal Year 2011 are scheduled to be released on May 25,
2011. Actual Fiscal Year 2011 results could vary from such guidance information.

*
INVESTOR CONFERENCE 2011
© 2011
This presentation includes certain non-GAAP financial measures, such as operating income,
operating margin, operating costs, free cash flow and free cash flow as a percentage of net income
attributable to CSC common shareholders. These non-GAAP financial measures are not meant to
be considered in isolation or as a substitute for results prepared in accordance with accounting
principles generally accepted in the United States (GAAP). A reconciliation of non-GAAP financial
measures included in this presentation to the most directly comparable financial measure calculated
and presented in accordance with GAAP is set forth elsewhere in this presentation and on our
website at www.csc.com. CSC management believes that these non-GAAP financial measures
provide useful information to investors regarding the Company’s financial condition and results of
operations as they provide another measure of the Company’s profitability and ability to service its
debt, and are considered important measures by financial analysts covering CSC and its peers.

*
INVESTOR CONFERENCE 2011
© 2011
$16.1B global IT services powerhouse
50+ year track record of client service excellence
CSC Business Profile
93,000 employees worldwide,
operating in more than 90 countries
2,500 clients
NYSE: CSC
Ranked 155 on the FORTUNE 500
On FORTUNE magazine’s list of World’s Most
Admired Companies
Admired Companies

*
INVESTOR CONFERENCE 2011
© 2011
FY11 Overview
|
|
Implemented dividend and stock repurchase programs
|
|
|
Underlying operational business performance
|
|
|
Commercial revenue growth, offset by uncertainty in Public Sector
|
|
|
NHS Program realigned for success
|
|
|
Invested in growth segments, both organically and through acquisition
|

*
INVESTOR CONFERENCE 2011
© 2011
IT Services — A Global Market in Transition
Sources: Forrester Research, Inc.; CSC Research
Outsourcing
Systems Integration
IT Consulting
Outsourcing
Systems Integration
IT Consulting
Infrastructure as a
Service
Service
Security as a Service
Implementation and
Consulting
Consulting
Vertical Software
Business Services
Business executives
depend less on CIO for
technology investments
depend less on CIO for
technology investments
Shift to “as a Service”
is underway
is underway
Undifferentiated traditional
services are being
commoditized
services are being
commoditized
Traditional IT Services
Business Solutions
Traditional IT Services
*
INVESTOR CONFERENCE 2011
© 2011
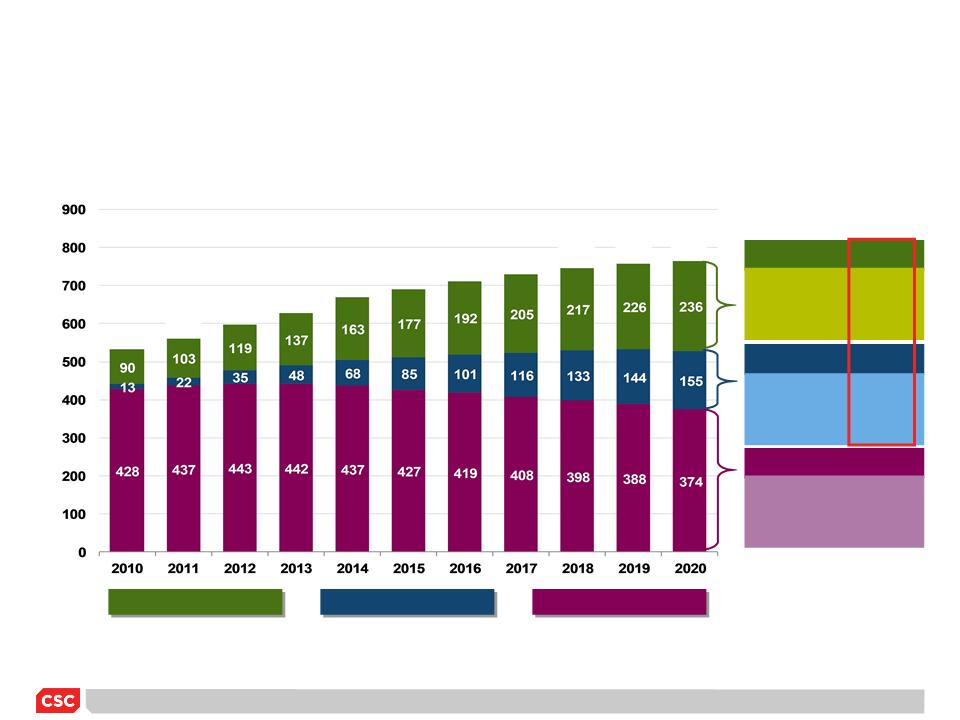
Market Offers Opportunities for Growth
$532
$562
$597
$627
$669
$689
$711
$729
$748
$758
$765
Business CAGR
Emerging CAGR
Traditional CAGR
3-yr. 14.7%
5-yr. 14.4%
10-yr. 10.1%
3-yr. 53.8%
5-yr. 45.2%
10-yr. 27.8%
3-yr. 1.1%
5-yr. 0.0%
10-yr. -1.3%
Business Solutions
Emerging Services
Traditional Services
$B
(U.S.)
(U.S.)
Sources: Forrester Research, Inc.; CSC Research

*
INVESTOR CONFERENCE 2011
© 2011
• Protect and expand our
core markets
core markets
• Focus on high-growth
horizontal segments
horizontal segments
• Expand our global
presence
presence
• Lead in the “as a Service”
cloud-based economy
cloud-based economy
• Capture market share in
cybersecurity services
cybersecurity services
• Expand our market with
Infrastructure as a Service
offerings
Infrastructure as a Service
offerings
Our Strategic Direction — Aligned with Market Opportunities
for Growth
for Growth
BUSINESS
• Be a leader in our chosen
verticals
verticals
• Use industry-leading,
IP-based solutions to
drive growth
IP-based solutions to
drive growth
• Focus on business
outcomes
outcomes
Fueling Clients’
Growth and
Performance
Growth and
Performance
TRADITIONAL
Enabling Clients
to Focus on
Their Business
to Focus on
Their Business
EMERGING
Enhancing Clients’
Agility and Security
Agility and Security

*
INVESTOR CONFERENCE 2011
© 2011
NPS Opportunities — High Growth Vectors
Building on Our Strengths
Building on Our Strengths
Current Revenue Composition
Future Revenue Composition
NPS Core
Health
Cybersecurity
Identity
Management
NPS Core
Health
Identity
Management
Data Center
Consolidation
and Cloud
and Cloud
Data Center
Consolidation
and Cloud
and Cloud

*
INVESTOR CONFERENCE 2011
© 2011
Six Potential Billion-Dollar Growth Platforms
|
I
|
Grow Financial Services business from $3 billion to $4 billion
|
|
II
|
Be recognized by our clients as the world’s leader in healthcare IT services
|
|
III
|
Be a leader in cloud and emerging services
|
|
IV
|
Achieve global recognition as the “go to” developer and provider of cybersecurity
|
|
V
|
Double our high-margin applications development and management business
|
|
VI
|
Focus intensely on cross-sell/up-sell to leverage our portfolio
|
Underpinning our strategy is a shift to a proactive
sales culture and increased brand promotion
sales culture and increased brand promotion
*
INVESTOR CONFERENCE 2011
© 2011
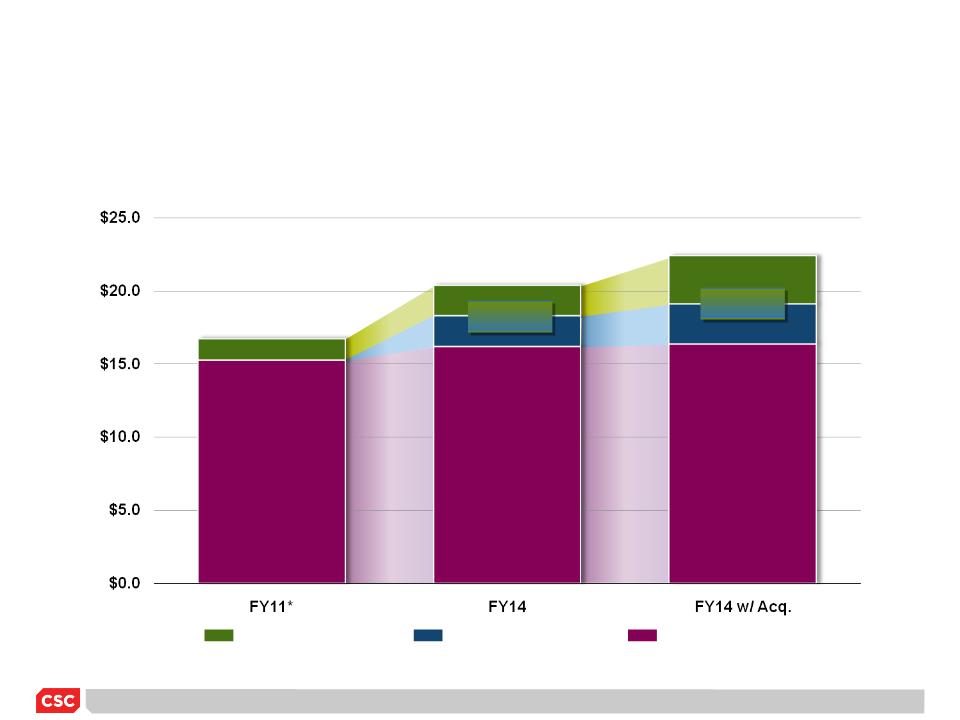
Our Plan Is Aligned with the Market’s Transition
Revenue Outlook by Strategic Growth Vector
Business Solutions
Emerging Services
Traditional Services
*Based on Revised Guidance issued May 2, 2011
Percents Are of Total (Mix)
91%
$16.1B
$19B
80%
$20B
74%
26%
20%
9%
($B)

*
INVESTOR CONFERENCE 2011
© 2011
Organic Growth Plan
|
Business Segment
|
Portfolio Share
|
3-Year Outlook
|
|
NPS
|
40%
|
0% - 5%
|
|
Commercial
|
60%
|
5% - 8%
|
|
Composite Total
|
100%
|
3% - 7%
|

*
INVESTOR CONFERENCE 2011
© 2011
Looking Forward
Our markets are in transition — providing exciting growth opportunities
Our go-to-market capabilities are realigned and energized
Proven Business Services model
A strong Tier One provider in our public sector and traditional
commercial markets
commercial markets
The financial strength to deliver top-line growth
Gaining recognition as a market leader in Cloud and Cybersecurity

*
INVESTOR CONFERENCE 2011
© 2011
Key Questions
Can margins improve?
Is cash generation sustainable?
Can the capital structure
support CSC’s strategy?
support CSC’s strategy?
Can CSC grow the top line?
*
INVESTOR CONFERENCE 2011
© 2011
Where We Have Been …

*
INVESTOR CONFERENCE 2011
© 2011
Historical Revenue Profile
$M
*Revised Guidance issued May 2, 2011
CSC FY
*
Global
Economic
Economic
Crisis

*
INVESTOR CONFERENCE 2011
© 2011
Historical Operating Income Margin Profile
*
CSC FY
%
*Revised Guidance issued May 2, 2011

*
INVESTOR CONFERENCE 2011
© 2011
Historical EPS Profile
CSC FY
$
Normalized for
IRS settlement
IRS settlement
*
7
*Revised Guidance issued May 2, 2011

*
INVESTOR CONFERENCE 2011
© 2011
Historical FCF % of NI Profile
*
CSC FY
Normalized for
timing distortion
timing distortion
-600%
-300%
Net Income attributable to
CSC Common Shareholders
150%
*Revised Guidance issued May 2, 2011

*
INVESTOR CONFERENCE 2011
© 2011
Share
Repurchase +
Covansys and
FCG
Acquisitions
Repurchase +
Covansys and
FCG
Acquisitions
DynCorp
Acquisition
Mynd +
Outsourcing
Assets
Capital
($M)
($M)
Debt-to-Cap
(%)
(%)
Capital Structure
$1B Term Debt
Redemption +
Dyn Int’l Sale
Debt
Equity
Debt-to-Cap
CSC FY
*
*Third quarter ending

*
INVESTOR CONFERENCE 2011
© 2011
Where We Are Going …

*
INVESTOR CONFERENCE 2011
© 2011
CAGR 2% - 3%
Revenue Drivers
Opportunities for growth
FY11*
FY14
Outlook
Outlook
$19B
Organic
Drivers
Cybersecurity
Cloud
Financial
Services
Services
Healthcare
$16.1B
*Revised Guidance issued May 2, 2011
Applications
Virtualization
Strategic
Acquisitions
Acquisitions
Foundation

*
INVESTOR CONFERENCE 2011
© 2011
Operating Income Margin Drivers
Drivers
• Portfolio mix
– Growth engines (financial services,
cybersecurity, healthcare, cloud)
cybersecurity, healthcare, cloud)
– Intellectual property
– Reduced capital intensity
– Low-cost centers
• Cost containment
– Facility/square footage
– Benefit management
– Supply chain management
– Travel
25 - 50
Basis Point
Improvement
Annually

*
INVESTOR CONFERENCE 2011
© 2011
*Revised Guidance issued May 2, 2011
Free Cash Flow (FCF) Drivers
• DSO improvements
• Lower pension
contributions
contributions
• Reduced capital
intensity
intensity
• NHS investment
amortization
amortization
• Claims resolution
FCF Drivers/Opportunities
FY11*
> 90% of NI
FY14 Outlook
80% of
Net Income
(NI)
(NI)
*
INVESTOR CONFERENCE 2011
© 2011
Cash Profile
|
$B
|
FY 2011
|
FY 2012w
|
FY 2013w
|
FY 2014w
|
|
Beginning Cash
|
$2.8
|
$2.0
|
$2.8
|
$2.7
|
|
FCF
|
0.6
|
.8
|
.9
|
.9
|
|
Debt repayment
|
(1.4)
|
|
(1.0)
|
|
|
Available Balance
|
$2.0
|
$2.8
|
$2.7
|
$3.6
|
**Estimated
wOutlook
Uses of Cash
Dividends
Share
Repurchase
Repurchase
Acquisitions
Investments
**
*
*Revised Guidance issued May 2, 2011

*
INVESTOR CONFERENCE 2011
© 2011
Financial Performance Plan Summary
FY12 - FY14 Outlook
FY12 - FY14 Outlook
Deliver top-line growth:
3% - 7% organic
2% - 3% acquisitions
(CAGR)
Improve
OI margin
by 25 - 50 BPS
annually
Grow EPS
at rate exceeding
top-line growth
Sustain cash
Performance > 90%
of Net Income

*
INVESTOR CONFERENCE 2011
© 2011
Can margins improve?
Is cash generation sustainable?
Can the capital structure support
CSC’s strategy?
CSC’s strategy?
Answers to Key Questions
Can CSC grow the top line?
ü
ü
ü
ü

*
INVESTOR CONFERENCE 2011
© 2011
CSC Investment Case
|
Financial Plan
|
|
|
Revenue
Growth |
3% to 7% organic,
2% to 3% acquisition |
|
Operating
Margin |
25 to 50 BPS
improvement to 10% |
|
EPS Growth
|
At a rate greater
than top line |
|
Free Cash
Flow |
> 90% Net Income
|
|
Shareholder Return
|
|
|
EPS Growth
|
|
|
Dividends
|
|
|
Share Repurchase
Program |
|
|
TSR Range
|
|
|
Plus, multiple expansion as we
deliver on our commitments |
|
8.5% to 14%

*
INVESTOR CONFERENCE 2011
© 2011
Non-GAAP Reconciliation
Proceeds from the sale of Property & Equipment (included in investing activities) are included in the calculation of Free
Cash Flow for all periods. Capital lease payments are included in the calculation of free cash flow from Fiscal 2004 -
Fiscal 2010.
Cash Flow for all periods. Capital lease payments are included in the calculation of free cash flow from Fiscal 2004 -
Fiscal 2010.
Operating Income Margin is Operating Income as a percentage of Revenue
*
**