Attached files
| file | filename |
|---|---|
| 8-K - CURRENT REPORT - Bridge Capital Holdings | v221424_8k.htm |
Investor Update First Quarter 2011 Daniel P. Myers Thomas A. Sa President Executive Vice President Chief Executive Officer Chief Financial Officer Chief Strategy Officer
Forward Looking Statements Certain matters discussed herein constitute forward -looking statements within the meaning of the Private Securities Litigation Reform Act of 1995, and are subject to the safe harbors created by that Act. Forward -looking statements describe future plans, strategies, and expectations, and are based on currently available information, expectations, assumptions, projections, and management's judgment about the Bank, the banking industry and general economic conditions . These forward looking statements are subject to certain risks and uncertainties that could cause the actual results, performance or achievements to differ materially from those expressed, suggested or implied by the forward looking statements . These risks and uncertainties include, but are not limited to: (1) competitive pressures in the banking industry; (2) changes in interest rate environment; (3) genera l economic conditions, nationally, regionally, and in operating markets; (4) changes in the regulatory environment; (5) changes in business conditions and inflation; (6) changes in securities markets; (7) future credit loss experience; (8) the ability to satisfy requirements related to the Sarbanes -Oxley Act and other regulation on internal control; (9) civil disturbances or terrorist threats or acts, or apprehension about the possible future occurrences of acts of this type; and (10) the involvement of the United States in war or other hostilities . The reader should refer to the more complete discussion of such risks in Bridge Capital Holdings reports on Forms 10-K and 10-Q on file with the SEC. 2

Why Are We Different? A business banking franchise that is the Professional Business Bank of Choice for small and middle market companies, and emerging technology businesses, in the markets we serve Business banking focus True business line diversification commercial/industrial technolo gy structured finance SBA cash management international trade services CRE/construction Early & proactive risk recognition and management Positioned to prosper as economic recovery takes hold Solid core business franchise 3
Bridge Bank Franchise Funding -driven approach to building the business Experienced board and management Disciplined execution of our business plan Limited exposure to real estate Continued core growth through crisis Full range of corporate banking products delivered through experienced advisors Unique & effective use of banking technology Attractive Silicon Valley market and other expansion opportunities Ranked No. 1 for largest non-real estate C&I portfolio 1 1 American Banker Magazine, American Bankers Association, Published January 21, 2011; Independent banks with less than $1 billion of assets. 4
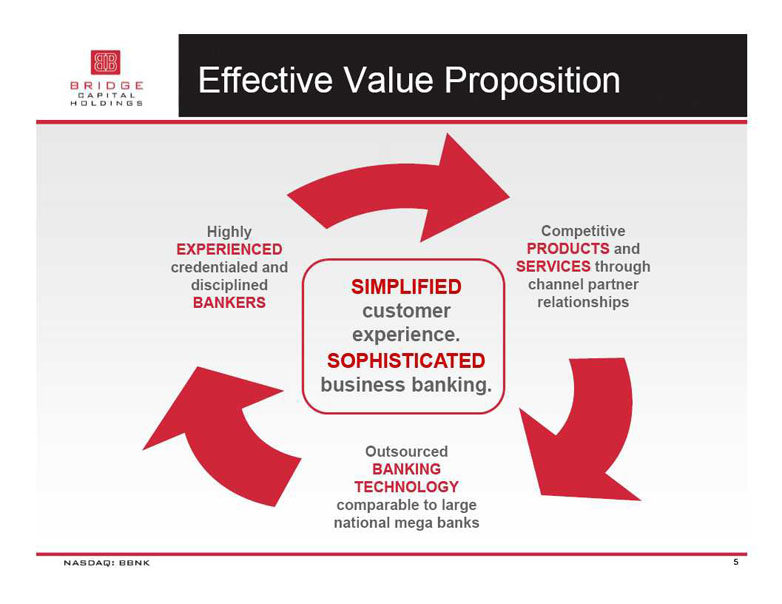
Effective Value Proposition Highly Competitive EXPERIENCED PRODUCTS and credentialed and SERVICES through disciplined SIMPLIFIED channel partner BANKERS customer relationships experience . SOPHISTICATED business banking . Outsourced BANKING TECHNOLOGY comparable to large national mega banks 5
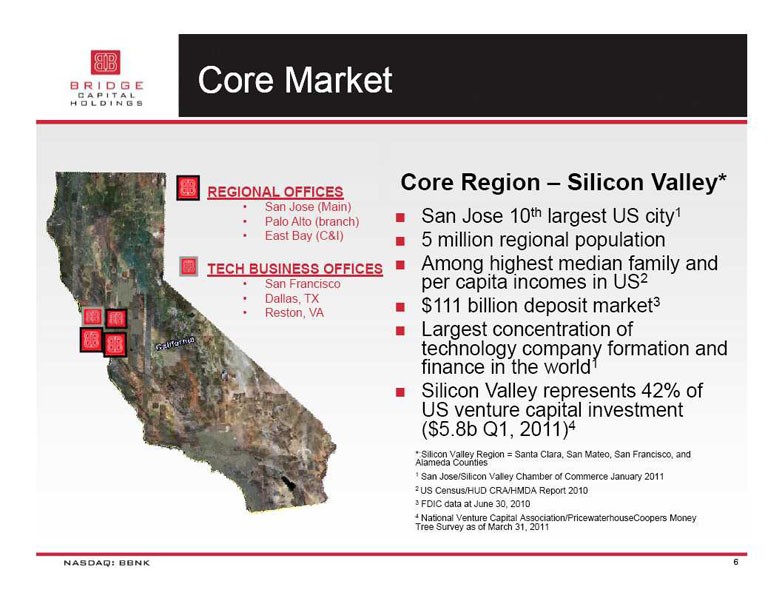
Core Market Core Region – Silicon Valley * REGIONAL OFFICES • San Jose (Main) th largest US city1 • Palo Alto (branch) San Jose 10 • East Bay (C&I) 5 million regional population TECH BUSINESS OFFICES Among highest median family and • San Francisco per capita incomes in US2 • Dallas, TX $111 billion 3 • Reston, VA deposit market Largest concentration of technology company formation and finance in the world1 Silicon Valley represents 42% of US venture capital investment ($5.8b Q1, 2011)4 *:Silicon Valley Region = Santa Clara, San Mateo, San Francisco, and Alameda Counties 1 San Jose/Silicon Valley Chamber of Commerce January 2011 2 US Census/HUD CRA/HMDA Report 2010 3 FDIC data at June 30, 2010 4 National Venture Capital Association/PricewaterhouseCoopers Money Tree Survey as of March 31, 2011 6
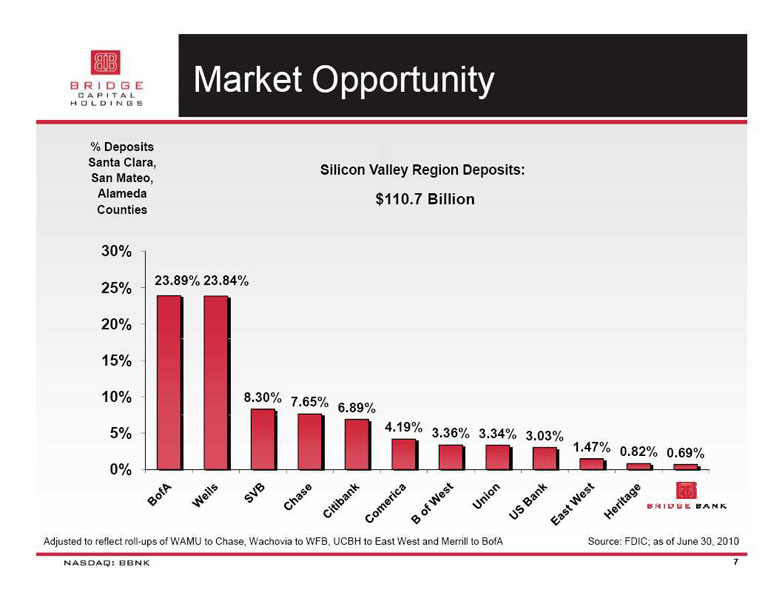
Market Opportunity % Deposits Santa Clara, Silicon Valley Region Deposits: San Mateo, Alameda $110.7 Billion Counties 30% 23.89% 23.84% 25% 20% 15% 10% 8.30% 7.65% 6.89% 5% 4.19% 3.36% 3.34% 3.03% 1.47% 0.82% 0.69% 0% Adjusted to reflect roll-ups of WAMU to Chase, Wachovia to WFB, UCBH to East West and Merrill to BofA Source: FDIC; as of June 30, 2010 7
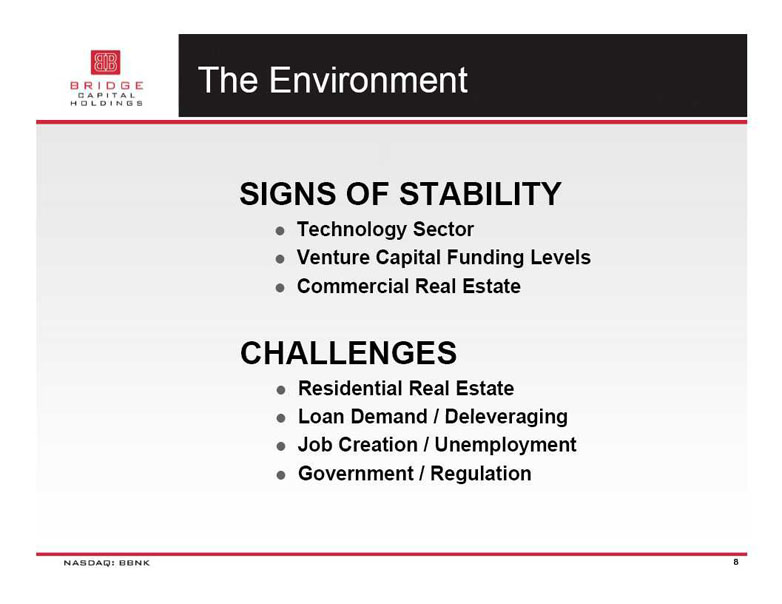
The Environment SIGNS OF STABILITY Technology Sector Venture Capital Funding Levels Commercial Real Estate CHALLENGES Residential Real Estate Loan Demand / Deleveraging Job Creation / Unemployment Government / Regulation 8

Strategies for Managing Through the Financial Crisis 2 Proactive credit risk recognition and management driven by key operating 0 philosophies 0 ‘Early Action – Early Out’ 8 ‘First Loss – Best Loss’ - Supplemented capital for endurance and opportunity 2 0 $30 M private capital raise (CCBF preferred) 0 Accepted $23.8 M UST CPP capital 9 Enhanced credit risk analytics, SAG, ERM Recognized conservative marks on NPA’s 2 0 70% reduction in L&C exposures; overall CRE reduction of 59% 1 40% decrease in classified asset portfolio 0 NCO’s reduced 50% per year between 2008 and 2010 $30 M common equity raised 2011 TARP redeemed in full; warrants retired 9
Expanding Market Presence Average Total Assets ($M) $1,024.8 $897.1 $868.2 $832.0 $750.5 Core deposit driven Purely organic growth $606.5 $465.9 2005 2006 2007 2008 2009 2010 1Q11 10
Focus on Core Funding Sources $ millions Deposit Mix (EOP) $1,000 $800 95% core deposits $600 Cost of funds • 30 bps Q1 ‘11 $400 57.4% 52.3% $200 47.3% 34.1% 39.6% 30.8% 29.6% $- 2005 2006 2007 2008 2009 2010 1Q11 Certifcates of deposit Money market and savings Interest -bearing demand Noninterest -bearing demand 11
Diversification of Lending Activity $632 Million Loan Mix as of March 31, 2011 @ 3-31-11 Peer Average* Non-Real Estate % of Total Loans – 38%* 100% 80% 60% 61% non-real estate 40% 20% 0% 2005 2006 2007 2008 2009 2010 1Q11 C&I Tech ABL/F SBA Other CRE Land Construction *US Public Banks $500M-$1.5B TA; SNL as of December 31, 2011 12
Loan Portfolio Diversification March 31, 2011 BBNK RE = 39% (61% Non-RE) Peer* RE = 62% (38% Non-RE) ABL/F 19% Tech 18% SBA 10% Other 4% C&I CRE 24% 18% Land Construction 1% 6% *US Public Banks $500M-$1.5B TA; SNL as of December 31, 2011 13
Ranked #1 for Largest C&I Portfolio (Non -Real Estate ) Source: American Banker magazine, American Bankers Association, Independent banks with less than $1 billion of assets. 14
Total CRE Outstanding as a % of Re gulator y Ca pital In ($MM’s) $300.0 300.0% 269.3% 263.3% Regulatory $250.0 Threshold 250.0% 300% $58.9 $200.0 200.0% $41.1 $22.8 $19.4 173.9% $14.2 $150.0 150.0% 158.5% 142.1% $13.5 $12.8 $9.6 $9.1 $12.2 $10.2 112.3% 96.8% 97.4% $7.6 $100.0 $102.3 $105.3 96.6% 100.0% $101.0 $97.8 $20.6 87.2% $79.7 95.6% $52.9 101.2% $39.4 $40.7 $34.3 $37.3 $35.3 $50.0 50.0% $87.4 $78.0 $69.7 $74.3 $71.0 $70.5 $71.8 $72.6 $67.8 $65.3 $68.7 $68.4 $0.0 0.0% Jun-08 Sep-08 Dec-08 Mar-09 Jun-09 Sep-09 Dec-09 Mar-10 Jun-10 Sep-10 Dec-10 Mar-11 CRE Construction Land % of Regulatory Capital 15
Income Producing CRE (18%) Current @ origination LTV = 47%* 49%** 43% = Owner Occupied DSC = 1.36x* 1.53x** 57% = Investor CAP = 7.4%* 6.8** Retail 4.4% Other 4.3% Medical 0.7% 1-4 SFR 1.6% Office 2.7% 5+ Multi 0.6% Ag Light Ind Industrial 1.0% 1.0% 1.8% •= LTV, DSR, CAP = CRE portfolio weighted averages for Q1 2011 ** = LTV, DSR, CAP = CRE portfolio weighted averages at loan origination 16
High Value Business Net Interest Margin 8% 7% 6% 4.66% 5% 4% Peer* 3% Average 3.86% 2% 1% BBNK BAC WFC CMA SIVB HTBK 0% 2005 2006 2007 2008 2009 2010 1Q11 = *US Public Banks $500M-$1.5B TA; SNL as of March 31, 2011 17
Credit Quality Trends 6% NPL/Total Loans NPA/Total Assets 5% 4% 3% 2% 1% 0% 18
Holding Robust Reserves as Credit Stress Eases 4.00% $35 3.50% $30 3.00% $25 2.50% 2.00% 2.07% $20 PEER* (ALLL/Loans) 1.50% $15 1.00% $10 0.50% $5 0.00% -0.50% $-2006 2007 2008 2009 2010 1Q11 NCO/Total Loans ALLLR/Loans Provision = SNL Data: US Public Banks Total Assets $0.5B to $1.5M as of March 31, 2011 19
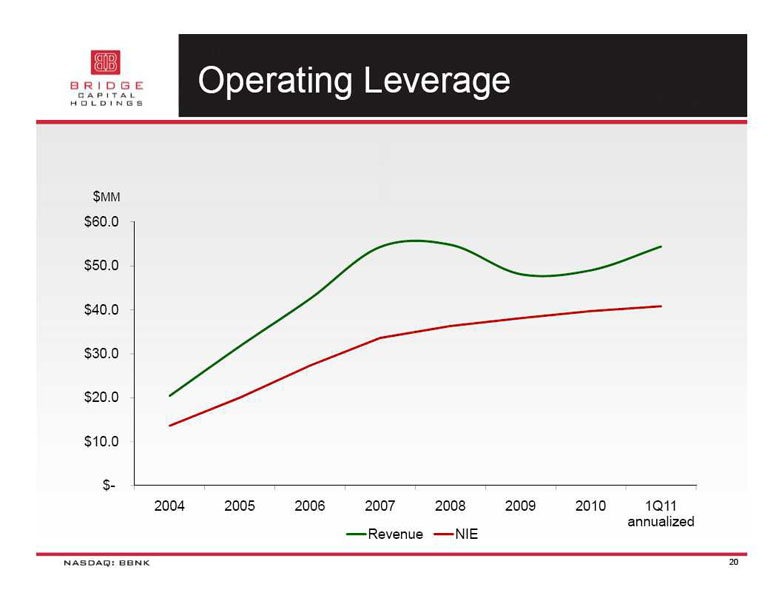
Operating Leverage $MM $60.0 $50.0 $40.0 $30.0 $20.0 $10.0 $- 2004 2005 2006 2007 2008 2009 2010 1Q11 annualized Revenue NIE 20
Effective Revenue Generation Revenue Per BBNK Employee Revenue/Employee ($000) 158% of Peer* $350 Group Avg 322 $300 $250 $200 204 $150 $100 2003 2004 2005 2006 2007 2008 2009 2010 1Q11 BBNK Peer * *= Average Rev/Empl of US Public Banks $500M-$1.5B TA; SNL as of as of December 31, 2010 21

BBNK Capital Structure Consolidated $170,000 $150,000 Trust Preferred $130,000 UST CPP Preferred Private Preferred $110,000 Retained Earnings $90,000 Common Stock $70,000 $50,000 $30,000 $10,000 $(10,000) 22

Capital for Growth and Opportunity March 31, 2011 24% 20% 16% 12% 8% 4% TCE Leverage Tier 1 RBC Total RBC BBNK Peer Regulatory Minimum Tangible common equity ratio 12.26% 8.15% Leverage 13.68% 10.39% Tier 1 capital ratio 16.98% 15.15% Total risk based capital 18.23% 15.99% *Peer = US Public Banks $500M-$1.5B TA; SNL, as of March 31, 2011 23

2010 Summary Operating profit of $2.6 million 54% growth from 2009 to 2010 Surpassed $1.0 billion in total assets Substantiall y improved TCE ratio $3M savings per year from preferred -to-common conversion Secured $30M private placement Continued strong growth in core deposits Improving credit quality NCOs reduced 56% from prior year NPA’s including TDR’s reduced by 31% NIM expanded to 4.99% from 4.58% in 2009 Robust new business activity 24

Q1 2011 Summary Operating profit of $1.6 million 330% growth from Q1, 2010 Consistent high quality deposit growth 95% core 57% DDA Continued credit quality improvement ALLL Provision reduced to pre-financial crisis level Exceptionally well capitalized TCE of 12.26% Redeemed $24.0 million in TARP funds Repurchased TARP warrant Continued robust new client acquisition 25
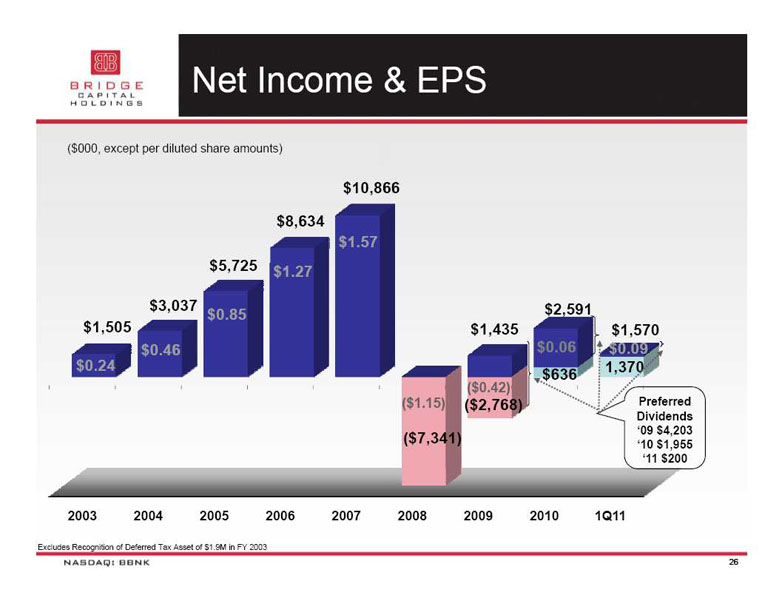
Net Income & EPS ($000, except per diluted share amounts) $10,866 $8,634 $1.57 $5,725 $1.27 $3,037 $2,591 $0.85 $1,505 $1,435 $1,570 $0.46 $0.06 $0.09 $0.24 1,370 $636 ($0.42) ($1.15) ($2,768) Preferred Dividends ‘09 $4,203 ($7,341) ‘10 $1,955 ‘11 $200 2003 2004 2005 2006 2007 2008 2009 2010 1Q11 Excludes Recognition of Deferred Tax Asset of $1.9M in FY 2003 26
Potential Tailwinds Ahead … Utilization rates on LOC at low ebb Have continued to add new commitments Utilization currently in the range of 35-40% As econom y improves rate could move up to 45%+ Natural asset-sensitivity Positioned for rising rate environment Ready funding source for increase d loan demand Lower levels of credit stress Potential recoveries Normalizing of credit costs Continued organic growth Average total assets increase d 22% in year over year 27
Investment Summary Improving fundamentals provide strong foundation for increasing profitability Growing core deposit franchise Positioned for increased loan demand Improved operating leverage Expanding net interest margin Improving credit quality with managea ble exposure to CRE Strong capital position provides opportunity to pursue attractive growth opportunities in our markets Increasing presence in market with attractive long-term growth potential 28
Thank You / Q & A 29