Attached files
| file | filename |
|---|---|
| 8-K - GOLUB CAPITAL BDC, Inc. | v220972_8-k.htm |
Golub Capital BDC, Inc. Investor PresentationQuarter Ended March 2011


Financial HighlightsQ2 20111 Q1 20111 Q4 20101 Q3 20101 Earnings per share $ 0.33 $ 0.34 $ 0.35 $ 0.29 Net investment income per share 0.29 0.30 0.25 0.30 Net gain (loss) per share 0.04 0.04 0.10 (0.01) Net asset value per share 14.75 14.74 14.71 14.67 Dividend paid per share 0.32 0.31 0.31 0.24Q2 20111 Q1 20111 Q4 20101 Q3 20101 Total Fair Value of Investments (000's) $ 389,060 $ 382,414 $ 344,869 $ 277,610 Number of Portfolio Companies 98 98 94 79 Average Investment Size (000's) $ 3,970 $ 3,902 $ $3,669 $ $3,514 Fair Value as a Percentage of Principal (Loans) 97.8% 97.4% 97.0% 96.1%1. The fiscal year for Golub Capital BDC, Inc. ends on September 30. As such, 'Q2 2011' refers to the quarter ended March 31, 2011, 'Q1 2011' refers to the quarter ended December 31, 2010, 'Q4 2010' refers to the quarter ended September 30, 2010, and Q3 2010' refers to the quarter ended June 30, 2010.Golub Capital BDC, Inc. Investor Presentation 2Quarter Ended March 2011
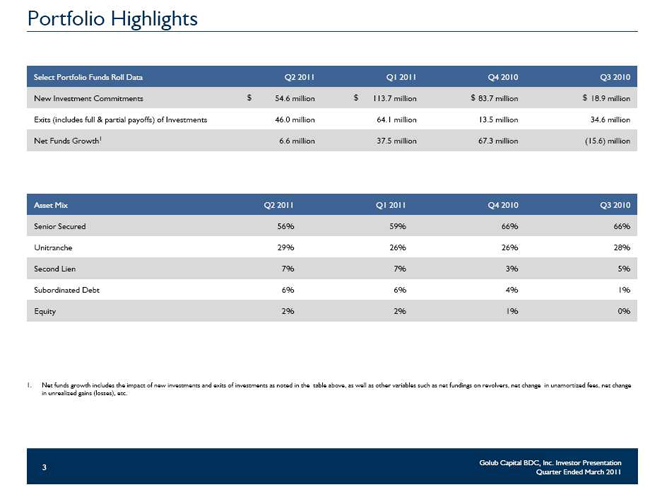
Portfolio HighlightsSelect Portfolio Funds Roll Data Q2 2011 Q1 2011 Q4 2010 Q3 2010 New Investment Commitments $ 54.6 million $ 113.7 million $ 83.7 million $ 18.9 million Exits (includes full & partial payoffs) of Investments 46.0 million 64.1 million 13.5 million 34.6 million Net Funds Growth 1 6.6 million 37.5 million 67.3 million (15.6) millionAsset Mix Q2 2011 Q1 2011 Q4 2010 Q3 2010 Senior Secured 56% 59% 66% 66% Unitranche 29% 26% 26% 28% Second Lien 7% 7% 3% 5% Subordinated Debt 6% 6% 4% 1% Equity 2% 2% 1% 0%1. Net funds growth includes the impact of new investments and exits of investments as noted in the table above, as well as other variables such as net fundings on revolvers, net change in unamortized fees, net change in unrealized gains (losses), etc.Golub Capital BDC, Inc. Investor Presentation 3Quarter Ended March 2011

Quarterly Statements of Financial ConditionAs ofMarch 31, 2011 December 31, 2010 September 30, 2010 June 30, 2010(Dollar amounts in thousands, except per share data) (unaudited) (unaudited) (audited) (unaudited)AssetsInvestments in securities, at fair value $ 389,060 $ 382,414 $ 344,869 $ 277,610 Cash and cash equivalents 43,866 41,389 61,219 71,380 Restricted cash and cash equivalents 16,050 27,618 31,771 32,728 Receivable for investments sold 4,389 2,895 – –Other assets 6,154 5,998 4,904 2,042 Total Assets $ 459,519 $ 460,314 $ 442,763 $ 383,760LiabilitiesDebt $ 194,000 $ 194,000 $ 174,000 $ 121,764 Payable for investments purchased – – 5,328 885 Interest payable 935 2,576 1,167 86 Management and incentive fee payable 1,590 1,693 1,008 593 Other payables 1,017 570 719 540 Total Liabilities 197,542 198,839 182,222 123,975 Total Net Assets 261,977 261,475 260,541 259,785Total Liabilities and Net Assets $ 459,519 $ 460,314 $ 442,763 $ 383,760 Net Asset Value per Share $ 14.75 $ 14.74 $ 14.71 $ 14.67Debt to Equity 0.74x 0.74x 0.67x 0.47xGolub Capital BDC, Inc. Investor Presentation 4Quarter Ended March 2011

Quarterly Operating ResultsFor the three months endedMarch 31, 2011 December 31, 2010 September 30, 2010 June 30, 2010(Dollar amounts in thousands, except share and per share data) (unaudited) Investment incomeInterest $ 9,111 $ 9,137 $ 7,431 $ 7,230Total investment income 9,111 9,137 7,431 7,230ExpensesInterest and other debt financing expenses 1,467 1,577 1,381 591 Base management fee 1,341 1,284 1,091 903 Incentive fee 221 190 – 55 Other operating expenses 901 853 608 866 Total expenses 3,930 3,904 3,080 2,415Net investment income 5,181 5,233 4,351 4,815Net gain (loss) on investmentsNet realized gains (losses) on investments 1,049 876 (40) –Net unrealized (depreciation) appreciation on investments (354) (147) 1,937 (100)Net gain (loss) on investments 695 729 1,897 (100) Net increase in net assets resulting from operations $ 5,876 $ 5,962 $ 6,248 $ 4,715 Per ShareEarnings per Share $ 0.33 $ 0.34 $ 0.35 $ 0.29 Net Investment Income $ 0.29 $ 0.30 $ 0.25 $ 0.30 Dividend Paid $ 0.32 $ 0.31 $ 0.31 $ 0.24 Weighted average common shares outstanding 17,738,395 17,712,724 17,712,444 16,255,783 Common shares outstanding at end of period 17,755,976 17,738,197 17,712,444 17,712,444 Golub Capital BDC, Inc. Investor Presentation 5Quarter Ended March 2011

Portfolio Highlights – Asset MixNew Investment Commitments End of Period Investments3%2% 6%1% 7% 3% 4% 3% 1% 5%Golub Capital BDC, Inc. Investor Presentation 6Quarter Ended March 2011
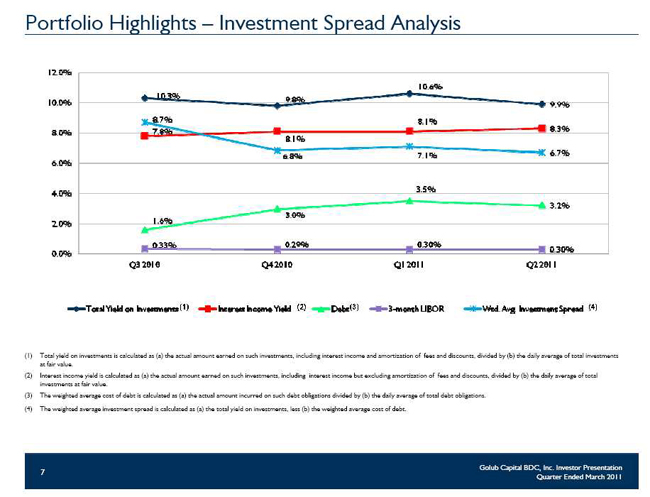
Portfolio Highlights – Investment Spread Analysis(1) Total yield on investments is calculated as (a) the actual amount earned on such investments, including interest income and amortization of fees and discounts, divided by (b) the daily average of total investments at fair value. (2) Interest income yield is calculated as (a) the actual amount earned on such investments, including interest income but excluding amortization of fees and discounts, divided by (b) the daily average of total investments at fair value. (3) The weighted average cost of debt is calculated as (a) the actual amount incurred on such debt obligations divided by (b) the daily average of total debt obligations .(4) The weighted average investment spread is calculated as (a) the total yield on investments, less (b) the weighted average cost of debt.Golub Capital BDC, Inc. Investor Presentation 7Quarter Ended March 2011
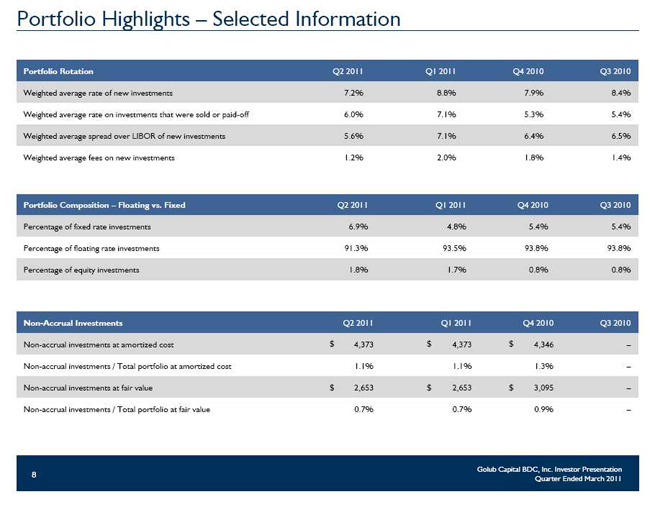
Portfolio Highlights – Selected InformationPortfolio Rotation Q2 2011 Q1 2011 Q4 2010 Q3 2010 Weighted average rate of new investments 7.2% 8.8% 7.9% 8.4% Weighted average rate on investments that were sold or paid-off 6.0% 7.1% 5.3% 5.4% Weighted average spread over LIBOR of new investments 5.6% 7.1% 6.4% 6.5% Weighted average fees on new investments 1.2% 2.0% 1.8% 1.4%Portfolio Composition – Floating vs. Fixed Q2 2011 Q1 2011 Q4 2010 Q3 2010 Percentage of fixed rate investments 6.9% 4.8% 5.4% 5.4% Percentage of floating rate investments 91.3% 93.5% 93.8% 93.8% Percentage of equity investments 1.8% 1.7% 0.8% 0.8%Non-Accrual Investments Q2 2011 Q1 2011 Q4 2010 Q3 2010 Non-accrual investments at amortized cost $ 4,373 $ 4,373 $ 4,346 –Non-accrual investments / Total portfolio at amortized cost 1.1% 1.1% 1.3% –Non-accrual investments at fair value $ 2,653 $ 2,653 $ 3,095 –Non-accrual investments / Total portfolio at fair value 0.7% 0.7% 0.9% –Golub Capital BDC, Inc. Investor Presentation 8Quarter Ended March 2011

Portfolio Highlights – Portfolio RatingsStrong Investment Performance RatingsMarch 31, 2011 December 31, 2010 September 30, 2010 Investment Investments Investments Investments % of % of % of Performance at Fair Value at Fair Value at Fair Value Total Portfolio Total Portfolio Total Portfolio Rating (In thousands) (In thousands) (In thousands) 5 $ 67,250 17.3% $ 75,836 19.9% $ 98,307 28.5%4 275,563 70.8% 277,356 72.5% 199,876 58.0%3 41,915 10.8% 24,908 6.5% 41,948 12.2%2 4,332 1.1% 4,314 1.1% 4,738 1.3%1 – 0.0% – 0.0% – 0.0% Total $ 389,060 100.0% $ 382,414 100.0% $ 344,869 100.0%Risk Ratings DefinitionRating Definition5 Borrower is performing above expectations4 Borrower is generally performing as expected and the risk factors are neutral to favorable3 Borrower may be out of compliance with debt covenants; however, loan payments are generally not past due2 Borrower performing materially below expectations and indicates that the loan’s risk has increased materially since origination1 Performing substantially below expectations and the loan risk has substantially increased since originationGolub Capital BDC, Inc. Investor Presentation 9Quarter Ended March 2011
Common Stock and Distribution InformationCommon Stock DataFiscal Year Ended September 30, 2010 High Low End of Period Third Quarter (From April 14, 2010) $14.85 $12.85 $14.42 Fourth Quarter $15.30 $13.83 $15.30 Fiscal Year Ended September 30, 2011 First Quarter $17.95 $15.44 $17.12 Second Quarter $17.60 $15.78 $15.78Distribution DataDate Declared Record Date Payment Date Amount Per Share Total Amount May 13, 2010 June 22, 2010 June 29, 2010 $0.24 $4,251 August 9, 2010 September 10, 2010 September 30, 2010 $0.31 $5,491 December 8, 2010 December 20, 2010 December 30, 2010 $0.31 $5,491 February 8, 2011 March 18, 2011 March 30, 2011 $0.32 $5,676 May 3, 2011 June 17, 2011 June 29, 2011 $0.32 $6,947Golub Capital BDC, Inc. Investor Presentation 10Quarter Ended March 2011

Liquidity and Investment CapacityCommon Stock Offering On April 6, 2011, we closed on the offering of 3,500,000 shares of common stock at an offering price of $15.75 per share, raising approximately $51.8 million in net proceeds . On May 2, 2011, we sold an additional 453,257 shares of its common stock at a public offering price of $15.75 per share pursuant to the underwriters' partial exercise of the over-allotment option the Company granted to the underwriters in connection with its public offering, raising approximately $6.8 million in net proceedsSBIC Financing As of March 31, 2011, we have $28.3 million in available and approved debt commitments from the SBA Additional SBIC commitments are available subject to customary SBA approval proceduresNew Investments During the month of April 2011, we invested approximately $33.3 million in new middle market portfolio companies .Golub Capital BDC, Inc. Investor Presentation 11 Quarter Ended March 2011
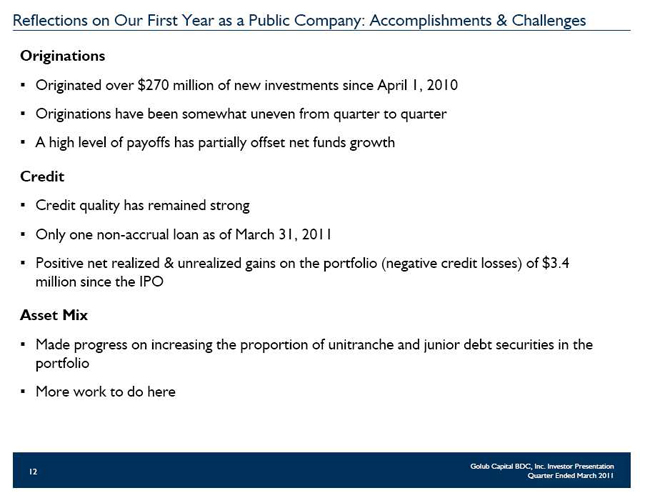
Reflections on Our First Year as a Public Company: Accomplishments & ChallengesOriginationsaOriginated over $270 million of new investments since April 1, 2010 aOriginations have been somewhat uneven from quarter to quarter aA high level of payoffs has partially offset net funds growthCreditaCredit quality has remained strongaOnly one non-accrual loan as of March 31, 2011 aPositive net realized & unrealized gains on the portfolio (negative credit losses) of $3.4 million since the IPOAsset Mix aMade progress on increasing the proportion of unitranche and junior debt securities in the portfolio aMore work to do hereGolub Capital BDC, Inc. Investor Presentation 12 Quarter Ended March 2011

Reflections on Our First Year as a Public Company: Accomplishments & Challenges Long Term Committed Financing ▪ Successfully completed a $300 million debt securitization maturing in 2021 (three year reinvestment period) at a cost of LIBOR +2.40% ▪ Received our SBIC license in August 2010, which provides us over time with up to $150 million in long-term, cost-effective, fixed rate financing Follow-on Stock Offering ▪ Raised $58.6 million in a secondary stock offering (including the exercise of the partial over-allotment) at $15.75 per share in April & May 2011, an 8.6% premium over the IPO price NAV, EPS & Dividends ▪ NAV has increased from $14.67 at June 30, 2010 to $14.75 at March 30, 2011 ▪ Quarterly EPS has ranged from $0.29 per share to $0.34 per share ▪ Increased our quarterly dividend to $0.32 per share