Attached files
| file | filename |
|---|---|
| 8-K - FORM 8-K - Piedmont Office Realty Trust, Inc. | d8k.htm |
| EX-99.1 - PRESS RELEASE - Piedmont Office Realty Trust, Inc. | dex991.htm |
Exhibit 99.2

Quarterly Supplemental Information
March 31, 2011
| Corporate Headquarters | Institutional Analyst Contact | Investor Relations | ||
| 11695 Johns Creek Parkway, Suite 350 Johns Creek, GA 30097 Telephone: 770.418.8800 |
Telephone: 770.418.8592 research.analysts@piedmontreit.com |
Telephone: 866.354.3485 investor.services@piedmontreit.com www.piedmontreit.com | ||
Piedmont Office Realty Trust, Inc.
Quarterly Supplemental Information
Index
Please refer to page 37 for a discussion of important risks related to the business of Piedmont Office Realty Trust, as well as an investment in its securities, including risks that could cause actual results and events to differ materially from results and events referred to in the forward-looking information. Considering these risks, uncertainties, assumptions, and limitations, the forward-looking events contained in this supplemental reporting package might not occur.
Certain prior period amounts have been reclassified to conform to the current period financial statement presentation. In addition, many of the schedules herein contain rounding to the nearest thousands or millions and, therefore, the schedules may not total due to this rounding convention.
Piedmont Office Realty Trust, Inc.
Corporate Data
Piedmont Office Realty Trust, Inc. (“Piedmont” or the “Company”) (NYSE: PDM) is a fully-integrated and self-managed real estate investment trust (“REIT”) specializing in the acquisition, ownership, management, development and disposition of primarily high-quality Class A office buildings located predominantly in large U.S. office markets and leased principally to high-credit-quality tenants. Since its first acquisition in 1998, the Company has acquired $5.8 billion of office and industrial properties (inclusive of joint ventures) through March 31, 2011. Rated as an investment-grade company by Standard & Poor’s and Moody’s, Piedmont has maintained a low-leverage strategy while acquiring its properties. Approximately 83% of our Annualized Lease Revenue (“ALR”)(1) is derived from our office properties located within the ten largest U.S. office markets, including Chicago, Washington, D.C., the New York metropolitan area, Boston and greater Los Angeles.
This data supplements the information provided in our reports filed with the Securities and Exchange Commission.
| As of March 31, 2011 |
As of December 31, 2010 |
|||||||
| Number of properties (2) |
77 | 75 | ||||||
| Rentable square footage (in thousands) (2) |
21,516 | 20,408 | ||||||
| Percent leased (3) |
87.3% | 89.2% | ||||||
| Capitalization (in thousands): |
||||||||
| Total gross debt - principal amount outstanding |
$1,602,525 | $1,402,525 | ||||||
| Equity market capitalization (4) |
$3,351,301 | $3,477,342 | ||||||
| Total market capitalization (4) |
$4,953,826 | $4,879,867 | ||||||
| Total gross debt / Total market capitalization (4) |
32.3% | 28.7% | ||||||
| Common stock data |
||||||||
| High closing price during quarter (4) |
$20.55 | $20.31 | ||||||
| Low closing price during quarter (4) |
$18.69 | $18.25 | ||||||
| Closing price of Class A common stock at period end (4) |
$19.41 | $20.14 | ||||||
| Weighted average fully diluted shares outstanding (in thousands) (5) (6) |
172,955 | 170,967 | ||||||
| Shares of common stock issued and outstanding (in thousands) |
172,658 | 172,658 | ||||||
| Rating / outlook |
||||||||
| Standard & Poor’s |
BBB / Stable | BBB / Stable | ||||||
| Moody’s |
Baa2 / Stable | Baa2 / Stable | ||||||
| Employees (7) |
111 | 110 | ||||||
| (1) | The definition for Annualized Lease Revenue can be found on page 30. |
| (2) | Our office portfolio currently consists of 77 properties (exclusive of our equity interests in seven properties owned through unconsolidated joint ventures and our two industrial properties). During the first quarter of 2011, we acquired a 150,000 square foot building located at 1200 Enclave Parkway in Houston, TX and a 962,000 square foot building located at 500 West Monroe Street in Chicago, IL. |
| (3) | Calculated as leased square footage on March 31, 2011 plus square footage associated with executed new leases for currently vacant spaces divided by total rentable square footage, expressed as a percentage. This measure is presented for our 77 office properties and excludes industrial and unconsolidated joint venture properties. Piedmont has completed several acquisitions and one disposition during the previous year; excluding the assets related to such investing activity from the leased percentage analysis, Piedmont’s portfolio was 89.2% leased as of March 31, 2011, as compared to the same store leased percentage of 89.3% in the year earlier period. Please refer to page 21 for additional detail regarding the same store leased percentage comparison to first quarter 2010. |
| (4) | As of December 31, 2010, our Class B-3 common stock was not listed on a national securities exchange and there was no established market for such shares. We have used the closing price of the Class A common stock at the relevant period end for the purposes of the calculations regarding market capitalization herein. |
| (5) | Weighted average fully diluted shares outstanding are presented on a year-to-date basis for each period. |
| (6) | In conjunction with our February 10, 2010 listing on the New York Stock Exchange, we issued 13.8 million additional shares of Class A common stock, the primary reason for the difference in weighted average fully diluted shares outstanding. |
| (7) | During the first quarter of 2011, the company hired a regional manager for its New York, NY office. The opening of this office is the reason for the increase in number of employees. |
3
Piedmont Office Realty Trust, Inc.
Investor Information
Corporate
11695 Johns Creek Parkway, Suite 350, Johns Creek, Georgia 30097
770.418.8800
www.piedmontreit.com
| Executive and Senior Management | ||||
| Donald A. Miller, CFA | Robert E. Bowers | Laura P. Moon | ||
| Chief Executive Officer, President and Director |
Chief Financial Officer, Executive Vice President, Secretary, and Treasurer |
Chief Accounting Officer and Senior Vice President | ||
| Raymond L. Owens | Carroll A. Reddic, IV | |||
| Executive Vice President - Capital Markets |
Executive Vice President - Real Estate Operations, Assistant Secretary |
|||
| Board of Directors | ||||
| W. Wayne Woody | Donald A. Miller, CFA | Frank C. McDowell | ||
| Director and Chairman of the Board of Directors |
Chief Executive Officer, President and Director |
Director and Vice Chairman of the Board of Directors | ||
| Wesley E. Cantrell | Michael R. Buchanan | Donald S. Moss | ||
| Director and Chairman of Governance Committee |
Director and Chairman of Capital Committee |
Director and Chairman of Compensation Committee | ||
| Jeffery L. Swope | William H. Keogler, Jr. | |||
| Director | Director | |||
| Transfer Agent |
Corporate Counsel | |
| Bank of New York Mellon Shareowner Services | King & Spalding | |
| P.O. Box 358010 | 1180 Peachtree Street, NE | |
| Pittsburgh, PA 15252-8010 | Atlanta, GA 30309 | |
| Phone: 866.354.3485 | Phone: 404.572.4600 | |
4
| Piedmont Office Realty Trust, Inc. Financial Highlights As of March 31, 2011 |
On January 22, 2010, we filed an amendment to our charter to effect a recapitalization of our common stock as described further in our Securities and Exchange Commission (“SEC”) filings. Upon the effectiveness of the recapitalization, each share of our outstanding common stock converted automatically into: (a) 1/12th of a share of our Class A common stock; plus (b) 1/12th of a share of our Class B-1 common stock; plus (c) 1/12th of a share of our Class B-2 common stock; plus (d) 1/12th of a share of our Class B-3 common stock. Class B-1 common stock converted automatically into Class A common stock on August 9, 2010; Class B-2 common stock converted automatically into Class A common stock on November 7, 2010; and Class B-3 common stock converted automatically into Class A common stock on January 30, 2011.
|
Financial Results (1) |
| - | Funds from operations (FFO) and core funds from operations (Core FFO) for the quarter ended March 31, 2011 were both $71.3M, or $0.41 per share (diluted), compared to $69.2M, or $0.42 per share (diluted), for both measures for the same quarter in 2010. The increase in FFO and Core FFO for the three months ended March 31, 2011 as compared to the same period in 2010 was primarily due to higher termination income as well as default interest and residual net operating income deferred from prior periods and recognized upon the successful foreclosure of the equity ownership interest of 500 West Monroe Street. Additionally contributing to the increase in FFO and Core FFO was a decreased interest rate on the $250 million term loan resulting in lower interest expense. These positive variances are offset somewhat by lower tenant reimbursements. The decrease in per share amount for both FFO and Core FFO for the three months ended March 31, 2011 as compared to the same period in 2010 was primarily due to the dilutive effect of the 13.8 million shares of Class A common stock issued when the Company listed on the NYSE in February 2010. |
| - | Adjusted funds from operations (AFFO) for the quarter ended March 31, 2011 was $52.0M, or $0.30 per share (diluted), compared to $60.3M, or $0.36 per share (diluted), for the same quarter in 2010. The decrease in AFFO for the three months ended March 31, 2011 as compared to the same period in 2010 was primarily due to increased capital expenditures in 2011 associated with new leasing activity, including $6.6 million in leasing commissions related to the NASA lease renewal at Two Independence Square and $3.6 million in tenant improvements for State Street Bank at 1200 Crown Colony Drive. The per share amount of AFFO was also lower in 2011 as compared to 2010 due to the dilutive effect of the 13.8 million shares of Class A common stock issued when the Company listed on the NYSE in February 2010. |
| - | During the quarter ended March 31, 2011, the Company paid to shareholders a quarterly dividend in the amount of $0.315 per share for its Class A common stock, which represented its only outstanding class of common stock. The Company’s dividend payout percentage for the three months ended March 31, 2011 was 76.3% of Core FFO and 104.6% of AFFO. |
| Operations |
| - | On a same store square footage leased basis, our portfolio was 89.2% leased as of March 31, 2011 as compared to 89.3% leased as of March 31, 2010, reflecting stability in our same store portfolio. On a square footage basis, our office portfolio was 87.3% leased as of March 31, 2011, as compared to 89.2% as of December 31, 2010 and 89.6% as of March 31, 2010. The decrease in the office portfolio leased percentage during the last year is primarily related to the addition to the portfolio of 1.6 million square feet through the acquisition of several properties with existing vacancies, including 500 West Monroe Street in Chicago, IL, 1200 Enclave Parkway in Houston, TX, and Suwanee Gateway One in Suwanee, GA. |
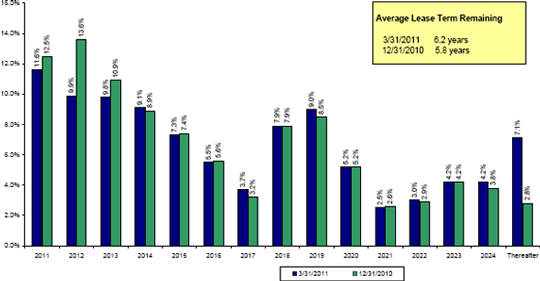
| - | The weighted average remaining lease term of our portfolio was 6.2 years(2) as of March 31, 2011 as compared to 5.8 years at December 31, 2010. |
| - | During the three months ended March 31, 2011, the Company completed 843,000 square feet of leasing at our 77 consolidated office properties. We executed renewal leases for 616,000 square feet and new tenant leases for 227,000 square feet, with an average committed capital cost of $5.82 per square foot per year of lease term. Average committed capital cost per square foot per year of lease term for renewal leases signed during the quarter was $5.48 and average committed capital cost per square foot per year of lease term for new leases was $7.39. We did not execute any new leases during the quarter for our two industrial properties. |
| - | During the three months ended March 31, 2011, we retained(3) tenants for 72% of the square footage associated with expiring leases. This result compares to a 72% retention rate for the year ended December 31, 2010. |
(1) FFO, Core FFO and AFFO are supplemental non-GAAP financial measures. See pages 30-31 for definitions of non-GAAP financial measures. See pages 12 and 35 for reconciliations of FFO, Core FFO and AFFO to Net Income.
(2) Remaining lease term (after taking into account leases for vacant spaces which had been executed but not commenced as of March 31, 2011) is weighted based on Annualized Lease Revenue, as defined on page 30.
(3) Piedmont defines a retained tenant to include an existing tenant/occupant signing a lease for the premises it currently occupies or a tenant whose occupancy of a space is structured in a way to eliminate downtime for the space.
5
Piedmont Office Realty Trust, Inc.
Financial Highlights
As of March 31, 2011
| - | During the three months ended March 31, 2011, we executed six office leases greater than 20,000 square feet. Please see information on those leases listed below. |
| Tenant Name | Property | Property Location | Square Feet Leased |
Expiration Year | Lease Type | |||||
| United States of America (NASA) |
Two Independence Square | Washington, D.C. | 597,253 | 2027 | Renewal | |||||
| BSH Home Appliances Corporation |
1901 Main Street | Irvine, CA | 49,781 | 2019 | New | |||||
| Eide Bailly, LLP |
US Bancorp Center | Minneapolis, MN | 40,622 | 2024 | New | |||||
| First Solar Electric, LLC |
400 Bridgewater Crossing | Bridgewater, NJ | 39,096 | 2018 | New | |||||
| Evraz, Inc. |
Aon Center | Chicago, IL | 34,868 | 2023 | New | |||||
| Faurecia USA Holdings, Inc. |
Auburn Hills Corporate Center | Auburn Hills, MI | 21,670 | 2015 | New |
| Leasing Update |
| - | As of year-end 2010, a total of six leases were scheduled to expire during the years 2011 and 2012 that contributed greater than 1% of Annualized Lease Revenue. Due to the addition of 500 West Monroe Street to our office portfolio during the first quarter of 2011, there are two additional leases that contribute greater than 1% of Annualized Lease Revenue that are scheduled to expire in 2011 and 2012. Information regarding the leasing status of the spaces associated with those leases is included below: |
| Tenant Name | Property | Property Location | Square Footage (1) |
Percentage of Current Quarter Annualized Lease Revenue (%) |
Expiration (2) | Leasing Status | ||||||
| United States of America (Comptroller of the Currency) |
One Independence Square |
Washington, D.C. | 322,984 | 3.0% | Q2 2011 | The Company is in discussions with the tenant for a lease renewal of the entire space. The tenant has announced its future intentions to leave the building; therefore, a short-term renewal of the lease for up to 24 months is anticipated. | ||||||
| Zurich American Insurance Company | Windy Point II | Schaumburg, IL | 300,034 | 1.7% | Q3 2011 | The space has been substantially sublet by the tenant. The Company is in discussions with sublessees for direct leases and actively marketing the space for lease. | ||||||
| Kirkland & Ellis | Aon Center | Chicago, IL | 331,887 | 1.7% | Q4 2011 | Kirkland & Ellis is vacating. KPMG has leased 218,123 SF (beginning in August 2012), all but 3,000 SF of which is space currently leased to Kirkland & Ellis. | ||||||
| Marsh USA | 500 West Monroe Street |
Chicago, IL | 173,290 | 1.2% | Q4 2011 | The Company is not actively engaged in discussions with the tenant regarding a lease renewal. It is anticipated that the tenant will vacate at lease expiration. | ||||||
| Sanofi-aventis US | 200 Bridgewater Crossing |
Bridgewater, NJ | 297,379 | 2.0% | Q1 2012 | The Company is actively marketing the space for lease. The tenant will be vacating at lease expiration. | ||||||
| United States of America (NASA) |
Two Independence Square |
Washington, D.C. | 551,907 | 4.3% | Q3 2027 | A 15-year lease was signed with the tenant during the quarter for 597,253 SF, an approximate 8% increase in square footage leased due to a BOMA space remeasurement. | ||||||
| United States of America (National Park Service) |
1201 Eye Street | Washington, D.C. | 219,750 | 1.6% | Q3 2012 | Preliminary discussions with the tenant have commenced. | ||||||
| GE | 500 West Monroe Street |
Chicago, IL | 311,387 | 1.8% | Q4 2012 | The Company is in discussions with the tenant for a long-term lease renewal which includes a reduction in leased square footage. | ||||||
(1) Square footage represents the total square footage leased by the tenant expiring during the expiration quarter.
(2) The lease expiration date presented is that of the majority of the space leased to the tenant at the building.
6
Piedmont Office Realty Trust, Inc.
Financial Highlights
As of March 31, 2011
| Financing and Capital Activity |
| - | As of March 31, 2011, our ratio of gross debt to total market capitalization was 32.3%; our ratio of gross debt to gross real estate assets was 33.4%; and our ratio of gross debt to total gross assets was 29.3%. These debt ratios reflect the inclusion of $185 million of secured debt attributable to 500 West Monroe Street and are based on total principal amount outstanding for our various loans. |
| - | On March 30, 2011, Piedmont completed the purchase of 1200 Enclave Parkway, a 150,000 square foot building located in the prestigious Energy Corridor in Houston, TX. The building was built in 1999 and is 18% leased. Piedmont purchased the building for $18.5 million, or approximately $123 per square foot. The building is located near another property owned by Piedmont, 1430 Enclave Parkway. Given the location, management’s knowledge of the market, the high-quality construction, and the low cost basis, Piedmont expects to create value for its shareholders through the lease-up of this building. |
| - | On March 31, 2011, a UCC foreclosure auction was conducted to sell an equity ownership interest in 500 West Monroe Street that had been pledged as collateral for a defaulted mezzanine loan owned by Piedmont. Piedmont was the winning bidder at that auction and, therefore, became the equity owner of 500 West Monroe Street. The building is a 46-story, 962,000 square foot, Class A, trophy office tower located in Chicago’s West Loop submarket. It was built in 1991 and is currently 67% leased. The two main tenants in the building, GE and Marsh USA, which, combined, lease approximately 50% of the building, have leases with near-term expirations as noted above. Piedmont is committed to stabilizing the occupancy in this well-located, high-quality, amenity-rich building. The building is ideally located between two major transportation centers, Union Station and Ogilvie Transportation Center, in addition to having a 1,330-space parking garage; both of these elements positively impact the leasing potential for this building. |
| - | On January 30, 2011, Piedmont’s 39.7 million shares of Class B-3 common stock converted on a one-for-one basis into Class A common stock. |
| - | On February 24, 2011, the board of directors of Piedmont declared dividends for the first quarter 2011 in the amount of $0.315 per share on its Class A common stock, which represented its only outstanding class of common stock, to stockholders of record as of the close of business on March 7, 2011. The dividends were paid on March 22, 2011. |
| - | Effective January 10, 2011, Bank of New York Mellon became Piedmont’s transfer agent. |
| Subsequent Events |
| - | Piedmont has entered into a binding contract to sell Eastpointe Corporate Center in Issaquah, WA. As of April 21, 2011, the purchaser had completed its due diligence study of the asset and its deposit of 5% of the agreed upon purchase price of $32.0 million became non-refundable. Piedmont anticipates recording a gain upon the sale of the building. The transaction is scheduled to close on July 1, 2011. The building is currently approximately 43% leased and will become 19% leased after the end of the second quarter of 2011 due to the expiration of an additional lease. Through the sale, Piedmont will be able to mitigate the leasing risk associated with this building and further its strategic objective of focusing on select markets. Piedmont has reclassified Eastpointe Corporate Center from real estate assets held-for-use to real estate assets held-for-sale as of April 21, 2011. The results from operations for the asset will be presented in discontinued operations beginning in the second quarter of 2011. |
| - | On April 29, 2011, Piedmont purchased The Dupree Building, a 138,000 square foot building located in Atlanta, GA, for approximately $20.5 million, or $148 per square foot. The building is well-located along the northern arc of I-285, a major bypass expressway encircling Atlanta, with close proximity to GA-400, a major state highway connecting downtown Atlanta with the city’s northern suburbs, as well as executive housing. The building was constructed in 1997, is approximately 83% leased, and is located near Piedmont’s Glenridge Highlands II building. Given the ease of access to the building, Piedmont’s intimate knowledge of the market, the low cost basis, and the long-term nature of the existing leases, Piedmont believes the transaction provides a strong risk-adjusted return for its shareholders. |
| - | On May 4, 2011, the board of directors of Piedmont declared a dividend for the second quarter 2011 in the amount of $0.315 per share on its Class A common stock to stockholders of record as of the close of business on June 1, 2011. The dividend is expected to be paid on June 22, 2011. |
| Guidance for 2011 |
| - | The following financial guidance for calendar year 2011 remains unchanged and is based on management’s expectations at this time: |
| Low High | ||
| Net Income |
$106 - 118 million | |
| Add: Depreciation & Amortization |
$150 - 156 million | |
| Core Funds from Operations |
$256 - 269 million | |
| Core Funds from Operations per diluted share |
$1.48 - 1.56 |
These estimates reflect management’s view of current market conditions and incorporate certain economic and operational assumptions and projections. These estimates exclude future acquisitions and dispositions which could result in a change in the Company’s 2011 outlook and guidance when they are consummated. Actual results could differ from these estimates. Note that individual quarters may fluctuate on both a cash and an accrual basis due to timing of repairs and maintenance, capital expenditures, capital markets activities and one-time revenue or expense events. In addition, the Company’s guidance is based on information available to management as of the date of this supplemental report.
7
Piedmont Office Realty Trust, Inc.
Key Performance Indicators
Unaudited (in thousands except for per share data)
This section of our supplemental report includes non-GAAP financial measures, including, but not limited to, Core Earnings Before Interest, Taxes, Depreciation, and Amortization (Core EBITDA), Funds from Operations (FFO), Core Funds from Operations (Core FFO), and Adjusted Funds from Operations (AFFO). Definitions of these non-GAAP measures are provided on pages 30-31 and reconciliations are provided on pages 33-35.
| Three Months Ended | ||||||||||||||||||||||
| Selected Operating Data |
3/31/2011 | 12/31/2010 | 9/30/2010 | 6/30/2010 | 3/31/2010 | |||||||||||||||||
| Percent leased (1) | 87.3% | 89.2% | 89.0% | 89.8% | 89.6% | |||||||||||||||||
| Rental income | $109,830 | $110,778 | $110,776 | $110,623 | $110,512 | |||||||||||||||||
| Total revenues | $146,554 | $151,312 | $145,502 | $145,181 | $146,844 | |||||||||||||||||
| Total operating expenses | $100,879 | $106,433 | $90,447 | $100,037 | $99,059 | |||||||||||||||||
| Real estate operating income | $45,675 | $44,879 | $55,055 | $45,144 | $47,785 | |||||||||||||||||
| Impairment losses on real estate assets (2) | $0 | $0 | $53 | $9,587 | $0 | |||||||||||||||||
| Core EBITDA (3) | $88,774 | $85,610 | $95,612 | $85,435 | $88,592 | |||||||||||||||||
| Core FFO | $71,281 | $68,178 | $78,229 | $66,247 | $69,198 | |||||||||||||||||
| Core FFO per share - diluted | $0.41 | $0.39 | $0.45 | $0.38 | $0.42 | |||||||||||||||||
| AFFO (3) | $51,974 | $38,086 | $61,468 | $55,812 | $60,291 | |||||||||||||||||
| AFFO per share - diluted | $0.30 | $0.22 | $0.36 | $0.32 | $0.36 | |||||||||||||||||
| Gross dividends | $54,387 | $54,388 | $54,388 | $54,388 | $53,777 | |||||||||||||||||
| Dividends per share | $0.315 | $0.315 | $0.315 | $0.315 | $0.315 | |||||||||||||||||
| Selected Balance Sheet Data |
||||||||||||||||||||||
| Total real estate assets | $3,892,087 | $3,676,828 | $3,689,428 | $3,704,757 | $3,737,478 | |||||||||||||||||
| Total gross real estate assets | $4,804,988 | $4,567,326 | $4,573,622 | $4,560,176 | $4,571,837 | |||||||||||||||||
| Total assets | $4,563,272 | $4,373,480 | $4,389,585 | $4,405,501 | $4,428,410 | |||||||||||||||||
| Net debt (4) | $1,529,603 | $1,333,332 | $1,316,645 | $1,312,116 | $1,318,958 | |||||||||||||||||
| Total liabilities | $1,809,755 | $1,600,026 | $1,591,653 | $1,594,278 | $1,584,781 | |||||||||||||||||
| Ratios |
||||||||||||||||||||||
| Core EBITDA margin (5) | 60.6% | 56.2% | 65.0% | 58.2% | 59.7% | |||||||||||||||||
| Fixed charge coverage ratio (6) |
5.2 x | 4.9 x | 5.5 x | 4.5 x | 4.6 x | |||||||||||||||||
| Net debt to core EBITDA (7) |
4.3 x | 3.9 x | 3.4 x | 3.8 x | 3.7 x | |||||||||||||||||
(1) Please refer to page 21 for additional leased percentage information.
(2) Impairment losses include losses for both wholly-owned and our proportionate share of unconsolidated joint venture assets.
(3) Core EBITDA and AFFO have been adjusted to exclude impairments on real estate assets as shown on pages 33 and 35.
(4) Net debt is calculated as the total principal amount of debt outstanding minus cash and cash equivalents and escrow deposits and restricted cash. As of the first quarter of 2011, net debt includes $185 million of secured debt associated with 500 West Monroe Street which was acquired March 31, 2011.
(5) Core EBITDA margin is calculated as Core EBITDA divided by total revenues (including revenues associated with discontinued operations).
(6) Fixed charge coverage is calculated as Core EBITDA divided by the sum of interest expense, principal amortization, capitalized interest and preferred dividends. We had no capitalized interest, principal amortization or preferred dividends during any of the periods presented.
(7) Core EBITDA is annualized for the purposes of this calculation. As of the first quarter of 2011, net debt includes $185 million of secured debt associated with 500 West Monroe Street which was acquired March 31, 2011.
8
Piedmont Office Realty Trust, Inc.
Consolidated Balance Sheets
Unaudited (in thousands)
| March 31, 2011 | December 31, 2010 | September 30, 2010 | June 30, 2010 | March 31, 2010 | ||||||||||||||||
| Assets: |
||||||||||||||||||||
| Real estate, at cost: |
||||||||||||||||||||
| Land assets |
$ | 688,103 | $ | 647,653 | $ | 652,875 | $ | 651,876 | $ | 651,876 | ||||||||||
| Buildings and improvements |
3,865,239 | 3,688,751 | 3,685,956 | 3,668,859 | 3,672,594 | |||||||||||||||
| Buildings and improvements, accumulated depreciation |
(770,147 | ) | (744,756 | ) | (739,055 | ) | (714,615 | ) | (689,117 | ) | ||||||||||
| Intangible lease asset |
238,504 | 219,770 | 222,952 | 224,532 | 235,022 | |||||||||||||||
| Intangible lease asset, accumulated amortization |
(142,754 | ) | (145,742 | ) | (145,139 | ) | (140,804 | ) | (145,242 | ) | ||||||||||
| Construction in progress |
13,142 | 11,152 | 11,839 | 14,909 | 12,345 | |||||||||||||||
| Total real estate assets |
3,892,087 | 3,676,828 | 3,689,428 | 3,704,757 | 3,737,478 | |||||||||||||||
| Investment in unconsolidated joint ventures |
41,759 | 42,018 | 42,591 | 43,005 | 43,482 | |||||||||||||||
| Cash and cash equivalents |
42,151 | 56,718 | 67,539 | 81,066 | 76,994 | |||||||||||||||
| Tenant receivables, net of allowance for doubtful accounts |
29,726 | 28,849 | 29,269 | 30,986 | 33,152 | |||||||||||||||
| Straight line rent receivable |
103,854 | 105,157 | 100,751 | 96,912 | 95,164 | |||||||||||||||
| Notes receivable |
- | 61,144 | 60,671 | 60,101 | 59,407 | |||||||||||||||
| Due from unconsolidated joint ventures |
594 | 1,158 | 1,085 | 1,124 | 1,202 | |||||||||||||||
| Escrow deposits and restricted cash |
30,771 | 12,475 | 18,341 | 9,343 | 6,573 | |||||||||||||||
| Prepaid expenses and other assets |
11,967 | 11,249 | 18,461 | 15,523 | 12,027 | |||||||||||||||
| Goodwill |
180,097 | 180,097 | 180,097 | 180,097 | 180,097 | |||||||||||||||
| Deferred financing costs, less accumulated amortization |
5,374 | 5,306 | 5,878 | 6,467 | 6,509 | |||||||||||||||
| Deferred lease costs, less accumulated amortization |
224,892 | 192,481 | 175,474 | 176,120 | 176,325 | |||||||||||||||
| Total assets |
$ | 4,563,272 | $ | 4,373,480 | $ | 4,389,585 | $ | 4,405,501 | $ | 4,428,410 | ||||||||||
| Liabilities: |
||||||||||||||||||||
| Line of credit and notes payable |
$ | 1,601,112 | $ | 1,402,525 | $ | 1,402,525 | $ | 1,402,525 | $ | 1,402,525 | ||||||||||
| Accounts payable, accrued expenses, and accrued capital expenditures |
122,769 | 112,648 | 102,411 | 102,365 | 83,172 | |||||||||||||||
| Deferred income |
38,990 | 35,203 | 33,882 | 33,916 | 39,079 | |||||||||||||||
| Intangible lease liabilities, less accumulated amortization |
46,517 | 48,959 | 51,807 | 54,730 | 57,689 | |||||||||||||||
| Interest rate swap |
367 | 691 | 1,028 | 742 | 2,316 | |||||||||||||||
| Total liabilities |
1,809,755 | 1,600,026 | 1,591,653 | 1,594,278 | 1,584,781 | |||||||||||||||
| Stockholders’ equity (1) : |
||||||||||||||||||||
| Class A common stock |
1,727 | 1,330 | 932 | 536 | 534 | |||||||||||||||
| Class B-1 common stock |
- | - | - | 397 | 397 | |||||||||||||||
| Class B-2 common stock |
- | - | 397 | 397 | 397 | |||||||||||||||
| Class B-3 common stock |
- | 397 | 397 | 397 | 397 | |||||||||||||||
| Additional paid in capital |
3,661,570 | 3,661,308 | 3,660,551 | 3,659,910 | 3,659,257 | |||||||||||||||
| Cumulative distributions in excess of earnings |
(915,543 | ) | (895,122 | ) | (869,434 | ) | (855,631 | ) | (820,878 | ) | ||||||||||
| Other comprehensive loss |
(465 | ) | (691 | ) | (1,028 | ) | (742 | ) | (2,316 | ) | ||||||||||
| Piedmont stockholders’ equity |
2,747,289 | 2,767,222 | 2,791,815 | 2,805,264 | 2,837,788 | |||||||||||||||
| Non-controlling interest |
6,228 | 6,232 | 6,117 | 5,959 | 5,841 | |||||||||||||||
| Total stockholders’ equity |
2,753,517 | 2,773,454 | 2,797,932 | 2,811,223 | 2,843,629 | |||||||||||||||
| Total liabilities, redeemable common stock and stockholders’ equity |
$ | 4,563,272 | $ | 4,373,480 | $ | 4,389,585 | $ | 4,405,501 | $ | 4,428,410 | ||||||||||
| All classes of common stock outstanding at end of period (1) |
172,658 | 172,658 | 172,658 | 172,658 | 172,517 | |||||||||||||||
(1) On January 22, 2010, we filed an amendment to our charter to effect a recapitalization of our common stock as described further in our SEC filings. Upon the effectiveness of the recapitalization, each share of our outstanding common stock converted automatically into: (a) 1/12th of a share of our Class A common stock; plus (b) 1/12th of a share of our Class B-1 common stock; plus (c) 1/12th of a share of our Class B-2 common stock; plus (d) 1/12th of a share of our Class B-3 common stock.
9
Piedmont Office Realty Trust, Inc.
Consolidated Statements of Income
Unaudited (in thousands except for per share data)
| Three Months Ended | ||||||||||||||||||||
| 3/31/2011 | 12/31/2010 | 9/30/2010 | 6/30/2010 | 3/31/2010 | ||||||||||||||||
| Revenues: |
||||||||||||||||||||
| Rental income |
$ | 109,830 | $ | 110,778 | $ | 110,776 | $ | 110,623 | $ | 110,512 | ||||||||||
| Tenant reimbursements |
32,490 | 36,997 | 29,690 | 33,374 | 35,083 | |||||||||||||||
| Property management fee revenue |
830 | 948 | 806 | 705 | 753 | |||||||||||||||
| Other rental income |
3,404 | 2,589 | 4,230 | 479 | 496 | |||||||||||||||
| Total revenues |
146,554 | 151,312 | 145,502 | 145,181 | 146,844 | |||||||||||||||
| Operating expenses: |
||||||||||||||||||||
| Property operating costs |
54,957 | 60,401 | 46,612 | 55,497 | 55,361 | |||||||||||||||
| Depreciation |
27,022 | 26,685 | 26,011 | 25,584 | 25,691 | |||||||||||||||
| Amortization |
12,076 | 11,523 | 11,018 | 11,004 | 11,387 | |||||||||||||||
| General and administrative |
6,824 | 7,824 | 6,806 | 7,952 | 6,620 | |||||||||||||||
| Total operating expenses |
100,879 | 106,433 | 90,447 | 100,037 | 99,059 | |||||||||||||||
| Real estate operating income |
45,675 | 44,879 | 55,055 | 45,144 | 47,785 | |||||||||||||||
| Other income (expense): |
||||||||||||||||||||
| Interest expense |
(17,174) | (17,378) | (17,359) | (18,933) | (19,091) | |||||||||||||||
| Interest and other income |
3,460 | 491 | 993 | 1,036 | 969 | |||||||||||||||
| Equity in income of unconsolidated joint ventures |
209 | 630 | 619 | 647 | 737 | |||||||||||||||
| Gain on consolidation of variable interest entity |
1,920 | - | - | - | - | |||||||||||||||
| Total other income (expense) |
(11,585) | (16,257) | (15,747) | (17,250) | (17,385) | |||||||||||||||
| Income from continuing operations |
34,090 | 28,622 | 39,308 | 27,894 | 30,400 | |||||||||||||||
| Operating income, excluding impairment loss |
- | 1,017 | 1,434 | 1,454 | 1,185 | |||||||||||||||
| Impairment loss |
- | - | - | (9,587) | - | |||||||||||||||
| Loss on sale of real estate assets |
- | (817) | - | - | - | |||||||||||||||
| Discontinued operations (1) |
- | 200 | 1,434 | (8,133) | 1,185 | |||||||||||||||
| Net income |
34,090 | 28,822 | 40,742 | 19,761 | 31,585 | |||||||||||||||
| Less: Net income attributable to noncontrolling interest |
(123) | (122) | (158) | (125) | (125) | |||||||||||||||
| Net income attributable to Piedmont |
$ | 33,967 | $ | 28,700 | $ | 40,584 | $ | 19,636 | $ | 31,460 | ||||||||||
| Weighted average common shares outstanding - diluted |
172,955 | 172,996 | 172,885 | 172,718 | 165,200 | |||||||||||||||
| Net income per share available to common stockholders - diluted |
$ | 0.20 | $ | 0.17 | $ | 0.23 | $ | 0.11 | $ | 0.19 | ||||||||||
(1) Reflects operating results for 111 Sylvan Avenue in Englewood Cliffs, NJ, which was sold on December 8, 2010.
10
Piedmont Office Realty Trust, Inc.
Consolidated Statements of Income
Unaudited (in thousands except for per share data)
| Three Months Ended | ||||||||||||||||
| 3/31/2011 | 3/31/2010 | Change | Change | |||||||||||||
| Revenues: |
||||||||||||||||
| Rental income |
$ | 109,830 | $ | 110,512 | $ | (682) | -0.6% | |||||||||
| Tenant reimbursements |
32,490 | 35,083 | (2,593) | -7.4% | ||||||||||||
| Property management fee revenue |
830 | 753 | 77 | 10.2% | ||||||||||||
| Other rental income | 3,404 | 496 | 2,908 | 586.3% | ||||||||||||
| Total revenues |
146,554 | 146,844 | (290) | -0.2% | ||||||||||||
| Operating expenses: |
||||||||||||||||
| Property operating costs |
54,957 | 55,361 | 404 | 0.7% | ||||||||||||
| Depreciation |
27,022 | 25,691 | (1,331) | -5.2% | ||||||||||||
| Amortization |
12,076 | 11,387 | (689) | -6.1% | ||||||||||||
| General and administrative |
6,824 | 6,620 | (204) | -3.1% | ||||||||||||
| Total operating expenses |
100,879 | 99,059 | (1,820) | -1.8% | ||||||||||||
| Real estate operating income |
45,675 | 47,785 | (2,110) | -4.4% | ||||||||||||
| Other income (expense): |
||||||||||||||||
| Interest expense |
(17,174) | (19,091) | 1,917 | 10.0% | ||||||||||||
| Interest and other income |
3,460 | 969 | 2,491 | 257.1% | ||||||||||||
| Equity in income of unconsolidated joint ventures |
209 | 737 | (528) | -71.6% | ||||||||||||
| Gain on consolidation of variable interest entity |
1,920 | - | 1,920 | 0.0% | ||||||||||||
| Total other income (expense) |
(11,585) | (17,385) | 5,800 | 33.4% | ||||||||||||
| Income from continuing operations |
34,090 | 30,400 | 3,690 | 12.1% | ||||||||||||
| Operating income, excluding impairment loss |
- | 1,185 | (1,185) | -100.0% | ||||||||||||
| Discontinued operations (1) |
- | 1,185 | (1,185) | -100.0% | ||||||||||||
| Net income |
34,090 | 31,585 | 2,505 | 7.9% | ||||||||||||
| Less: Net income attributable to noncontrolling interest |
(123) | (125) | 2 | 1.6% | ||||||||||||
| Net income attributable to Piedmont |
$ | 33,967 | $ | 31,460 | $ | 2,507 | 8.0% | |||||||||
| Weighted average common shares outstanding - diluted |
172,955 | 165,200 | ||||||||||||||
| Net income per share available to common stockholders - diluted |
$ | 0.20 | $ | 0.19 | ||||||||||||
(1) Reflects operating results for 111 Sylvan Avenue in Englewood Cliffs, NJ, which was sold on December 8, 2010.
11
Piedmont Office Realty Trust, Inc.
Funds From Operations, Core Funds From Operations and Adjusted Funds From Operations
Unaudited (in thousands except for per share data)
| Three Months Ended | ||||||||
| 3/31/2011 | 3/31/2010 | |||||||
| Net income attributable to Piedmont |
$ | 33,967 | $ | 31,460 | ||||
| Depreciation (1) (2) |
27,154 | 26,250 | ||||||
| Amortization (1) |
12,106 | 11,488 | ||||||
| Gain on consolidation of VIE |
(1,920) | - | ||||||
| Funds from operations |
71,307 | 69,198 | ||||||
| Acquisition costs |
(26) | - | ||||||
| Core funds from operations |
71,281 | 69,198 | ||||||
| Depreciation of non real estate assets |
170 | 178 | ||||||
| Stock-based and other non-cash compensation expense |
968 | 653 | ||||||
| Deferred financing cost amortization |
607 | 696 | ||||||
| Straight-line effects of lease revenue (1) |
2,237 | 1,073 | ||||||
| Amortization of lease-related intangibles (1) |
(1,362) | (1,426) | ||||||
| Income from amortization of discount on purchase of mezzanine loans |
(484) | (668) | ||||||
| Acquisition costs |
26 | - | ||||||
| Non-incremental capital expenditures (3) |
(21,469) | (9,413) | ||||||
| Adjusted funds from operations |
$ | 51,974 | $ | 60,291 | ||||
| Weighted average common shares outstanding - diluted |
172,955 | 165,200 | ||||||
| Funds from operations per share (diluted) |
$ | 0.41 | $ | 0.42 | ||||
| Core funds from operations per share (diluted) |
$ | 0.41 | $ | 0.42 | ||||
| Adjusted funds from operations per share (diluted) |
$ | 0.30 | $ | 0.36 | ||||
(1) Includes adjustments for wholly-owned properties and for our proportionate ownership in unconsolidated joint ventures.
(2) Excludes depreciation of non real estate assets.
(3) Non-incremental capital expenditures are defined on page 31.
12
Piedmont Office Realty Trust, Inc.
Same Store Net Operating Income (Cash Basis)
Unaudited (in thousands)
| Three Months Ended | ||||||||
| 3/31/2011 | 3/31/2010 | |||||||
| Net income attributable to Piedmont |
$ | 33,967 | $ | 31,460 | ||||
| Net income attributable to noncontrolling interest |
123 | 125 | ||||||
| Interest expense |
17,174 | 19,091 | ||||||
| Depreciation (1) |
27,324 | 26,428 | ||||||
| Amortization (1) |
12,106 | 11,488 | ||||||
| Gain on consolidation of VIE |
(1,920) | - | ||||||
| Core EBITDA |
88,774 | 88,592 | ||||||
| General & administrative expenses (1) |
6,899 | 6,696 | ||||||
| Management fee revenue |
(830) | (753) | ||||||
| Interest and other income |
(3,460) | (969) | ||||||
| Lease termination income |
(3,404) | (496) | ||||||
| Lease termination expense - straight line rent & acquisition intangibles write-offs |
436 | 67 | ||||||
| Straight-line effects of lease revenue (1) |
1,972 | 1,006 | ||||||
| Net effect of amortization of above/(below) market in-place lease intangibles (1) |
(1,534) | (1,426) | ||||||
| Core net operating income |
88,853 | 92,717 | ||||||
| Net operating income from: |
||||||||
| Acquisitions (2) |
354 | - | ||||||
| Dispositions (3) |
- | (1,681) | ||||||
| Industrial properties |
(239) | (273) | ||||||
| Unconsolidated joint ventures |
(658) | (1,268) | ||||||
| Same Store NOI |
$ | 88,310 | $ | 89,495 | ||||
| Change period over period |
-1.3% | N/A | ||||||
| Same Store Net Operating Income Top Seven Markets
|
||||||||||||||||||||||
| Three Months Ended | ||||||||||||||||||||||
| 3/31/2011 | 3/31/2010 | |||||||||||||||||||||
| $ | % | $ | % | |||||||||||||||||||
| Chicago (4) |
$ | 18,495 | 20.9 | $ | 17,748 | 19.8 | ||||||||||||||||
| Washington, D.C. (5) |
18,024 | 20.4 | 18,868 | 21.1 | ||||||||||||||||||
| New York (6) |
13,745 | 15.6 | 12,036 | 13.4 | ||||||||||||||||||
| Minneapolis |
5,315 | 6.0 | 5,257 | 5.9 | ||||||||||||||||||
| Los Angeles (7) |
3,789 | 4.3 | 5,002 | 5.6 | ||||||||||||||||||
| Dallas |
3,821 | 4.3 | 3,847 | 4.3 | ||||||||||||||||||
| Boston |
3,877 | 4.4 | 3,729 | 4.2 | ||||||||||||||||||
| Other (8) |
21,244 | 24.1 | 23,008 | 25.7 | ||||||||||||||||||
| Total |
$ | 88,310 | 100.0 | $ | 89,495 | 100.0 | ||||||||||||||||
(1) Includes amounts attributable to wholly-owned properties, including discontinued operations, and our proportionate share of amounts attributable to unconsolidated joint ventures.
(2) Acquisitions consist of Suwanee Gateway One in Suwanee, GA, purchased on September 28, 2010, Meridian Crossings in Richfield, MN, purchased on October 1, 2010, 1200 Enclave Parkway in Houston, TX, purchased on March 30, 2011, and 500 West Monroe Street in Chicago, IL, acquired on March 31, 2011.
(3) Dispositions consists of 111 Sylvan Avenue in Englewood Cliffs, NJ, sold on December 8, 2010.
(4) The increase in Chicago Same Store Net Operating Income for the three months ended March 31, 2011 as compared to the same period in 2010 is primarily due to a rental abatement concession in 2010 associated with a lease renewal at Windy Point I in Schaumburg, IL.
(5) The decrease in Washington, D.C. Same Store Net Operating Income for the three months ended March 31, 2011 as compared to the same period in 2010 is primarily related to a lease termination at 1201 Eye Street in Washington, D.C. resulting in a reduction in revenue of approximately $640,000 as well as a one-time application of supplemental parking receipts during the first quarter of 2010 amounting to approximately $380,000 at 4250 North Fairfax Drive in Arlington, VA.
(6) The increase in New York Same Store Net Operating Income for the three months ended March 31, 2011 as compared to the same period in 2010 is primarily related to a rental abatement in 2010 associated with the lease extension/restructure with the State of New York at 60 Broad Street in New York, NY.
(7) The decrease in Los Angeles Same Store Net Operating Income for the three months ended March 31, 2011 as compared to the same period in 2010 is primarily due to a space contraction at lease renewal effective third quarter 2010 along with a roll down of total revenues per square foot received from that renewing tenant at 800 North Brand Boulevard in Glendale, CA.
(8) The decrease in Other Same Store Net Operating Income for the three months ended March 31, 2011 compared to the same period in 2010 is due to a number of factors, the largest two of which are reduced rental income and operating expense reimbursements due to the expiration of an approximate 87,000 square foot lease during the fourth quarter of 2010 at Eastpointe Corporate Center in Issaquah, WA, and a lease contraction of approximately 91,000 square feet effective third quarter 2010 at Chandler Forum in Chandler, AZ.
13
Piedmont Office Realty Trust, Inc.
Same Store Net Operating Income (Accrual Basis)
Unaudited (in thousands)
| Three Months Ended | ||||||||
| 3/31/2011 | 3/31/2010 | |||||||
| Net income attributable to Piedmont |
$ | 33,967 | $ | 31,460 | ||||
| Net income attributable to noncontrolling interest |
123 | 125 | ||||||
| Interest expense |
17,174 | 19,091 | ||||||
| Depreciation (1) |
27,324 | 26,428 | ||||||
| Amortization (1) |
12,106 | 11,488 | ||||||
| Gain on consolidation of VIE |
(1,920) | - | ||||||
| Core EBITDA |
88,774 | 88,592 | ||||||
| General & administrative expenses (1) |
6,899 | 6,696 | ||||||
| Management fee revenue |
(830) | (753) | ||||||
| Interest and other income |
(3,460) | (969) | ||||||
| Lease termination income |
(3,404) | (496) | ||||||
| Lease termination expense - straight line rent & acquisition intangibles write-offs |
436 | 67 | ||||||
| Core net operating income |
88,415 | 93,137 | ||||||
| Net operating income from: |
||||||||
| Acquisitions (2) |
(819) | - | ||||||
| Dispositions (3) |
- | (1,584) | ||||||
| Industrial properties |
(259) | (281) | ||||||
| Unconsolidated joint ventures |
(616) | (1,252) | ||||||
| Same Store NOI |
$ | 86,721 | $ | 90,020 | ||||
| Change period over period |
-3.7% | N/A | ||||||
|
Same Store Net Operating Income Top Seven Markets
|
||||||||||||||||||||||
| Three Months Ended | ||||||||||||||||||||||
| 3/31/2011 | 3/31/2010 | |||||||||||||||||||||
| $ | % | $ | % | |||||||||||||||||||
| Chicago |
$ | 19,174 | 22.1 | $ | 19,285 | 21.4 | ||||||||||||||||
| Washington, D.C. (4) |
18,079 | 20.8 | 18,964 | 21.1 | ||||||||||||||||||
| New York |
13,998 | 16.1 | 13,822 | 15.4 | ||||||||||||||||||
| Minneapolis |
5,108 | 5.9 | 5,078 | 5.6 | ||||||||||||||||||
| Los Angeles (5) |
3,910 | 4.5 | 5,119 | 5.7 | ||||||||||||||||||
| Dallas |
4,044 | 4.7 | 3,850 | 4.3 | ||||||||||||||||||
| Boston |
3,530 | 4.1 | 3,528 | 3.9 | ||||||||||||||||||
| Other (6) |
18,878 | 21.8 | 20,374 | 22.6 | ||||||||||||||||||
| Total |
$ | 86,721 | 100.0 | $ | 90,020 | 100.0 | ||||||||||||||||
(1) Includes amounts attributable to wholly-owned properties, including discontinued operations, and our proportionate share of amounts attributable to unconsolidated joint ventures.
(2) Acquisitions consist of Suwanee Gateway One in Suwanee, GA, purchased on September 28, 2010, Meridian Crossings in Richfield, MN, purchased on October 1, 2010, 1200 Enclave Parkway in Houston, TX, purchased on March 30, 2011, and 500 West Monroe Street in Chicago, IL, acquired on March 31, 2011.
(3) Dispositions consists of 111 Sylvan Avenue in Englewood Cliffs, NJ, sold on December 8, 2010.
(4) The decrease in Washington, D.C. Same Store Net Operating Income for the three months ended March 31, 2011 as compared to the same period in 2010 is primarily related to a lease termination at 1201 Eye Street in Washington, D.C. resulting in a reduction in revenue of approximately $640,000 as well as a one-time application of supplemental parking receipts during the first quarter of 2010 amounting to approximately $380,000 at 4250 North Fairfax Drive in Arlington, VA.
(5) The decrease in Los Angeles Same Store Net Operating Income for the three months ended March 31, 2011 as compared to the same period in 2010 is primarily due to a space contraction at lease renewal effective third quarter 2010 along with a roll down of total revenues per square foot received from that renewing tenant at 800 North Brand Boulevard in Glendale, CA.
(6) The decrease in Other Same Store Net Operating Income for the three months ended March 31, 2011 compared to the same period in 2010 is due to a number of factors, the largest two of which are reduced rental income and operating expense reimbursements due to the expiration of an approximate 87,000 square foot lease during the fourth quarter of 2010 at Eastpointe Corporate Center in Issaquah, WA, and a lease contraction of approximately 91,000 square feet effective third quarter 2010 at Chandler Forum in Chandler, AZ.
14
Piedmont Office Realty Trust, Inc.
Capitalization Analysis
Unaudited ($ and shares in thousands)
| As
of March 31, 2011 |
As of December 31, 2010 |
|||||||
| Common stock price (1) |
$19.41 | $20.14 | ||||||
| Total shares outstanding (2) |
172,658 | 172,658 | ||||||
| Class A common stock |
172,658 | 132,956 | ||||||
| Class B-1 common stock |
- | - | ||||||
| Class B-2 common stock |
- | - | ||||||
| Class B-3 common stock |
- | 39,702 | ||||||
| Equity market capitalization (3) |
$3,351,301 | $3,477,342 | ||||||
| Total gross debt - principal amount outstanding |
$1,602,525 | $1,402,525 | ||||||
| Total market capitalization (1) |
$4,953,826 | $4,879,867 | ||||||
| Total gross debt / Total market capitalization |
32.3% | 28.7% | ||||||
| Total gross real estate assets |
$4,804,988 | $4,567,326 | ||||||
| Total gross debt / Total gross real estate assets (4) |
33.4% | 30.7% | ||||||
| Total gross debt / Total gross assets (5) |
29.3% | 26.6% | ||||||
(1) Reflects Class A common stock closing price as of the end of the reporting period.
(2) On January 22, 2010, we filed an amendment to our charter to effect a recapitalization of our common stock as described further in our SEC filings. Upon the effectiveness of the recapitalization, each share of our outstanding common stock converted automatically into: (a) 1/12th of a share of our Class A common stock; plus (b) 1/12th of a share of our Class B-1 common stock; plus (c) 1/12th of a share of our Class B-2 common stock; plus (d) 1/12th of a share of our Class B-3 common stock. The recapitalization had the effect of a one-for-three reverse stock split. Class B-1 common stock converted automatically into Class A common stock on August 9, 2010, Class B-2 common stock converted automatically into Class A common stock on November 7, 2010 and Class B-3 common stock converted automatically into Class A common stock on January 30, 2011.
(3) Market value of common shares is defined as the total number of shares of all classes of our common stock outstanding multiplied by the closing price of our Class A common stock at the end of the reporting period, as further qualified in footnotes (1) and (2) above.
(4) Total debt to total gross real estate assets ratio is defined as total debt divided by gross real estate assets. Gross real estate assets is defined as total real estate assets with the add back of accumulated depreciation and accumulated amortization related to real estate assets.
(5) Total debt to total gross assets ratio is defined as total debt divided by gross assets. Gross assets is defined as total assets with the add back of accumulated depreciation and accumulated amortization related to real estate assets.
15
Piedmont Office Realty Trust, Inc.
Debt Summary
Unaudited ($ in thousands)
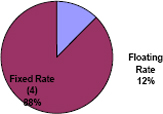
| Floating Rate & Fixed Rate Debt | ||||||||||||
| Debt (1) | Principal Amount Outstanding |
Weighted Average Stated Interest Rate |
Weighted Average Maturity |
| ||||||||
| Floating Rate |
$200,000 (2) | 1.51% (3) | 16.4 months | |||||||||
| Fixed Rate (4) |
1,402,525 | 4.66% | 38.3 months | |||||||||
| Total |
$1,602,525 | 4.27% | 35.5 months | |||||||||
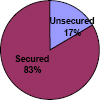
| Unsecured & Secured Debt | ||||||||||||
| Debt (1) | Principal Amount Outstanding |
Weighted Average Stated Interest Rate |
Weighted Average Maturity |
| ||||||||
| Unsecured |
$265,000 | 2.41% (4) | 3.7 months | |||||||||
| Secured |
1,337,525 | 4.64% | 41.8 months | |||||||||
| Total |
$1,602,525 | 4.27% | 35.5 months | |||||||||
| Debt Maturities | ||||||||||||||
| Maturity Year | Secured Debt - Principal Amount Outstanding (1) |
Unsecured Debt - Principal Amount Outstanding (1) |
Weighted Average Rate |
Percentage of Total |
||||||||||
|
2011 |
$0 |
$250,000 |
2.36% |
15.6% |
||||||||||
| 2012 |
230,000 (5) | 15,000 (6) | 2.19% | 15.3% | ||||||||||
| 2013 |
0 | 0 | N/A | N/A | ||||||||||
| 2014 |
695,000 | 0 | 4.92% | 43.4% | ||||||||||
| 2015 |
105,000 | 0 | 5.29% | 6.5% | ||||||||||
| 2016 |
167,525 | 0 | 5.55% | 10.5% | ||||||||||
| 2017 |
140,000 | 0 | 5.76% | 8.7% | ||||||||||
| Total |
$1,337,525 | $265,000 | 4.27% | 100.0% | ||||||||||
(1) All of Piedmont’s outstanding debt as of March 31, 2011 is interest-only debt.
(2) Amount represents the outstanding balance as of March 31, 2011 on the $500 million unsecured line of credit, totaling $15 million, along with the balances on two loans secured by 500 West Monroe Street or equity ownership interests therein, totaling $185 million.
(3) The weighted average interest rate is a weighted average rate for amounts drawn under our $500 million unsecured line of credit and the loans totaling $185 million related to 500 West Monroe Street. Please see the following page for additional details on the interest rate for each loan.
(4) The weighted average interest rate is a weighted average rate for amounts drawn under our $500 million unsecured line of credit and the $250 million unsecured term loan. The $250 million unsecured term loan has a stated variable rate; however, Piedmont entered into interest rate swap agreements which effectively fixed the interest rate on this loan at 2.36% through June 28, 2011.
(5) Amount includes the balances as of March 31, 2011 of the loans related to 500 West Monroe Street, totaling $185 million, which mature in August 2011. Management intends to exercise the one-year extension option available under each loan to extend the maturity dates to August 2012. The payment of a 25 basis point fee will be required to extend each of the loans related to 500 West Monroe Street. Additionally, in order to extend the loans related to 500 West Monroe Street, Piedmont must purchase interest rate caps for the extension period, pay certain reserve amounts to the lender to be held on Piedmont’s behalf to fund potential future expenses, and not then be in default under either loan agreement.
(6) Amount represents the outstanding balance as of March 31, 2011 on the $500 million unsecured line of credit, which matures in August 2011. Management intends to exercise the one-year extension option available under the loan to extend the maturity date to August 2012. The payment of a 15 basis point fee will be required to extend the term of the loan.
16
Piedmont Office Realty Trust, Inc.
Debt Detail
Unaudited ($ in thousands)
| Facility | Property | Rate(1) | Maturity | Principal Amount Outstanding as of March 31, 2011 |
||||||||||
| Secured |
||||||||||||||
| 500 West Monroe Mortgage Loan |
500 West Monroe Street | LIBOR + 1.01% (2) | 8/9/2011 | (3) | $140,000 | |||||||||
| 500 West Monroe Mezzanine Loan (4) |
500 West Monroe Street | LIBOR + 1.45% (2) | 8/9/2011 | (3) | 45,000 | |||||||||
| $45.0 Million Fixed-Rate Loan |
4250 North Fairfax | 5.20% | 6/1/2012 | 45,000 | ||||||||||
| 35 West Wacker Building Mortgage Note |
35 West Wacker Drive | 5.10% | 1/1/2014 | 120,000 | ||||||||||
| Aon Center Chicago Mortgage Note |
Aon Center | 4.87% | 5/1/2014 | 200,000 | ||||||||||
| Aon Center Chicago Mortgage Note |
Aon Center | 5.70% | 5/1/2014 | 25,000 | ||||||||||
| Secured Pooled Facility |
Nine Property Collateralized Pool (5) | 4.84% | 6/7/2014 | 350,000 | ||||||||||
| $105.0 Million Fixed-Rate Loan |
US Bancorp Center | 5.29% | 5/11/2015 | 105,000 | ||||||||||
| $125.0 Million Fixed-Rate Loan |
Four Property Collateralized Pool (6) | 5.50% | 4/1/2016 | 125,000 | ||||||||||
| $42.5 Million Fixed-Rate Loan |
Las Colinas Corporate Center I & II | 5.70% | 10/11/2016 | 42,525 | ||||||||||
| WDC Mortgage Notes |
1201 & 1225 Eye Street | 5.76% | 11/1/2017 | 140,000 | ||||||||||
| Subtotal / Weighted Average (7) |
4.64% | $1,337,525 | ||||||||||||
| Unsecured |
||||||||||||||
| $250 Million Unsecured Term Loan (8) |
N/A | LIBOR + 1.50%(8) | 6/28/2011 | $250,000 | ||||||||||
| $500 Million Unsecured Facility (9) |
N/A | 3.25%(10) | 8/30/2011 | (11) | 15,000 | |||||||||
|
Subtotal / Weighted Average (7) |
2.41% | $265,000 | ||||||||||||
| Total Gross Debt - Principal Amount Outstanding / Weighted Average Stated Rate (7) |
4.27% | $1,602,525 | ||||||||||||
|
Purchase Accounting Valuation Adjustments (12) |
($1,413) | |||||||||||||
| Total Debt - GAAP Amount Outstanding / Weighted Average Effective Rate (13) |
4.54% | $1,601,112 | ||||||||||||
(1) All of Piedmont’s outstanding debt as of March 31, 2011 is interest-only debt.
(2) The LIBOR rate effective under this loan on March 31, 2011 was 0.255%. There are interest rate cap agreements in place through August 2011 that limit Piedmont’s LIBOR exposure to 1.00%. Any increases in LIBOR above 1.00% are the responsibility of our counterparty.
(3) Piedmont may extend the term for one additional year provided that Piedmont is not then in default, a 25 basis point extension fee is paid, interest rate caps are purchased for the extension period, and certain reserve amounts are provided to the lender to be held on Piedmont’s behalf to fund potential future expenses of the property.
(4) The principal balance of this loan is $61.5 million. Piedmont owns a $16.5 million junior participation in this loan, which is eliminated upon consolidation.
(5) The nine property collateralized pool includes 1200 Crown Colony Drive, Braker Pointe III, 2 Gatehall Drive, One and Two Independence Square, 2120 West End Avenue, 200 and 400 Bridgewater Crossing, and Fairway Center II.
(6) The four property collateralized pool includes 1430 Enclave Parkway, Windy Point I and II, and 1055 East Colorado Boulevard.
(7) Weighted average is based on the total balance outstanding and interest rate at March 31, 2011.
(8) The $250 million unsecured term loan has a stated variable rate; however, Piedmont entered into interest rate swap agreements which effectively fixed the interest rate on this loan at 2.36% through June 28, 2011.
(9) All of Piedmont’s outstanding debt as of March 31, 2011 is term debt with the exception of the $500 million unsecured line of credit.
(10) The interest rate on the $500 million unsecured line of credit is equal to the weighted-average interest rate on all outstanding draws as of March 31, 2011. Piedmont may select from multiple interest rate options with each draw, including the prime rate and various length LIBOR locks. All LIBOR selections are subject to an additional spread (0.475% as of March 31, 2011) over the selected rate based on Piedmont’s current credit rating.
(11) Piedmont may extend the term for one additional year provided Piedmont is not then in default and upon the payment of a 15 basis point extension fee.
(12) Adjustments relate to the fair market valuation of the debt associated with 500 West Monroe Street upon consolidation. The discounts will be amortized to interest expense over the remaining contractual term of the debt.
(13) Weighted average effective rate reflects the higher effective rate under the 500 West Monroe Street loans as a result of fair market valuation of the debt upon consolidation of 500 West Monroe Street.
17
Piedmont Office Realty Trust, Inc.
Debt Analysis
As of March 31, 2011
Unaudited
| Debt Covenant Compliance (1) | Required | Actual | ||||||
|
Maximum Leverage Ratio |
0.60 | 0.31 | ||||||
|
Minimum Fixed Charge Coverage Ratio (2) |
1.50 | 4.99 | ||||||
|
Maximum Secured Indebtedness Ratio |
0.40 | 0.26 | ||||||
|
Minimum Unencumbered Leverage Ratio |
1.60 | 8.45 | ||||||
|
Minimum Unencumbered Interest Coverage Ratio (3) |
1.75 | 17.30 | ||||||
|
Maximum Certain Permitted Investments Ratio (4) |
0.35 | 0.01 | ||||||
|
(1) Debt covenant compliance calculations relate to specific calculations detailed in our term loan and line of credit agreements. |
| |||||||
|
(2) Defined as EBITDA for the trailing four quarters (including the company’s share of EBITDA from unconsolidated interests), less one-time or non-recurring gains or losses, less a $0.15 per square foot capital reserve, and excluding the impact of straight line rent leveling adjustments and amortization of intangibles divided by the company’s share of fixed charges, as more particularly described in the credit agreements. |
| |||||||
|
(3) Defined as net operating income for the trailing four quarters for unencumbered assets (including the company’s share of net operating income from unconsolidated interests that are unencumbered) less a $0.15 per square foot capital reserve divided by the company’s share of interest expense associated with unsecured financings only, as more particularly described in the credit agreements. |
| |||||||
|
(4) Permitted investments are defined as unconsolidated interests, debt investments, unimproved land, and development projects. Investments in permitted investments shall not exceed 35% of total asset value.
|
| |||||||
| Other Debt Coverage Ratios | Three months ended March 31, 2011 |
Year
ended December 31, 2010 |
||||||
|
Net debt / Core EBITDA |
4.3 x | 3.8 x | ||||||
|
Fixed charge coverage ratio (5) |
5.2 x | 4.9 x | ||||||
|
Interest coverage ratio (6) |
5.2 x | 4.9 x | ||||||
|
(5) Fixed charge coverage is calculated as Core EBITDA divided by the sum of interest expense, principal amortization, capitalized interest and preferred dividends. We had no capitalized interest, principal amortization or preferred dividends during the periods ended March 31, 2011 and December 31, 2010. |
| |||||||
|
(6) Interest coverage ratio is calculated as Core EBITDA divided by the sum of interest expense and capitalized interest. We had no capitalized interest during the periods ended March 31, 2011 and December 31, 2010.
|
| |||||||
18
Piedmont Office Realty Trust, Inc.
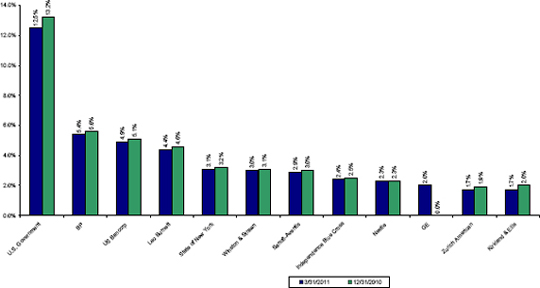
Tenant Diversification
As of March 31, 2011
(in thousands)
| Credit Rating (1) | Number of Properties |
Lease Expiration(s) (2) |
Annualized Lease Revenue (3) |
Percentage of Annualized Lease Revenue (%) |
Leased Square Footage |
Percentage of Leased Square Footage (%) | ||||||||
| U.S. Government |
AAA / Aaa | 10 | (4) | $75,943 | 12.5 | 1,773 | 9.4 | |||||||
| BP (5) |
A / A2 | 1 | 2013 | 32,580 | 5.4 | 776 | 4.1 | |||||||
| US Bancorp |
A+ / Aa3 | 3 | 2014 / 2023 (6) | 29,730 | 4.9 | 1,052 | 5.6 | |||||||
| Leo Burnett |
BBB+ / Baa2 | 2 | 2019 | 26,419 | 4.4 | 682 | 3.6 | |||||||
| State of New York |
AA / Aa2 | 1 | 2019 | 19,095 | 3.1 | 481 | 2.6 | |||||||
| Winston & Strawn |
No rating available (7) | 1 | 2024 | 18,332 | 3.0 | 417 | 2.2 | |||||||
| Sanofi-aventis |
AA- / A2 | 2 | 2012 | 17,736 | 2.9 | 454 | 2.4 | |||||||
| Independence Blue Cross |
No rating available | 1 | 2023 | 14,571 | 2.4 | 761 | 4.1 | |||||||
| Nestle |
AA / Aa1 | 1 | 2015 | 13,724 | 2.3 | 392 | 2.1 | |||||||
| GE |
AA+ / Aa2 | 2 | 2012 | 12,039 | 2.0 | 333 | 1.8 | |||||||
| Zurich American |
AA- | 1 | 2011 | 10,611 | 1.7 | 300 | 1.6 | |||||||
| Kirkland & Ellis |
No rating available (7) | 1 | 2011 | 10,180 | 1.7 | 332 | 1.8 | |||||||
| Shaw |
BBB- / Ba1 | 1 | 2018 | 9,782 | 1.6 | 313 | 1.7 | |||||||
| State Street Bank |
AA- / Aa2 | 1 | 2021 | 9,552 | 1.6 | 235 | 1.3 | |||||||
| City of New York |
AA / Aa2 | 1 | 2020 | 9,319 | 1.5 | 313 | 1.7 | |||||||
| Lockheed Martin |
A- / Baa1 | 3 | 2014 | 9,142 | 1.5 | 284 | 1.5 | |||||||
| DDB Needham |
BBB+ / Baa1 | 1 | 2018 | 8,787 | 1.4 | 244 | 1.3 | |||||||
| Gallagher |
No rating available | 1 | 2018 | 7,969 | 1.3 | 307 | 1.6 | |||||||
| Marsh USA |
BBB- / Baa2 | 1 | 2011 | 7,326 | 1.2 | 173 | 0.9 | |||||||
| Gemini |
A+ / Aa3 | 1 | 2013 | 7,320 | 1.2 | 205 | 1.1 | |||||||
| Other |
Various | 256,415 | 42.4 | 8,946 | 47.6 | |||||||||
| Total |
$606,572 | 100.0 | 18,773 | 100.0 |
(1) Credit rating may reflect credit rating of parent or guarantor. When available, both the Standard & Poor’s credit rating and the Moody’s credit rating are provided.
(2) Represents the expiration year of the majority of the square footage leased by the tenant.
(3) Please refer to page 30 for the definition of Annualized Lease Revenue.
(4) There are several leases with several different agencies of the U.S. Government with expiration years ranging from 2011 to 2027.
(5) Majority of space is subleased to Aon Corporation.
(6) US Bank’s lease at One & Two Meridian Crossings, representing approximately 337,000 square feet and $8.1 million of Annualized Lease Revenue, expires in 2023. Of US Bancorp’s lease at US Bancorp Center for 715,000 square feet, representing $21.6 million of Annualized Lease Revenue, approximately 635,000 square feet, representing $18.8 million of Annualized Lease Revenue, expires in 2014, with the balance of approximately 80,000 square feet, representing $2.8 million of Annualized Lease Revenue, expiring during the second quarter of 2011.
(7) While no ratings are available for Winston & Strawn and Kirkland & Ellis, these tenants are ranked #34 and #6, respectively, in the 2011 AmLaw 100 ranking (based on 2010 financial data), a publication of The American Lawyer Magazine, which annually ranks the top-grossing and most profitable law firms.
19
Piedmont Office Realty Trust, Inc.
Tenant Credit Rating & Lease Distribution Information
As of March 31, 2011
| Tenant Credit Rating (1) | Annualized Lease Revenue ($’s in thousands) |
Percentage of Annualized Lease Revenue (%) |
||||||||
|
AAA / Aaa |
$83,427 | 13.7 | ||||||||
| AA / Aa |
152,003 | 25.1 | ||||||||
| A / A |
101,906 | 16.8 | ||||||||
| BBB / Baa |
99,560 | 16.4 | ||||||||
| BB / Ba |
5,471 | 0.9 | ||||||||
| B / B |
20,025 | 3.3 | ||||||||
| Below |
0 | 0.0 | ||||||||
| Not rated (2) |
144,180 | 23.8 | ||||||||
| Total |
$606,572 | 100.0 | ||||||||
Lease Distribution
As of March 31, 2011
| Number of Leases | Percentage of Leases (%) |
Annualized Lease Revenue (in thousands) |
Percentage of Annualized Lease Revenue (%) |
Leased Square Footage (in thousands) |
Percentage of Leased Square Footage (%) | |||||||||
| 2,500 or Less |
170 | 34.4 | $16,013 | 2.6 | 136 | 0.7 | ||||||||
| 2,501 - 10,000 |
127 | 25.7 | 22,969 | 3.8 | 659 | 3.5 | ||||||||
| 10,001 - 20,000 |
58 | 11.8 | 26,346 | 4.3 | 840 | 4.5 | ||||||||
| 20,001 - 40,000 |
52 | 10.5 | 46,064 | 7.7 | 1,478 | 7.9 | ||||||||
| 40,001 - 100,000 |
31 | 6.3 | 57,799 | 9.5 | 1,950 | 10.4 | ||||||||
| Greater than 100,000 |
56 | 11.3 | 437,381 | 72.1 | 13,710 | 73.0 | ||||||||
| Total |
494 | 100.0 | $606,572 | 100.0 | 18,773 | 100.0 | ||||||||
(1) Credit rating may reflect credit rating of parent or guarantor. Where differences exist between the Standard & Poor’s credit rating for a tenant and the Moody’s credit rating for a tenant, the higher credit rating is selected for this analysis.
(2) The classification of a tenant as “not rated” does not indicate that the tenant is of poor credit quality, but rather that the tenant or the tenant’s debt, if any, is not rated. Included in this category are such tenants as Winston & Strawn, Independence Blue Cross, McKinsey & Company and KPMG.
20
Piedmont Office Realty Trust, Inc.
Office Leasing Activity
(in thousands)
| Three Months Ended March 31, 2011 | Three Months Ended March 31, 2010 | |||||||||||||||||||||||||||
| Leased Square Footage |
Rentable Square Footage |
Percent Leased (1) | Leased Square Footage |
Rentable Square Footage |
Percent Leased (1) | |||||||||||||||||||||||
| As of December 31, 2010 |
18,214 | 20,408 | 89.2% | As of December 31, 2009 |
18,221 | 20,229 | 90.1% | |||||||||||||||||||||
| New leases |
796 | New leases |
151 | |||||||||||||||||||||||||
| Expired leases |
(904) | Expired leases |
(255) | |||||||||||||||||||||||||
| Other |
(1) | (4) | Other |
(1) | 1 | |||||||||||||||||||||||
| Subtotal |
18,105 | 20,404 | 88.7% | Subtotal |
18,116 | 20,230 | 89.6% | |||||||||||||||||||||
| Acquisitions during period |
668 | 1,112 | Acquisitions during period |
- | - | |||||||||||||||||||||||
| Dispositions during period |
- | - | Dispositions during period |
- | - | |||||||||||||||||||||||
| As of March 31, 2011 (2) (3) |
18,773 | 21,516 | 87.3% | As of March 31, 2010 (2) |
18,116 | 20,230 | 89.6% | |||||||||||||||||||||
| Less Acquisitions |
Less Dispositions |
|||||||||||||||||||||||||||
| Acquisitions after March 31, 2010 |
(1,036) | (1,638) | Dispositions after March 31, 2010 |
(410) | (410) | |||||||||||||||||||||||
| Same Store Total |
17,737 | 19,878 | 89.2% | Same Store Total |
17,706 | 19,820 | 89.3% | |||||||||||||||||||||
Rental Rate Roll Up / Roll Down (4) (5)
| Three Months Ended March 31, 2011 | ||||||||||||||||||||
| Square Feet | % of Total Signed During Period |
% of Rentable Square Footage |
% Change Cash Rents |
% Change Accrual Rents (6) |
||||||||||||||||
| New, renewal, and expansion leases executed for spaces vacant less than one year | 724 | 86% | 3.4% | 8.1% | 12.1% | |||||||||||||||
| Leases executed for spaces excluded from analysis (7) | 119 | 14% | ||||||||||||||||||
(1) Calculated as leased square footage as of period end with the addition of square footage associated with uncommenced leases for spaces vacant as of period end, divided by total rentable square footage as of period end, expressed as a percentage.
(2) The square footage associated with leases with end of period expiration dates is included in the end of the period leased square footage. End of period leased square footage includes short-term space leased on behalf of NASA in accordance with requirements stipulated under its lease to allow it to restructure its space at Two Independence Square in Washington, DC. As of March 31, 2011, total short-term space amounts to approximately 58,000 square feet and it will be occupied until an estimated date of June 30, 2013.
(3) Excluding executed but not commenced leases for currently vacant spaces, comprising approximately 466,000 square feet, and leases for which no rental income is being recognized due to rental abatement concessions, comprising approximately 203,000 square feet, Piedmont’s economic occupancy as of March 31, 2011 was 84.1%.
(4) The population analyzed consists of office leases executed during the period (retail leases as well as leases associated with storage spaces, management offices, industrial properties and unconsolidated joint venture assets were excluded from this analysis). For spaces that had been vacant for less than one year, the rents last in effect for the previous lease were compared to the initial rents of the new lease. Spaces that had been vacant for greater than one year were excluded from this analysis.
(5) For leases under which a tenant may use, at its discretion, a portion of its tenant improvement allowance for expenses other than those related to improvements to its space, an assumption is made that the tenant elects to use any such portion of its tenant improvement allowance for improvements to its space prior to the commencement of its lease. This assumption is made based upon the historical tenant improvement allowance usage patterns of the Company’s tenants.
(6) For newly signed leases which have variations in straight line rent calculations, whether for known future expansions, contractions, lease expense recovery structure changes, or other similar reasons, the weighted average of such straight line rent calculations is used for the purposes of this analysis.
(7) Represents leases signed at our consolidated office assets that do not qualify for inclusion in the analysis primarily because the space for which the new lease was signed had been vacant for greater than one year. Leases signed with Piedmont entities are excluded from the analysis.
21
Piedmont Office Realty Trust, Inc.
Lease Expiration Schedule
As of March 31, 2011
(in thousands)
| OFFICE PORTFOLIO |
GOVERNMENTAL ENTITIES | |||||||||||||||
| Annualized Lease Revenue (1) |
Percentage of Annualized Lease |
Rentable Square Footage |
Percentage of Rentable Square Footage (%) |
Annualized Lease Revenue (1) |
Percentage of Annualized Lease Revenue (%) |
Percentage of Current Year Total Annualized Lease Revenue Expiring (%) | ||||||||||
|
Vacant |
$0 | 0.0 | 2,743 | 12.7 | $0 | 0.0 | N/A | |||||||||
| 2011 (2) |
70,595 | 11.6 | 1,892 | 8.8 | 18,498 | 3.1 | 26.2 | |||||||||
| 2012 (3) |
59,947 | 9.9 | 1,821 | 8.5 | 7,459 | 1.2 | 12.4 | |||||||||
| 2013 |
59,332 | 9.8 | 1,640 | 7.6 | 1,598 | 0.3 | 2.7 | |||||||||
| 2014 |
55,054 | 9.1 | 1,697 | 7.9 | 3,517 | 0.6 | 6.4 | |||||||||
| 2015 |
44,155 | 7.3 | 1,586 | 7.4 | 0 | 0.0 | 0.0 | |||||||||
| 2016 |
33,285 | 5.5 | 1,191 | 5.5 | 1,389 | 0.2 | 4.2 | |||||||||
| 2017 |
22,232 | 3.7 | 648 | 3.0 | 1,251 | 0.2 | 5.6 | |||||||||
| 2018 |
47,650 | 7.9 | 1,605 | 7.5 | 8,647 | 1.4 | 18.1 | |||||||||
| 2019 |
54,644 | 9.0 | 1,486 | 6.9 | 19,095 | 3.1 | 34.9 | |||||||||
| 2020 |
31,442 | 5.2 | 1,140 | 5.3 | 11,944 | 2.0 | 38.0 | |||||||||
| 2021 |
15,081 | 2.5 | 536 | 2.5 | 1,025 | 0.2 | 6.8 | |||||||||
| 2022 |
18,279 | 3.0 | 699 | 3.2 | 0 | 0.0 | 0.0 | |||||||||
| 2023 |
25,697 | 4.2 | 1,183 | 5.5 | 0 | 0.0 | 0.0 | |||||||||
| 2024 |
25,765 | 4.2 | 576 | 2.7 | 0 | 0.0 | 0.0 | |||||||||
| Thereafter |
43,414 | 7.1 | 1,073 | 5.0 | 30,276 | 5.0 | 69.7 | |||||||||
|
Total / Weighted Average |
$606,572 | 100.0 | 21,516 | 100.0 | $104,699 | 17.3 | ||||||||||
(1) Annualized Lease Revenue for purposes of this schedule includes the revenue effects of leases executed but not commenced as of March 31, 2011.
(2) Includes leases with an expiration date of March 31, 2011 aggregating 7,502 square feet and Annualized Lease Revenue of $284,617.
(3) Leases and other revenue-producing agreements on a month-to-month basis, aggregating 15,822 square feet and Annualized Lease Revenue of $428,115, are assigned a lease expiration date of a year and a day beyond the period end date.
22
Piedmont Office Realty Trust, Inc.
Annual Lease Expirations
As of March 31, 2011
(in thousands)
| 12/31/2011 (1) | 12/31/2012 | 12/31/2013 | 12/31/2014 | 12/31/2015 | ||||||||||||||||
| Expiring Square Footage |
Expiring Lease Revenue (2) |
Expiring Square Footage |
Expiring Lease Revenue (2) |
Expiring Square Footage |
Expiring Lease Revenue (2) |
Expiring Square Footage |
Expiring Lease Revenue (2) |
Expiring Square Footage |
Expiring Lease Revenue (2) | |||||||||||
| Atlanta |
82 | $2,019 | 34 | $620 | 29 | $728 | 28 | $576 | 0 | $0 | ||||||||||
| Austin |
0 | 0 | 0 | 0 | 0 | 0 | 0 | 0 | 0 | 0 | ||||||||||
| Boston |
0 | 0 | 7 | 336 | 0 | 29 | 27 | 1,884 | 133 | 2,610 | ||||||||||
| Central & South Florida |
134 | 3,034 | 4 | 107 | 8 | 215 | 17 | 438 | 6 | 134 | ||||||||||
| Chicago |
614 | 24,181 | 386 | 14,080 | 801 | 32,491 | 34 | 3,962 | 202 | 5,569 | ||||||||||
| Cleveland |
0 | 0 | 112 | 1,890 | 14 | 335 | 0 | 0 | 0 | 0 | ||||||||||
| Dallas |
42 | 957 | 87 | 2,220 | 10 | 245 | 41 | 997 | 284 | 6,131 | ||||||||||
| Denver |
0 | 0 | 0 | 0 | 0 | 0 | 0 | 0 | 0 | 0 | ||||||||||
| Detroit |
225 | 3,637 | 84 | 2,233 | 136 | 1,984 | 12 | 217 | 131 | 3,866 | ||||||||||
| Houston |
15 | 355 | 11 | 346 | 0 | 0 | 0 | 0 | 0 | 0 | ||||||||||
| Los Angeles |
74 | 2,812 | 46 | 1,719 | 70 | 2,528 | 5 | 211 | 424 | 14,690 | ||||||||||
| Minneapolis |
176 | 5,780 | 32 | 1,062 | 45 | 1,438 | 808 | 22,915 | 98 | 3,358 | ||||||||||
| Nashville |
0 | 0 | 0 | 0 | 0 | 0 | 0 | 0 | 0 | 0 | ||||||||||
| New York |
3 | 296 | 546 | 19,282 | 232 | 8,421 | 98 | 4,155 | 66 | 2,416 | ||||||||||
| Philadelphia |
0 | 0 | 0 | 0 | 0 | 0 | 0 | 0 | 0 | 0 | ||||||||||
| Phoenix |
45 | 903 | 0 | 0 | 0 | 0 | 0 | 0 | 194 | 3,798 | ||||||||||
| Portland |
105 | 1,501 | 147 | 2,023 | 0 | 0 | 74 | 1,079 | 0 | 0 | ||||||||||
| Seattle |
38 | 1,625 | 0 | 0 | 0 | 0 | 0 | 0 | 22 | 534 | ||||||||||
| Washington, D.C. |
339 | 19,011 | 325 | 14,958 | 295 | 10,321 | 553 | 18,703 | 26 | 1,065 | ||||||||||
| Total / Weighted Average (3) |
1,892 | $66,111 | 1,821 | $60,876 | 1,640 | $58,735 | 1,697 | $55,137 | 1,586 | $44,171 | ||||||||||
(1) Includes leases with an expiration date of March 31, 2011 aggregating 7,502 square feet.
(2) Expiring lease revenue is calculated as expiring square footage multiplied by the gross rent per square foot of the tenant currently leasing the space.
(3) Total expiring lease revenue in any given year will not tie to the expiring Annualized Lease Revenue presented on the Lease Expiration Schedule as the Lease Expiration Schedule accounts for revenue effects of newly signed leases. Expirations in the Lease Expiration Schedule reflect rental rates of newly executed leases, effectively incorporating known roll ups and roll downs.
23
Piedmont Office Realty Trust, Inc.
Capital Expenditures by Type
For the quarter ended March 31, 2011
Unaudited ($ in thousands)
| For the Three Months Ended | ||||||||||||||||||||||
| 3/31/2011 | 12/31/2010 | 9/30/2010 | 6/30/2010 | 3/31/2010 | ||||||||||||||||||
| Non-incremental (1) |
||||||||||||||||||||||
| Bldg / construction / dev |
$1,734 | $3,082 | $2,293 | $3,607 | $2,637 | |||||||||||||||||
| Tenant improvements |
10,266 | 17,197 | 6,088 | 2,333 | 4,039 | |||||||||||||||||
| Leasing costs |
9,469 | 6,315 | 4,948 | 3,029 | 2,737 | |||||||||||||||||
| Total non-incremental |
21,469 | 26,594 | 13,329 | 8,969 | 9,413 | |||||||||||||||||
|
Incremental (1) |
||||||||||||||||||||||
| Bldg / construction / dev |
923 | 1,174 | 417 | 439 | 250 | |||||||||||||||||
| Tenant improvements |
1,053 | 6 | 0 | 0 | 0 | |||||||||||||||||
| Leasing costs |
75 | 2,531 | 0 | 0 | 0 | |||||||||||||||||
| Total incremental
|
2,051 | 3,711 | 417 | 439 | 250 | |||||||||||||||||
| Total capital expenditures |
$23,520 | $30,305 | $13,746 | $9,408 | $9,663 | |||||||||||||||||
| Tenant improvement commitments (2) |
|
|||||||||||||||||||||
|
Tenant improvement commitments outstanding as of December 31, 2010 |
|
$111,390 | ||||||||||||||||||||
| New tenant improvement commitments related to leases executed during period |
|
24,717 | ||||||||||||||||||||
| Tenant improvement expenditures |
|
(11,319) | ||||||||||||||||||||
| Less: Tenant improvement expenditures fulfilled through accrued liabilities already presented on Piedmont’s balance sheet, expired commitments or other adjustments |
|
6,629 | ||||||||||||||||||||
| Tenant improvement commitments fulfilled, expired or other adjustments |
|
(4,690) | ||||||||||||||||||||
| Total as of March 31, 2011 |
|
$131,417 | ||||||||||||||||||||
NOTE: The information presented on this page is for all consolidated assets, inclusive of our industrial properties.
(1) Definitions for non-incremental and incremental capital expenditures can be found on pages 30 and 31.
(2) Commitments are unexpired contractual tenant improvement obligations for leases executed in current and prior periods that have not yet been incurred and have not otherwise been presented on Piedmont’s financial statements. The four largest commitments total approximately $73.9 million, or 56% of total outstanding commitments.
24
Piedmont Office Realty Trust, Inc.
Contractual Tenant Improvements and Leasing Commissions
| For the Year Ended | ||||||||||||||||||
| For the Three Months Ended March 31, 2011 |
2010 | 2009 | 2008 | |||||||||||||||
| Renewal Leases |
||||||||||||||||||
| Number of leases |
8 | 37 | 34 | 34 | ||||||||||||||
| Square feet |
615,793 | 1,241,481 | 1,568,895 | 967,959 | ||||||||||||||
|
Tenant improvements per square foot (1) |
$64.47 | $14.40 | $12.01 | $8.28 | ||||||||||||||
| Leasing commissions per square foot |
$16.09 | $8.40 | $5.51 | $7.17 | ||||||||||||||
| Total per square foot |
$80.56 | $22.80 | $17.52 | $15.45 | ||||||||||||||
| Tenant improvements per square foot per year of lease term |
$4.39 | $1.74 | $1.44 | $1.39 | ||||||||||||||
| Leasing commissions per square foot per year of lease term |
$1.09 | $1.02 | $0.66 | $1.20 | ||||||||||||||
| Total per square foot per year of lease term |
$5.48 | $2.76 | $2.10 | $2.59 | ||||||||||||||
| New Leases |
||||||||||||||||||
| Number of leases |
16 | 56 | 28 | 37 | ||||||||||||||
| Square feet |
226,931 | 866,212 | 700,295 | 747,919 | ||||||||||||||
| Tenant improvements per square foot (1) |
$48.16 | $32.65 | $45.04 | $30.59 | ||||||||||||||
| Leasing commissions per square foot |
$15.93 | $11.28 | $17.12 | $15.95 | ||||||||||||||
| Total per square foot |
$64.09 | $43.93 | $62.16 | $46.54 | ||||||||||||||
| Tenant improvements per square foot per year of lease term |
$5.55 | $4.16 | $4.05 | $3.24 | ||||||||||||||
| Leasing commissions per square foot per year of lease term |
$1.84 | $1.44 | $1.54 | $1.69 | ||||||||||||||
| Total per square foot per year of lease term |
$7.39 | $5.60 | $5.59 | $4.93 | ||||||||||||||
| Total |
||||||||||||||||||
| Number of leases |
24 | 93 | 62 | 71 | ||||||||||||||
| Square feet |
842,724 | 2,107,693 | 2,269,190 | 1,715,878 | ||||||||||||||
| Tenant improvements per square foot (1) |
$60.07 | $21.90 | $22.21 | $18.01 | ||||||||||||||
| Leasing commissions per square foot |
$16.04 | $9.59 | $9.09 | $11.00 | ||||||||||||||
| Total per square foot |
$76.11 | $31.49 | $31.30 | $29.01 | ||||||||||||||
| Tenant improvements per square foot per year of lease term |
$4.59 | $2.70 | $2.42 | $2.41 | ||||||||||||||
| Leasing commissions per square foot per year of lease term |
$1.23 | $1.18 | $0.99 | $1.47 | ||||||||||||||
| Total per square foot per year of lease term |
$5.82 | $3.88 | $3.41 | $3.88 | ||||||||||||||
NOTE: This information is presented for our consolidated office assets only. Short-term leases (leases for a term of less than one year) are excluded from this information.
(1) For leases under which a tenant may use, at its discretion, a portion of its tenant improvement allowance for expenses other than those related to improvements to its space, an assumption is made that the tenant elects to use any such portion of its tenant improvement allowance for improvements to its space prior to the commencement of its lease. This assumption is made based upon the historical tenant improvement allowance usage patterns of the Company’s tenants.
25
Piedmont Office Realty Trust, Inc.
Geographic Diversification
As of March 31, 2011
| Location | Number of Properties |
Annualized Lease Revenue ($’s in thousands) |
Percentage of Annualized Lease Revenue (%) |
Rentable Square Footage (in Thousands) |
Percentage of Rentable Square Footage (%) |
Leased Square Footage (in thousands) |
Percent Leased (%) | |||||||
| Chicago |
7 | $180,078 | 29.7 | 5,850 | 27.2 | 4,918 | 84.1 | |||||||
| Washington, D.C. |
14 | 116,792 | 19.3 | 3,045 | 14.2 | 2,744 | 90.1 | |||||||
| New York |
8 | 92,354 | 15.2 | 2,920 | 13.6 | 2,746 | 94.0 | |||||||
| Minneapolis |
4 | 46,054 | 7.6 | 1,612 | 7.5 | 1,576 | 97.8 | |||||||
| Los Angeles |
5 | 30,812 | 5.1 | 1,144 | 5.3 | 964 | 84.3 | |||||||
| Boston |
4 | 24,239 | 4.0 | 583 | 2.7 | 562 | 96.4 | |||||||
| Dallas |
7 | 24,049 | 4.0 | 1,275 | 5.9 | 1,079 | 84.6 | |||||||
| Detroit |
4 | 18,197 | 3.0 | 929 | 4.2 | 809 | 87.1 | |||||||
| Philadelphia |
1 | 14,571 | 2.4 | 761 | 3.5 | 761 | 100.0 | |||||||
| Atlanta |
4 | 10,930 | 1.8 | 750 | 3.5 | 446 | 59.5 | |||||||
| Houston |
2 | 10,521 | 1.7 | 463 | 2.2 | 341 | 73.7 | |||||||
| Nashville |
1 | 6,975 | 1.1 | 312 | 1.5 | 312 | 100.0 | |||||||
| Phoenix |
4 | 6,785 | 1.1 | 554 | 2.6 | 344 | 62.1 | |||||||
| Central & South Florida |
3 | 5,867 | 1.0 | 299 | 1.4 | 253 | 84.6 | |||||||
| Austin |
1 | 5,482 | 0.9 | 195 | 0.9 | 195 | 100.0 | |||||||
| Portland |
4 | 4,603 | 0.8 | 325 | 1.5 | 325 | 100.0 | |||||||
| Cleveland |
2 | 3,235 | 0.5 | 187 | 0.9 | 175 | 93.6 | |||||||
| Denver |
1 | 2,712 | 0.4 | 156 | 0.7 | 156 | 100.0 | |||||||
| Seattle |
1 | 2,316 | 0.4 | 156 | 0.7 | 67 | 42.9 | |||||||
| Total / Weighted Average |
77 | $606,572 | 100.0 | 21,516 | 100.0 | 18,773 | 87.3 | |||||||
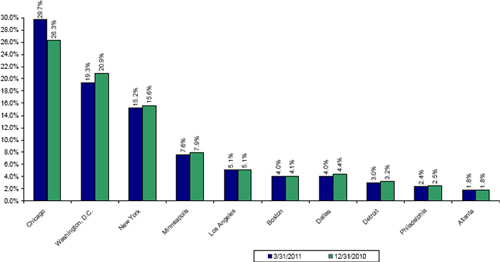
26
Piedmont Office Realty Trust, Inc.
Industry Diversification
As of March 31, 2011
| Industry Diversification | Number of Tenants |
Percentage of Total Tenants (%) |
Annualized Lease Revenue ($’s in thousands) |
Percentage of Annualized Lease Revenue (%) |
Leased Square Footage (in thousands) |
Percentage of Leased Square Footage (%) | ||||||
| Governmental Entity |
6 | 1.4 | $104,699 | 17.3 | 2,574 | 13.7 | ||||||
| Business Services |
63 | 15.1 | 68,641 | 11.3 | 2,210 | 11.8 | ||||||
| Depository Institutions |
14 | 3.4 | 57,225 | 9.4 | 1,790 | 9.5 | ||||||
| Legal Services |
10 | 2.4 | 36,423 | 6.0 | 1,019 | 5.4 | ||||||
| Insurance Carriers |
20 | 4.8 | 36,322 | 6.0 | 1,495 | 8.0 | ||||||
| Petroleum Refining & Related Industries |
1 | 0.2 | 32,580 | 5.4 | 776 | 4.1 | ||||||
| Nondepository Credit Institutions |
12 | 2.9 | 32,336 | 5.3 | 1,076 | 5.7 | ||||||
| Chemicals & Allied Products |
7 | 1.7 | 23,550 | 3.9 | 700 | 3.7 | ||||||
| Insurance Agents, Brokers & Services |
9 | 2.2 | 18,914 | 3.1 | 598 | 3.2 | ||||||
| Engineering, Accounting, Research, Management & Related Services |
26 | 6.2 | 18,774 | 3.1 | 572 | 3.0 | ||||||
| Communications |
36 | 8.6 | 17,544 | 2.9 | 595 | 3.2 | ||||||
| Security & Commodity Brokers, Dealers, Exchanges & Services |
21 | 5.0 | 15,250 | 2.5 | 548 | 2.9 | ||||||
| Food & Kindred Products |
4 | 1.0 | 14,507 | 2.4 | 423 | 2.3 | ||||||
| Educational Services |
7 | 1.7 | 12,011 | 2.0 | 276 | 1.5 | ||||||
| Transportation Equipment |
4 | 1.0 | 11,275 | 1.9 | 346 | 1.8 | ||||||
| Other |
177 | 42.4 | 106,521 | 17.5 | 3,775 | 20.2 | ||||||
| Total |
417 | 100.0 | $606,572 | 100.0 | 18,773 | 100.0 | ||||||
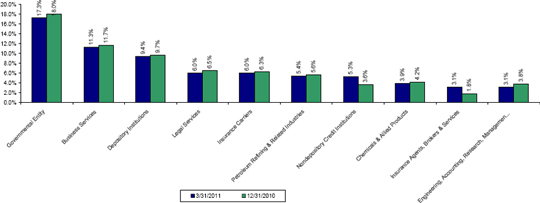
27
Piedmont Office Realty Trust, Inc.
Property Investment Activity
| Acquisitions | ||||||||||||||||||||
| Property Name | Location | Acquisition Date |
Percent Ownership (%) |
Year Built | Purchase Price ($’s in thousands) |
Rentable Square Footage (in thousands) |
Percent Leased at Acquisition (%) | |||||||||||||
| Suwanee Gateway One |
Suwanee, GA | 9/28/2010 | 100 | 2008 | $7,875 | 142 | 0 | |||||||||||||
| Meridian Crossings |
Richfield, MN | 10/1/2010 | 100 | 1997-1998 | 65,611 | 384 | 96 | |||||||||||||
| 1200 Enclave Parkway |
Houston, TX | 3/30/2011 | 100 | 1999 | 18,500 | 150 | 18 | |||||||||||||
| 500 West Monroe Street (1) |
Chicago, IL | 3/31/2011 | 100 | 1991 | 227,500 | 962 | 67 | |||||||||||||
| $319,486 | 1,638 | 63 | ||||||||||||||||||
| Dispositions | ||||||||||||||||||||
| Property Name | Location | Disposition Date |
Percent Ownership (%) |
Year Built | Sale Price ($’s in thousands) |
Rentable Square Footage (in thousands) |
Percent Leased at Disposition (%) | |||||||||||||
| 111 Sylvan Avenue (2) |
Englewood Cliffs, NJ | 12/8/2010 | 100 | 1953-1967 | $55,000 | 410 | 100 | |||||||||||||
| 14400 Hertz Quail Springs Parkway |
Oklahoma City, OK | 10/15/2010 | 4 | 1997 | 5,300 | 57 | 100 | |||||||||||||
| $60,300 | 467 | 100 | ||||||||||||||||||
| Acquisitions Subsequent to Quarter End | ||||||||||||||||||||
| Property Name | Location | Acquisition Date |
Percent Ownership (%) |
Year Built | Purchase Price ($’s in thousands) |
Rentable Square Footage (in thousands) |
Percent Leased at Acquisition (%) | |||||||||||||
| The Dupree Building |
Atlanta, GA | 4/29/2011 | 100 | 1997 | $20,450 | 138 | 83 | |||||||||||||
(1) Investment in this property was converted from a structured finance investment to an owned real estate asset through a UCC foreclosure of the equity ownership interest on March 31, 2011. The purchase price presented equates to the book basis for the real estate assets comprising the property.
(2) Property was to become vacant within six months of disposition.
28
Piedmont Office Realty Trust, Inc.
Other Investments
As of March 31, 2011
| Industrial Properties | Location | Percent Ownership (%) |
Year Built | Real Estate Net Book |
Rentable Square Footage (in thousands) |
Percent Leased (%) |
||||||||||||||||||
| 112 Hidden Lake Circle |
Duncan, SC | 100 | 1987 | $9,780 | 313.4 | 100.0 | ||||||||||||||||||
| 110 Hidden Lake Circle |
Duncan, SC | 100 | 1987 | 13,162 | 473.4 | 36.8 | ||||||||||||||||||
| $22,942 | 786.8 | 61.9 | ||||||||||||||||||||||
| Unconsolidated Joint Venture Properties | Location | Percent Ownership (%) |
Year Built | Piedmont Share of Real Estate Net Book Value ($’s in thousands) |
Real Estate Net Book Value ($’s in thousands) |
Rentable Square Footage (in thousands) |
Percent Leased (%) |
|||||||||||||||||
| 360 Interlocken Boulevard |
Broomfield, CO | 4 | 1996 | $244 | $6,601 | 51.7 | 100.0 | |||||||||||||||||
| 47300 Kato Road |
Fremont, CA | 78 | 1982 | 2,659 | 3,430 | 58.4 | 0.0 | |||||||||||||||||
| 20/20 Building |
Leawood, KS | 57 | 1992 | 2,558 | 4,508 | 68.3 | 90.8 | |||||||||||||||||
| 4685 Investment Drive |
Troy, MI | 55 | 2000 | 5,136 | 9,337 | 77.1 | 100.0 | |||||||||||||||||
| 5301 Maryland Way |
Brentwood, TN | 55 | 1989 | 11,001 | 19,997 | 201.2 | 100.0 | |||||||||||||||||
| 8560 Upland Drive |
Parker, CO | 72 | 2001 | 7,635 | 10,621 | 148.2 | 100.0 | |||||||||||||||||
| Two Park Center |
Hoffman Estates, IL | 72 | 1999 | 11,488 | 15,980 | 193.7 | 38.6 | |||||||||||||||||
| $40,721 | $70,474 | 798.6 | 77.0 | |||||||||||||||||||||
| Land Parcels | Location | Acres | ||||||||||||||||||||||
| Portland Land Parcels |
Beaverton, OR | 18.2 | ||||||||||||||||||||||
| Enclave Parkway |
Houston, TX | 4.5 | ||||||||||||||||||||||
| Durham Avenue |
South Plainfield, NJ | 8.9 | ||||||||||||||||||||||
| Corporate Court |
Holtsville, NY | 10.0 | ||||||||||||||||||||||
| State Highway 161 |
Irving, TX | 4.5 | ||||||||||||||||||||||
| 46.1 | ||||||||||||||||||||||||
29
| Piedmont Office Realty Trust, Inc. Supplemental Definitions
Included in this section are management’s statements regarding certain non-GAAP financial measures provided in this supplemental report and reasons why management believes that these measures provide useful information to investors about the Company’s financial condition and results of operations. Reconciliations of these non-GAAP measures are included within pages 33-36.
Adjusted Funds From Operations (“AFFO”): AFFO is calculated by deducting from Core FFO non-incremental capital expenditures and adding back non-cash items including non-real estate depreciation, straight lined rents and fair value lease revenue, non-cash components of interest expense and compensation expense, and by making similar adjustments for unconsolidated partnerships and joint ventures. Although AFFO may not be comparable to that of other REITs, we believe it provides a meaningful indicator of our ability to fund cash needs and to make cash distributions to equity owners. AFFO is a non-GAAP financial measure and should not be viewed as an alternative measurement of our operating performance to net income, as an alternative to net cash flows from operating activities or as a measure of our liquidity.
Annualized Lease Revenue (“ALR”): ALR is calculated by multiplying (i) rental payments (defined as base rent plus operating expense reimbursements, if payable by the tenant on a monthly basis under the terms of a lease that have been executed, but excluding a) rental abatements and b) rental payments related to executed but not commenced leases for space that was covered by an existing lease), by (ii) 12. In instances in which contractual rents or operating expense reimbursements are collected on an annual, semi-annual, or quarterly basis, such amounts are multiplied by a factor of 1, 2, or 4, respectively, to calculate the annualized figure. For leases that have been executed but not commenced relating to un-leased space, ALR is calculated by multiplying (i) the monthly base rental payment (excluding abatements) plus any operating expense reimbursements for the initial month of the lease term, by (ii) 12. Unless stated otherwise, this measure excludes our industrial properties and unconsolidated joint venture interests.
Core EBITDA: Core EBITDA is defined as net income before interest, taxes, depreciation and amortization and incrementally removing any impairment losses, gains or losses from sales of property, or other extraordinary items. We do not include impairment losses in this measure because we feel these types of losses create volatility in our earnings and make it difficult to determine the earnings generated by our ongoing business. We believe Core EBITDA is a reasonable measure of our liquidity. Core EBITDA is a non-GAAP financial measure and should not be viewed as an alternative measurement of cash flows from operating activities or other GAAP basis liquidity measures. Other REITs may calculate Core EBITDA differently and our calculation should not be compared to that of other REITs.
Core Funds From Operations (“Core FFO”): We calculate Core FFO by starting with FFO, as defined by NAREIT, and adjusting for certain non-recurring items such as impairment losses and other extraordinary items. Such items create significant earnings volatility. We believe Core FFO provides a meaningful measure of our operating performance and more predictability regarding future earnings potential. Core FFO is a non-GAAP financial measure and should not be viewed as an alternative measurement of our operating performance to net income; therefore, it should not be compared to other REITs’ equivalent to Core FFO.
Core Net Operating Income (“Core NOI”): Core NOI is defined as real estate operating income with the add-back of corporate general and administrative expense, depreciation and amortization, and casualty and impairment losses and the deduction of income and expense associated with lease terminations and income associated with property management performed by Piedmont for other organizations. We present this measure on an accrual basis and a cash basis, which eliminates the effects of straight lined rents and fair value lease revenue. The company uses this measure to assess its operating results and believes it is important in assessing operating performance. Core NOI is a non-GAAP measure which does not have any standard meaning prescribed by GAAP and therefore may not be comparable to similar measures presented by other companies.
EBITDA: EBITDA is defined as net income before interest, taxes, depreciation and amortization. We believe EBITDA is an appropriate measure of our ability to incur and service debt. EBITDA should not be considered as an alternative to cash flows from operating activities, as a measure of our liquidity or as an alternative to net income as an indicator of our operating activities. Other REITs may calculate EBITDA differently and our calculation should not be compared to that of other REITs.
Funds From Operations (“FFO”): FFO is calculated in accordance with the current National Association of Real Estate Investment Trusts (“NAREIT”) definition. NAREIT currently defines FFO as net income (computed in accordance with GAAP), excluding gains or losses from sales of property, adding back depreciation and amortization on real estate assets, and after the same adjustments for unconsolidated partnerships and joint ventures. Such factors can vary among owners of identical assets in similar conditions based on historical cost accounting and useful-life estimates. FFO may provide valuable comparisons of operating performance between periods and with other REITs. FFO is a non-GAAP financial measure and should not be viewed as an alternative measurement of our operating performance to net income. We believe that FFO is a beneficial indicator of the performance of an equity REIT. However, other REITs may not define FFO in accordance with the NAREIT definition, or may interpret the current NAREIT definition differently than we do; therefore, our computation of FFO may not be comparable to that of such other REITs.
Incremental Capital Expenditures: Incremental Capital Expenditures are defined as capital expenditures of a non-recurring nature that incrementally enhance the underlying assets’ income generating capacity. Tenant improvements, leasing commissions, building capital and deferred lease incentives incurred to lease space that was dark at acquisition, improvements associated with the expansion of a building and renovations that change the underlying classification of a building are included in this measure. |
30
|
Piedmont Office Realty Trust, Inc. Supplemental Definitions
NOI from Unconsolidated Joint Ventures: NOI from Unconsolidated Joint Ventures is defined as Core NOI attributable to our interests in eight properties owned through unconsolidated partnerships. We present this measure on an accrual basis and a cash basis, which eliminates the effects of straight lined rents and fair value lease revenue. NOI from Unconsolidated Joint Ventures is a non-GAAP measure and therefore may not be comparable to similarly defined data provided by other REITs.
Non-Incremental Capital Expenditures: Non-Incremental Capital Expenditures are defined as capital expenditures of a recurring nature related to tenant improvements and leasing commissions that do not incrementally enhance the underlying assets’ income generating capacity. We exclude first generation tenant improvements and leasing commissions from this measure.
Same Store Net Operating Income (“Same Store NOI”): Same Store NOI is calculated as the Core NOI attributable to the properties owned or placed in service during the entire span of the current and prior year reporting periods. Same Store NOI excludes amounts attributable to industrial properties and unconsolidated joint venture assets. We present this measure on an accrual basis and a cash basis, which eliminates the effects of straight lined rents and fair value lease revenue. We believe Same Store NOI is an important measure of comparison of our stabilized properties’ operating performance. Other REITs may calculate Same Store NOI differently and our calculation should not be compared to that of other REITs.
Same Store Properties: Same Store Properties is defined as properties owned or placed in service during the entire span of the current and prior year reporting periods. Same Store Properties excludes industrial properties and unconsolidated joint venture assets. We believe Same Store Properties is an important measure of comparison of our stabilized portfolio performance. |
31
| Piedmont Office Realty Trust, Inc. Research Coverage
| ||||
| Paul E. Adornato, CFA | John W. Guinee, III | Brendon Maiorana | ||
| BMO Capital Markets | Stifel, Nicolaus & Company | Wells Fargo | ||
| 3 Time Square |
One South Street | 7 St. Paul Street | ||
| New York, NY 10036 |
16th Floor | MAC R1230-011 | ||
| Phone: (212) 885-4170 |
Baltimore, MD 21202 | Baltimore, MD 21202 | ||
| Phone: (443) 224-1307 | Phone: (443) 263-6516 | |||
| Anthony Paolone, CFA |
David B. Rodgers, CFA |
John J. Stewart, CFA | ||
| JP Morgan |
RBC Capital Markets |
Green Street Advisors | ||
| 277 Park Avenue |
Arbor Court |
660 Newport Center Drive, Suite 800 | ||
| New York, NY 10172 |
30575 Bainbridge Road, Suite 250 |
Newport Beach, CA 92660 | ||
| Phone: (212) 622-6682 |
Solon, OH 44139 |
Phone: (949) 640-8780 | ||
| Phone: (440) 715-2647 | ||||
| Stephen C. Swett | ||||
| Morgan Keegan & Co. | ||||
| 535 Madison Avenue | ||||
| 10th Floor | ||||
| New York, NY 10022 | ||||
| Phone: (212) 508-7585 | ||||
32
Piedmont Office Realty Trust, Inc.
Same Store Net Operating Income (Cash Basis)
Unaudited (in thousands)
| Three Months Ended | ||||||||||||||||||||
| 3/31/2011 | 12/31/2010 | 9/30/2010 | 6/30/2010 | 3/31/2010 | ||||||||||||||||
| Net income attributable to Piedmont |
$ | 33,967 | $ | 28,700 | $ | 40,584 | $ | 19,636 | $ | 31,460 | ||||||||||
| Net income attributable to noncontrolling interest |
123 | 122 | 158 | 125 | 125 | |||||||||||||||
| Interest expense |
17,174 | 17,378 | 17,359 | 18,933 | 19,091 | |||||||||||||||
| Depreciation |
27,324 | 26,995 | 26,339 | 26,050 | 26,428 | |||||||||||||||
| Amortization |
12,106 | 11,623 | 11,119 | 11,104 | 11,488 | |||||||||||||||
| Impairment loss on real estate assets |
- | - | 53 | 9,587 | - | |||||||||||||||
| Loss on sale of property |
- | 792 | - | - | - | |||||||||||||||
| Gain on consolidation of VIE |
(1,920) | - | - | - | - | |||||||||||||||
| Core EBITDA |
88,774 | 85,610 | 95,612 | 85,435 | 88,592 | |||||||||||||||
| General & administrative expenses |
6,899 | 7,934 | 7,001 | 7,993 | 6,696 | |||||||||||||||
| Management fee revenue |
(830) | (948) | (806) | (705) | (753) | |||||||||||||||
| Interest and other income |
(3,460) | (491) | (993) | (1,036) | (969) | |||||||||||||||
| Lease termination income |
(3,404) | (2,589) | (4,230) | (479) | (496) | |||||||||||||||
| Lease termination expense - straight line rent & acquisition intangibles write-offs |
436 | 461 | 131 | 679 | 67 | |||||||||||||||
| Straight-line effects of lease revenue |
1,972 | (3,791) | (3,053) | (1,463) | 1,006 | |||||||||||||||
| Net effect of amortization of above/(below) market in-place lease intangibles |
(1,534) | (1,457) | (1,510) | (1,525) | (1,426) | |||||||||||||||
| Core net operating income |
88,853 | 84,729 | 92,152 | 88,899 | 92,717 | |||||||||||||||
| Net operating income from: |
||||||||||||||||||||
| Acquisitions |
354 | 881 | 2 | - | - | |||||||||||||||
| Dispositions |
- | (1,119) | (1,686) | (1,683) | (1,681) | |||||||||||||||
| Industrial properties |
(239) | (347) | (91) | (91) | (273) | |||||||||||||||
| Unconsolidated joint ventures |
(658) | (1,165) | (1,217) | (1,186) | (1,268) | |||||||||||||||
| Same Store NOI |
$ | 88,310 | $ | 82,979 | $ | 89,160 | $ | 85,939 | $ | 89,495 | ||||||||||
33
Piedmont Office Realty Trust, Inc.
Unconsolidated Joint Venture NOI Reconciliation
Pro-rata (in thousands)
| Three Months Ended | ||||||||||||||||||||
| 3/31/2011 | 12/31/2010 | 9/30/2010 | 6/30/2010 | 3/31/2010 | ||||||||||||||||
| Equity in Income of Unconsolidated JVs |
$ | 209 | $ | 630 | $ | 619 | $ | 647 | $ | 737 | ||||||||||
| Interest expense |
- | - | - | - | - | |||||||||||||||
| Depreciation |
302 | 310 | 329 | 337 | 348 | |||||||||||||||
| Amortization |
30 | 101 | 101 | 101 | 101 | |||||||||||||||
| Impairment loss |
- | - | 53 | - | - | |||||||||||||||
| Gain on sale of property |
|
-
|
|
|
(25)
|
|
|
-
|
|
|
-
|
|
|
-
|
| |||||
| Core EBITDA |
541 | 1,016 | 1,102 | 1,085 | 1,186 | |||||||||||||||
| General & administrative expenses |
75 | 73 | 40 | 38 | 66 | |||||||||||||||
| Core net operating income (accrual basis) |
616 | 1,089 | 1,142 | 1,123 | 1,252 | |||||||||||||||
| Straight-line effects of lease revenue |
42 | 77 | 76 | 64 | 17 | |||||||||||||||
| Net effect of amortization of above/(below) market in-place lease intangibles |
|
-
|
|
|
(1)
|
|
|
(1)
|
|
|
(1)
|
|
|
(1)
|
| |||||
| Core net operating income (cash basis) |
$ | 658 | $ | 1,165 | $ | 1,217 | $ | 1,186 | $ | 1,268 | ||||||||||
34
Piedmont Office Realty Trust, Inc.
FFO/ Core FFO/ AFFO Reconciliations
Unaudited (in thousands)
| Three Months Ended | ||||||||||||||||||||
| 3/31/2011 | 12/31/2010 | 9/30/2010 | 6/30/2010 | 3/31/2010 | ||||||||||||||||
| Net income attributable to Piedmont |
$33,967 | $28,700 | $40,584 | $19,636 | $31,460 | |||||||||||||||
| Depreciation |
27,154 | 26,821 | 26,163 | 25,872 | 26,250 | |||||||||||||||
| Amortization |
12,106 | 11,623 | 11,119 | 11,104 | 11,488 | |||||||||||||||
| Loss on sale of property |
- | 792 | - | - | - | |||||||||||||||
| Gain on consolidation of VIE |
|
(1,920)
|
|
|
-
|
|
|
-
|
|
|
-
|
|
|
-
|
| |||||
| Funds from operations |
71,307 | 67,936 | 77,866 | 56,612 | 69,198 | |||||||||||||||
| Acquisition costs |
(26) | 242 | 310 | 48 | - | |||||||||||||||
| Impairment loss |
|
-
|
|
|
-
|
|
|
53
|
|
|
9,587
|
|
|
-
|
| |||||
| Core funds from operations |
71,281 | 68,178 | 78,229 | 66,247 | 69,198 | |||||||||||||||
| Depreciation of non real estate assets |
170 | 173 | 176 | 178 | 178 | |||||||||||||||
| Stock-based and other non-cash compensation expense |
968 | 1,223 | 1,095 | 711 | 653 | |||||||||||||||
| Deferred financing cost amortization |
607 | 608 | 607 | 696 | 696 | |||||||||||||||
| Straight-line effects of lease revenue |
2,237 | (3,456) | (2,921) | (784) | 1,073 | |||||||||||||||
| Amortization of lease related intangibles |
(1,362) | (1,331) | (1,510) | (1,525) | (1,426) | |||||||||||||||
| Income from amortization of discount on purchase of mezzanine loans |
(484) | (473) | (569) | (694) | (668) | |||||||||||||||
| Acquisition costs |
26 | (242) | (310) | (48) | - | |||||||||||||||
| Non-incremental capital expenditures |
|
(21,469)
|
|
|
(26,594)
|
|
|
(13,329)
|
|
|
(8,969)
|
|
|
(9,413)
|
| |||||
| Adjusted funds from operations |
$51,974 | $38,086 | $61,468 | $55,812 | $60,291 | |||||||||||||||
35
Piedmont Office Realty Trust, Inc.
Discontinued Operations
Unaudited (in thousands)
| Three Months Ended | ||||||||||||||||||||
| 3/31/2011 | 12/31/2010 | 9/30/2010 | 6/30/2010 | 3/31/2010 | ||||||||||||||||
| Revenues: |
||||||||||||||||||||
| Rental income |
$ | - | $ | 1,063 | $ | 1,595 | $ | 1,594 | $ | 1,594 | ||||||||||
| Tenant reimbursements |
- | - | - | - | (2) | |||||||||||||||
| Property management fee revenue |
- | - | - | - | - | |||||||||||||||
| Other rental income |
- | - | - | - | - | |||||||||||||||
| Total revenues |
- | 1,063 | 1,595 | 1,594 | 1,592 | |||||||||||||||
| Operating expenses: |
||||||||||||||||||||
| Property operating costs |
- | 8 | 5 | 8 | 8 | |||||||||||||||
| Depreciation |
- | - | - | 130 | 389 | |||||||||||||||
| Amortization |
- | - | - | - | - | |||||||||||||||
| General and administrative |
- | 38 | 156 | 2 | 10 | |||||||||||||||
| Total operating expenses |
- | 46 | 161 | 140 | 407 | |||||||||||||||
| Operating income, excluding impairment loss and loss on sale |
- | 1,017 | 1,434 | 1,454 | 1,185 | |||||||||||||||
| Impairment loss |
- | - | - | (9,587) | - | |||||||||||||||
| Loss on sale |
- | (817) | - | - | - | |||||||||||||||
| Income from discontinued operations |
$ | - | $ | 200 | $ | 1,434 | $ | (8,133) | $ | 1,185 | ||||||||||
36
| Piedmont Office Realty Trust, Inc. |
| Supplemental Operating & Financial Data |
| Risks, Uncertainties and Limitations
|
| Certain statements contained in this supplemental package constitute forward-looking statements within the meaning of Section 27A of the Securities Act of 1933, as amended (the “Securities Act”) and Section 21E of the Securities Exchange Act of 1934, as amended (the “Exchange Act”). We intend for all such forward-looking statements to be covered by the safe-harbor provisions for forward-looking statements contained in Section 27A of the Securities Act and Section 21E of the Exchange Act, as applicable. Such information is subject to certain risks and uncertainties, as well as known and unknown risks, which could cause actual results to differ materially from those projected or anticipated. Therefore, such statements are not intended to be a guarantee of our performance in future periods. Such forward-looking statements can generally be identified by our use of forward-looking terminology such as “may,” “will,” “expect,” “intend,” “anticipate,” “believe,” “continue” or similar words or phrases that are predictions of future events or trends and which do not relate solely to historical matters. |
|
The following are some of the factors that could cause our actual results and expectations to differ materially from those described in our forward-looking statements: our ability to successfully identify and consummate suitable acquisitions; current adverse market and economic conditions; lease terminations or lease defaults, particularly by one of our large lead tenants; the impact of competition on our efforts to renew existing leases or re-let space; changes in the economies and other conditions of the office market in general and of the specific markets in which we operate; economic and regulatory changes; additional risks and costs associated with directly managing properties occupied by government tenants; adverse market and economic conditions and related impairments to our assets, including, but not limited to, receivables, real estate assets and other intangible assets; the success of our real estate strategies and investment objectives; availability of financing; costs of complying with governmental laws and regulations; uncertainties associated with environmental and other regulatory matters; our ability to continue to qualify as a REIT under the Internal Revenue Code; the impact of outstanding or potential litigation; and other factors detailed in our most recent Annual Report on Form 10-K and other documents we file with the Securities and Exchange Commission. |
|
Readers are cautioned not to place undue reliance on these forward-looking statements, which speak only as of the date of this supplemental report. We cannot guarantee the accuracy of any such forward-looking statements contained in this supplemental report, and we do not intend to publicly update or revise any forward-looking statements, whether as a result of new information, future events, or otherwise. |
37