Attached files
| file | filename |
|---|---|
| 8-K - FORM 8-K - POPULAR, INC. | g27083jfe8vk.htm |
EXHIBIT 99.1

| First Quarter 2011 Financial Results RBC Capital Markets’ Financial Institutions Conference May 6, 2011 |
| 1 Forward Looking Statements Statements contained in this Presentation that are not based on current or historical fact are forward-looking in nature. Such forward-looking statements are based on current plans, estimates and expectations and are made pursuant to the Private Securities Litigation Reform Act of 1995. Forward-looking statements are based on known and unknown risks, assumptions, uncertainties and other factors. The Company's actual results, performance, or achievements may differ materially from any future results, performance, or achievements expressed or implied by such forward-looking statements. The Company undertakes no obligation to publicly update or revise any forward-looking statement. The financial information included in this presentation for the quarter ended March 31, 2011 is based on preliminary unaudited data and is subject to change. Please refer to our Annual Report on Form 10-K and other SEC reports for a discussion of those factors that could impact our future results. |

| Q1 2011 Highlights 2 Net income of $10.1M or EPS of $0.01 Non-performing loans in the P.R. mortgage and commercial loan portfolios increased slightly P.R. Construction portfolio sale not finalized; negotiations are ongoing Global events and the rise in oil prices may have a negative impact on the P.R. economy Popular returned to profitability in Q1 Westernbank acquisition continues to produce better than anticipated results U.S. operations (BPNA) showing good progress |
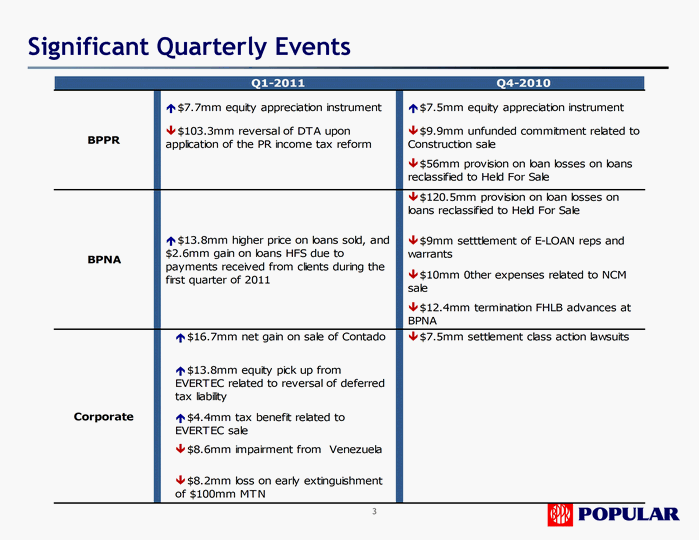
| Significant Quarterly Events 3 |

| 4 Puerto Rico Economic Update BPPR-Index of Real Economic Activity - Annualized Rate Employment, Unemployment and Labor Force Sources: Puerto Rico Labor Department, U.S. Labor Bureau, P.R. Government Development Bank, Consultec and Puerto Rico Commerce and Export Agency In thousands Government actions update Tax reform provides over $1.0B annually in tax relief for low-income taxpayers and reduces maximum corporate tax rate from 41% to 30%, funded by the temporary excise tax of 4% on certain manufacturing operations. Upcoming fiscal 2012 budget slightly over 2011 at $9.3B Pressures on the economy easing somewhat... But unemployment remains high (16% as of Mar. 2011) Higher oil prices may present challenges if sustained There are some positive signs: S&P upgrade to PR's general obligation debt from BBB- to BBB and positive outlook; first in 28 years; other ratings reaffirmed: Fitch BBB+ & Moody's A3. Several Public-Private Partnerships underway including schools, toll roads and airport projects Retail Sales - Annual Percentage Change |
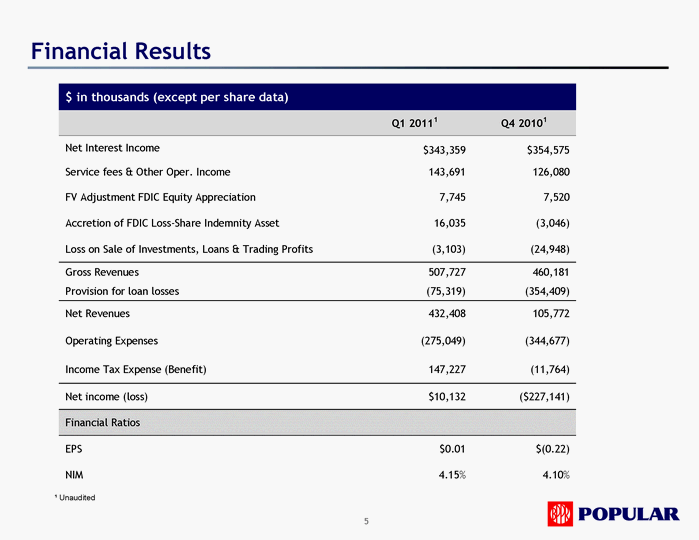
| 5 Financial Results 1 Unaudited $ in thousands (except per share data) $ in thousands (except per share data) $ in thousands (except per share data) Q1 20111 Q4 20101 Net Interest Income $343,359 $354,575 Service fees & Other Oper. Income 143,691 126,080 FV Adjustment FDIC Equity Appreciation 7,745 7,520 Accretion of FDIC Loss-Share Indemnity Asset 16,035 (3,046) Loss on Sale of Investments, Loans & Trading Profits (3,103) (24,948) Gross Revenues 507,727 460,181 Provision for loan losses (75,319) (354,409) Net Revenues 432,408 105,772 Operating Expenses (275,049) (344,677) Income Tax Expense (Benefit) 147,227 (11,764) Net income (loss) $10,132 ($227,141) Financial Ratios EPS $0.01 $(0.22) NIM 4.15% 4.10% |
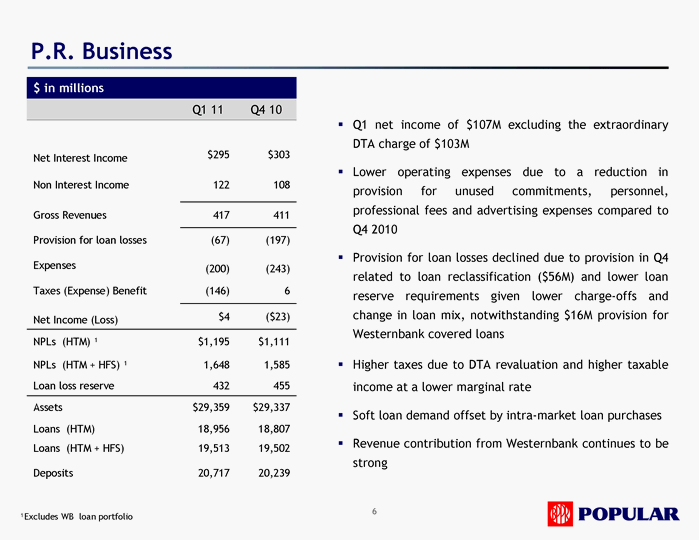
| 6 P.R. Business Q1 net income of $107M excluding the extraordinary DTA charge of $103M Lower operating expenses due to a reduction in provision for unused commitments, personnel, professional fees and advertising expenses compared to Q4 2010 Provision for loan losses declined due to provision in Q4 related to loan reclassification ($56M) and lower loan reserve requirements given lower charge-offs and change in loan mix, notwithstanding $16M provision for Westernbank covered loans Higher taxes due to DTA revaluation and higher taxable income at a lower marginal rate Soft loan demand offset by intra-market loan purchases Revenue contribution from Westernbank continues to be strong 1Excludes WB loan portfolio $ in millions Q1 11 Q4 10 Net Interest Income $295 $303 Non Interest Income 122 108 Gross Revenues 417 411 Provision for loan losses (67) (197) Expenses (200) (243) Taxes (Expense) Benefit (146) 6 Net Income (Loss) $4 ($23) NPLs (HTM) 1 $1,195 $1,111 NPLs (HTM + HFS) 1 1,648 1,585 Loan loss reserve 432 455 Assets $29,359 $29,337 Loans (HTM) 18,956 18,807 Loans (HTM + HFS) 19,513 19,502 Deposits 20,717 20,239 |

| Revenues Westernbank Covered Loans 7 |
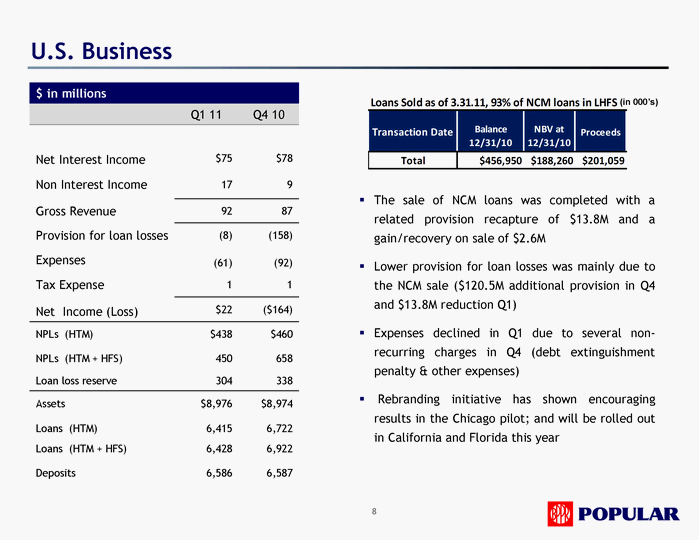
| 8 U.S. Business $ in millions Q1 11 Q4 10 Net Interest Income $75 $78 Non Interest Income 17 9 Gross Revenue 92 87 Provision for loan losses (8) (158) Expenses (61) (92) Tax Expense 1 1 Net Income (Loss) $22 ($164) NPLs (HTM) $438 $460 NPLs (HTM + HFS) 450 658 Loan loss reserve 304 338 Assets $8,976 $8,974 Loans (HTM) 6,415 6,722 Loans (HTM + HFS) 6,428 6,922 Deposits 6,586 6,587 The sale of NCM loans was completed with a related provision recapture of $13.8M and a gain/recovery on sale of $2.6M Lower provision for loan losses was mainly due to the NCM sale ($120.5M additional provision in Q4 and $13.8M reduction Q1) Expenses declined in Q1 due to several non- recurring charges in Q4 (debt extinguishment penalty & other expenses) Rebranding initiative has shown encouraging results in the Chicago pilot; and will be rolled out in California and Florida this year (in 000's) |

| Credit Quality Overview- Q1 Non-Performing Loan Inflows- BPPR Excludes WB Covered Loans & LHFS 9 Excluding LHFS, NPLs to total loans rose .33% ($63M) to 7.91%: Mortgage NPLs increased by $57M, related to PR portfolio Commercial NPLs up by $27M; $41M from PR offset by a U.S. decline ALLL declined in Q1 by $66M resulting in ALLL/Loans (HTM) of 3.52% vs. 3.83% in Q4 NCO ratio for Q1 was 2.74% vs. 8.83% in Q4 (4.96% excluding Q4 significant items) NCO's were down by $129M (excluding FAS 114 NCOs in Q4) P.R. mortgage NCOs in Q1 were $7.7M (.85%) compared to $7.2M (.86%) in Q4; P.R. Commercial NCOs were $39M (2.32%) in Q1 vs. $38M in Q4 (2.25%) excluding Q4 significant items BPPR Commercial and Construction inflow of NPLs decreased 24% ($41M) during 1Q2011. Non-Performing Loans- Popular Inc In 000's In 000',s |

| 10 Credit Summary- Popular Inc Consolidated Credit summary excludes covered assets. |

| 11 Capital Ratios () *Capital ratios as of 3-31-2011 are estimated 1 See the earnings press release for reconciliation of Common Stockholders Equity (GAAP) to Tier 1 Common Equity (Non-GAAP). 1 Improved Capital Ratios reflect: Reduction in DTA Balance Sheet composition Internal capital generation Q1 11 Q4 10 Q1 10 Tier 1 Capital 15.20% 14.54% 9.51% Tier 1 Common 1 11.55 10.95 6.12 Total Capital 16.50 15.81 10.97 Tier 1 Leverage 10.15 9.72 7.34 |

| Credit Issues The sale of NCM loans in the US business was completed P.R. Construction sale still pending Closely monitoring P.R. mortgage and commercial portfolios Credit metrics improving P.R. economy BPNA continues to make significant progress The company returned to profitability in Q1, and we are now generating capital internally Popular, Inc. - Recap & Outlook 12 |

