Attached files
| file | filename |
|---|---|
| EX-4.2 - NETFONE INC | ex4-2.htm |
| EX-4.1 - NETFONE INC | ex4-1.htm |
| EX-10.5 - NETFONE INC | ex10-5.htm |
| EX-10.4 - NETFONE INC | ex10-4.htm |
| EX-10.3 - NETFONE INC | ex10-3.htm |
| EX-99.2 - NETFONE INC | ex99-2.htm |
| EX-23.1 - NETFONE INC | ex21-1.htm |
| EX-10.6 - NETFONE INC | ex10-6.htm |
| 8-K - NETFONE INC | g5051.htm |
Exhibit 99.1

Consolidated Financial Statements
December 31, 2010, 2009 and 2008
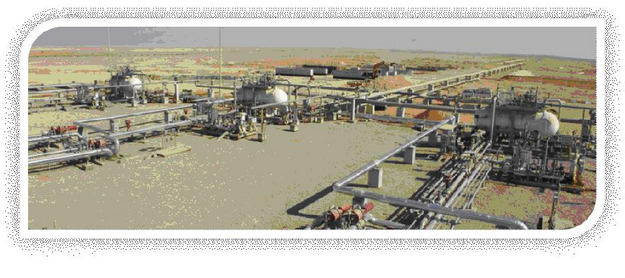
TABLE OF CONTENTS
| CONSOLIDATED FINANCIAL STATEMENTS | |
| Report of Independent Registered Public Accounting Firm | 1 |
|
Consolidated Balance Sheets
|
2
|
|
Consolidated Statements of Income and Comprehensive Income
|
3
|
|
Consolidated Statements of Stockholders' Equity
|
4
|
|
Consolidated Statements of Cash Flow
|
5
|
|
NOTES TO CONSOLIDATED FINANCIAL STATEMENTS
|
6
|
|
1.
|
Basis of Presentation
|
6
|
|
2.
|
Summary of Significant Accounting Policies
|
6
|
|
3.
|
Significant subsequent events
|
10
|
|
4.
|
Business Combinations
|
10
|
|
5.
|
Segment information
|
14
|
|
6.
|
Recent Accounting Pronouncements
|
15
|
|
7.
|
Statement of Cash flow
|
17
|
|
8.
|
Goodwill
|
17
|
|
9.
|
Property, Plant and Equipment
|
17
|
|
10.
|
Inventories
|
18
|
|
11.
|
Accounts receivable
|
19
|
|
12.
|
Marketable Securities
|
19
|
|
13.
|
Cash and cash equivalents
|
19
|
|
14.
|
Prepaid expenses and deferred taxes
|
20
|
|
15.
|
Long-term debt
|
20
|
|
16.
|
Current liabilities
|
21
|
|
17.
|
Long-term liabilities
|
22
|
|
18.
|
Shareholders' Equity
|
22
|
|
19.
|
Total revenues
|
23
|
|
20.
|
Cost of sales
|
23
|
|
21.
|
Operating expenses
|
23
|
|
22.
|
Income taxes
|
24
|
|
23.
|
Valuation and qualifying accounts
|
27
|
|
Deloitte & Touche S.p.A.
|
|
|
Via della Camilluccia, 589/A
|
|
|
00135 Roma
|
|
|
Italia
|
|
|
Tel: +39 06 367491
|
|
|
Fax: +39 06 36749282
|
|
|
www.deloitte.it
|
REPORT OF INDEPENDENT REGISTERED PUBLIC ACCOUNTING FIRM
To the Board of Directors and Stockholders of
ITP Benelli S.p.A.
Rome, Italy
We have audited the accompanying consolidated balance sheets of ITP Benelli S.p.A. and subsidiaries (the "Company") as of December 31, 2010 and 2009, and the related consolidated statements of income and comprehensive income, stockholders' equity, and cash flows for each of the three years in the period ended December 31, 2010. Our audits also included the financial statement schedule listed in the Index at Item 9.01a. These financial statements and financial statement schedule are the responsibility of the Company's management. Our responsibility is to express an opinion on the financial statements and financial statement schedule based on our audits.
We conducted our audits in accordance with the standards of the Public Company Accounting Oversight Board (United States). Those standards require that we plan and perform the audit to obtain reasonable assurance about whether the financial statements are free of material misstatement. The Company is not required to have, nor were we engaged to perform, an audit of its internal control over financial reporting. Our audits included consideration of internal control over financial reporting as a basis for designing audit procedures that are appropriate in the circumstances, but not for the purpose of expressing an opinion on the effectiveness of the Company's internal control over financial reporting. Accordingly, we express no such opinion. An audit also includes examining, on a test basis, evidence supporting the amounts and disclosures in the financial statements, assessing the accounting principles used and significant estimates made by management, as well as evaluating the overall financial statement presentation. We believe tiiat our audits provide a reasonable basis for our opinion.
In our opinion, such consolidated financial statements present fairly, in all material respects, the financial position of ITP Benelli S.p.A. and subsidiaries as of December 31, 2010 and 2009, and the results of their operations and their cash flows for each of the three years in the period ended December 31, 2010, in conformity with accounting principles generally accepted in the United States of America. Also, in our opinion, such financial statement schedule, when considered in relation to the basic consolidated financial statements taken as a whole, present fairly in all material respects the information set forth therein.

Rome, Italy
April 28, 2011
Ancona Bari Bergamo Bologna Brescia Cagliari Firenze Genova Milano Napoli Padova Parma Perugia
Roma Torino Treviso Verona
Sede Legale: Via Tortona, 25 - 20144 Milano - Capitale Sociale: Euro 10.328.220,00 i.v.
Codice Fiscale/Registro delle Imprese Milano n. 03049560166 – R.E.A. Milano n. 1720239
Partita IVA: IT 03049560166
Member of Deloitte Touche Tohmatsu Limited
1
Consolidated Balance Sheets
|
|
Years Ended December 31, | |||||||
|
2010
|
2009
|
|||||||
| (in USD thousand) | ||||||||
| ASSETS | ||||||||
|
Cash and cash equivalents
|
$ | 11,934 | $ | 2,893 | ||||
|
Marketable securities
|
3,425 | 3,645 | ||||||
|
Accounts receivable, net of allowance for doubtful accounts
|
19,918 | 16,095 | ||||||
|
Inventory
|
14,788 | 6,975 | ||||||
|
Prepaid expenses and other current assets
|
4,707 | 4,682 | ||||||
|
Deferred income taxes
|
392 | - | ||||||
|
Total Current Assets
|
55,165 | 34,291 | ||||||
|
Property, plant and equipment, net
|
15,952 | 9,380 | ||||||
|
Intangible assets
|
||||||||
|
Goodwill
|
6,509 | 1,699 | ||||||
|
Other intangible assets
|
104 | 152 | ||||||
|
Other assets
|
773 | 39 | ||||||
|
Total Assets
|
$ | 78,503 | $ | 45,563 | ||||
|
LIABILITIES AND STOCKHOLDERS' EQUITY
|
Years Ended December 31, | |||||||
| 2010 | 2009 | |||||||
| (in USD thousand) | ||||||||
|
Current Liabilities
|
||||||||
|
Accounts payable and accrued expenses
|
$ | 26,911 | $ | 15,443 | ||||
|
Taxes payable
|
3,195 | 2,205 | ||||||
|
Current portion of:
|
||||||||
|
Advances received from customers
|
2,535 | 7,184 | ||||||
|
Long-term debt
|
13,105 | 3,847 | ||||||
|
Other liabilities
|
2,784 | 1,670 | ||||||
|
Total Current Liabilities
|
48,531 | 30,350 | ||||||
|
Long-term debt, net of current portion
|
20,395 | 6,899 | ||||||
|
Deferred income taxes
|
330 | |||||||
|
Other liabilities
|
682 | 219 | ||||||
|
Post-employment benefits obligation
|
1,418 | 803 | ||||||
|
Total Liabilities
|
71,026 | 38,601 | ||||||
|
Equity
|
||||||||
|
Capital stock
|
7,326 | 5,885 | ||||||
|
Accumulated other comprehensive income
|
(119 | ) | 23 | |||||
|
Retained earnings
|
271 | (517 | ) | |||||
|
Total ITP Group Stockholders’ Equity
|
7,477 | 5,391 | ||||||
|
Noncontrolling interests
|
- | 1,571 | ||||||
|
Total Equity
|
7,477 | 6,962 | ||||||
|
Total Liabilities and Stockholders' Equity
|
$ | 78,503 | $ | 45,563 | ||||
See Notes to Consolidated Financial Statements
2
Consolidated Statements of Income and Comprehensive Income
| Years Ended December 31, | ||||||||||||
|
2010
|
2009
|
2008
|
||||||||||
| (in USD thousand) | ||||||||||||
|
Sales and other operating revenues
|
$ | 63,205 | $ | 31,324 | $ | 46,215 | ||||||
|
Other income
|
437 | 301 | 516 | |||||||||
|
Total Revenues
|
63,642 | 31,626 | 46,731 | |||||||||
|
Costs of Sales
|
47,831 | 23,518 | 38,822 | |||||||||
|
Gross Profit
|
15,812 | 8,108 | 7,909 | |||||||||
|
Selling, general and administrative expenses
|
9,321 | 4,177 | 3,569 | |||||||||
|
Provision for doubtful accounts
|
876 | 397 | 1,056 | |||||||||
|
Other operating costs
|
870 | 449 | 1,243 | |||||||||
|
Total Operating Expenses
|
11,067 | 5,023 | 5,869 | |||||||||
|
Operating Income
|
4,745 | 3,085 | 2,041 | |||||||||
|
Interest income
|
45 | 25 | 61 | |||||||||
|
Interest expense
|
(1,279 | ) | (745 | ) | (684 | ) | ||||||
|
Income before Income Taxes
|
3,511 | 2,365 | 1,417 | |||||||||
|
Income tax expense
|
(1,283 | ) | (1,369 | ) | (1,070 | ) | ||||||
|
Net Income
|
2,228 | 996 | 347 | |||||||||
|
Less: Net income attributable to noncontrolling interests
|
- | (11 | ) | - | ||||||||
|
Net Income attributable to ITP Group
|
2,228 | 984 | 347 | |||||||||
|
Currency translation adjustment (Net of tax of $(42),29,(30) thousand in 2010,2009,2008)
|
(151 | ) | 106 | (109 | ) | |||||||
|
Unrealized gain (AFS Securities) (Net of tax of $3,10,12 thousand in 2010,2009,2008)
|
9 | 35 | 43 | |||||||||
|
Comprehensive income
|
$ | 2,087 | $ | 1,125 | $ | 281 | ||||||
|
Basic earnings per share
|
$ | 0.05 | $ | 0.03 | $ | 0.02 | ||||||
|
Weighted average number of shares outstanding
|
42,582 | 30,247 | 16,970 | |||||||||
See Notes to Consolidated Financial Statements
3
Consolidated Statements of Stockholders’ Equity
|
Thousand USD
|
Capital Stock
|
Other
comperehensive
income
|
Retained
earnings
|
Noncontrolling
Interests
|
Net income
|
Total
|
||||||||||||||||||
|
Balance December 31, 2007
|
$ | 147 | $ | (52 | ) | $ | 2,026 | $ | - | $ | 158 | 2,280 | ||||||||||||
|
Stockholder's subscriptions
|
4,346 | (2,641 | ) | 1,705 | ||||||||||||||||||||
|
Unrealized gain on marketable securities
|
43 | 43 | ||||||||||||||||||||||
|
Currency translation adjustment
|
(109 | ) | (109 | ) | ||||||||||||||||||||
|
Distribution of profit and losses
|
158 | (158 | ) | - | ||||||||||||||||||||
|
Result of the period
|
347 | 347 | ||||||||||||||||||||||
|
Balance December 31, 2008
|
$ | 4,493 | $ | (118 | ) | $ | (457 | ) | $ | - | $ | 347 | $ | 4,266 | ||||||||||
|
Stockholder's subscriptions
|
1,392 | (1,392 | ) | - | ||||||||||||||||||||
|
Unrealized gain on marketable securities
|
35 | 35 | ||||||||||||||||||||||
|
Currency translation adjustment
|
106 | 106 | ||||||||||||||||||||||
|
Distribution of profit and losses
|
347 | (347 | ) | - | ||||||||||||||||||||
|
Acquisition of noncontrolling interests
|
1,560 | 1,560 | ||||||||||||||||||||||
|
Result of the period
|
11 | 984 | 996 | |||||||||||||||||||||
|
Balance December 31, 2009
|
$ | 5,885 | $ | 23 | $ | (1,501 | ) | $ | 1,571 | $ | 984 | $ | 6,962 | |||||||||||
|
Stockholder's subscriptions
|
1,441 | (1,441 | ) | - | ||||||||||||||||||||
|
Unrealized gain on marketable securities
|
9 | 9 | ||||||||||||||||||||||
|
Currency translation adjustment
|
(151 | ) | (151 | ) | ||||||||||||||||||||
|
Distribution of profit and losses
|
984 | (984 | ) | - | ||||||||||||||||||||
|
Acquisition of noncontrolling interests
|
(1,571 | ) | (1,571 | ) | ||||||||||||||||||||
|
Result of the period
|
2,228 | 2,228 | ||||||||||||||||||||||
|
Balance December 31, 2010
|
$ | 7,326 | $ | (119 | ) | $ | (1,958 | ) | $ | - | $ | 2,228 | $ | 7,477 | ||||||||||
See Notes to Consolidated Financial Statements
4
Consolidated Statements of Cash Flow
|
Years Ended December 31,
|
|||||||||||||||
|
2010
|
2009
|
2008
|
|||||||||||||
|
(in USD thousand)
|
|||||||||||||||
|
Net income of the year
|
$ | 2,228 | $ | 996 | $ | 347 | |||||||||
|
Adjustments to reconcile net income to net cash provided by Operating Activities
|
|||||||||||||||
| - |
Depreciation and amortization
|
682 | 870 | 530 | |||||||||||
| - |
Provision for doubtful accounts
|
876 | 397 | 1,056 | |||||||||||
|
Change in current assets and liabilities:
|
|||||||||||||||
| - |
Increase (decrease) in inventory
|
(7,670 | ) | (3,435 | ) | 250 | |||||||||
| - |
Increase in accounts receivables
|
(4,423 | ) | (3,678 | ) | (5,107 | ) | ||||||||
| - |
Increase in other current assets
|
(745 | ) | (2,156 | ) | (1,266 | ) | ||||||||
| - |
Increase in accounts payable and accrued expenses
|
10,826 | 1,080 | 7,882 | |||||||||||
| - |
Increase (decrease) in other liabilities
|
(3,470 | ) | 5,339 | (4,213 | ) | |||||||||
| - |
Increase (decrease) in deferred tax liability
|
(708 | ) | 106 | 133 | ||||||||||
| - |
Increase (decrease) in post-employment benefit obligations
|
603 | 97 | (232 | ) | ||||||||||
| - |
(Decrease) Increase in income tax payable
|
972 | 753 | 665 | |||||||||||
| - |
(Decrease) in other non current liabilities
|
454 | (23 | ) | 48 | ||||||||||
|
Net Cash (used in) provided by Operating Activities (A)
|
$ | (374 | ) | $ | 346 | $ | 93 | ||||||||
|
Investing Activities
|
|||||||||||||||
| - |
Capital expenditures
|
(10,692 | ) | (1,298 | ) | (3,824 | ) | ||||||||
| - |
Investment in markatable securities
|
225 | (1,803 | ) | (79 | ) | |||||||||
|
Net Cash used in Investing Activities (B)
|
$ | (10,467 | ) | $ | (3,101 | ) | $ | (3,902 | ) | ||||||
|
Financing Activities
|
|||||||||||||||
| - |
Principal payment of long-term debt
|
(4,175 | ) | (3,142 | ) | (1,934 | ) | ||||||||
| - |
Proceeds from issuance of long-term debt
|
25,652 | 3,000 | 5,639 | |||||||||||
| - |
Paid up capital increase
|
- | - | 1,937 | |||||||||||
| - |
Cash proceeds from noncontrolling interests
|
(1,571 | ) | 1,560 | - | ||||||||||
|
Net Cash provided by (used in) from Financing Activities (C)
|
$ | 19,905 | $ | 1,418 | $ | 5,642 | |||||||||
|
Effect of change in foreign currency on cash and cash equivalents (D)
|
$ | (24 | ) | $ | (328 | ) | $ | (97 | ) | ||||||
|
Net increase (decrease) in cash and cash equivalents (A+B+C+D)
|
9,041 | (1,664 | ) | 1,735 | |||||||||||
|
Cash and cash equivalents at the beginning of the period (E)
|
2,893 | 4,558 | 2,823 | ||||||||||||
|
Cash and cash equivalents at the end of the period (A+B+C+D+E)
|
$ | 11,934 | $ | 2,893 | $ | 4,558 | |||||||||
|
Supplemental disclosures of cash flow information
|
|||||||||||||||
|
Cash paid during the year
|
|||||||||||||||
|
Interest
|
1,279 | 720 | 624 | ||||||||||||
|
Income taxes
|
945 | 801 | 805 | ||||||||||||
See Notes to Consolidated Financial Statements
5
ITP BENELLI S.p.A.
NOTES TO CONSOLIDATED FINANCIAL STATEMENTS
1. Basis of Presentation
Description of Business
ITP Group (and its subsidiaries, collectively the “Company” or “the Group”) is an Italian manufacturer and supplier of equipment to the Oil & Gas Industry.
The Group is involved in the production of items (i.e. mainly ball valves) and equipment (i.e. mainly pressure vessels), in the engineering and construction of skid packages and in the construction of small plants for the separation and treatment of Oil & Gas. The parent company of the Group has changed its legal name on January 1st, 2011 from Impianti e Tecnologie di Processo S.p.A. to ITP Benelli S.p.A.
The Group has two production plants in Italy (Moscazzano and Ravenna), one in the U.S. (Kilgore – Texas) and one in Brno (Czech Republic).
2. Summary of Significant Accounting Policies
General
The Company’s Consolidated Financial Statements are prepared in U.S. Dollars and in accordance with generally accepted accounting principles in the United States of America (“GAAP or US GAAP”) issued by the Financial Accounting Standards Board (FASB).
US GAAP requires the use of estimates and assumptions that affect the assets, liabilities, revenues and expenses reported in the financial statements, as well as amounts included in the notes thereto, including discussion and disclosure of contingent liabilities. Significant estimates include the useful lives of assets, realization of deferred tax assets, valuation of goodwill and assumptions related to asset retirement obligations. Actual results could differ from these estimates.
Due to the fact that Company’s operations are worldwide-based, the Company may be subjected to changes in several countries’ economic, regulatory and political conditions.
Unless otherwise indicated, any reference herein to “Consolidated Financial Statements” is to the Consolidated Financial Statements of the Group (including the Notes thereto).
6
Basis of Consolidation
The Consolidated Financial Statements include the accounts of subsidiaries more than 50% owned and variable-interest entities in which the Company is the primary beneficiary.
The principles of Accounting Standards Codification (“ASC”) No. 810, Consolidation are considered when determining whether an entity is subject to consolidation.
Intercompany balances and transactions are eliminated in consolidation.
The following table contains the list of the Company’s subsidiaries:
| Subsidiary |
Country of
Incorporation
|
Company’s
controlling
interests (%)
|
Functional
Currency
|
Consolidated in | ||||
|
Benelli Oil & Gas S.r.l.
|
Italy
|
51%
100%
|
Euro
|
2009
2010
|
||||
|
ITP Chartering S.r.l.
|
Italy
|
99%
|
Euro
|
2009, 2010
|
||||
|
ITP Group Brno s.r.o.
|
Czech Republic
|
100%
|
CZK
|
2010
|
||||
|
ITP Real Estate LLC
|
USA
|
100%
|
USD
|
2008, 2009, 2010
|
||||
|
ITP Surface Equipment PTE Ltd
|
Singapore
|
100%
|
USD
|
2010
|
||||
|
Vignati Fitting S.r.l.
|
Italy
|
100%
|
Euro
|
2008, 2009, 2010
|
||||
|
Surface Equipment Corporation (“SEC”)
|
USA
|
100%
|
USD
|
2008, 2009, 2010
|
Notes to the table above:
|
|
·
|
Benelli Oil & Gas S.r.l.
|
As indicated in Note 4, Benelli Oil & Gas S.r.l. is consolidated beginning from December 2009, when ITP obtained control.
|
|
·
|
ITP Group Brno S.r.o.
|
ITP Group Brno S.r.o. was acquired on January 20, 2010 and consolidated starting from this date.
|
|
·
|
ITP Surface Equipment PTE Ltd.
|
The subsidiary ITP Surface Equipment PTE Ltd., is a dormant company which is held in order to undertake strategic commercial plans in Asia starting in 2011.
7
The following table sets forth, for the periods indicated, the information regarding the U.S. $/EUR exchange rate, rounded to the second decimal:
|
Year ended December 31,
|
Average
|
At period end
|
||||||
|
2008
|
1.47 | 1.39 | ||||||
|
2009
|
1.39 | 1.44 | ||||||
|
2010
|
1.34 | 1.33 | ||||||
Fair Value of Financial Instruments
Due to the short-term nature of cash and equivalents, accounts receivable and accounts payable, the carrying value of these instruments approximates their fair value.
Short-Term Investments
All short-term investments are classified as available for sale and are in highly liquid debt securities. The balance of the short-term investments is reported as “Marketable securities” and is marked-to-market, with any unrealized gains or losses included in “Other comprehensive income.”
Inventories
Inventories are valued at the lower of cost or market, with cost being determined using the weighted average cost method. Production inventory costs include material, labor and factory overhead. The Company records inventory allowances based on excess and obsolete inventories.
With regards to work in progress, earnings are recorded on a percentage-of-completion basis, except for the subsidiary SEC, which accounts for the long term agreements using the completed contract method. Any difference between costs and revenues and the related economic performance is accounted for as work in progress or advances received from customers.
Property, plant and equipment
Property, plant and equipment are carried at cost and are depreciated using the straight-line method over estimated lives which range from 2 to 30 years. Expenditures for maintenance (including those for planned major maintenance projects), repairs and minor renewals to maintain facilities in operating condition are generally expensed as incurred. Major replacements and renewals are capitalized.
Upon sale or disposal, the cost and related accumulated depreciation are eliminated from the respective accounts and any resulting gain or loss is reported as income or expense, respectively.
Impairment of Long-Lived Assets
The Company records impairment losses on long-lived assets when events and circumstances indicate that the assets might be impaired and their estimated undiscounted cash flows are less than their carrying amount. In this case, the Company records an impairment loss equal to the difference between the fair value of the long-lived assets and their carrying amount. No impairment was recorded in years 2010, 2009 and 2008.
8
Goodwill and Intangible Assets
Goodwill is not depreciated, but is instead reviewed for impairment and written down and charged to results of operations only in the periods in which the recorded value of goodwill is more than its fair value. The Company records impairment losses on goodwill and other intangible assets based on an annual review of the value of the assets, or when events and circumstances indicate that the asset might be impaired and when the recorded value of the asset is more than its fair value. The Company’s estimates of fair value are based on its current operating forecast, which the Company believes to be reasonable. Significant assumptions that underline the fair value estimates include future growth rates and weighted average cost of capital rates. However, different assumptions regarding the current operating forecast could materially affect results.
Intangible assets include long-term patents, brands and software and are amortized on a straight-line basis over the estimated economic useful lives of the assets.
Foreign Currency Translation
The U.S. dollar is the reporting currency of the consolidated financial statements.
The Euro is the group functional currency. The consolidated financial statements have been prepared and translated according to ASC 830-30. Financial statements of companies having a functional currency other than the Euro are translated into the group functional currency, subsequently the consolidated financial statement have been translated into the reporting currency. Assets and liabilities have been translated at the currency exchange rates as of the related year and, the equity at the historical exchange rates the profit and loss account at the average rates for the period.
Revenue Recognition
Revenue is recognized when it is realized or realizable and earned. The Company recognizes revenues when persuasive evidence of an arrangement exists, delivery has occurred, the fee is fixed or determinable, and collectability is reasonably assured. Revenues are recognized from product sales when title and risk of loss has passed to the customer consistent with the related shipping terms, generally at the time products are shipped. Shipping costs and handling fees are included in net revenues and cost of sales.
Refer to the description in the “Inventories” for the accounting of long-term contracts.
Warranty Expenses
The Company currently provides for the estimated costs that may be incurred under product warranties. Warranty provisions are recorded at the time of sale based upon the Company’s historical experience and anticipated future claims. The Company assesses the adequacy of its pre-existing warranty liabilities and adjusts the amounts as necessary based on actual experience and changes in future estimates.
Income Taxes
The Company recognizes deferred tax assets and liabilities based on differences between financial statement and tax bases of assets and liabilities using presently enacted tax rates. At each period-end, the Company assesses the recoverability of its deferred tax assets by reviewing a number of factors including operating trends, future projections, and taxable income to determine whether a valuation allowance is required to reduce such deferred tax assets to an amount that is more likely than not to be realized.
9
Employee Benefit Plan
Employee Benefit Plans are accrued in accordance with Accounting Standard Codification (“ASC”) No. 715, Retirement Benefits.
The employee leaving indemnity in Italy is called “Trattamento di Fine Rapporto” (“TFR”) and represents deferred compensation for employees. Under Italian law, an entity is required to accrue for TFR on an individual employee basis payable to each individual upon termination of employment (including both voluntary and involuntary dismissal). The annual accrual is 7.41% of total pay, with no cap, it is revalued each year by applying a pre-established rate of return of 1.50%, plus 75% of the Consumer Price Index, and it is recorded into a reserve account.
The subsidiaries’ employees in the U.S., Singapore and Czech Republic do not have any benefit or retirement plans.
Cash and Cash Equivalents
All highly liquid instruments purchased with maturities of three months or less are considered to be cash equivalents.
Comprehensive (Loss) Income
The Company’s comprehensive (loss) income is comprised of net income, foreign currency translation gains and losses, and changes in unrealized gains and losses on investments. The Company does not accrue tax on its foreign currency translation gains and losses, as any undistributed earnings of foreign subsidiaries are deemed to be permanently reinvested in the applicable foreign subsidiary. Comprehensive (loss) income is reflected in the consolidated statement of stockholders’ equity.
Research and Development
The Group has not incurred any research and development expenses for the years ended December 31, 2010, 2009 and 2008.
3. Significant subsequent events
After December 31, 2010, the Group executed the following operations:
|
|
·
|
January 2011: ITP Benelli S.p.A. acquired the Rome headquarters (Price: $ 802 thousand).
|
|
|
·
|
January 2011: ITP Benelli S.p.A. signed a contract for a project for air compressors for lifesaving equipment purposes with ERSAI. Country: Kazakistan. (Value: $ 4,501 thousand).
|
|
|
·
|
February 2011: ITP Benelli S.p.A. signed a contract for the design and supply of a piece of equipment called AVT2 for the refinery of Naftan, in the city of Novopolosk in Belarus. (Value: $ 28,132 thousand)
|
The subsequent events have been evaluated up to the date these financial statements were issued (04/28/2011).
10
4. Business Combinations
ITP Group was involved in following business combinations during the periods presented:
|
|
a.
|
ITP Benelli S.p.A. acquired 51% of Benelli Oil & Gas S.r.l. on December 4, 2009.
|
|
|
b.
|
ITP Benelli S.p.A. acquired the remaining 49% of Benelli Oil Gas S.r.l. in May 2010.
|
|
|
c.
|
Benelli Oil & Gas S.r.l. acquired the Sadelmi S.p.A. (“Sadelmi”) Oil & Gas business line in May 2010;
|
|
|
d.
|
ITP Benelli S.p.A. acquired a business line from Nicola & Albia S.r.l. in May 2010.
|
a. Benelli Oil & Gas S.r.l. 51% acquisition
Benelli Oil & Gas S.r.l. (“Benelli”) was incorporated on March 20, 2009 as an Italian corporation based in Ravenna for the purpose of renting and eventually acquiring the Oil & Gas business line of Sadelmi, an Italian corporation which was in critical financial conditions and was in the process of entering into a judicial reorganization procedure (“concordato preventivo”) similar to a Chapter 11 reorganization under U.S. bankruptcy laws. The rental of the Oil & Gas business line of Sadelmi started on April 29th 2009 for a yearly rate of $ 490 thousand.
ITP Benelli S.p.A. obtained control of Benelli on December 4, 2009, thorough the acquisition of 51% of the company by the subscription of a Shareholder’s capital increase, for a cash consideration equivalent to 51% of the fair value of net assets. No goodwill arose from this transaction. The financial statements of Benelli are consolidated from December 4, 2009 onwards.
The recognized amount of identifiable assets acquired and liabilities assumed were:
|
Acquisition of 51% of Benelli Oil & Gas S.r.l.
|
||||
|
Purchase price composition
|
(USD thousand) | |||
|
Assets acquired
|
|
|||
|
Property plant and equipment
|
$ | 1 | ||
|
Intangible assets
|
9 | |||
|
Work in progress
|
4,469 | |||
|
Accounts receivables
|
13,603 | |||
|
Deferred tax assets
|
224 | |||
|
Cash
|
490 | |||
|
Total Assets acquired
|
18,796 | |||
|
Liabilities assumed
|
||||
|
Employees leaving indemnity
|
7 | |||
|
Advances from clients
|
5,429 | |||
|
Accounts payables
|
9,827 | |||
|
Deferred tax liabilities
|
338 | |||
|
Social security liabilities
|
168 | |||
|
Total Liabilities assumed
|
15,770 | |||
|
Fair value of net assets
|
3,026 | |||
|
Goodwill
|
- | |||
|
Purchase price (51% of fair value)
|
$ | 1,543 | ||
11
The acquisition allowed ITP Group to increase company operations through a wider offering of technical equipment and acquire human resources with specific skills in the Oil & Gas Construction/Projects field.
The amounts of revenue and net income of Benelli since the acquisition date (December 4, 2009) included in the consolidated income statement for the reporting period 2009 were respectively $ 1,771 thousand and $ 23 thousand.
Revenues and net income of the combined entity for the reporting period 2009 had the acquisition date for the business combination been as of the beginning of 2009 would have been respectively $ 48,685 thousand and $ 1,351 thousand.
b. Benelli Oil & Gas S.r.l. 49% acquisition
At the acquisition of 51% of Benelli, ITP Benelli S.p.A. also acquired the right and obligation to purchase the remaining 49% of the equity of Benelli. The effective acquisition of the remaining 49% of Benelli occurred on May 20, 2010, for a cash consideration equivalent to 49% of the fair value of net assets and was immediately subsequent to the approval by the Italian Court of Sadelmi S.p.A.’s “concordato preventivo”. Moreover, also on May 20, 2010, Benelli acquired the Oil & Gas business line of Sadelmi, as described in the following paragraph.
The recognized amount of identifiable assets acquired and liabilities assumed were:
|
Acquisition of 49% of Benelli Oil & Gas S.r.l.
|
||||
|
Purchase price composition
|
(USD thousand) | |||
|
Assets acquired
|
|
|||
|
Property plant and equipment
|
$ | 1 | ||
|
Intangible assets
|
8 | |||
|
Work in progress
|
4,165 | |||
|
Accounts receivables
|
12,594 | |||
|
Deferred tax assets
|
208 | |||
|
Cash
|
457 | |||
|
Total Assets acquired
|
17,434 | |||
|
Liabilities assumed
|
||||
|
Employees leaving indemnity
|
7 | |||
|
Advances from clients
|
5,060 | |||
|
Accounts payables
|
9,088 | |||
|
Deferred tax liabilities
|
315 | |||
|
Social security liabilities
|
156 | |||
|
Total Liabilities assumed
|
14,627 | |||
|
Fair value of net assets
|
2,807 | |||
|
Goodwill
|
- | |||
|
Purchase price (49% of fair value)
|
$ | 1,375 | ||
12
The acquisition consolidated the purposes described at point a, “Benelli Oil & Gas S.r.l. 51% acquisition”.
c. Sadelmi Oil & Gas business line acquisition
Benelli acquired the “Oil & Gas” business line of Sadelmi on May 20, 2010 for cash.
The acquisition allowed ITP Group to further increase company operations through a wider offering of technical equipment and, acquire human resources with specific skills in the Oil & Gas Construction/Projects field, consolidated business relationships matured by this business line of Sadelmi.
The recognized amount of identifiable assets acquired and liabilities assumed were:
|
Purchase price composition
|
(USD thousand) | |||
|
Assets acquired
|
|
|||
|
Property plant and equipment
|
$ | 851 | ||
|
Work in progress
|
4,550 | |||
|
Total Assets acquired
|
5,401 | |||
|
Liabilities assumed
|
||||
|
Employees leaving indemnity
|
638 | |||
|
Total Liabilities assumed
|
638 | |||
|
Fair value of net assets
|
4,763 | |||
|
Goodwill
|
4,604 | |||
|
Total purchase price
|
$ | 9,367 | ||
Goodwill, according to ASC 350-20, represents the future economic benefits arising from the assets acquired. In particular it is mainly due to the acquired business relationships, the historical projects’ track record performed by this business and the human resources with specific skills in the Oil & Gas Constructions/Projects field.
The amounts of revenue and net income of the Oil & Gas business line of Sadelmi since the acquisition date (May 20, 2010) included in the consolidated income statement for the reporting period 2010 were respectively $ 12,238 thousand and $ 650 thousand.
Revenues and net income of the combined entity for the current reporting period had the acquisition date for the business combination been as of the beginning of 2010, would have been respectively $ 63,642 thousand and $ 2,451 thousand.
Revenues and earnings of the combined entity for the 2009 period had the acquisition date for the business combination been as of the beginning of 2009 is impracticable to disclose.
13
d. Nicola & Albia S.r.l. business line acquisition
ITP Benelli S.p.A. acquired a business line from Nicola & Albia S.r.l. (“Nicola & Albia”) on April 31, 2010 for cash.
The recognized amount of identifiable assets acquired and liabilities assumed were:
|
Purchase price composition
|
(USD thousand) | |||
|
Assets acquired
|
|
|||
|
Property, plant and equipment
|
$ | 4,564 | ||
|
Intangible assets
|
100 | |||
|
Total Assets acquired
|
4,665 | |||
|
Liabilities assumed
|
||||
|
Trade accounts payables payables
|
188 | |||
|
Total Liabilities assumed
|
188 | |||
|
Fair value of net assets
|
4,476 | |||
|
Goodwill
|
354 | |||
|
Total purchase price
|
$ | 4,830 | ||
Nicola & Albia has been operating in the design and construction of specialized petroleum, chemical and pharmaceutical equipment since 1946 and has built a very strong brand-name both domestically and internationally. Through the acquisition, ITP also integrated 22 highly qualified personnel with many years of experience.
The acquisition allowed ITP Group to obtain the required certificates to operate in certain countries including the ASME “U” STAMP (USA), the Safety Quality License (China) and the Urzad Dozoru Technicznego (Poland). Furthermore, the acquisition, mainly constituted by properties plants and equipments, will permit economy of scale due to the internal development of some construction contracts.
Goodwill, according to ASC 350-20, represents the future economic benefits arising from the assets acquired. In particular it is mainly due to the historical projects’ track record performed by this business and the human resources with specific skills in the Oil & Gas Constructions/Projects field.
Nicola & Albia was in winding-up and therefore was not fully operative in 2009 and 2010. Therefore, revenues and net income of the combined entity for the current reporting period had the acquisition date for the business combination been as of the beginning of 2010, would have been respectively $ 63,642 thousand and $ 2,228 thousand, the same presented in the 2010 ITP consolidated financial statements.
Revenues and earnings of the combined entity for the 2009 period had the acquisition date for the business combination been as of the beginning of 2009 would have been respectively $ 31,626 thousand and $ 996 thousand.
14
5. Segment information
The Company has only one operating segment as none of the conditions listed in ASC 280-10 are met to identify more than one operating segment.
The chief operating decision maker (“CODM”) views, treats and take decisions considering the company as a single operating entity as its activities have common target clients, plants, basic characteristics, engaged employees. As a result no disaggregated or discrete financial information and operating results are available. Furhtermore there is no concentration of customers.
Below is an analysis of revenue for each year by product and by geographic area, and an analysis of property, plant and equipment by geographic area.
|
Revenues (USD thousand)
|
||||||||||||
|
Operating segment
|
2010
|
2009
|
2008
|
|||||||||
|
Equipments
|
$ | 15,323 | $ | 10,680 | $ | 13,438 | ||||||
|
Skid & Packages
|
48,319 | 10,049 | 10,766 | |||||||||
|
Small O&G plants
|
- | 10,897 | 22,527 | |||||||||
|
Total
|
$ | 63,642 | $ | 31,626 | $ | 46,731 | ||||||
|
Revenues (USD thousand)
|
||||||||||||
|
Country
|
2010
|
2009
|
2008
|
|||||||||
|
Italy
|
$ | 16,113 | $ | 1,056 | $ | 5,788 | ||||||
|
Middle East
|
13,797 | 20,919 | 25,863 | |||||||||
|
USA
|
13,042 | 8,530 | 10,241 | |||||||||
|
Other countries
|
20,691 | 1,122 | 4,840 | |||||||||
|
Total
|
$ | 63,642 | $ | 31,626 | $ | 46,731 | ||||||
The percent of consolidated revenue of major customers that accounted for 10% or more of consolidated revenues for each of the last three years was as follows: in 2010 Khalda Petroleum accounted for 15%; in 2009 Khalda Petroleum & Petrojet accounted for 58%; and in 2008 Khalda Petroleum & Intermare Sarda accounted for 67%. The company has delivered the products to over 46 customers in 2010.
|
Property, plant and equipment (USD thousand)
|
||||||||||||
|
Country
|
2010
|
2009
|
2008
|
|||||||||
|
Italy
|
$ | 11,443 | $ | 4,984 | $ | 4,182 | ||||||
|
Middle East
|
- | - | - | |||||||||
|
USA
|
4,469 | 4,397 | 4,317 | |||||||||
|
Other countries
|
39 | - | - | |||||||||
|
Total
|
$ | 15,952 | $ | 9,380 | $ | 8,499 | ||||||
15
6. Recent Accounting Pronouncements
|
|
·
|
Business Combinations (ASC 810), Disclosure of Supplementary Pro Forma Information for Business Combinations (ASU 2010-29): The FASB issued ASU 2010-29 in December 2010. The ASU affect’s public entities, as that term is defined in ASC 805, that enter into business combinations that are material individually or in the aggregate. The ASU is effective prospectively for business combinations whose acquisition date is at or after the beginning of the first annual reporting period beginning on or after December 15, 2010. Early adoption is permitted. The impact of this standard on the consolidated financial statements is not expected to be material.
|
|
|
·
|
Goodwill impairment (ASC 350-20) When to Perform Step 2 of the Goodwill Impairment Test for Reporting Units With Zero or Negative Carrying Amounts (ASU 2010-28): The FASB issued ASU 2010-28 in December 2010. The ASU affect’s Entities that evaluate goodwill for impairment under ASC 350-20. For public entities, the ASU is effective for impairment tests performed during entities’ fiscal years (and interim periods within those years) that begin after December 15, 2010. Early application will not be permitted. The impact of this standard on the consolidated financial statements is not expected to be material.
|
|
|
|
|
·
|
Foreign Currency (Topic 830) Foreign Currency Issues: Multiple Foreign Currency Exchange Rates (SEC Update) (ASU 2010-19) The FASB issued ASU 2010-19 in May 2010. The ASU affect’s Entities in the oil and gas industry. The ASU is related to current restrictions of foreign currency exchange in Venezuela. Adoption of the standard did not have an impact on the company’s financial statements the company did not incur in any transaction based or through Venezuela.
|
|
|
|
|
·
|
Consolidation (ASC 810), Improvements to Financial Reporting by Enterprises Involved With Variable Interest Entities (ASU 2009-17): The FASB issued ASU 2009-17 in December 2009. This standard became effective for the company January 1, 2010. ASU 2009-17 requires the enterprise to qualitatively assess if it is the primary beneficiary of a variable-interest entity (VIE), and if so, the VIE must be consolidated. Adoption of the standard did not have an impact on the company’s results of operations, financial position or liquidity.
|
|
|
·
|
Accounting for Extractive Activities — Oil & Gas — amendments to paragraph 932-10-S99-1 (ASU 2010-14) The FASB issued ASU 2010-14 in April 2010. The ASU affect’s Entities in the oil and gas industry. The ASU does not contain an effective date. Adoption of the standard did not have an impact on the company’s financial statements.
|
|
|
·
|
Revenue Recognition (Topic 605): Multiple-Deliverable Revenue Arrangements (ASU 2009-13) The FASB issued ASU 2009-12 in October 2009. The ASU affect’s Entities with multiple-deliverable revenue arrangements. The ASU effective date of application is for fiscal years beginning on or after June 15, 2010. The impact of this standard on the consolidated financial statements is not expected to be material.
|
16
|
|
·
|
Codification: In June 2009, the FASB issued an Accounting Standards Codification (“ASC” or “Codification”), which identifies the sources of accounting principles and the framework for selecting the principles used in the preparation of financial statements of nongovernmental entities that are presented in conformity with generally accepted accounting principles (“GAAP”) in the United States. This guidance establishes the Codification as the source of authoritative GAAP recognized by the FASB to be applied by those entities. Rules and interpretive releases of the SEC under federal securities laws are also sources of authoritative GAAP for SEC registrants. The SEC Sections in the Codification are not the authoritative sources of such content and do not contain the entire population of SEC rules, regulations, interpretive releases, and staff guidance. All guidance contained in the Codification carries an equal level of authority. Following the issuance of this guidance, the FASB will not issue new standards in the form of Statements, FASB Staff Positions, or Emerging Issues Task Force Abstracts. Instead, it will issue Accounting Standards Updates to the Codification. This guidance is effective for financial statements issued for interim and annual periods ending after September 15, 2009. There were no changes to the accounting principles used to prepare the Company’s financial statements as a result of the adoption of the ASC.
|
7. Statement of Cash Flows
The Consolidated Statement of Cash Flows is prepared according to the indirect method and considers only bank deposits as cash and cash equivalents. It excludes changes to the Consolidated Balance Sheet that did not affect cash.
8. Goodwill
The changes in the carrying amount of goodwill for the years ended December 31, 2010 and 2009, are as follows:
|
Changes in the carrying amount of goodwill
|
||||
|
|
USD thousand
|
|||
|
Balance as of January 1, 2009
|
$ | 1,642 | ||
|
Acquisitions
|
- | |||
|
Currency translation effect
|
58 | |||
|
Balance as of December 31, 2009
|
1,699 | |||
|
Acquisitions
|
4,958 | |||
|
Currency translation effect
|
(148 | ) | ||
|
Balance as of December 31, 2010
|
$ | 6,509 | ||
As of December 31, 2010 Goodwill show a balance of $ 6,509 thousand.
The balance as of December 31, 2009 arose from the goodwill originating from the acquisition of Surface Equipment Corporation Ltd., based in Texas (United States of America).
17
The increase in 2010, compared to December 31, 2009, arose from the acquisition of:
|
|
·
|
the Sadelmi Oil & Gas business line
|
|
|
·
|
the business line Nicola & Albia
|
The Company evaluates all goodwill for impairment on an annual basis, or more often if impairment indicators are present. As of December 31, 2010, 2009 and 2008 the Company did not recognize any goodwill impairment charges.
9. Property, Plant and Equipment
Gross property, plant and equipment as of December 31, 2010 and 2009 includes the following:
|
Gross Property plant and equipment
|
December 31,
|
|
|
December 31,
|
||||||||||||
|
USD thousand
|
2009
|
Additions | Disposals |
2010
|
||||||||||||
|
Land and buildings
|
$ | 7,323 | $ | 6,786 | - | $ | 14,109 | |||||||||
|
Plant and machineries
|
1,553 | 223 | - | 1,776 | ||||||||||||
|
Industrial and commercial equipment
|
1,747 | 164 | - | 1,935 | ||||||||||||
|
Other equipment
|
1,220 | 58 | - | 1,278 | ||||||||||||
|
Total Gross Property plant and equipment
|
$ | 11,843 | $ | 7,231 | - | $ | 19,074 | |||||||||
The accumulated depreciation is the following:
| Accumulated depreciation Property Plant and Equipment | December 31, | December 31, | ||||||||||
|
USD thousand
|
2009
|
Depreciation
|
2010
|
|||||||||
|
Depreciation Land and buildings
|
$ | 735 | $ | 402 | $ | 1,137 | ||||||
|
Depreciation Plant and machineries
|
851 | 150 | 1,001 | |||||||||
|
Depreciation Industrial and commercial equipment
|
331 | 76 | 407 | |||||||||
|
Depreciation Other equipment
|
547 | 54 | 601 | |||||||||
|
Total Accumulated Depreciation
|
$ | 2,464 | $ | 682 | $ | 3,146 | ||||||
The net property plant balance is the following:
|
Net Property Plant and Equipment
|
December 31,
|
|
|
December 31,
|
||||||||||||
|
USD thousand
|
2009
|
Additions
|
Depreciation
|
2010
|
||||||||||||
|
Land and buildings
|
$ | 6,588 | $ | 6,786 | $ | (402 | ) | $ | 12,971 | |||||||
|
Plant and machineries
|
702 | 223 | (150 | ) | 775 | |||||||||||
|
Industrial and commercial equipment
|
1,417 | 164 | (76 | ) | 1,528 | |||||||||||
|
Other equipment
|
674 | 58 | (54 | ) | 678 | |||||||||||
|
Total Net Property Plant and Equipment
|
$ | 9,380 | $ | 7,231 | $ | (682 | ) | $ | 15,952 | |||||||
18
In accordance with US GAAP, the Group separated the land included in the value of properties from the related asset. Land, considered to have an indefinite useful life, is not subject to depreciation.
The most significant additions during 2010 were the following:
|
|
·
|
Purchase of an industrial building in Cassina de’ Pecchi (Milan – Italy), for an amount of $ 4,229 thousand.
|
|
|
·
|
Purchase of land together with an industrial building license in Monte Cremasco (Cremona – Italy) for an amount of $ 1,115 thousand.
|
|
|
·
|
Purchase of an industrial building in Via Stefini (Milan – Italy) for an amount of $ 308 thousand.
|
The most significant additions during 2009 were the following:
|
|
·
|
Purchase of a property in Baku, Azerbaijan for an amount of $ 144 thousand.
|
|
|
·
|
Financial lease of machineries, commercial equipment and other equipment, for an amount of $ 445 thousand.
|
The plant located in Moscazzano (Cremona – Italy) is subject to a mortgage and the plant located in Milano, “Via Stefini”, is subject to a pledge. They both guarantee the bank loans received.
10. Inventories
Inventories at December 31, 2010 and 2009 are the following:
|
Inventory
|
Year ended December 31,
|
|||||||
|
USD thousand
|
2010
|
2009
|
||||||
|
Finished goods
|
$ | - | $ | - | ||||
|
Work in progress
|
12,768 | 5,548 | ||||||
|
Raw materials
|
2,020 | 1,427 | ||||||
|
Total inventory
|
$ | 14,788 | $ | 6,975 | ||||
Work in progress duration is not standard, but generally is from 6 months to 2 years. Construction contracts included in work in progress as of December 31, 2010 have starting dates after 2009 and ending dates no later than 2012.
The work in progress balance presentation is net of prepayments received.
Raw materials include the minimum equipment stock to ensure an efficient execution of construction contract operations without delays.
11. Accounts receivable
Accounts receivable as of December 31, 2010 and 2009 amount respectively to $ 19,918 thousand and $ 16,095 thousand.
19
A provision is applied against the full (or partial) amount of the foregoing receivables deemed uncollectable. The provision for doubtful accounts as of December 31, 2010 and as of December 31, 2009 is respectively equal to $ 876 thousand and to $ 397 thousand.
12. Marketable Securities
The Group calculates fair value for its marketable securities based on quoted market prices for assets and liabilities. As of December 31, 2010 and as of December 31, 2009 the fair value was respectively, $ 3,425 thousand and $ 3,645 thousand.
13. Cash and cash equivalents
Cash and cash equivalents as of December 31, 2010 and 2009, are summarized below (in USD thousands):
|
Cash and cash equivalents
|
Year ended December 31,
|
|||||||
|
USD thousand
|
2010
|
2009
|
||||||
|
Cash
|
$ | 117 | $ | 67 | ||||
|
Banks deposits
|
11,817 | 2,827 | ||||||
|
Total cash and cash equivalents
|
$ | 11,934 | $ | 2,893 | ||||
In relation to the successful execution clause (called “performance bond”) included in most of project contract engagements, the Company has issued warranty letters to the customers concerned. The total amount of guarantees as of December 31, 2010, amounts to $ 7,917 thousand and as of December 31, 2009, amounts to $ 4,552 thousand. The company does not expect to incur any losses in relation to these guarantees.
There are no cash or deposits subject to restrictions.
14. Prepaid expenses and deferred taxes
The balances of prepaid expenses and deferred taxes as of December 31, 2010 and 2009, are following:
|
Prepaid expenses and other current assets
|
Year ended December 31,
|
|||||||
|
USD thousand
|
2010
|
2009
|
||||||
|
Deferred income taxes
|
$ | 392 | $ | - | ||||
|
Prepaid expenses
|
4,707 | 4,682 | ||||||
|
Total prepaid expenses and other current assets
|
$ | 5,099 | $ | 4,682 | ||||
Tax credits are mainly related to deferred taxes and account receivables for VAT.
20
Prepaid expenses include mainly deferred charges which are expenses or revenues which are accounted for in a later accounting period than the payment for an anticipated future benefit, or to comply with the requirement of matching costs with revenues. As of December 31, 2010, and 2009, there are no prepaid expenses with a life in excess of one year.
15. Long-term debt
Long-term debt amounts to $ 33,499 thousand as of December 31, 2010 and $ 10,746 thousand as of December 31, 2009.
The Group’s debt obligation due within one year as of December 31, 2010 consists primarily of the current portion of long-term debt, which is equal to $ 13,105 thousand. Such amount as of December 31, 2009 was $ 3,847 thousand.
Bank debt as of December 31, 2010 includes the following:
|
Long term debts
USD thousand
Lender
|
Beginning
Year
|
Duration
(years)
|
Ending
Year
|
Non current
residual
capital value
|
Interest rate %
as of
December 31,
2010
|
Interest rate
|
Covenants
|
||||||||||||||||
|
Unicredit
|
2010
|
3 | 2013 | $ | 1,739 | 3.20 | % |
Fixed
|
No
|
||||||||||||||
|
Deutsche Bank
|
2010
|
5 | 2015 | 3,478 | 2.53 | % |
Variable Euribor + spread
|
No
|
|||||||||||||||
|
Banca Popolare di Vicenza
|
2010
|
4 | 2014 | 232 | 2.45 | % |
Fixed
|
No
|
|||||||||||||||
|
Cariparma 1
|
2010
|
8 | 2018 | 6,667 | 2.78 | % |
Variable Euribor + spread
|
Yes 2
|
|||||||||||||||
|
Credito Cooperativo Laudense
|
2008
|
8 | 2016 | 1,783 | 2.80 | % |
Fixed
|
No
|
|||||||||||||||
|
Cariparma
|
2009
|
3 | 2012 | 81 | 3.08 | % |
Variable Euribor + spread
|
No
|
|||||||||||||||
|
Banca Popolare di Intra
|
2008
|
3 | 2011 | 289 | 3.43 | % |
Variable Euribor + spread
|
No
|
|||||||||||||||
|
Banca Sella
|
2010
|
8 | 2018 | 522 | 3.85 | % |
Variable Euribor + spread
|
No
|
|||||||||||||||
|
Popolare di Sondrio
|
2010
|
4 | 2014 | 1,995 | 3.27 | % |
Variable Euribor + spread
|
No
|
|||||||||||||||
|
Austin Bank
|
2009
|
6 | 2015 | 1,267 | 6.25 | % |
Variable Euribor + spread
|
No
|
|||||||||||||||
|
Austin Bank loan no. 15952
|
2007
|
5 | 2012 | 1,059 | 6.50 | % |
Variable Euribor + spread
|
No
|
|||||||||||||||
|
Austin Bank loan no. 15960
|
2007
|
6 | 2013 | 765 | 6.50 | % |
Variable Euribor + spread
|
No
|
|||||||||||||||
|
Austin Bank loan no. 3608030897
|
2008
|
5 | 2013 | 300 | 6.50 | % |
Variable Euribor + spread
|
No
|
|||||||||||||||
|
Citizens Bank
|
2009
|
2 | 2011 | 218 | 6.25 | % |
Variable Euribor + spread
|
No
|
|||||||||||||||
|
Total long term debts
|
$ | 20,395 | |||||||||||||||||||||
1 Sindacated loan withCariparma bank leading lender (other lenders: Banca Popolare dell'Emilia Romagna, Banca Popolare di Vicenza
2 Net financial positions (calculated on the Italian Statutory financial statements) ratio has to be less than 4.5. As of December 31, 2010 the recalculated indicator were 2.7
21
The residual part of short term bank debts are related to credit lines and to the residual debt due to lessors for assets purchased via financial leases.
Principal payment of long term debt, for the next 5 years are as follows:
|
Year ended December 31,
|
|
|||
|
USD thousand
|
Amount | |||
|
2011 (Current)
|
$ | 13,105 | ||
|
2012
|
4,435 | |||
|
2013
|
3,965 | |||
|
2014
|
4,013 | |||
|
2015
|
2,991 | |||
|
Thereafter
|
4,990 | |||
|
Total Long-Term debts
|
$ | 33,500 | ||
The amounts due within one year have been disclosed above.
16. Current liabilities
Current liabilities at December 31, 2010 and 2009 includes the following:
|
Current Liabilities
|
Year ended December 31,
|
|||||||
|
USD thousand
|
2010
|
2009
|
||||||
|
Accounts payable and accrued expenses
|
$ | 26,911 | $ | 15,443 | ||||
|
Taxes payable
|
3,195 | 2,205 | ||||||
|
Current portion of:
|
||||||||
|
Advances received from customers
|
2,535 | 7,184 | ||||||
|
Long-term debt
|
13,105 | 3,847 | ||||||
|
Other liabilities
|
2,784 | 1,670 | ||||||
|
Total Current Liabilities
|
$ | 48,531 | $ | 30,350 | ||||
Accounts payable are accounted for net of commercial discounts. Cash discounts are recognized when the payment is made.
Tax payable is related to liabilities calculated on income before tax, after the offset of prepayments made during the year.
Advances received from customers are amounts received in advance from project contracts’ customers.
The current portion of long term debt is included above.
Other liabilities are mainly accruals for employee compensation (vacation accruals, December 2010 salaries, social security liabilities and other minor payables).
22
17. Long-term liabilities
Long-term liabilities as of December 31, 2010 and 2009, are as follows:
|
Long-term Liabilities
|
Year ended December 31,
|
|||||||
|
USD thousand
|
2010
|
2009
|
||||||
|
Long-term debt, net of current
|
$ | 20,395 | $ | 6,899 | ||||
|
Deferred income taxes
|
- | 330 | ||||||
|
Other liabilities
|
682 | 219 | ||||||
|
Post-employment benefit
|
1,418 | 803 | ||||||
|
Total Long-Term Liabilities
|
$ | 22,494 | $ | 8,251 | ||||
Long-term debt due to banks amounting to $ 20,395 thousand at December 31, 2010, has been disclosed above in note 15.
Deferred income taxes as of December 31, 2010 represent a net deferred tax asset for an amount of $ 392 thousand. As of December 31, 2009, the amount is a net deferred tax liability for amount of $ 330 thousand. This amount is calculated based on temporary differences, and is mostly related to temporary differences between statutory tax accounting and US GAAP financial accounting.
Other liabilities, amounting to $ 682 thousand as of December 31, 2010 and $ 219 thousand as of December 31, 2009, increased by $ 463 thousand mainly due to the reclassification of the residual debt on the acquisition of Benelli to long term liabilities and to a provision for a claim received by the subsidiary SEC for allegedly stolen data through an employee resource previously employed from a competitor. Claim has been received during 2010.
The risk of loss was considered probable. The Company estimated the amount of probable loss as $ 125 thousand based on the evaluation of a lawyer.
Post-employment benefits which liability amounts to $ 1,418 thousand as of December 31, 2010, relates to amounts due to employees (“TFR”), as of the year end, after the offset of any advance payments made. The $ 614 thousand increase in comparing current figures to 2009 is mainly due to the acquisition of Benelli together with its liabilities for post-employment benefits, and the accrual made during the year, as required by Italian retirement law.
23
18. Shareholders’ Equity
Shareholders’ Equity as of December 31, 2010 and 2009, consists of the following:
|
Equity
|
Year ended December 31,
|
|||||||
|
USD thousand
|
2010
|
2009
|
||||||
|
Capital stock
|
$ | 7,326 | $ | 5,885 | ||||
|
Accumulated other comprehensive income
|
(119 | ) | 23 | |||||
|
Retained earnings
|
271 | (517 | ) | |||||
|
Total ITP Group Stockholders’ Equity
|
$ | 7,477 | $ | 5,391 | ||||
|
Noncontrolling interests
|
- | 1,571 | ||||||
|
Total Equity
|
$ | 7,477 | $ | 6,962 | ||||
Capital stock amounts to $ 7.326 thousand and consists of 50.000 shares with nominal value of 100 Euro each. The 10.000 increase in shares compared to December 31, 2009, relates to a Capital Stock increase approved by the Board of Directors during 2010, for the purpose of funding the planned investments.
19. Total revenues
The majority of revenues are generated by construction contracts engagements. Total revenues as of December 31, 2010 increased by $ 31,881 thousand (+102%) compared to December 31, 2009 ($ 63,205 thousand as of December 31, 2010 and $ 31,324 thousand for the year ended as of December 31, 2009). Total revenues as of December 31, 2009 decreased by $ 14,890 thousand compared to 2008, to $ 31,324 thousand.
20. Cost of sales
Costs of sales (“COS”) as of December 31, 2010, are equal to $ 47,831 thousand. Compared to 2009 cost of sales increased by $ 24,312 thousand. COS includes the depreciation and amortization that for the year ended 2010, 2009, 2010 is respectively $ 682 thousand, $ 870 thousand, $ 530 thousand.
21. Operating expenses
Operating expenses as of December 31, 2010, 2009 and 2008 amount to $ 11,067 thousand, $ 5,023 thousand and $ 5,869 thousand, respectively, and include the following:
|
Operating Expenses
|
Year ended December 31,
|
|||||||||||
|
USD thousand
|
2010
|
2009
|
2008
|
|||||||||
|
Selling, general and administrative expenses
|
$ | (9,321 | ) | $ | (4,177 | ) | $ | (3,569 | ) | |||
|
Provision for doubtful accounts
|
(876 | ) | (397 | ) | (1,056 | ) | ||||||
|
Other operating costs
|
(870 | ) | (449 | ) | (1,243 | ) | ||||||
|
Total Operating Expenses
|
$ | (11,067 | ) | $ | (5,023 | ) | $ | (5,869 | ) | |||
24
Selling, general and administrative expenses are mainly administrative personnel salaries including bonuses, promotions and the value of unclaimed holidays and other deferred benefits.
The provision for doubtful accounts has been determined as a result of an analysis of the collectability of accounts receivable and in accordance with the Group accounting policy. As of December 31, 2010, 2009 and 2008 the Group accrued additional reserves in the provision for doubtful accounts for $ 876 thousand, $ 397 thousand and $ 1,056 thousand, respectively.
Other operating costs are expenses related to business development, commercial activities, travel, and other nonrecurring general expenses.
22. Income taxes
The Company and its subsidiaries are subject to income taxes on an entity basis, on income arising in, or derived from, the tax jurisdiction in which they operate.
Income before provision for income taxes and the provision for income taxes consisted of the following:
|
Income (loss) before provision for income taxes
|
||||||||||||
|
USD thousand
|
2010
|
2009
|
2008
|
|||||||||
|
Italian companies
|
$ | 4,274 | $ | 1,798 | $ | 741 | ||||||
|
US companies
|
(649 | ) | 567 | 676 | ||||||||
|
Other foreign companies
|
(114 | ) | - | - | ||||||||
|
Total income before provision for income taxes
|
$ | 3,511 | $ | 2,365 | $ | 1,417 | ||||||
|
USD thousand
|
2010
|
2009
|
2008
|
|||||||||
|
Current
|
||||||||||||
|
Italian companies
|
$ | 1,283 | $ | 1,050 | $ | 789 | ||||||
|
US companies
|
- | 318 | 282 | |||||||||
|
Other foreign companies
|
- | - | ||||||||||
|
Total provision (receivable) for current income taxes
|
$ | 1,283 | $ | 1,369 | $ | 1,070 | ||||||
|
Deferred
|
||||||||||||
|
US companies
|
- | - | ||||||||||
|
Other foreign companies
|
- | - | ||||||||||
|
Total provision (receivable) for deferred income taxes
|
$ | - | $ | - | $ | - | ||||||
|
Total provision (receivable) for income taxes
|
$ | 1,283 | $ | 1,369 | $ | 1,070 | ||||||
25
The Company recognizes deferred tax liabilities and assets for the expected future tax consequences of events that have been included in the financial statements or tax returns. Under this method, deferred tax liabilities and assets are determined based on the difference between the financial statements and the tax bases of assets and liabilities. This is done by using enacted tax rates which are expected to be applicable to the taxable income in the periods in which the differences are expected to arise. In assessing the recoverability of deferred tax assets, management considers whether it is more likely than not that some or all of tax assets may not be realized. In performing this evaluation, management considers the scheduled reversal of deferred tax liabilities, projected future taxable income, and tax planning strategies.
The Italian statutory tax rate is comprehensive of two components: national (“IRES”) and regional (“IRAP”). IRES tax rate amounts to 27.5%. IRAP amounts to 4.97% for the fiscal year 2010, 4.82% for the fiscal year 2009, 4.25% for the fiscal year 2008. The taxes are computed on different bases and by the application of different adjustments that may also vary from one year to another.
Furthermore the basis of application of income taxes is the Italian statutory net income adjusted accordingly to national and regional taxes requirements, as a consequence the translation under USGaap may have effects on the effective tax rate determined on the consolidated financial statements prepared accordingly to USGaap.
For the year ended as of December 31, 2010, 2009, 2008 the overseas subsidiaries income taxes did not have any impact since they were not material.
Reconciliation between the Italian statutory tax rate and the effective tax rate is as follows:
|
Tax rate reconciliation
|
||||||||||||
|
2010
|
2009
|
2008
|
||||||||||
|
Italian statutory tax rate
|
32.4 | % | 32.3 | % | 31.8 | % | ||||||
|
Permanent differences
|
8.4 | % | 9.8 | % | 13.2 | % | ||||||
| Basis differences on accounts receivable | (3.4 | )% | 6.5 | % | 25.4 | % | ||||||
| Basis differences on inventory | 0.0 | % | 1.9 | % | 4.1 | % | ||||||
| Otherbasis differences | (0.9 | )% | 7.4 | % | 1.0 | % | ||||||
|
Effective tax rate
|
36.5 | % | 57.9 | % | 75.5 | % | ||||||
Deferred income tax assets and liabilities have been classified in the consolidated financial statements as follows:
26
|
Deferred tax assets - current
|
||||||||||||
|
USD thousand
|
2010
|
2009
|
2008
|
|||||||||
|
Italian companies
|
$ | (841 | ) | $ | - | $ | - | |||||
|
US companies
|
- | - | - | |||||||||
|
Other foreign companies
|
- | - | - | |||||||||
|
Total deferred tax assets - current
|
$ | (841 | ) | $ | - | $ | - | |||||
|
Deferred tax assets - non current
|
||||||||||||
|
USD thousand
|
2010
|
2009
|
2008
|
|||||||||
|
Italian companies
|
$ | - | $ | - | $ | - | ||||||
|
US companies
|
- | - | - | |||||||||
|
Other foreign companies
|
- | - | - | |||||||||
|
Total deferred tax assets - non current
|
$ | - | $ | - | $ | - | ||||||
|
Taxes payables - current
|
||||||||||||
|
USD thousand
|
2010
|
2009
|
2008
|
|||||||||
|
Italian companies
|
$ | 3,187 | $ | 1,887 | $ | 1,070 | ||||||
|
US companies
|
- | 318 | 319 | |||||||||
|
Other foreign companies
|
8 | - | - | |||||||||
|
Total taxes payables - current
|
$ | 3,195 | $ | 2,205 | $ | 1,389 | ||||||
|
Deferred tax liabitilies - current
|
||||||||||||
|
USD thousand
|
2010
|
2009
|
2008
|
|||||||||
|
Italian companies
|
$ | 214 | $ | 100 | $ | 137 | ||||||
|
US companies
|
236 | 230 | 78 | |||||||||
|
Other foreign companies
|
- | - | - | |||||||||
|
Deferred tax liabilities - non current
|
$ | 450 | $ | 330 | $ | 215 | ||||||
Tax reserve for current and deferred income taxes is as follow:
|
Tax reserve for current and deferred income taxes
|
||||
|
USD thousand
|
||||
|
Balance as of January 1, 2009
|
$ | 1,604 | ||
|
Provision
|
|
1,369 | ||
|
Payments/Settlements
|
|
(460 | ) | |
|
Exchange currency translation
|
|
22 | ||
|
Balance as of December 31, 2009
|
|
2,535 | ||
|
Provision
|
|
1,283 | ||
|
Payments/Settlements
|
|
(1,024 | ) | |
|
Exchange currency translation
|
|
11 | ||
|
Balance as of December 31, 2010
|
$ | 2,804 | ||
27
The deferred tax assets and liabilities as of December 31, 2010, 2009 and 2008, respectively, were comprised of:
|
USD thousand
|
Assets
|
Liabilities
|
||||||
|
Deferred income tax as of December 31, 2010
|
||||||||
|
Accounts receivables
|
$ | (841 | ) | - | ||||
|
Fixed assets
|
- | 450 | ||||||
|
Deferred income tax as of December 31, 2009
|
||||||||
|
Fixed assets
|
- | 330 | ||||||
|
Deferred income tax as of December 31, 2008
|
||||||||
|
Fixed assets
|
$ | - | $ | 215 | ||||
23. Valuation and qualifying accounts
|
Allowance for doubtful accounts
|
||||
|
USD thousand
|
||||
|
Balance as of January 1, 2008
|
$ | 79 | ||
|
Charged to costs and expenses
|
1,056 | |||
|
Deductions
|
- | |||
|
Currency translation effect
|
112 | |||
|
Balance as of December 31, 2008
|
1,247 | |||
|
Charged to costs and expenses
|
397 | |||
|
Deductions
|
- | |||
|
Currency translation effect
|
20 | |||
|
Balance as of December 31, 2009
|
1,664 | |||
|
Charged to costs and expenses
|
876 | |||
|
Deductions
|
- | |||
|
Currency translation effect
|
9 | |||
|
Balance as of December 31, 2010
|
$ | 2,549 | ||
28