Attached files
| file | filename |
|---|---|
| EX-99.1 - EXHIBIT 99.1 - MEADOWBROOK INSURANCE GROUP INC | ex99_1.htm |
| 8-K - MEADOWBROOK INSURANCE GROUP INC 8-K 5-5-2011 - MEADOWBROOK INSURANCE GROUP INC | form8k.htm |

Investor Supplement
First Quarter Update - 2011

2
Forward-Looking Statements
Certain statements made by Meadowbrook Insurance Group, Inc. in this presentation may
constitute forward-looking statements including, but not limited to, those statements that include
the words "believes," "expects," "anticipates," "estimates," or similar expressions. Please refer
to the Company's most recent 10-K, 10-Q, and other Securities and Exchange Commission
filings for more information on risk factors. Actual results could differ materially. These forward-
looking statements involve risks and uncertainties including, but not limited to the following: the
frequency and severity of claims; uncertainties inherent in reserve estimates; catastrophic
events; a change in the demand for, pricing of, availability or collectability of reinsurance;
increased rate pressure on premiums; obtainment of certain rate increases in current market
conditions; investment rate of return; changes in and adherence to insurance regulation;
actions taken by regulators, rating agencies or lenders; obtainment of certain processing
efficiencies; changing rates of inflation; and general economic conditions. Meadowbrook is not
under any obligation to (and expressly disclaims any such obligation to) update or alter its
forward-looking statements whether as a result of new information, future events or otherwise.

3
(in thousands, except ratios)
Underwriting and Investing
Activities
Activities
Top line earned premium growth
driven primarily by new initiatives that
were launched in the second half of
2009
driven primarily by new initiatives that
were launched in the second half of
2009
Growth in net investment income
reflects 11.6% growth in average
invested assets, off-set by a
prolonged lower yields. See the
following slide for combined ratio
analysis
reflects 11.6% growth in average
invested assets, off-set by a
prolonged lower yields. See the
following slide for combined ratio
analysis
Net Commissions & Fees
Decline in fee and commission
revenue is driven by conversion of
USSU to our paper
revenue is driven by conversion of
USSU to our paper
Excluding the conversion, net
commissions and fees were up
slightly in 2011
commissions and fees were up
slightly in 2011
The increase in GS&A relates
primarily to investments in sales
initiatives to stimulate revenue growth
in net commissions and fees
primarily to investments in sales
initiatives to stimulate revenue growth
in net commissions and fees
Other Expenses
Reduction in other expenses driven
by a reduction in the variable
compensation expense accrual in the
current quarter, interest rate and
reduction of scheduled amortization
by a reduction in the variable
compensation expense accrual in the
current quarter, interest rate and
reduction of scheduled amortization
4
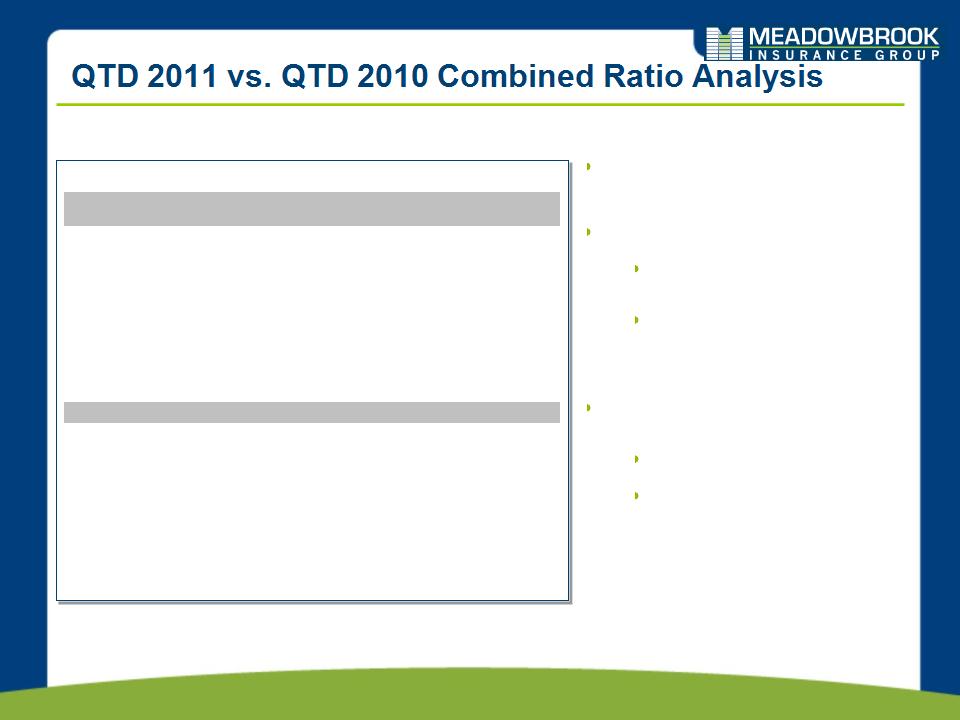
Loss and LAE Ratio
The 2011 loss ratio includes 1.9 points of favorable
development compared to 6.4 points of favorable
development in 2010.
development compared to 6.4 points of favorable
development in 2010.
The accident year loss ratio improved to 63.6%
from 64.2%, driven primarily by:
from 64.2%, driven primarily by:
Lower level of losses in 2011 as
compared to 2010 on certain short-tail
lines of business
compared to 2010 on certain short-tail
lines of business
Anticipated benefit of rate and
underwriting actions effectuated in 2010
underwriting actions effectuated in 2010
Expense Ratio
The 2011 expense ratio decreased 0.6 points in
comparison to the same 2010 period. The
decrease was primarily driven by:
comparison to the same 2010 period. The
decrease was primarily driven by:
Decrease in insurance related
assessments
assessments
Continued leveraging of fixed costs over
a larger premium base
a larger premium base
(in thousands, except ratios)
|
Calendar Year Ratios
|
3 months
ended 2010 |
3 months
ended 2011 |
|
|
Net Earned Premium
|
$ 151,441
|
$ 170,658
|
|
|
Net Loss and Loss Adjustment Expense
|
(87,480)
|
(105,262)
|
|
|
GAAP Net Loss and LAE Ratio
|
57.8%
|
61.7%
|
|
|
|
|
|
|
|
Policy Acquisition and Other Underwriting Expenses
|
(51,879)
|
(57,438)
|
|
|
GAAP Expense Ratio
|
34.3%
|
33.7%
|
|
|
|
|
|
|
|
GAAP Combined Ratio
|
92.1%
|
95.4%
|
|
|
|
|
|
|
|
Accident Year Ratios
|
|
|
|
|
Calendar Year GAAP Net Loss and LAE Ratio
|
57.8%
|
61.7%
|
|
|
Favorable Prior Year Development
|
$9,707
|
$3,231
|
|
|
Impact of Favorable Prior Year Development
|
6.4%
|
1.9%
|
|
|
Accident Year Loss Ratio
|
64.2%
|
63.6%
|
|
|
|
|
|
|
|
GAAP Expense Ratio
|
34.3%
|
33.7%
|
|
|
|
|
|
|
|
Accident Year Combined Ratio
|
98.5%
|
97.3%
|
|
|
|
|
|
|

5
ROE Components
We have generated predictable earnings over the past two years, meeting our target
ROAE range of 10% - 17%.
ROAE range of 10% - 17%.
*2011 figures are annualized for comparative purposes

6
ROAE & Combined Ratio Illustration
2010 - ROAE of 11.4%, Combined Ratio of 95.0% and Investment Yield of 4.2%
2011 - Annualized ROAE of 10.9%, QTD Combined Ratio of 95.4% and Investment
Yield of 4.2% as of 3/31
Yield of 4.2% as of 3/31
2010 A
We strive to deliver predictable earnings across the market cycle with a return on average
equity target of 10% - 17%.
equity target of 10% - 17%.

7
Investment Portfolio Appendix

8
We Maintain a High Quality, Low Risk Investment Portfolio
We maintain a conservative investment portfolio
Portfolio Allocation and Quality
Allocation based on market value
Low equity risk exposure
– 98% fixed income and cash
– 2% equity
High credit quality
– 98% of bonds are investment grade
– Average S&P rating of AA / Moody’s
of Aa2
of Aa2
The effective duration of our $1.3 billion
portfolio is 5.1 years
portfolio is 5.1 years
The duration on net reserves of $802
million is approximately 3.4 years
million is approximately 3.4 years
NOTE: Data above as of March 31, 2011

9
Municipal Bonds—March 31, 2011 Profile
State Profile
Municipals v. Entire Portfolio
Quality Indicators
$545 million market value; 43% of the
investment portfolio
investment portfolio
March 31, 2011 net unrealized gain was
$19.2M
$19.2M
Tax exempt unrealized gain $18.8M
Taxable unrealized gain $ 0.4M
Average tax equivalent yield: 5.52%
FMV as a % of BV is 103.7% as of March 31,
2011
2011
Summary Profile
Credit Enhancements*
Based on market value

10
Structured Securities—March 31, 2011 Profile
$246 million market value; 19% of the managed
portfolio
portfolio
March 31, 2011 unrealized gain was $11.7M
RMBS unrealized gain $ 9.9M
CMBS unrealized gain $ 0.7M
ABS unrealized gain $ 1.1M
Average investment yield: 5.10%
Quality Indicators
Structured Profile
Summary Profile

11
Corporate Fixed Income—March 31, 2011 Profile
Quality Indicators
$433 million market value; 34% of the
investment portfolio
investment portfolio
March 31, 2011 unrealized gain was
$17.7M.
$17.7M.
Average investment yield: 4.43%
Summary Profile
Corporate’s v. Entire Portfolio
Corporate’s Profile

12
Government and Agency—March 31, 2011 Profile
$24 million market value; approximately
2% of the managed portfolio
2% of the managed portfolio
100% rated AAA
March 31, 2011 unrealized gain was $1.0
million
million
Average investment yield: 3.26%
Government and Agency v. Entire Portfolio
Summary Profile
Government v. Agency

13
Equities—March 31, 2011 Profile
Equity Mix Profile
Equities v. Entire Portfolio
Top 5 Equity Holdings
$29 million market value; 2% of the managed
portfolio
portfolio
March 31, 2011 unrealized gain was $3.5M
Preferred stock unrealized gain $2.4M
Bond mutual fund unrealized gain $1.1M
Average tax equivalent yield: 7.66%
Summary Profile