Attached files
| file | filename |
|---|---|
| 8-K - FORM 8-K - Cogdell Spencer Inc. | c16598e8vk.htm |
| EX-99.1 - EXHIBIT 99.1 - Cogdell Spencer Inc. | c16598exv99w1.htm |
Exhibit 99.2
TABLE OF CONTENTS
1. Investor Information |
1 | |||
2. Summary |
2 | |||
3. Capitalization |
3 | |||
4. Condensed Consolidated Balance Sheets |
4 | |||
5. Condensed Consolidated Statements of Operations |
5 | |||
6. Business Segment Reporting |
6 | |||
7. Reconciliation of Net Income (Loss) to FFO and FFOM |
7 | |||
8. Coverage Ratios |
8 | |||
9. Reconciliation of Earnings to EBITDA |
9 | |||
10. Consolidated Debt Analysis |
10 | |||
11. Property Summary |
14 | |||
12. Property Listing |
15 | |||
13. Property Occupancy Rates |
18 | |||
14. Tenant Lease Expirations |
21 | |||
15. Ten Largest Tenants |
22 | |||
16. Ground & Air Rights Leases |
23 | |||
17. Pipeline |
24 | |||
18. Inter-company Profit Elimination Example |
25 | |||
19. Acquisitions, Completed Developments, & Properties in Lease-up |
26 | |||
20. Development Construction and Capital Expenditures |
27 | |||

INVESTOR
INFORMATION
INFORMATION
Board of Directors
James W. Cogdell
|
Raymond W. Braun | |
| Chairman | President & CEO | |
| John R. Georgius | Richard B. Jennings | |
| Christopher E. Lee | David J. Lubar | |
| Richard C. Neugent | Scott A. Ransom | |
| Randolph D. Smoak, Jr. M.D. |
Executive Management
| Raymond W. Braun | Brian L. Happ | Rex A. Noble | ||
| Chief Executive Officer & President | Executive VP & Chief Operating Officer | Executive VP Portfolio Management | ||
| Charles M. Handy | Andrea L. Hopkins | Sal G. Parente | ||
| Executive VP & Chief Financial Officer | VP Human Resources | Executive VP Business Development |
Equity Research Coverage
| BMO Capital Markets | Jefferies & Co. | Raymond James & Associates | ||
| Richard Anderson — 212.885.4180 | Tayo Okusanya — 212.336.7076 | Paul Puryear — 727.567.2253 | ||
| Janney Montgomery Scott | KeyBanc Capital Markets | SmithBarney Citigroup | ||
| Dan Donlan — 215.665.6476 | Karin Ford — 917.368.2293 | Quentin Velleley — 212.816.6981 |
Company Information
| Corporate Headquarters | Trading Symbol | Transfer Agent | ||
| 4401 Barclay Downs, Drive Suite 300 | CSA | Continental Stock Transfer & | ||
| Charlotte, NC 28209 | Trust Company | |||
| Tel: 704.940.2900 | Stock Exchange Listing | |||
| Fax: 704.940.2959 | New York Stock Exchange | Investor Relations | ||
| www.cogdell.com | Jaime Buell — 704.940.2929 |
This supplemental operating and financial data package contains forward-looking
statements within the meaning of the Private Securities Litigation Reform Act of 1995. The
forward-looking statements reflect our views about future events and are subject to risks,
uncertainties, assumptions and changes in circumstances that may cause actual results to differ
materially. Factors that may contribute to these differences include, but are not limited to the
following: our business strategy; our ability to comply with financial covenants in our debt
instruments; our ability to obtain future financing arrangements; estimates relating to our future
distributions; our understanding of our competition; our ability to renew our ground leases;
changes in the reimbursement available to our tenants by government or private payors; our tenants’
ability to make rent payments; defaults by tenants; customers’ access to financing; delays in
project starts and cancellations by customers; market trends; and projected capital expenditures.
For a further list and description of such risks and uncertainties, see our reports filed with the
Securities and Exchange Commission, including our Form 10-K for the year ended December 31, 2009
and our Quarterly Report on Form 10-Q for the quarter ended June 30, 2010. Although we believe the
expectations reflected in such forward-looking statements are based on reasonable assumptions, we
can give no assurance that our expectations will be realized. We disclaim any intention or
obligation to update or revise any forward-looking statements, whether as a result of new
information, future events or otherwise.

1
SUMMARY
| For 3 Months Ended | ||||||||
| (in thousands, except per share amounts and portfolio statistics) | March 31, 2011 | March 31, 2010 | ||||||
Revenue |
$ | 39,144 | $ | 57,602 | ||||
EBITDA(1) |
10,822 | 19,144 | ||||||
Net income (loss) attributable to Cogdell Spencer Inc. common shareholders |
(3,130 | ) | 3,286 | |||||
Net income (loss) per share attributable to Cogdell Spencer Inc. common shareholders |
$ | (0.06 | ) | $ | 0.08 | |||
FFOM attributable to common shareholders and operating partnership unitholders(2) |
$ | 3,574 | $ | 11,149 | ||||
Per share and operating partnership unit data: |
||||||||
FFOM attributable to common shareholders and operating partnership unitholders(2) |
$ | 0.06 | $ | 0.22 | ||||
Debt / Gross Assets(3) |
45 | % | 45 | % | ||||
Portfolio statistics: |
||||||||
Number of properties |
67 | 64 | ||||||
Total square footage |
3,730,242 | 3,527,139 | ||||||
|
 |
| (1) | For a definition and discussion and a quantitative reconciliation of the differences
between EBITDA and net income (loss), see page 9. |
|
| (2) | For a definition, discussion, and a quantitative reconciliation of the differences between
FFOM and net income (loss), see page 7. For a detailed listing of non-recurring events and
impairment charges, see FFO reconciliation on page 7. |
|
| (3) | Gross Assets represents total assets before accumulated depreciation and amortization. |
|
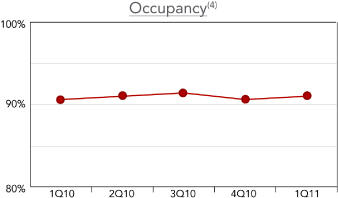
| (4) | In service, consolidated properties. |

2
CAPITALIZATION
(in thousands, except per share amounts)
| March 31, 2011 | ||||||||||||
| Shares/Units | Share Price | Value | ||||||||||
Common Stock |
51,042 | $ | 5.94 | $ | 303,189 | |||||||
Common Operating Partnership Units |
7,417 | 5.94 | 44,057 | |||||||||
Preferred Stock |
2,940 | 24.68 | 72,559 | |||||||||
Equity value |
419,805 | |||||||||||
Consolidated debt |
374,419 | |||||||||||
Market capitalization |
$ | 794,224 | ||||||||||

3
CONDENSED CONSOLIDATED
BALANCE SHEETS
BALANCE SHEETS
(in thousands)
(unaudited)
(unaudited)
| March 31, 2011 | Dec. 31, 2010 | Sept. 30, 2010 | June 30, 2010 | March 31, 2010 | ||||||||||||||||
Assets |
||||||||||||||||||||
Real estate properties: |
||||||||||||||||||||
Operating real estate properties |
$ | 641,712 | $ | 634,291 | $ | 632,844 | $ | 616,154 | $ | 582,050 | ||||||||||
Less: Accumulated depreciation |
(125,610 | ) | (119,141 | ) | (112,581 | ) | (106,004 | ) | (99,544 | ) | ||||||||||
Total real estate properties, net |
516,102 | 515,150 | 520,263 | 510,150 | 482,506 | |||||||||||||||
Construction in process |
29,985 | 22,243 | 15,120 | 7,951 | 29,401 | |||||||||||||||
Total real estate properties, net |
546,087 | 537,393 | 535,383 | 518,101 | 511,907 | |||||||||||||||
Cash and cash equivalents |
17,235 | 12,203 | 16,028 | 31,196 | 18,544 | |||||||||||||||
Restricted cash |
6,784 | 6,794 | 11,649 | 7,888 | 3,215 | |||||||||||||||
Tenant and accounts receivable, net |
10,247 | 11,383 | 9,656 | 8,070 | 11,502 | |||||||||||||||
Goodwill |
22,882 | 22,882 | 102,195 | 102,195 | 108,683 | |||||||||||||||
Trade names and trademarks |
— | — | 34,093 | 34,093 | 41,240 | |||||||||||||||
Intangible assets, net |
18,418 | 18,601 | 20,025 | 18,670 | 20,185 | |||||||||||||||
Other assets |
28,162 | 23,684 | 23,642 | 24,018 | 24,724 | |||||||||||||||
Other assets — held for sale |
— | — | — | — | 2,243 | |||||||||||||||
Total assets |
$ | 649,815 | $ | 632,940 | $ | 752,671 | $ | 744,231 | $ | 742,243 | ||||||||||
Liabilities and Equity |
||||||||||||||||||||
Mortgage notes payable |
$ | 319,419 | $ | 317,303 | $ | 296,701 | $ | 291,199 | $ | 286,295 | ||||||||||
Revolving credit facility |
55,000 | 45,000 | 65,000 | 55,000 | 80,000 | |||||||||||||||
Term Loan |
— | — | 50,000 | 50,000 | 50,000 | |||||||||||||||
Accounts payable |
11,628 | 11,368 | 11,814 | 11,081 | 9,838 | |||||||||||||||
Billings in excess of costs and estimated earnings on uncompleted contracts |
2,314 | 1,930 | 2,145 | 4,657 | 5,353 | |||||||||||||||
Deferred income taxes |
— | — | 11,406 | 13,543 | 15,688 | |||||||||||||||
Other liabilities |
43,558 | 39,819 | 51,991 | 48,123 | 47,879 | |||||||||||||||
Other liabilities — held for sale |
— | — | — | — | 2,206 | |||||||||||||||
Total liabilities |
431,919 | 415,420 | 489,057 | 473,603 | 497,259 | |||||||||||||||
Commitments and contingencies |
||||||||||||||||||||
Equity: |
||||||||||||||||||||
Cogdell Spencer Inc. stockholders’ equity: |
||||||||||||||||||||
Preferred stock |
73,500 | 65,000 | — | — | — | |||||||||||||||
Common stock |
510 | 509 | 507 | 500 | 428 | |||||||||||||||
Additional paid-in capital |
418,374 | 417,960 | 419,439 | 418,194 | 370,951 | |||||||||||||||
Accumulated other comprehensive loss |
(2,712 | ) | (3,339 | ) | (6,011 | ) | (4,843 | ) | (2,868 | ) | ||||||||||
Accumulated deficit |
(295,981 | ) | (287,798 | ) | (189,219 | ) | (182,332 | ) | (165,314 | ) | ||||||||||
Total Cogdell Spencer Inc. stockholders’ equity |
193,691 | 192,332 | 224,716 | 231,519 | 203,197 | |||||||||||||||
Noncontrolling interests: |
||||||||||||||||||||
Real estate partnerships |
6,772 | 6,452 | 5,660 | 3,810 | 4,437 | |||||||||||||||
Operating partnership |
17,433 | 18,736 | 33,238 | 35,299 | 37,350 | |||||||||||||||
Total noncontrolling interests |
24,205 | 25,188 | 38,898 | 39,109 | 41,787 | |||||||||||||||
Total equity |
217,896 | 217,520 | 263,614 | 270,628 | 244,984 | |||||||||||||||
Total liabilities and equity |
$ | 649,815 | $ | 632,940 | $ | 752,671 | $ | 744,231 | $ | 742,243 | ||||||||||

4
CONDENSED CONSOLIDATED
STATEMENTS OF OPERATIONS
STATEMENTS OF OPERATIONS
(in thousands, except per share amounts)
(unaudited)
(unaudited)
| Three Months Ended | ||||||||||||||||||||
| March 31, 2011 | Dec. 31, 2010 | Sept. 30, 2010 | June 30, 2010 | March 31, 2010 | ||||||||||||||||
Revenues: |
||||||||||||||||||||
Rental revenue |
$ | 23,054 | $ | 22,799 | $ | 22,765 | $ | 20,995 | $ | 21,245 | ||||||||||
Design-Build contract revenue and other sales |
15,241 | 24,850 | 15,734 | 15,236 | 35,436 | |||||||||||||||
Property management and other fees |
775 | 824 | 809 | 761 | 818 | |||||||||||||||
Development management and other income |
74 | 25 | 1 | 17 | 103 | |||||||||||||||
Total revenues |
39,144 | 48,498 | 39,309 | 37,009 | 57,602 | |||||||||||||||
Expenses: |
||||||||||||||||||||
Property operating and management |
9,287 | 8,012 | 9,067 | 8,387 | 8,198 | |||||||||||||||
Design-Build contracts and development management |
13,013 | 22,169 | 13,806 | 11,407 | 24,619 | |||||||||||||||
Selling, general, and administrative |
6,208 | 8,561 | 6,684 | 9,345 | 5,820 | |||||||||||||||
Depreciation and amortization |
7,830 | 8,283 | 8,293 | 8,182 | 8,085 | |||||||||||||||
Impairment charges |
— | 113,406 | — | 13,635 | — | |||||||||||||||
Total expenses |
36,338 | 160,431 | 37,850 | 50,956 | 46,722 | |||||||||||||||
Income (loss) from continuing operations before other income (expense) and
income tax benefit (expense) |
2,806 | (111,933 | ) | 1,459 | (13,947 | ) | 10,880 | |||||||||||||
Other income (expense): |
||||||||||||||||||||
Interest and other income |
178 | 210 | 151 | 134 | 160 | |||||||||||||||
Interest expense |
(4,850 | ) | (5,662 | ) | (5,851 | ) | (5,393 | ) | (5,089 | ) | ||||||||||
Debt extinguishment and interest rate derivative expense |
— | (339 | ) | (7 | ) | (9 | ) | (15 | ) | |||||||||||
Equity in earnings (loss) of unconsolidated partnerships |
8 | 7 | 3 | — | 3 | |||||||||||||||
Total other income (expense) |
(4,664 | ) | (5,784 | ) | (5,704 | ) | (5,268 | ) | (4,941 | ) | ||||||||||
Income (loss) from continuing operations before income tax benefit (expense) |
(1,858 | ) | (117,717 | ) | (4,245 | ) | (19,215 | ) | 5,939 | |||||||||||
Income tax benefit (expense) |
(18 | ) | 10,611 | 2,294 | 5,174 | (1,726 | ) | |||||||||||||
Income (loss) from continuing operations |
(1,876 | ) | (107,106 | ) | (1,951 | ) | (14,041 | ) | 4,213 | |||||||||||
Discontinued operations: |
||||||||||||||||||||
Income (loss) from discontinued operations |
— | — | — | 24 | (18 | ) | ||||||||||||||
Gain on sale of real estate property |
— | — | — | 264 | — | |||||||||||||||
Total discontinued operations |
— | — | — | 288 | (18 | ) | ||||||||||||||
Net income (loss) |
(1,876 | ) | (107,106 | ) | (1,951 | ) | (13,753 | ) | 4,195 | |||||||||||
Net income attributable to the noncontrolling interest in real estate partnerships |
(200 | ) | (171 | ) | (172 | ) | (177 | ) | (311 | ) | ||||||||||
Net (income) loss attributable to the noncontrolling interest in
operating partnership |
508 | 13,970 | 285 | 1,909 | (598 | ) | ||||||||||||||
Dividends on preferred stock |
(1,562 | ) | (208 | ) | — | — | — | |||||||||||||
Net income (loss) available to Cogdell Spencer Inc. common shareholders |
$ | (3,130 | ) | $ | (93,515 | ) | $ | (1,838 | ) | $ | (12,021 | ) | $ | 3,286 | ||||||
Per share data — basic and diluted: |
||||||||||||||||||||
Income (loss) from continuing operations attributable to Cogdell Spencer Inc.
common shareholders |
$ | (0.06 | ) | $ | (1.84 | ) | $ | (0.04 | ) | $ | (0.27 | ) | $ | 0.08 | ||||||
Income (loss) from discontinued operations attributable to Cogdell Spencer Inc.
common shareholders |
— | — | — | 0.01 | — | |||||||||||||||
Net income (loss) per share available to Cogdell Spencer Inc. common
shareholders |
$ | (0.06 | ) | $ | (1.84 | ) | $ | (0.04 | ) | $ | (0.26 | ) | $ | 0.08 | ||||||
Weighted average common shares — basic and diluted |
51,009 | 50,745 | 50,083 | 46,111 | 42,768 | |||||||||||||||
Net income (loss) available to Cogdell Spencer Inc. common shareholders: |
||||||||||||||||||||
Continuing operations, net of tax |
$ | (3,130 | ) | $ | (93,515 | ) | $ | (1,838 | ) | $ | (12,267 | ) | $ | 3,301 | ||||||
Discontinued operations |
— | — | — | 246 | (15 | ) | ||||||||||||||
Net income (loss) available to Cogdell Spencer Inc. common shareholders |
$ | (3,130 | ) | $ | (93,515 | ) | $ | (1,838 | ) | $ | (12,021 | ) | $ | 3,286 | ||||||

5
BUSINESS SEGMENT
REPORTING
REPORTING
(in thousands)
(unaudited)
(unaudited)
| Design-Build | ||||||||||||||||||||
| Property | and | Intersegment | Unallocated | |||||||||||||||||
| Three months ended March 31, 2011 | Operations | Development | Eliminations | and Other | Total | |||||||||||||||
Revenues: |
||||||||||||||||||||
Rental revenue |
$ | 23,054 | $ | — | $ | — | $ | — | $ | 23,054 | ||||||||||
Design-Build contract revenue and other sales |
— | 23,784 | (8,543 | ) | — | 15,241 | ||||||||||||||
Property management and other fees |
775 | — | — | — | 775 | |||||||||||||||
Development management and other income |
— | 879 | (805 | ) | — | 74 | ||||||||||||||
Total revenues |
23,829 | 24,663 | (9,348 | ) | — | 39,144 | ||||||||||||||
Certain operating expenses: |
||||||||||||||||||||
Property operating and management |
9,287 | — | — | — | 9,287 | |||||||||||||||
Design-Build contracts and development management |
— | 21,488 | (8,475 | ) | — | 13,013 | ||||||||||||||
Selling, general, and administrative |
— | 3,776 | — | — | 3,776 | |||||||||||||||
Total certain operating expenses |
9,287 | 25,264 | (8,475 | ) | — | 26,076 | ||||||||||||||
| 14,542 | (601 | ) | (873 | ) | — | 13,068 | ||||||||||||||
Interest and other income |
164 | 8 | — | 6 | 178 | |||||||||||||||
Corporate general and administrative expenses |
— | — | — | (2,432 | ) | (2,432 | ) | |||||||||||||
Interest expense |
— | — | — | (4,850 | ) | (4,850 | ) | |||||||||||||
Income taxes applicable to funds from operations modified |
— | — | — | (18 | ) | (18 | ) | |||||||||||||
Non-real estate related depreciation and amortization |
— | (278 | ) | — | (44 | ) | (322 | ) | ||||||||||||
Earnings
from unconsolidated real estate partnerships, before real estate related depreciation and amortization |
10 | — | — | — | 10 | |||||||||||||||
Noncontrolling interests in real estate partnerships, before real estate related
depreciation and amortization |
(498 | ) | — | — | — | (498 | ) | |||||||||||||
Dividends on preferred stock |
— | — | — | (1,562 | ) | (1,562 | ) | |||||||||||||
Funds from operations modified (FFOM) |
14,218 | (871 | ) | (873 | ) | (8,900 | ) | 3,574 | ||||||||||||
Amortization of intangibles related to purchase accounting |
(42 | ) | (189 | ) | — | — | (231 | ) | ||||||||||||
Funds from operations (FFO) |
14,176 | (1,060 | ) | (873 | ) | (8,900 | ) | 3,343 | ||||||||||||
Real estate related depreciation and amortization |
(7,279 | ) | — | — | — | (7,279 | ) | |||||||||||||
Noncontrolling interests in real estate partnerships, before real estate related
depreciation and amortization |
498 | — | — | — | 498 | |||||||||||||||
Dividends on preferred stock |
— | — | — | 1,562 | 1,562 | |||||||||||||||
Net income (loss) |
$ | 7,395 | $ | (1,060 | ) | $ | (873 | ) | $ | (7,338 | ) | $ | (1,876 | ) | ||||||

6
RECONCILIATION OF
NET INCOME (LOSS)
NET INCOME (LOSS)
to Funds from Operations and
Funds from Operations Modified(1)
Funds from Operations Modified(1)
(in thousands, except per share and unit amounts)
(unaudited)
(unaudited)
| Three Months Ended | ||||||||||||||||||||
| March 31, 2011 | Dec. 31, 2010 | Sept. 30, 2010 | June 30, 2010 | March 31, 2010 | ||||||||||||||||
Net income (loss) |
$ | (1,876 | ) | $ | (107,106 | ) | $ | (1,951 | ) | $ | (13,753 | ) | $ | 4,195 | ||||||
Add: |
||||||||||||||||||||
Real estate related depreciation and amortization(2): |
||||||||||||||||||||
Wholly-owned and consolidated properties, including amounts in
discontinued operations |
7,277 | 7,327 | 7,372 | 7,272 | 7,194 | |||||||||||||||
Unconsolidated real estate partnerships |
2 | 3 | 3 | 3 | 3 | |||||||||||||||
Less: |
||||||||||||||||||||
Noncontrolling interests in real estate partnerships, before real estate
related depreciation and amortization |
(498 | ) | (472 | ) | (476 | ) | (479 | ) | (616 | ) | ||||||||||
Dividends on preferred stock |
(1,562 | ) | (208 | ) | — | — | — | |||||||||||||
Gain on sale of real estate property |
— | — | — | (264 | ) | — | ||||||||||||||
Funds from Operations (FFO)(1) |
3,343 | (100,456 | ) | 4,948 | (7,221 | ) | 10,776 | |||||||||||||
Amortization
of intangibles related to purchase accounting, net of tax benefit |
231 | 374 | 374 | 374 | 373 | |||||||||||||||
Funds from Operations Modified (FFOM)(1) |
3,574 | (100,082 | ) | 5,322 | (6,847 | ) | 11,149 | |||||||||||||
Non-recurring events and impairment charges: |
||||||||||||||||||||
Intangible asset impairment charges, net of tax benefit |
— | 93,826 | — | 10,848 | — | |||||||||||||||
Tax valuation allowance |
— | 10,553 | — | — | — | |||||||||||||||
Mr. Cogdell’s employment non-renewal compensation expense |
— | 1,493 | — | — | — | |||||||||||||||
Mr. Spencer’s retirement compensation expense, net of income tax benefit |
— | — | — | 2,545 | — | |||||||||||||||
Impact of non-recurring events and impairment charges |
— | 105,872 | — | 13,393 | — | |||||||||||||||
FFOM, excluding non-recurring events and impairment charges |
$ | 3,574 | $ | 5,790 | $ | 5,322 | $ | 6,546 | $ | 11,149 | ||||||||||
FFO per share and unit — basic and diluted |
$ | 0.06 | $ | (1.72 | ) | $ | 0.09 | $ | (0.13 | ) | $ | 0.21 | ||||||||
FFOM per share and unit — basic and diluted |
$ | 0.06 | $ | (1.71 | ) | $ | 0.09 | $ | (0.13 | ) | $ | 0.22 | ||||||||
FFOM per share and unit — basic and diluted, excluding non-recurring events |
$ | 0.06 | $ | 0.10 | $ | 0.09 | $ | 0.12 | $ | 0.22 | ||||||||||
Weighted average shares and units outstanding |
58,438 | 58,389 | 57,849 | 53,913 | 50,559 | |||||||||||||||
| (1) | FFO is a supplemental non-GAAP financial measure used by the real estate industry to
measure the operating performance of real estate companies. FFOM adds back to traditionally
defined FFO non-cash amortization of non-real estate related intangible assets associated with
purchase accounting. We present FFO and FFOM because we consider them important supplemental
measures of operational performance. We believe FFO is frequently used by securities analysts,
investors and other interested parties in the evaluation of REITs, many of which present FFO
when reporting their results. We believe that FFOM allows securities analysts, investors and
other interested parties to evaluate current period results to results prior to the
acquisition of MEA Holdings, Inc. FFO and FFOM are intended to exclude GAAP historical cost
depreciation and amortization of real estate and related assets, which assumes that the value
of real estate assets diminishes ratably over time. Historically, however, real estate values
have risen or fallen with market conditions. Because FFO and FFOM excludes depreciation and
amortization unique to real estate, gains and losses from property dispositions and
extraordinary items, they provide performance measures that, when compared year over year,
reflect the impact to operations from trends in occupancy rates, rental rates, operating
costs, development activities and interest costs, providing a perspective not immediately
apparent from net income. We compute FFO in accordance with standards established by the Board
of Governors of NAREIT in its March 1995 White Paper (as amended in November 1999 and April
2002), which may differ from the methodology for calculating FFO and FFOM utilized by other
equity REITs and, accordingly, may not be comparable to such other REITs. We adjust the NAREIT
definition to add back noncontrolling interests in consolidated real estate partnerships
before real estate related depreciation and amortization and deduct dividends on preferred
stock. Further, FFO and FFOM do not represent amounts available for management’s discretionary
use because of needed capital replacement or expansion, debt service obligations, or other
commitments and uncertainties. FFO and FFOM should not be considered as an alternative to net
income (loss) (computed in accordance with GAAP) as an indicator of our performance, nor are
they indicative of funds available to fund our cash needs, including our ability to pay
dividends or make distributions. |
|
| (2) | Real estate depreciation and amortization consists of depreciation and amortization from
wholly-owned real estate properties and our share of real estate depreciation and amortization
from consolidated and unconsolidated real estate partnerships. |

7
COVERAGE
RATIOS
RATIOS
(in thousands, except ratio amounts)
| Three Months Ended | ||||||||||||||||||||
| March 31, 2011 | Dec. 31, 2010 | Sept. 30, 2010 | June 30, 2010 | March 31, 2010 | ||||||||||||||||
Interest coverage ratio: |
||||||||||||||||||||
EBITDA |
$ | 10,822 | $ | 11,466 | $ | 9,906 | $ | 11,364 | $ | 19,144 | ||||||||||
Cash paid for interest |
4,622 | 5,901 | 5,515 | 5,542 | 5,289 | |||||||||||||||
Interest coverage ratio |
2.34 | 1.94 | 1.80 | 2.05 | 3.62 | |||||||||||||||
Fixed charge coverage ratio: |
||||||||||||||||||||
EBITDA |
$ | 10,822 | $ | 11,466 | $ | 9,906 | $ | 11,364 | $ | 19,144 | ||||||||||
Fixed charges: |
||||||||||||||||||||
Cash paid for interest |
4,622 | 5,901 | 5,515 | 5,542 | 5,289 | |||||||||||||||
Principal payments |
1,258 | 1,111 | 1,096 | 1,019 | 1,031 | |||||||||||||||
Dividends on preferred stock |
1,562 | 208 | — | — | — | |||||||||||||||
Total fixed charges |
$ | 7,442 | $ | 7,220 | $ | 6,611 | $ | 6,561 | $ | 6,320 | ||||||||||
Fixed charge coverage ratio |
1.45 | 1.59 | 1.50 | 1.73 | 3.03 | |||||||||||||||

8
RECONCILIATION OF
EARNINGS
EARNINGS
Before Interest, Taxes, Depreciation,
and Amortization (“EBITDA”)(1)
and Amortization (“EBITDA”)(1)
(in thousands)
| Three Months Ended | ||||||||||||||||||||
| March 31, 2011 | Dec. 31, 2010 | Sept. 30, 2010 | June 30, 2010 | March 31, 2010 | ||||||||||||||||
Reconciliation of net income (loss) to EBITDA: |
||||||||||||||||||||
Net income (loss) |
$ | (1,876 | ) | $ | (107,106 | ) | $ | (1,951 | ) | $ | (13,753 | ) | $ | 4,195 | ||||||
Interest expense |
4,850 | 5,662 | 5,851 | 5,393 | 5,104 | |||||||||||||||
Income tax expense (benefit) |
18 | (10,611 | ) | (2,294 | ) | (5,174 | ) | 1,726 | ||||||||||||
Depreciation and amortization |
7,830 | 8,283 | 8,293 | 8,182 | 8,085 | |||||||||||||||
Impairment charges |
— | 113,406 | — | 13,635 | — | |||||||||||||||
Mr. Cogdell’s retirement compensation expense |
— | 1,493 | — | — | — | |||||||||||||||
Debt extinguishment and interest rate derivative expense |
— | 339 | 7 | 9 | — | |||||||||||||||
Mr. Spencer’s retirement compensation expense |
— | — | — | 3,072 | — | |||||||||||||||
Discontinued operations — interest expense |
— | — | — | — | 34 | |||||||||||||||
EBITDA |
$ | 10,822 | $ | 11,466 | $ | 9,906 | $ | 11,364 | $ | 19,144 | ||||||||||
| (1) | We believe that earnings before interest, income taxes, depreciation and amortization, or
EBITDA, is a useful supplemental performance measure because it allows investors to view our
performance without the impact of noncash depreciation and amortization or the cost of debt or
minority interests. In addition, we believe that EBITDA is frequently used by securities
analysts, investors, and other interested parties in the evaluation of REITs. Because EBITDA
is calculated before recurring cash charges including interest expense and income taxes, and
is not adjusted for capital expenditures or other recurring cash requirements of our business,
its utility as a measure of our performance is limited. Accordingly, EBITDA should be
considered only as a supplement to net loss (computed in accordance with GAAP) as a measure of
financial performance. Other equity REITs may calculate EBITDA differently; accordingly, our
EBITDA may not be comparable to such other equity REITs’ EBITDA. |

9
CONSOLIDATED
DEBT ANALYSIS
DEBT ANALYSIS
as of March 31, 2011
(dollars in thousands)
(dollars in thousands)
| Stated Interest | Interest | Principal | Maturity | Amortization | ||||||||||||||||
| Rate (%) | Rate (%) | Balance | Date | (years) | ||||||||||||||||
Secured mortgage loans — wholly-owned properties: |
||||||||||||||||||||
St. Francis CMOB, St. Francis Professional Medical Center |
LIBOR + 1.85 | 5.17 | (1) | $ | 7,135 | 6/15/2011 | 39 | |||||||||||||
St. Francis Medical Plaza (Greenville), St. Francis Women’s |
LIBOR + 1.85 | 5.17 | (1) | 6,642 | 6/15/2011 | 39 | ||||||||||||||
Beaufort Medical Plaza |
LIBOR + 1.85 | 5.65 | (1) | 4,605 | 8/18/2011 | 39 | ||||||||||||||
Mulberry Medical Park |
6.25 | 6.25 | 845 | 9/15/2011 | 10 | |||||||||||||||
Methodist Professional Center I |
LIBOR + 1.30 | 1.54 | 25,193 | 10/31/2011 | 30 | |||||||||||||||
St. Francis Outpatient Surgery Center |
LIBOR + 3.25 | 3.49 | 13,000 | 11/29/2011 | Interest only | |||||||||||||||
River Hills Medical Plaza |
LIBOR + 3.75 | 5.53 | (1) | 3,445 | 12/22/2011 | 22 | ||||||||||||||
East Jefferson Medical Plaza |
LIBOR + 3.75 | 5.55 | (1) | 11,600 | 1/31/2012 | Interest only | ||||||||||||||
Barclay Downs |
6.50 | 6.50 | 4,252 | 11/15/2012 | 25 | |||||||||||||||
Providence Medical Office Building I, II and III |
6.12 | 6.12 | 8,000 | 1/12/2013 | 25 | |||||||||||||||
One Medical Park |
5.93 | 5.93 | 4,789 | 11/1/2013 | 20 | |||||||||||||||
Three Medical Park |
5.55 | 5.55 | 7,397 | 3/25/2014 | 25 | |||||||||||||||
Medical Arts Center of Orangeburg |
LIBOR + 3.25 | 6.00 | (2) | 2,232 | 5/5/2014 | 20 | ||||||||||||||
Lancaster Rehabilitation Hospital |
6.71 | 6.71 | 9,421 | 6/26/2014 | 25 | |||||||||||||||
Lancaster Rehabilitation Hospital |
6.79 | 6.79 | 2,076 | 6/26/2014 | 25 | |||||||||||||||
Rowan Outpatient Surgery Center |
6.00 | 6.00 | 3,124 | 7/6/2014 | 25 | |||||||||||||||
East Jefferson MOB |
6.01 | 6.01 | 8,672 | 8/10/2014 | 25 | |||||||||||||||
Rocky Mount Kidney Center |
6.75 | 6.75 | 952 | 8/21/2014 | 15 | |||||||||||||||
Randolph Medical Park, Lincoln/Lakemont Family Practice, and
Northcross Family Physicians |
7.00 | 7.00 | 7,254 | 10/15/2014 | 20 | |||||||||||||||
Rocky Mount Medical Park |
LIBOR + 3.50 | 3.74 | (3) | 10,227 | 10/22/2014 | 25 | ||||||||||||||
MRMC MOB I |
7.33 | 7.33 | 5,882 | 11/1/2014 | 25 | |||||||||||||||
HealthPartners Medical & Dental Clinics |
LIBOR + 3.25 | 6.80 | (1) | 11,991 | 11/1/2014 | 22.5 | ||||||||||||||
Copperfield Medical Mall, Harrisburg Medical Mall,
Midland Medical Park
and Weddington & Internal/Pediatric Medicine |
LIBOR + 1.50 | 3.25 | (5) | 7,951 | 12/15/2014 | 25 | ||||||||||||||
Good Sam Medical Office Building |
7.50 | 7.50 | 1,117 | 6/30/2015 | 25 | |||||||||||||||
Peerless Crossing Medical Center |
6.06 | 6.06 | 7,225 | 9/1/2016 | 30 | |||||||||||||||
Palmetto Health Parkridge |
5.68 | 5.68 | 13,500 | 6/1/2017 | Interest only | (6) | ||||||||||||||
Central NY Medical Center |
6.22 | 6.22 | 24,500 | 7/1/2017 | Interest only | |||||||||||||||
Summit Professional Plaza I and II |
6.18 | 6.18 | 15,925 | 9/1/2017 | Interest only | |||||||||||||||
Medical Center Physicians Tower |
LIBOR + 2.50 | 6.19 | (1) | 14,644 | 3/1/2019 | 25 | ||||||||||||||
University Physicians — Grants Ferry |
LIBOR + 2.25 | 5.95 | (1) | 10,361 | 4/20/2019 | 25 | ||||||||||||||
Roper Medical Office Building |
7.10 | 7.10 | 9,243 | 6/1/2019 | 25 | |||||||||||||||
Health Park Medical Office Building |
7.50 | 7.50 | 6,875 | 12/1/2019 | 25 | |||||||||||||||
Total / weighted average mortgages — wholly-owned properties |
5.31 | 270,075 | ||||||||||||||||||
| (1) | Represents the fixed rate for floating rate loans that have been swapped to fixed. |
|
| (2) | Minimum interest of 6.00%. |
|
| (3) | Maximum interest of 6.50%. |
|
| (4) | Interest only during construction period. |
|
| (5) | Maximum interest of 8.25%; minimum interest of 3.25%. |
|
| (6) | Interest only through June 2012. Principal and interest payments from July 2012 through June
2017. |
|
| (7) | We have entered into a forward starting interest rate swap agreement that effectively fixes
the interest rate 6.44% beginning |

10
CONSOLIDATED
DEBT ANALYSIS
DEBT ANALYSIS
as of March 31, 2011
(continued)
(dollars in thousands)
(continued)
(dollars in thousands)
| Stated Interest | Interest | Principal | Maturity | Amortization | ||||||||||||||||
| Rate (%) | Rate (%) | Balance | Date | (years) | ||||||||||||||||
Secured revolving credit facility: |
||||||||||||||||||||
Tranche I |
LIBOR + 3.00 | 3.24 | 55,000 | 3/1/2014 | Interest only | |||||||||||||||
Total / weighted average secured revolving credit facility |
3.24 | 55,000 | ||||||||||||||||||
Consolidated real estate partnerships: |
||||||||||||||||||||
Alamance Regional Mebane Outpatient Center |
LIBOR + 1.30 | 1.54 | 10,817 | 5/1/2011 | 30 | |||||||||||||||
Alamance Regional Mebane Outpatient Center |
LIBOR + 4.00 | 4.24 | 1,470 | 5/1/2011 | Interest only | |||||||||||||||
Lancaster ASC MOB |
LIBOR + 1.20 | 5.23 | (1) | 10,152 | 3/2/2015 | 25 | ||||||||||||||
English Road Medical Center |
4.99 | 4.99 | 5,134 | 4/1/2016 | 25 | |||||||||||||||
Woodlands Center for Specialized Medicine |
LIBOR + 1.50 | 6.21 | (1) | 16,533 | 9/26/2018 | 25 | ||||||||||||||
Bonney Lake Medical Office Building |
LIBOR + 3.25 | 3.49 | (7) | 5,182 | 2/5/2019 | 25 | (4) | |||||||||||||
Total / weighted average consolidated real estate partnerships |
4.51 | 49,288 | ||||||||||||||||||
Total / weighted average debt |
374,363 | |||||||||||||||||||
Unamortized premium |
56 | |||||||||||||||||||
Total / weighted average debt |
4.90 | $ | 374,419 | |||||||||||||||||
| (1) | Represents the fixed rate for floating rate loans that have been swapped to fixed. |
|
| (2) | Minimum interest of 6.00%. |
|
| (3) | Maximum interest of 6.50%. |
|
| (4) | Interest only during construction period. |
|
| (5) | Maximum interest of 8.25%; minimum interest of 3.25%. |
|
| (6) | Interest only through June 2012. Principal and interest payments from July 2012 through June
2017. |
|
| (7) | The Company has entered into a forward starting interest rate swap agreement that effectively
fixes the interest rate 6.44% beginning October 2011, when the
construction phase of the loan expires and converts to an amortizing loan. |

11
CONSOLIDATED
DEBT ANALYSIS
DEBT ANALYSIS
as of March 31, 2011
(continued)
(continued)
| Future Scheduled Repayments | ||||||||||||||||||||
| Weighted | ||||||||||||||||||||
| Average | ||||||||||||||||||||
| Interest Rate on | ||||||||||||||||||||
| Percent of Total | Maturing | |||||||||||||||||||
| Year | Amortization | Maturities | Total | Mortgages | Debt(1) | |||||||||||||||
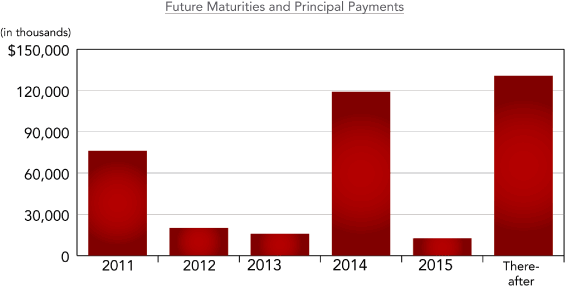
2011 |
3,320 | 72,852 | 76,172 | 24 | % | 3.0 | % | |||||||||||||
2012 |
4,347 | 15,678 | 20,025 | 6 | % | 5.8 | % | |||||||||||||
2013 |
4,295 | 11,577 | 15,872 | 5 | % | 6.0 | % | |||||||||||||
2014 |
3,518 | 60,609 | 64,127 | 20 | % | 5.3 | % | |||||||||||||
2015 |
2,140 | 10,350 | 12,490 | 4 | % | 5.5 | % | |||||||||||||
Thereafter |
5,524 | 125,151 | 130,675 | 41 | % | 6.1 | % | |||||||||||||
Total mortgages |
$ | 23,144 | $ | 296,217 | $ | 319,361 | 100 | % | 5.2 | % | ||||||||||
Secured revolving credit facility (March 2014 maturity) |
— | 55,000 | 55,000 | 3.2 | % | |||||||||||||||
Total |
$ | 23,144 | $ | 351,217 | $ | 374,361 | 4.9 | % | ||||||||||||
| (1) | Includes the fixed rate swapped interest rates. |
|
| (2) | For covenant definitions and a listing of non-financial debt covenants, please refer to our
filings with the Securities and Exchange Commission. |

12
CONSOLIDATED
DEBT ANALYSIS
DEBT ANALYSIS
as of March 31, 2011
(continued)
(continued)
| Weighted Average | ||||||||||||||||
| Debt Profile | Balance | Percent of Total | Interest Rate(1) | Maturity (Years) | ||||||||||||
Fixed rate mortgages — wholly-owned properties |
$ | 221,655 | 59 | % | 6.1 | % | 4.5 | |||||||||
Variable rate mortgages — wholly-owned properties |
48,420 | 13 | % | 1.7 | % | 1.2 | ||||||||||
Secured revolving credit facility |
55,000 | 15 | % | 3.2 | % | 2.9 | ||||||||||
Mortgages — consolidated real estate partnerships |
49,288 | 13 | % | 4.5 | % | 4.7 | ||||||||||
Total |
$ | 374,363 | 100 | % | 4.9 | % | 3.9 | |||||||||
Secured revolving credit facility — matures March 2014 |
||||||||||||||||
Facility |
$ | 200,000 | ||||||||||||||
Borrowing base availability |
$ | 122,766 | ||||||||||||||
Less: Outstanding |
(55,000 | ) | ||||||||||||||
Less: Letters of credit |
(8,128 | ) | ||||||||||||||
Availability |
$ | 59,638 | ||||||||||||||
Capitalized interest 1Q 2011 |
$ | 163 | ||||||||||||||
| Current | ||||||||||||
| Covenant summary | Required | Quarter | In Compliance | |||||||||
Secured revolving credit facility(2): |
||||||||||||
Maximum total leverage ratio |
< 65 | % | 49 | % | Yes | |||||||
Maximum secured recourse indebtedness ratio |
< 20 | % | 5 | % | Yes | |||||||
Minimum fixed charge coverage ratio |
> 1.35 | x | 1.62 | x | Yes | |||||||
Minimum required tangible net worth |
>$ | 237,106 | $ | 295,434 | Yes | |||||||
Minimum facility interest coverage |
> 1.50 | x | 12.61 | x | Yes | |||||||
| (1) | Includes the fixed rate swapped interest rates. |
|
| (2) | For covenant definitions and a listing of non-financial debt covenants, please refer to our
filings with the Securities and Exchange Commission. |

13
PROPERTY
SUMMARY
SUMMARY
(dollars and square feet in thousands)
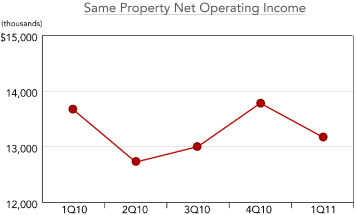
| Same Property Operating Results | ||||||||||||||||||||
| As of and for Quarter Ended | As of and for Year Ended | |||||||||||||||||||
| March 31, 2011 | Dec. 31, 2010 | March 31, 2010 | March 31, 2011 | March 31, 2010 | ||||||||||||||||
Property count |
62 | 62 | 62 | 62 | 62 | |||||||||||||||
Square feet |
3,386 | 3,386 | 3,386 | 3,386 | 3,386 | |||||||||||||||
Occupancy |
90.6 | % | 90.2 | % | 90.6 | % | 90.6 | % | 90.6 | % | ||||||||||
Rental revenue |
$ | 21,131 | $ | 21,198 | $ | 21,339 | $ | 84,200 | $ | 82,448 | ||||||||||
Costs related to property operations |
(7,954 | ) | (7,413 | ) | (7,672 | ) | (31,506 | ) | (30,070 | ) | ||||||||||
Net operating income |
13,177 | 13,785 | 13,667 | 52,694 | 52,378 | |||||||||||||||
Straight line rent |
(401 | ) | (369 | ) | (216 | ) | (1,246 | ) | (654 | ) | ||||||||||
Fair value of lease revenues(1) |
(100 | ) | (104 | ) | (122 | ) | (416 | ) | (534 | ) | ||||||||||
Adjusted net operating income |
$ | 12,676 | $ | 13,312 | $ | 13,329 | $ | 51,032 | $ | 51,190 | ||||||||||
| Total Property Operating Results | ||||||||||||||||||||
| As of and for Quarter Ended | As of and for Year Ended | |||||||||||||||||||
| March 31, 2011 | Dec. 31, 2010 | March 31, 2010 | March 31, 2011 | March 31, 2010 | ||||||||||||||||
Property count |
67 | 66 | 64 | 67 | 64 | |||||||||||||||
Square feet |
3,730 | 3,676 | 3,527 | 3,730 | 3,527 | |||||||||||||||
Occupancy |
90.3 | % | 90.2 | % | 89.6 | % | 90.3 | % | 89.6 | % | ||||||||||
Rental revenue |
$ | 23,054 | $ | 22,799 | $ | 21,245 | $ | 89,613 | $ | 81,154 | ||||||||||
Property management and other fees |
775 | 824 | 818 | 3,169 | 3,304 | |||||||||||||||
Costs related to property operations |
(9,287 | ) | (8,012 | ) | (8,198 | ) | (34,753 | ) | (32,142 | ) | ||||||||||
Net operating income |
14,542 | 15,611 | 13,865 | 58,029 | 52,316 | |||||||||||||||
Straight line rent |
(466 | ) | (430 | ) | (221 | ) | (1,450 | ) | (659 | ) | ||||||||||
Fair value of lease revenues(1) |
(107 | ) | (99 | ) | (122 | ) | (415 | ) | (534 | ) | ||||||||||
Adjusted net operating income |
$ | 13,969 | $ | 15,082 | $ | 13,522 | $ | 56,164 | $ | 51,123 | ||||||||||
| (1) | Represents the net adjustment for above and below market leases which are being amortized
over the remaining term of the respective lease from the date of the acquisition. |

14
PROPERTY
LISTING
LISTING
as of March 31, 2011
| Annualized | ||||||||||||||||||||||
| Rent Per | ||||||||||||||||||||||
| Net Rentable | Occupancy | Annualized | Leased | |||||||||||||||||||
| Location | Ownership | Square Feet | Rate | Rent | Square Foot | |||||||||||||||||
California |
||||||||||||||||||||||
Verdugo Hills Professional Bldg I |
Glendale | 100.0 | % | 64,056 | 91.2 | % | $ | 1,929,628 | $ | 33.02 | ||||||||||||
Verdugo Hills Professional Bldg II |
Glendale | 100.0 | % | 42,906 | 99.5 | % | 1,478,539 | 34.63 | ||||||||||||||
| 106,962 | 94.6 | % | 3,408,167 | 33.70 | ||||||||||||||||||
Florida |
||||||||||||||||||||||
Woodlands Center for Specialized Medicine |
Pensacola | 40.0 | % | 75,985 | 100.0 | % | 2,544,183 | 33.48 | ||||||||||||||
Georgia |
||||||||||||||||||||||
Augusta POB I |
Augusta | 100.0 | % | 99,494 | 97.2 | % | 1,413,329 | 14.62 | ||||||||||||||
Augusta POB II |
Augusta | 100.0 | % | 125,634 | 86.1 | % | 2,266,583 | 20.96 | ||||||||||||||
Augusta POB III |
Augusta | 100.0 | % | 47,034 | 90.0 | % | 876,121 | 20.70 | ||||||||||||||
Augusta POB IV |
Augusta | 100.0 | % | 55,134 | 83.1 | % | 915,737 | 19.98 | ||||||||||||||
Summit Professional Plaza I |
Brunswick | 100.0 | % | 33,039 | 93.5 | % | 861,471 | 27.89 | ||||||||||||||
Summit Professional Plaza II |
Brunswick | 100.0 | % | 64,233 | 96.7 | % | 1,779,432 | 28.63 | ||||||||||||||
| 424,568 | 90.9 | % | 8,112,673 | 21.01 | ||||||||||||||||||
Indiana |
||||||||||||||||||||||
Methodist Professional
Center I(1) |
Indianapolis | 100.0 | % | 150,385 | 96.4 | % | 3,533,365 | 24.37 | ||||||||||||||
Methodist Professional
Center II (sub-lease) |
Indianapolis | 100.0 | % | 24,080 | 100.0 | % | 679,892 | 28.23 | ||||||||||||||
| 174,465 | 96.9 | % | 4,213,257 | 24.92 | ||||||||||||||||||
Kentucky |
||||||||||||||||||||||
OLBH Same Day Surgery Center and MOB |
Ashland | 100.0 | % | 46,907 | 91.8 | % | 949,707 | 22.05 | ||||||||||||||
OLBH Parking Garage |
880,000 | |||||||||||||||||||||
| 46,907 | 91.8 | % | 1,829,707 | 22.05 | (2) | |||||||||||||||||
Louisiana |
||||||||||||||||||||||
East Jefferson MOB |
Metairie | 100.0 | % | 119,921 | 99.1 | % | 2,585,312 | 21.75 | ||||||||||||||
East Jefferson Medical Plaza |
Metairie | 100.0 | % | 123,184 | 100.0 | % | 2,894,004 | 23.49 | ||||||||||||||
East Jefferson MRI |
Metairie | 100.0 | % | 10,809 | 100.0 | % | 1,005,991 | 93.07 | ||||||||||||||
| 253,914 | 99.6 | % | 6,485,307 | 25.65 | ||||||||||||||||||
Minnesota |
||||||||||||||||||||||
Health Partners Medical & Dental Clinics |
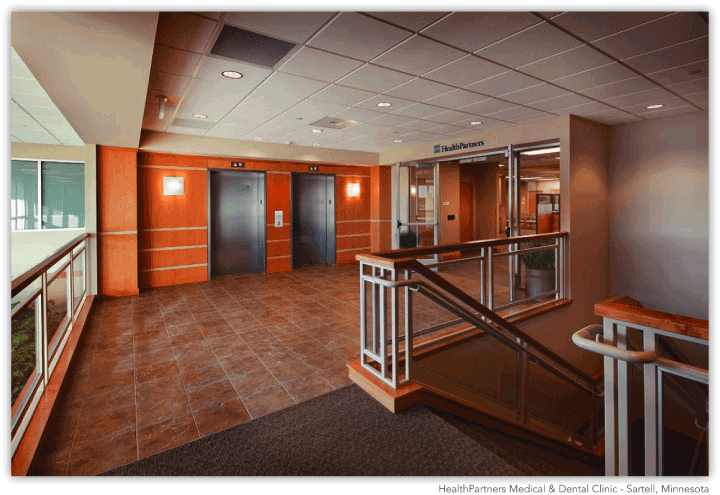
Sartell | 100.0 | % | 60,108 | 94.9 | % | 2,204,260 | 38.63 | ||||||||||||||
Mississippi |
||||||||||||||||||||||
University Physicians — Grants Ferry |
Flowood | 100.0 | % | 50,575 | 100.0 | % | 1,717,816 | 33.97 | ||||||||||||||
New York |
||||||||||||||||||||||
Central NY Medical
Center(3) |
Syracuse | 100.0 | % | 111,634 | 97.8 | % | 2,898,597 | 26.55 | ||||||||||||||
| (1) | Parking revenue from an adjacent parking deck is approximately $90,000 per month, or
$1,080,000 annualized. |
|
| (2) | Excludes annualized rent of adjacent parking decks to OLBH Same Day Surgery Center and MOB
and Gaston Professional Center from calculation. |
|
| (3) | Parking revenue from an adjacent parking
deck is approximately $100,000 per month, or $1,200,000 annualized. |

15
PROPERTY
LISTING
as of March 31,2011
(continued)
LISTING
as of March 31,2011
(continued)
| Annualized | ||||||||||||||||||||||
| Rent Per | ||||||||||||||||||||||
| Net Rentable | Occupancy | Annualized | Leased | |||||||||||||||||||
| Location | Ownership | Square Feet | Rate | Rent | Square Foot | |||||||||||||||||
North Carolina |
||||||||||||||||||||||
Alamance Regional Mebane Outpatient Center |
Mebane | 35.1 | % | 68,206 | 71.1 | % | 1,628,563 | 33.60 | ||||||||||||||
Barclay Downs |
Charlotte | 100.0 | % | 38,395 | 100.0 | % | 683,078 | 17.79 | ||||||||||||||
Birkdale Bldgs C, D, E and Birkdale Wellness |
Huntersville | 100.0 | % | 64,669 | 96.4 | % | 1,371,157 | 22.00 | ||||||||||||||
Birkdale II |
Huntersville | 100.0 | % | 8,269 | 100.0 | % | 204,850 | 24.77 | ||||||||||||||
Copperfield Medical Mall |
Concord | 100.0 | % | 26,000 | 100.0 | % | 634,655 | 24.41 | ||||||||||||||
East Rocky Mount Kidney Center |
Rocky Mount | 100.0 | % | 8,043 | 100.0 | % | 161,232 | 20.05 | ||||||||||||||
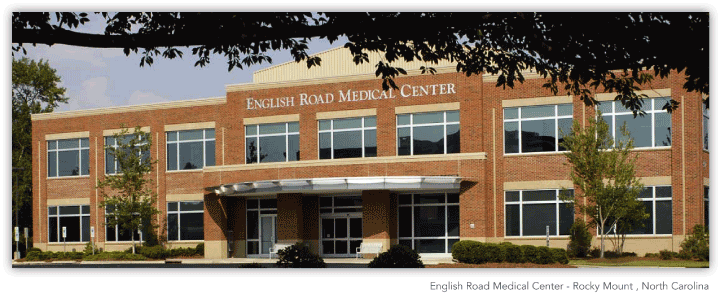
English Road Medical Center |
Rocky Mount | 34.5 | % | 35,393 | 95.7 | % | 960,002 | 28.36 | ||||||||||||||
Gaston Professional & Ambulatory
Surgery Centers |
Gastonia | 100.0 | % | 114,956 | 100.0 | % | 2,770,621 | 24.10 | ||||||||||||||
Gaston Parking |
606,141 | |||||||||||||||||||||
Gateway Medical Office Building |
Concord | 100.0 | % | 61,789 | 69.1 | % | 1,123,454 | 26.30 | ||||||||||||||
Harrisburg Family Physicians |
Harrisburg | 100.0 | % | 8,202 | 100.0 | % | 228,787 | 27.89 | ||||||||||||||
Harrisburg Medical Mall |
Harrisburg | 100.0 | % | 18,360 | 100.0 | % | 514,742 | 28.04 | ||||||||||||||
Lincoln/Lakemont Family Practice |
Lincolnton | 100.0 | % | 16,500 | 100.0 | % | 405,458 | 24.57 | ||||||||||||||
Mallard Crossing Medical Park |
Charlotte | 100.0 | % | 52,540 | 63.8 | % | 836,488 | 24.94 | ||||||||||||||
Medical Arts Building |
Concord | 100.0 | % | 84,972 | 93.3 | % | 1,846,066 | 23.29 | ||||||||||||||
Midland Medical Park |
Midland | 100.0 | % | 14,610 | 100.0 | % | 449,538 | 30.77 | ||||||||||||||
Mulberry Medical Park |
Lenoir | 100.0 | % | 24,992 | 77.6 | % | 421,334 | 21.73 | ||||||||||||||
Northcross Family Physicians |
Charlotte | 100.0 | % | 8,018 | 100.0 | % | 239,186 | 29.83 | ||||||||||||||
Randolph Medical Park |
Charlotte | 100.0 | % | 84,131 | 69.2 | % | 1,295,180 | 22.25 | ||||||||||||||
Rocky Mount Kidney Center |
Rocky Mount | 100.0 | % | 10,105 | 100.0 | % | 202,567 | 20.05 | ||||||||||||||
Rocky Mount Medical Park |
Rocky Mount | 100.0 | % | 96,993 | 100.0 | % | 2,088,260 | 21.53 | ||||||||||||||
Rowan Outpatient Surgery Center |
Salisbury | 100.0 | % | 19,464 | 100.0 | % | 440,139 | 22.61 | ||||||||||||||
Weddington Internal & Pediatric Medicine |
Concord | 100.0 | % | 7,750 | 100.0 | % | 204,204 | 26.35 | ||||||||||||||
| 872,357 | 88.7 | % | 19,315,702 | 24.19 | (2) | |||||||||||||||||
Pennsylvania |
||||||||||||||||||||||
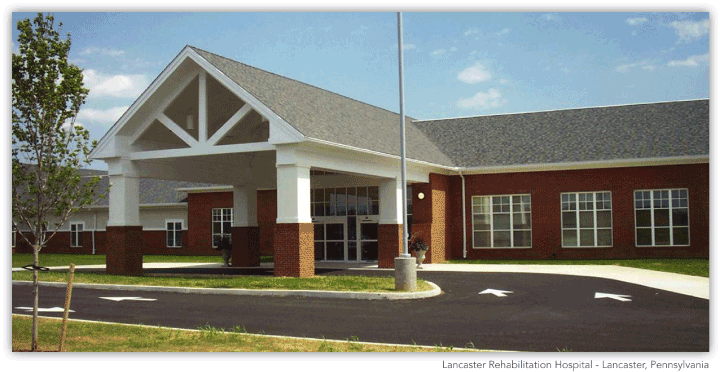
Lancaster Rehabilitation Hospital |
Lancaster | 100.0 | % | 57,508 | 100.0 | % | 1,491,243 | 25.93 | ||||||||||||||
Lancaster ASC MOB |
Lancaster | 80.9 | % | 64,214 | 100.0 | % | 2,220,165 | 34.57 | ||||||||||||||
| 121,722 | 100.0 | % | 3,711,408 | 30.49 | ||||||||||||||||||
| (1) | Parking revenue from an adjacent parking deck is approximately $90,000 per month, or $1,080,000
annualized. |
|
| (2) | Excludes annualized rent of adjacent parking decks to OLBH Same Day Surgery Center and MOB and
Gaston Professional Center from calculation. |
|
| (3) | Parking revenue from an adjacent parking deck is
approximately $100,000 per month, or $1,200,000 annualized. |

16
PROPERTY
LISTING
LISTING
as of March 31, 2011
(continued)
(continued)
| Annualized | ||||||||||||||||||||||
| Rent Per | ||||||||||||||||||||||
| Net Rentable | Occupancy | Annualized | Leased | |||||||||||||||||||
| Location | Ownership | Square Feet | Rate | Rent | Square Foot | |||||||||||||||||
South Carolina |
||||||||||||||||||||||
200 Andrews |
Greenville | 100.0 | % | 25,902 | 100.0 | % | 635,812 | 24.55 | ||||||||||||||
Beaufort Medical Plaza |
Beaufort | 100.0 | % | 59,340 | 100.0 | % | 1,362,773 | 22.97 | ||||||||||||||
Carolina Forest Medical Plaza |
Myrtle Beach | 100.0 | % | 38,902 | 43.5 | % | 547,848 | 32.40 | ||||||||||||||
Mary Black Westside Medical Office Bldg |
Spartanburg | 100.0 | % | 37,455 | 100.0 | % | 732,041 | 19.54 | ||||||||||||||
Medical Arts Center of Orangeburg |
Orangeburg | 100.0 | % | 49,324 | 78.0 | % | 674,507 | 17.54 | ||||||||||||||
Mount Pleasant Medical Office Long Point |
Mt. Pleasant | 100.0 | % | 38,735 | 77.4 | % | 805,803 | 26.89 | ||||||||||||||
One Medical Park |
Columbia | 100.0 | % | 69,840 | 83.9 | % | 1,447,494 | 24.72 | ||||||||||||||
Palmetto Health Parkridge |
Columbia | 100.0 | % | 89,451 | 94.6 | % | 2,243,492 | 26.51 | ||||||||||||||
Providence MOB I |
Columbia | 100.0 | % | 48,500 | 82.0 | % | 831,198 | 20.89 | ||||||||||||||
Providence MOB II |
Columbia | 100.0 | % | 23,280 | 80.6 | % | 389,343 | 20.74 | ||||||||||||||
Providence MOB III |
Columbia | 100.0 | % | 54,417 | 73.3 | % | 749,754 | 18.80 | ||||||||||||||
River Hills Medical Plaza |
Little River | 100.0 | % | 27,566 | 70.9 | % | 634,761 | 32.48 | ||||||||||||||
Roper Medical Office Building |
Charleston | 100.0 | % | 122,785 | 82.7 | % | 2,215,019 | 21.80 | ||||||||||||||
St. Francis CMOB |
Greenville | 100.0 | % | 45,140 | 96.6 | % | 1,189,373 | 27.27 | ||||||||||||||
St. Francis Medical Plaza (Charleston) |
Charleston | 100.0 | % | 28,734 | 100.0 | % | 861,219 | 29.97 | ||||||||||||||
St. Francis Medical Plaza (Greenville) |
Greenville | 100.0 | % | 62,724 | 88.1 | % | 1,017,670 | 18.42 | ||||||||||||||
St. Francis Outpatient Surgery Center |
Greenville | 100.0 | % | 72,491 | 100.0 | % | 2,181,970 | 30.10 | ||||||||||||||
St. Francis Professional Medical Center |
Greenville | 100.0 | % | 49,767 | 100.0 | % | 1,169,200 | 23.49 | ||||||||||||||
St. Francis Women’s |
Greenville | 100.0 | % | 57,590 | 79.2 | % | 980,016 | 21.47 | ||||||||||||||
Three Medical Park |
Columbia | 100.0 | % | 88,755 | 84.1 | % | 1,779,367 | 23.82 | ||||||||||||||
| 1,090,698 | 86.3 | % | 22,448,660 | 23.86 | ||||||||||||||||||
Tennessee |
||||||||||||||||||||||
Health Park Medical Office Building |
Chattanooga | 100.0 | % | 52,151 | 100.0 | % | 1,532,567 | 29.39 | ||||||||||||||
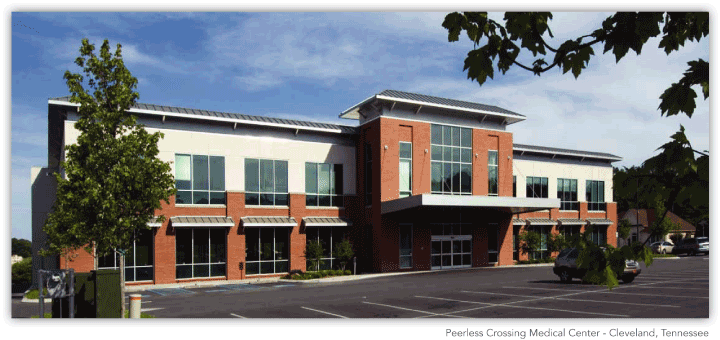
Peerless Crossing Medical Center |
Cleveland | 100.0 | % | 40,506 | 100.0 | % | 1,021,030 | 25.21 | ||||||||||||||
| 92,657 | 100.0 | % | 2,553,597 | 27.56 | ||||||||||||||||||
Virginia |
||||||||||||||||||||||
MRMC MOB I |
Mechanicsville | 100.0 | % | 56,610 | 77.2 | % | 1,284,123 | 29.40 | ||||||||||||||
St. Mary’s MOB North — (Floors 6 & 7) |
Richmond | 100.0 | % | 30,617 | 100.0 | % | 756,934 | 24.72 | ||||||||||||||
| 87,227 | 85.2 | % | 2,041,057 | 27.47 | ||||||||||||||||||
Total |
3,569,779 | 91.0 | % | $ | 83,484,391 | $ | 25.25 | (2) | ||||||||||||||
| (1) | Parking revenue from an adjacent parking deck is approximately $94,000 per month, or $1,128,000
annualized. |
|
| (2) | Excludes annualized rent of adjacent parking decks to OLBH Same Day Surgery Center and MOB and
Gaston Professional Center from calculation. (3) Parking revenue from an adjacent parking deck is
approximately $102,000 per month, or $1,224,000 annualized. |
|
| (3) | Parking revenue from an adjacent parking deck is
approximately $102,000 per month, or $1,224,000 annualized. |

17
PROPERTY
OCCUPANCY RATES
OCCUPANCY RATES
| March 31, 2011 | Dec. 31, 2010 | Sept. 30, 2010 | June 30, 2010 | March 31, 2010 | ||||||||||||||||
California |
||||||||||||||||||||
Verdugo Professional Bldg I |
91.2 | % | 93.1 | % | 94.3 | % | 94.3 | % | 94.3 | % | ||||||||||
Verdugo Professional Bldg II |
99.5 | % | 99.5 | % | 99.5 | % | 99.5 | % | 99.5 | % | ||||||||||
Florida |
||||||||||||||||||||
Woodlands Center for Specialized Medicine |
100.0 | % | 100.0 | % | 100.0 | % | 100.0 | % | 100.0 | % | ||||||||||
Georgia |
||||||||||||||||||||
Augusta POB I |
97.2 | % | 93.2 | % | 90.7 | % | 90.7 | % | 77.7 | % | ||||||||||
Augusta POB II |
86.1 | % | 87.6 | % | 87.6 | % | 87.6 | % | 87.6 | % | ||||||||||
Augusta POB III |
90.0 | % | 90.0 | % | 90.0 | % | 90.0 | % | 90.0 | % | ||||||||||
Augusta POB IV |
83.1 | % | 83.1 | % | 82.5 | % | 82.5 | % | 82.5 | % | ||||||||||
Summit Professional Plaza I |
93.5 | % | 93.5 | % | 93.5 | % | 93.5 | % | 93.5 | % | ||||||||||
Summit Professional Plaza II |
96.7 | % | 96.7 | % | 96.7 | % | 96.7 | % | 96.7 | % | ||||||||||
Indiana |
||||||||||||||||||||
Methodist Professional Center I |
96.4 | % | 95.2 | % | 95.2 | % | 96.4 | % | 96.4 | % | ||||||||||
Methodist Professional Center II |
100.0 | % | 100.0 | % | 100.0 | % | 100.0 | % | 100.0 | % | ||||||||||
Kentucky |
||||||||||||||||||||
OLBH Same Day Surgery Center and MOB |
91.8 | % | 95.7 | % | 100.0 | % | 91.5 | % | 100.0 | % | ||||||||||
Louisiana |
||||||||||||||||||||
East Jefferson MOB |
99.1 | % | 99.1 | % | 98.8 | % | 100.0 | % | 100.0 | % | ||||||||||
East Jefferson Medical Plaza |
100.0 | % | 100.0 | % | 100.0 | % | 100.0 | % | 100.0 | % | ||||||||||
East Jefferson MRI |
100.0 | % | 100.0 | % | 100.0 | % | 100.0 | % | 100.0 | % | ||||||||||
Minnesota |
||||||||||||||||||||
Health Partners Medical & Dental Clinics |
94.9 | % | 94.9 | % | 94.9 | % | 94.9 | % | n/a | |||||||||||
Mississippi |
||||||||||||||||||||
University Physicians — Grants Ferry |
100.0 | % | 100.0 | % | 100.0 | % | 100.0 | % | n/a | |||||||||||
New York |
||||||||||||||||||||
Central NY Medical Center |
97.8 | % | 97.8 | % | 97.8 | % | 97.8 | % | 95.4 | % | ||||||||||

18
PROPERTY
OCCUPANCY RATES
(continued)
OCCUPANCY RATES
(continued)
| March 31, 2011 | Dec. 31, 2010 | Sept. 30, 2010 | June 30, 2010 | March 31, 2010 | ||||||||||||||||
North Carolina |
||||||||||||||||||||
Alamance Regional Mebane Outpatient Ctr |
71.1 | % | 71.1 | % | 71.1 | % | 71.1 | % | 71.1 | % | ||||||||||
Barclay Downs |
100.0 | % | 100.0 | % | 100.0 | % | 100.0 | % | 100.0 | % | ||||||||||
Birkdale Bldgs C, D, E and Birkdale Wellness |
96.4 | % | 96.4 | % | 96.4 | % | 96.4 | % | 96.4 | % | ||||||||||
Birkdale II |
100.0 | % | 100.0 | % | 100.0 | % | 100.0 | % | 100.0 | % | ||||||||||
Copperfield Medical Mall |
100.0 | % | 100.0 | % | 100.0 | % | 100.0 | % | 100.0 | % | ||||||||||
East Rocky Mount Kidney Center |
100.0 | % | 100.0 | % | 100.0 | % | 100.0 | % | 100.0 | % | ||||||||||
English Road Medical Center |
95.7 | % | 95.7 | % | 95.7 | % | 95.7 | % | 95.7 | % | ||||||||||
Gaston Professional & Ambulatory Surgery Centers |
100.0 | % | 100.0 | % | 100.0 | % | 100.0 | % | 100.0 | % | ||||||||||
Gateway Medical Office Building |
69.1 | % | 69.1 | % | 69.1 | % | 69.1 | % | 69.1 | % | ||||||||||
Harrisburg Family Physicians |
100.0 | % | 100.0 | % | 100.0 | % | 100.0 | % | 100.0 | % | ||||||||||
Harrisburg Medical Mall |
100.0 | % | 100.0 | % | 100.0 | % | 100.0 | % | 100.0 | % | ||||||||||
Lincoln/Lakemont Family Practice |
100.0 | % | 100.0 | % | 100.0 | % | 100.0 | % | 100.0 | % | ||||||||||
Mallard Crossing Medical Park |
63.8 | % | 66.0 | % | 66.0 | % | 66.0 | % | 66.9 | % | ||||||||||
Medical Arts Building |
93.3 | % | 93.3 | % | 93.3 | % | 98.2 | % | 98.2 | % | ||||||||||
Midland Medical Park |
100.0 | % | 100.0 | % | 100.0 | % | 100.0 | % | 100.0 | % | ||||||||||
Mulberry Medical Park |
77.6 | % | 87.0 | % | 87.0 | % | 87.0 | % | 77.7 | % | ||||||||||
Northcross Family Physicians |
100.0 | % | 100.0 | % | 100.0 | % | 100.0 | % | 100.0 | % | ||||||||||
Randolph Medical Park |
69.2 | % | 69.2 | % | 69.2 | % | 71.8 | % | 71.8 | % | ||||||||||
Rocky Mount Kidney Center |
100.0 | % | 100.0 | % | 100.0 | % | 100.0 | % | 100.0 | % | ||||||||||
Rocky Mount Medical Park |
100.0 | % | 100.0 | % | 100.0 | % | 92.8 | % | 92.8 | % | ||||||||||
Rowan Outpatient Surgery Center |
100.0 | % | 100.0 | % | 100.0 | % | 100.0 | % | 100.0 | % | ||||||||||
Weddington Internal & Pediatric Medicine |
100.0 | % | 100.0 | % | 100.0 | % | 100.0 | % | 100.0 | % | ||||||||||
Pennsylvania |
||||||||||||||||||||
Lancaster Rehabilitation Hospital |
100.0 | % | 100.0 | % | 100.0 | % | 100.0 | % | 100.0 | % | ||||||||||
Lancaster ASC MOB |
100.0 | % | 100.0 | % | 100.0 | % | 100.0 | % | 100.0 | % | ||||||||||

19
PROPERTY
OCCUPANCY RATES
(continued)
OCCUPANCY RATES
(continued)
| March 31, 2011 | Dec. 31, 2010 | Sept. 30, 2010 | June 30, 2010 | March 31, 2010 | ||||||||||||||||
South Carolina |
||||||||||||||||||||
200 Andrews |
100.0 | % | 100.0 | % | 100.0 | % | 100.0 | % | 100.0 | % | ||||||||||
Beaufort Medical Plaza |
100.0 | % | 100.0 | % | 100.0 | % | 100.0 | % | 100.0 | % | ||||||||||
Carolina Forest Medical Plaza |
43.5 | % | 43.5 | % | 43.5 | % | 43.5 | % | 43.5 | % | ||||||||||
Mary Black Westside Medical Office Bldg |
100.0 | % | 100.0 | % | 100.0 | % | 100.0 | % | 100.0 | % | ||||||||||
Medical Arts Center of Orangeburg |
78.0 | % | 78.0 | % | 78.0 | % | 78.0 | % | 78.0 | % | ||||||||||
Mount Pleasant Medical Office Long Point |
77.4 | % | 77.4 | % | 77.4 | % | 77.4 | % | 77.4 | % | ||||||||||
One Medical Park |
83.9 | % | 83.9 | % | 78.2 | % | 80.8 | % | 80.8 | % | ||||||||||
Palmetto Health Parkridge |
94.6 | % | 94.6 | % | 94.6 | % | 94.6 | % | 94.6 | % | ||||||||||
Providence MOB I |
82.0 | % | 82.0 | % | 87.2 | % | 87.2 | % | 87.2 | % | ||||||||||
Providence MOB II |
80.6 | % | 88.8 | % | 100.0 | % | 100.0 | % | 100.0 | % | ||||||||||
Providence MOB III |
73.3 | % | 73.3 | % | 55.5 | % | 49.6 | % | 55.5 | % | ||||||||||
River Hills Medical Plaza |
70.9 | % | 70.9 | % | 70.9 | % | 70.9 | % | 70.9 | % | ||||||||||
Roper Medical Office Building |
82.7 | % | 84.7 | % | 95.6 | % | 95.6 | % | 95.6 | % | ||||||||||
St. Francis CMOB |
96.6 | % | 96.6 | % | 100.0 | % | 100.0 | % | 100.0 | % | ||||||||||
St. Francis Medical Plaza (Charleston) |
100.0 | % | 100.0 | % | 100.0 | % | 100.0 | % | 100.0 | % | ||||||||||
St. Francis Medical Plaza (Greenville) |
88.1 | % | 67.6 | % | 61.5 | % | 50.7 | % | 50.7 | % | ||||||||||
St. Francis Outpatient Surgery Center |
100.0 | % | 100.0 | % | 100.0 | % | n/a | n/a | ||||||||||||
St. Francis Professional Medical Center |
100.0 | % | 100.0 | % | 100.0 | % | 100.0 | % | 100.0 | % | ||||||||||
St. Francis Women’s |
79.2 | % | 79.2 | % | 79.2 | % | 76.5 | % | 76.5 | % | ||||||||||
Three Medical Park |
84.1 | % | 82.3 | % | 100.0 | % | 100.0 | % | 100.0 | % | ||||||||||
Tennessee |
||||||||||||||||||||
Health Park Medical Office Building |
100.0 | % | 88.8 | % | 88.8 | % | 88.8 | % | 100.0 | % | ||||||||||
Peerless Crossing Medical Center |
100.0 | % | 100.0 | % | 100.0 | % | 100.0 | % | 100.0 | % | ||||||||||
Virginia |
||||||||||||||||||||
MRMC MOB I |
77.2 | % | 77.2 | % | 92.7 | % | 100.0 | % | 100.0 | % | ||||||||||
St. Mary’s MOB North — (Floors 6 & 7) |
100.0 | % | 100.0 | % | 100.0 | % | 100.0 | % | 100.0 | % | ||||||||||

20
TENANT
LEASE EXPIRATIONS
for Leases in Place at
March 31, 2011
LEASE EXPIRATIONS
for Leases in Place at
March 31, 2011
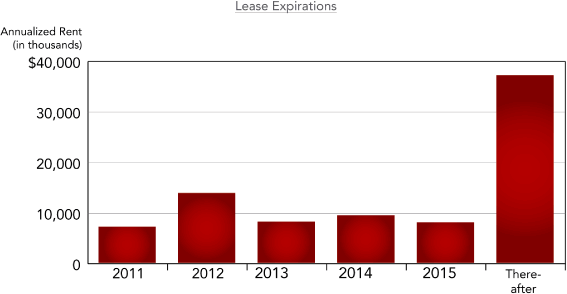
| Number of | Net Rentable Square | Percentage of Net | Annualized | Percentage of Property | Annualized Rent Per | |||||||||||||||||||
| Leases Expiring | Feet | Rentable Square Feet | Rent | Annualized Rent | Leased Square Foot | |||||||||||||||||||
Available |
— | 321,775 | 9.0 | % | $ | — | — | $ | — | |||||||||||||||
2011 |
100 | 310,322 | 8.7 | % | 7,111,144 | 8.5 | % | 22.92 | ||||||||||||||||
2012 |
130 | 532,441 | 14.9 | % | 13,786,437 | 16.5 | % | 24.75 | (1) | |||||||||||||||
2013 |
87 | 344,788 | 9.7 | % | 8,107,797 | 9.7 | % | 23.52 | ||||||||||||||||
2014 |
81 | 371,903 | 10.4 | % | 9,370,039 | 11.2 | % | 25.19 | ||||||||||||||||
2015 |
76 | 296,948 | 8.3 | % | 8,006,105 | 9.6 | % | 24.00 | (1) | |||||||||||||||
2016 |
39 | 186,726 | 5.2 | % | 3,878,412 | 4.6 | % | 20.77 | ||||||||||||||||
2017 |
49 | 287,787 | 8.1 | % | 7,826,787 | 9.4 | % | 27.20 | ||||||||||||||||
2018 |
24 | 148,559 | 4.2 | % | 3,636,296 | 4.4 | % | 24.48 | ||||||||||||||||
2019 |
19 | 143,101 | 4.0 | % | 3,196,681 | 3.8 | % | 22.34 | ||||||||||||||||
2020 |
14 | 92,969 | 2.6 | % | 2,077,619 | 2.5 | % | 22.35 | ||||||||||||||||
Thereafter |
21 | 532,460 | 14.9 | % | 16,487,074 | 19.7 | % | 30.96 | ||||||||||||||||
Total |
640 | 3,569,779 | 100.0 | % | $ | 83,484,391 | 100.0 | % | $ | 25.25 | (1) | |||||||||||||
| (1) | Excludes annualized rent of adjacent parking decks to OLBH Same Day Surgery Center and MOB
and Gaston Professional Center from calculation. |

21
TEN LARGEST
TENANTS
TENANTS
by Annualized Rent at
March 31, 2011
March 31, 2011
| Annualized | Percent of | |||||||
| Tenant | Rent | Portfolio | ||||||
1. Carolinas Healthcare System |
$ | 5,816,292 | 7.0 | % | ||||
2. Bon Secours St. Francis Hospital |
5,675,611 | 6.8 | % | |||||
3. Lancaster General Hospital |
2,995,110 | 3.6 | % | |||||
4. Palmetto Health Alliance |
2,973,005 | 3.6 | % | |||||
5. Woodlands Medical |
2,544,183 | 3.0 | % | |||||
6. Clarian Health Partners |
2,361,807 | 2.8 | % | |||||
7. HealthPartners, Inc. |
2,051,708 | 2.5 | % | |||||
8. Jefferson Parish Hospital District #2 |
1,976,223 | 2.4 | % | |||||
9. University Hospital, Augusta, GA |
1,929,114 | 2.3 | % | |||||
10. Gaston Memorial Hospital |
1,892,824 | 2.3 | % | |||||
| $ | 30,215,877 | 36.2 | % | |||||

22
GROUND & AIR RIGHTS
LEASES
as of March 31, 2011
LEASES
as of March 31, 2011
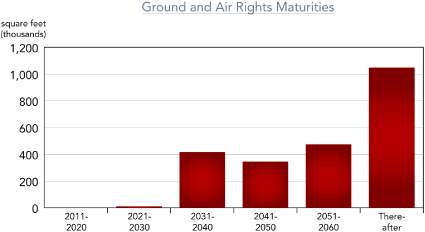
| Ground or Air | ||||||||
| Net Rentable | Rights Lease | |||||||
| Square Feet | Expiration(1) | |||||||
200 Andrews |
25,902 | 2063 | ||||||
Alamance Regional Mebane Outpatient Ctr |
68,206 | 2086 | ||||||
Beaufort Medical Plaza |
59,340 | 2070 | ||||||
East Jefferson Medical Plaza |
123,184 | 2043 | ||||||
East Jefferson MOB |
119,921 | 2035 | ||||||
East Jefferson MRI |
10,809 | 2027 | ||||||
Gaston MOB and Surgery Center |
114,956 | 2035 | ||||||
Gateway Medical Office Building |
61,789 | 2054 | ||||||
Good Samaritan Medical Office Building(2) |
79,641 | 2111 | ||||||
Lancaster ASC MOB |
64,215 | 2091 | ||||||
Lancaster Rehabilitation Hosp |
57,508 | 2092 | ||||||
Mary Black Westside Medical Office Building |
37,455 | 2061 | ||||||
Medical Arts Building |
84,972 | 2070 | ||||||
Medical Center Physicians Tower |
106,772 | 2089 | ||||||
Methodist Professional Center I (and adjacent parking deck) |
150,243 | 2060 | ||||||
Mount Pleasant Medical Office Longpoint |
38,735 | 2070 | ||||||
Mulberry Medical Park |
24,992 | 2057 | ||||||
OLBH Same Day Surgery MOB/Parking Garage |
46,907 | 2067 | ||||||
One Medical Park |
69,840 | 2033 | ||||||
Parkridge MOB LLC |
89,451 | 2053 | ||||||
Providence MOB I |
48,500 | 2049 | ||||||
Providence MOB II |
23,280 | 2034 | ||||||
Roper Medical Office Building |
122,784 | 2042 | ||||||
St. Elizabeth Florence Medical Office Building |
53,833 | 2080 | ||||||
St Francis CMOB |
45,140 | 2060 | ||||||
St Francis Medical Plaza (Greenville) |
62,724 | 2070 | ||||||
St Francis Outpatient Surgery Center |
72,491 | 2060 | ||||||
St Francis Women’s |
57,590 | 2070 | ||||||
St. Francis Medical Plaza (Charleston) |
28,734 | 2073 | ||||||
St. Francis Professional Medical Center |
49,767 | 2050 | ||||||
St. Luke’s MOB(2) |
176,000 | 2081 | ||||||
St. Mary’s MOB North (Floors 6 & 7) |
30,617 | 2058 | ||||||
Three Medical Park |
88,755 | 2039 | ||||||
| (1) | Year of expiration assumes we have exercised
lease renewal options. |
|
| (2) | Property in construction
as of March 31, 2011. |

23
PIPELINE
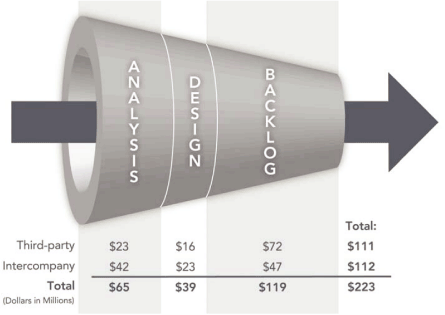
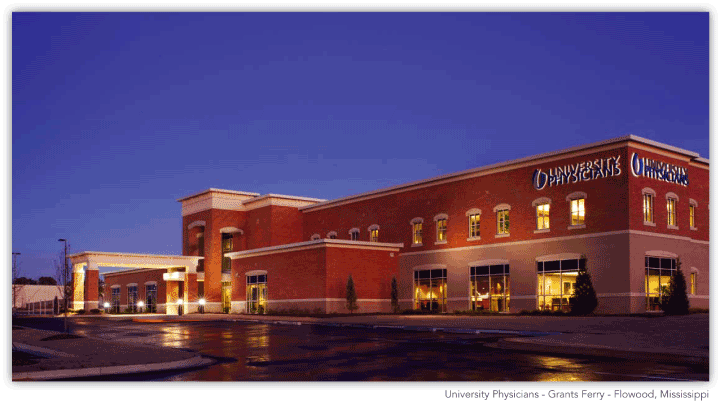

24
INTER-COMPANY
PROFIT ELIMINATION EXAMPLE
PROFIT ELIMINATION EXAMPLE
We are required to account for the operations of our Design-Build and Development segment
separately from that of our Property Operations segment due to Federal income tax guidelines (see
Note 2 in our Consolidated Financial Statements on Form 10-K or 10-Q for further explanation of
Real Estate Investment Trust organizational and operational guidance). Generally accepted
accounting principles require that we eliminate these inter-company profits upon consolidation.
At times, the Design-Build and Development segment will construct a building for the Property
Operations segment. Upon consolidation, the profits earned by the Design-Build and Development
segment must be eliminated and the corresponding value of the building reduced by the same amount.
In the example below, Property Operations pays Design-Build and Development a market value of $10.0
million to construct a building. Design-Build and Development’s cost to construct the building is
$9.0 million. Upon consolidation, we eliminate the $1.0 million profit and reduce the carrying
value of the building to $9.0 million. Had we hired a third party general contractor, our carrying
value would have been $10.0 million.
Regardless of who constructs the building, Property Operations establishes the rental rate based on
the building’s market value of $10.0 million. Assuming an 8.0% return on cost, the rental rate is
set at $0.8 million. Since we self-constructed the building, our consolidated (and internal) cost
is actually $9.0 million which then increases our return on investment to 8.9% ($0.8 million
divided by $9.0 million).
| Building | Return on | |||||||
| Carrying Value | Investment | |||||||
Building results as constructed by a third-party |
$ | 10,000,000 | 8.0 | % | ||||
Building results as constructed internally |
$ | 9,000,000 | 8.9 | % | ||||
| Property | Design-Build & | Profit | Consolidated | |||||||||||||
| Operations | Development | Elimination | Cogdell Spencer | |||||||||||||
Assets: |
||||||||||||||||
Cash |
$ | (10,000,000 | ) | $ | 1,000,000 | $ | — | $ | (9,000,000 | ) | ||||||
Building |
10,000,000 | — | (1,000,000 | ) | 9,000,000 | |||||||||||
| $ | — | $ | 1,000,000 | $ | (1,000,000 | ) | — | |||||||||
Liabilities and equity: |
||||||||||||||||
Secured Credit Facility |
$ | — | $ | — | $ | — | $ | — | ||||||||
Equity (current year earnings) |
— | 1,000,000 | (1,000,000 | ) | — | |||||||||||
| $ | — | $ | 1,000,000 | $ | (1,000,000 | ) | $ | — | ||||||||
Income statement: |
||||||||||||||||
Design-Build Revenue |
$ | — | $ | 10,000,000 | $ | (10,000,000 | ) | $ | — | |||||||
Design-Build Cost of Sales |
— | (9,000,000 | ) | 9,000,000 | — | |||||||||||
Gross Margin |
$ | — | 1,000,000 | $ | (1,000,000 | ) | $ | — | ||||||||

25
ACQUISITIONS,
COMPLETED DEVELOPMENTS &
PROPERTIES IN LEASE-UP
COMPLETED DEVELOPMENTS &
PROPERTIES IN LEASE-UP
for the Period January 1, 2010
through March 31, 2011
(dollars in thousands)
through March 31, 2011
(dollars in thousands)
| Acquisition/ | Lease-up | |||||||||||||||||||
| Completion/ | Net Rentable | Percentage | Construction | Underwriting | ||||||||||||||||
| Property | Location | Type | Acquired Date | Square Feet | Leased | Cost | Date | |||||||||||||
Stabilized and income producing: |
||||||||||||||||||||
HealthPartners Medical Office Building |
St. Cloud, MN | Development | 2Q 2010 | 60,108 | 95 | % | $ | 15,624 | n/a | |||||||||||
University Physicians — Grant’s Ferry |
Brandon, MS | Development | 2Q 2010 | 50,575 | 100 | % | 14,032 | n/a | ||||||||||||
Lancaster Rehabilitation Hospital (1) |
Lancaster, PA | Development | 2Q 2010 | 4,630 | 100 | % | 1,991 | n/a | ||||||||||||
St. Francis Outpatient Surgery Center |
Greenville, SC | Acquisition | 3Q 2010 | 72,491 | 100 | % | 16,638 | n/a | ||||||||||||
Total 2009 and 2010 |
187,804 | 48,285 | ||||||||||||||||||
Lease-up as of balance sheet date: |
||||||||||||||||||||
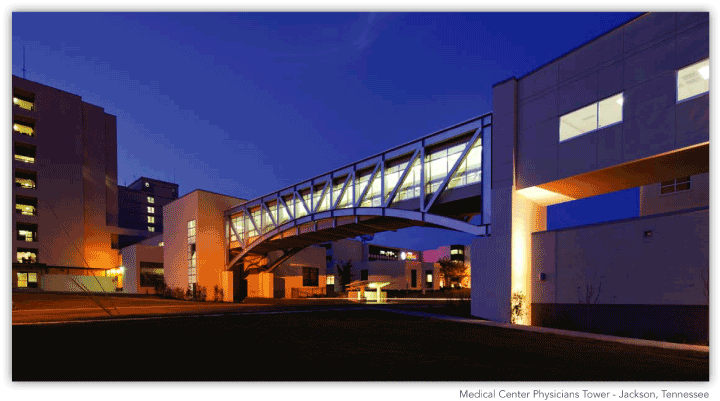
Medical Center Physicians Tower |
Jackson, TN | Development | 2Q 2010 | 106,772 | 100 | %(2) | 21,139 | 3Q 2011 | ||||||||||||
St. Elizabeth Florence Medical
Office Building |
Florence, KY | Acquisition | 1Q 2011 | 53,833 | 76 | % | 6,150 | 1Q 2013 | ||||||||||||
| 160,605 | $ | 27,289 | ||||||||||||||||||
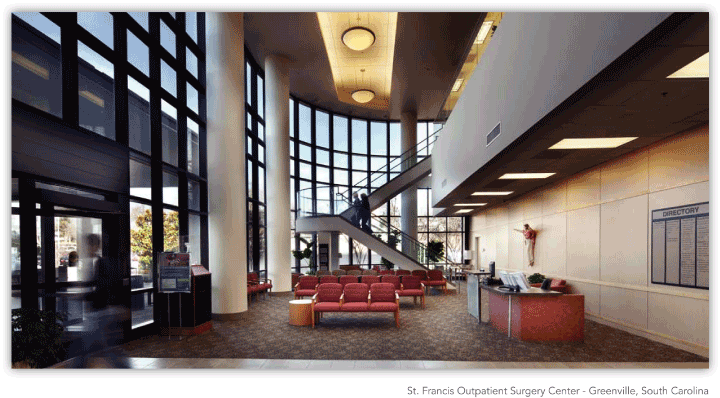
| (1) | Represents 4,630 square foot expansion to the existing property. |
|
| (2) | The property is 75% leased and income producing with the remaining 25% leased and under
construction for a third quarter 2011 scheduled date of occupancy. |

26
DEVELOPMENT
CONSTRUCTION &
CAPITAL EXPENDITURES
CAPITAL EXPENDITURES
as of March 31, 2011
(dollars in thousands)
(dollars in thousands)
| Estimated | ||||||||||||||||||||
| Completion | Net Rentable | Investment to | Estimated Total | Percentage | ||||||||||||||||
| Development Construction | Location | Date | Square Feet | Date | Investment | Leased | ||||||||||||||
Good Sam Medical Office Building |
Puyallup, WA | 4Q 2011 | 80,000 | $ | 12,012 | $ | 24,700 | 73 | % | |||||||||||
Bonney Lake
Medical Office Building
(1) |
Bonney Lake, WA | 3Q 2011 | 56,000 | 14,213 | 17,700 | 98 | % | |||||||||||||
St. Luke’s Medical Office Building |
Duluth, MN | 3Q 2012 | 176,000 | 948 | 27,800 | 100 | % | |||||||||||||
Land and pre-construction developments |
— | 2,812 | — | |||||||||||||||||
| 312,000 | $ | 29,985 | $ | 70,200 | ||||||||||||||||
| Three Months | ||||
| Ended | ||||
| Capital Expenditures | March 31, 2011 | |||
Development, redevelopment, and
acquisitions |
$ | 14,257 | ||
Second generation tenant improvements |
1,122 | |||
Recurring property capital expenditures |
239 | |||
Total |
$ | 15,618 | ||
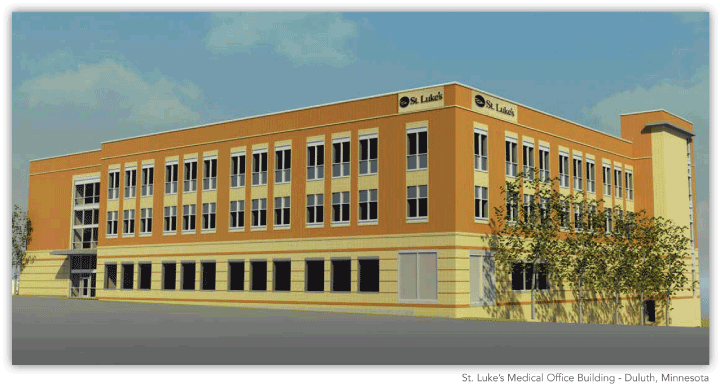
| (1) | We had a 61.7% ownership interest at March 31, 2011. |

27
