Attached files
| file | filename |
|---|---|
| 8-K - CINCINNATI BELL INC. 8-K - CINCINNATI BELL INC | a6708821.htm |
| EX-99.1 - EXHIBIT 99.1 - CINCINNATI BELL INC | a6708821_ex991.htm |
Exhibit 99.2

Cincinnati Bell First Quarter 2011 Results May 5, 2011
Today’s Agenda Performance Highlights Jack Cassidy, President & Chief Executive Officer Review of Wireline Wireless, IT Services & Hardware Ted Torbeck, President, Cincinnati Bell Communications Review of Data Center Colocation and Financial Overview Gary Wojtaszek, Chief Financial Officer Question & Answer Cincinnati Bell Management Team 2 Cincinnati Bell

Harbor Safe Certain of the statements and predictions contained in this presentation constitute forward-looking statements within the meaning of the Private Securities Litigation Reform Act. In particular, statements, projections or estimates that include or reference the words “believes,” “anticipates,” “plans,” “intends,” “expects,” “will,” or any similar expression fall within the safe harbor for forward-looking statements contained in the Reform Act. Actual results or outcomes may differ materially from those indicated or suggested by any such forward-looking statement for a variety of reasons, including, but not limited to: changing market conditions and growth rates within the telecommunications industry or generally within the overall economy; changes in competition in markets in which the company operates; pressures on the pricing of company products and services; advances in telecommunications technology; the ability to sufficient flow to fund company’s business plan, repay company’s debt and generate cash the company s the company s interest obligations, and maintain its networks; the ability to refinance indebtedness when required on commercially reasonable terms changes in the telecommunications regulatory environment changes in the demand for the company’s services within the overall mix of products sold, as the company’s products and services have varying profit margins; the company’s ability to introduce new service and product offerings on a timely and cost effective basis; work stoppages caused by labor disputes; restrictions imposed under various credit facilities and debt instruments; the company’s ability to attract and retain highly qualified employees; the company’s ability to access capital markets and the successful execution of restructuring initiatives; changes in the funded status of the company’s retiree pension and healthcare plans; changes in the company’s relationships with current large customers, a small number of whom account for a significant portion of company revenue; disruption in the company’s back-office information technology systems, including its billing company’s ability to Networks system; the company s integrate successfully the business of Cyrus Networks, LLC with the company’s existing operations and to achieve the anticipated benefits of the acquisition of Cyrus Networks, LLC; and failure of or disruption in the operation of the company’s data center. More information on potential risks and uncertainties is available in recent filings with the Securities and Exchange Commission, including Cincinnati Bell’s Form 10-K report, Form 10-Q reports and Form 8-K forward-looking presentation represent company 3 3 reports. The forward statements included in this estimates as of May 5, 2011. Cincinnati Bell anticipates that subsequent events and developments will cause its estimates to change.

Non GAAP Financial Measures This presentation contains information about adjusted earnings before interest, taxes, depreciation and amortization (Adjusted EBITDA) Adjusted margin flow EBITDA), EBITDA margin, free cash flow, and net debt. These are non-GAAP financial measures used by Cincinnati Bell management when evaluating results of operations and cash flow. Management believes these measures also provide users of the financial statements with additional and useful comparisons of current results of operations and cash flows with past and future periods. Non-financial measures should not be construed as being more important than comparable GAAP measures. Detailed reconciliations of Adjusted EBITDA, free cash flow (including the Company’s definition of these terms), and net debt to comparable GAAP financial measures can be found on our website at www.cincinnatibell.com in the Investor Relations section. 4
Jack Cassidy President and CEO
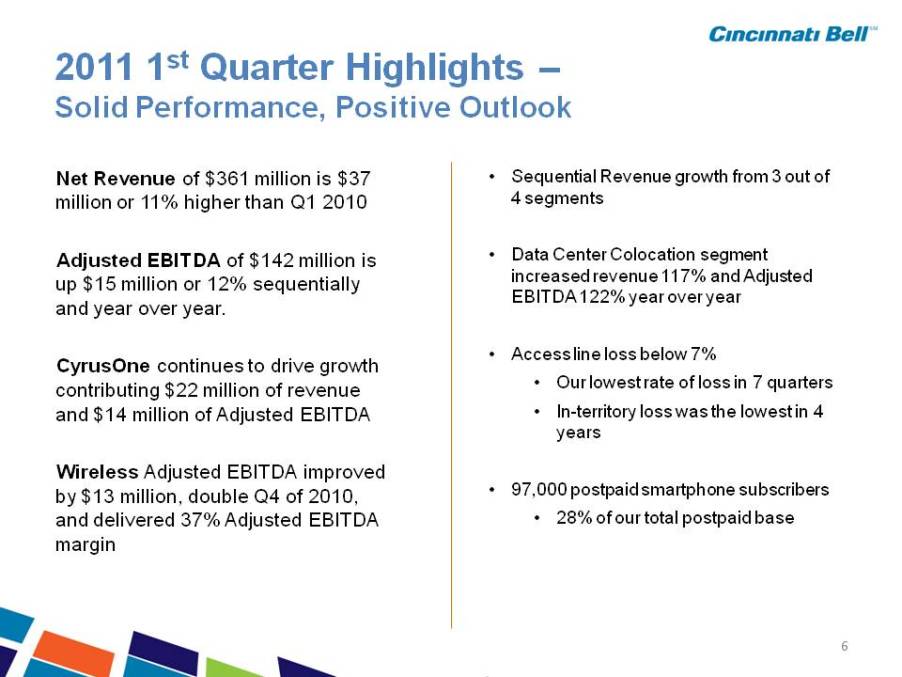
2011 1st Quarter Highlights –Solid Performance, Positive Outlook Net Revenue of $361 million is $37 • Sequential Revenue growth from 3 out of 4 million or 11% higher than Q1 2010 Adjusted EBITDA of $142 million is up $15 million 12% segments • Data Center Colocation segment increased revenue 117% and Adjusted or sequentially and year over year. CyrusOne continues to drive growth contributing EBITDA 122% year over year • Access line loss below 7% • Our contributing $22 million of revenue and $14 million of Adjusted EBITDA Wireless Adjusted EBITDA improved lowest rate of loss in 7 quarters • In-territory loss was the lowest in 4 years by $13 million, double Q4 of 2010, and delivered 37% Adjusted EBITDA margin • 97,000 postpaid smartphone subscribers • 28% of our total postpaid base 6
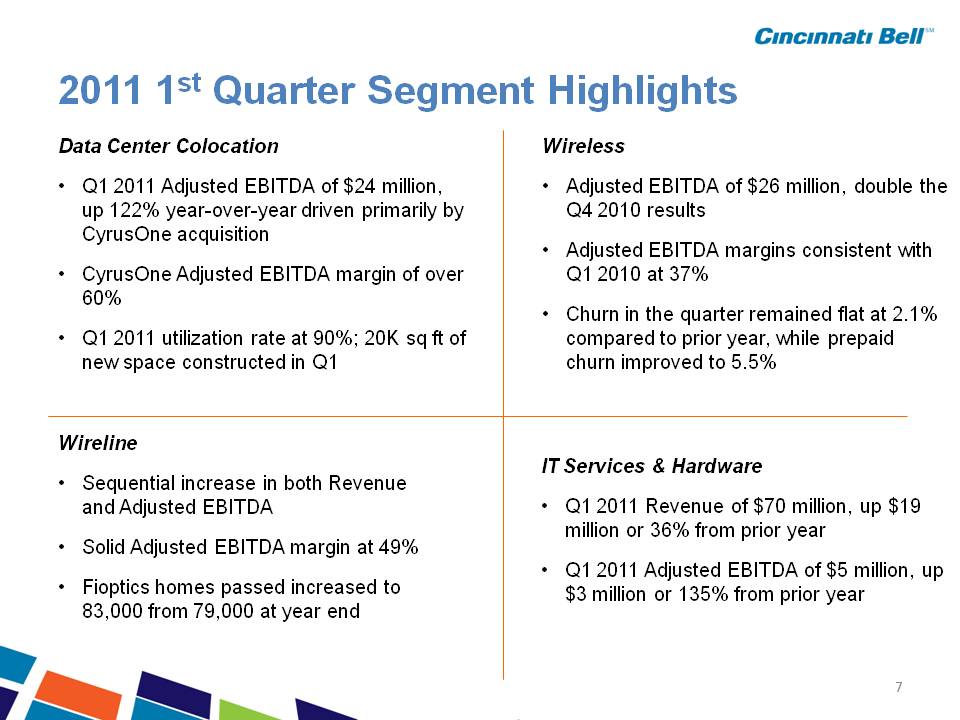
2011 1st Segment Wireless • Adjusted EBITDA of $26 million, double the Q4 2010 Data Center Colocation • Q1 2011 Adjusted EBITDA of $24 million, up 122% Quarter Highlights results • Adjusted EBITDA margins consistent with Q1 2010 at 37% up year-over-year driven primarily by CyrusOne acquisition • CyrusOne Adjusted EBITDA margin of over 60% • Churn in the quarter remained flat at 2.1% compared to prior year, while prepaid churn improved to 5.5% • Q1 2011 utilization rate at 89%; 20K sq ft of new space constructed in Q1 Wireline • Sequential increase in both Revenue and Adjusted IT Services & Hardware • Q1 2011 Revenue of 70 million, up $ 19 EBITDA • Solid Adjusted EBITDA margin at 49% • Fioptics homes passed increased to 83,000 from 79,000 at year Q $ , p million or 36% from prior year • Q1 2011 Adjusted EBITDA of $5 million, up $3 million or 135% from prior year 7 end
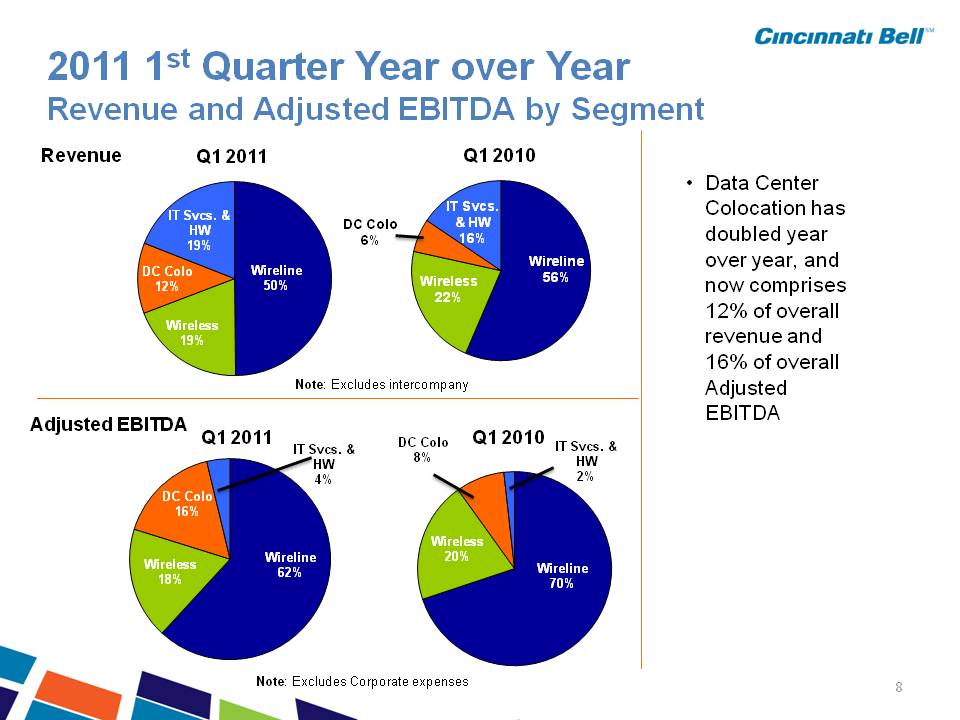
2011 1st Quarter Year over Year Revenue and Adjusted EBITDA by Segment Q1 2011 IT Q1 2010 Revenue* • Data Center Wireline 50% DC Colo 12% IT Svcs. & HW 19% Wireline 56% Wireless 22% DC Colo 6% Svcs. & HW 16% Colocation has doubled year over year, and now comprises 12% of Wireless 19% overall revenue and 16% of overall Adjusted EBITDA Note: Excludes interco mpany Adjusted EBITDA* DC Colo 16% IT Svcs. & HW 4% Q1 2011 DC Colo 8% IT Svcs. & HW 2% Q1 2010 Wireline 62% Wireless 18% Wireline 70% Wireless 20% 8 Note: Excludes Corporate expenses
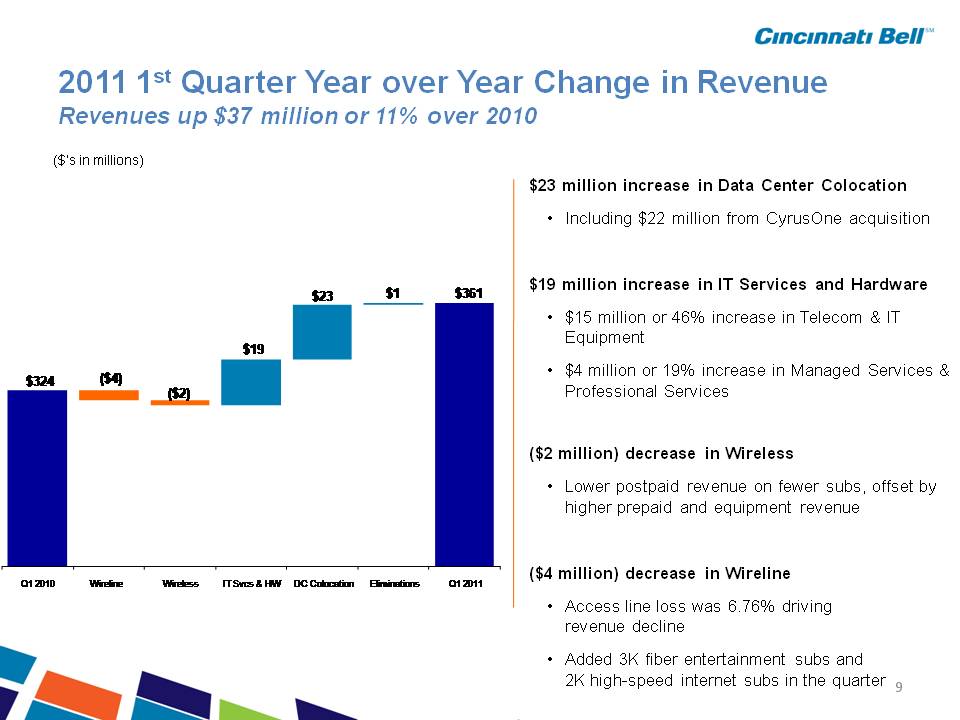
2011 1st Quarter Year over Year Change in Revenue Revenues up $37 million or 11% over 2010 $23 million increase in Data Center Colocation ($’s in millions) • Including $22 million from CyrusOne acquisition $19 million increase in IT Services and Hardware $361 $23 $1 • $15 million or 46% increase in Telecom & IT Equipment • $4 million or 19% increase in Managed Services & Professional Services $324 ($4) ($2) $19 ($2 million) decrease in Wireless • Lower postpaid revenue on fewer subs, offset by higher prepaid and equipment revenue ($4 million) decrease in Wireline • Access line loss was 6.8% driving Q1 2010 Wireline Wireless IT Svcs & HW DC Colocation Eliminations Q1 2011 9 revenue decline • Added 3K fiber entertainment subs and 2K high-speed internet subs
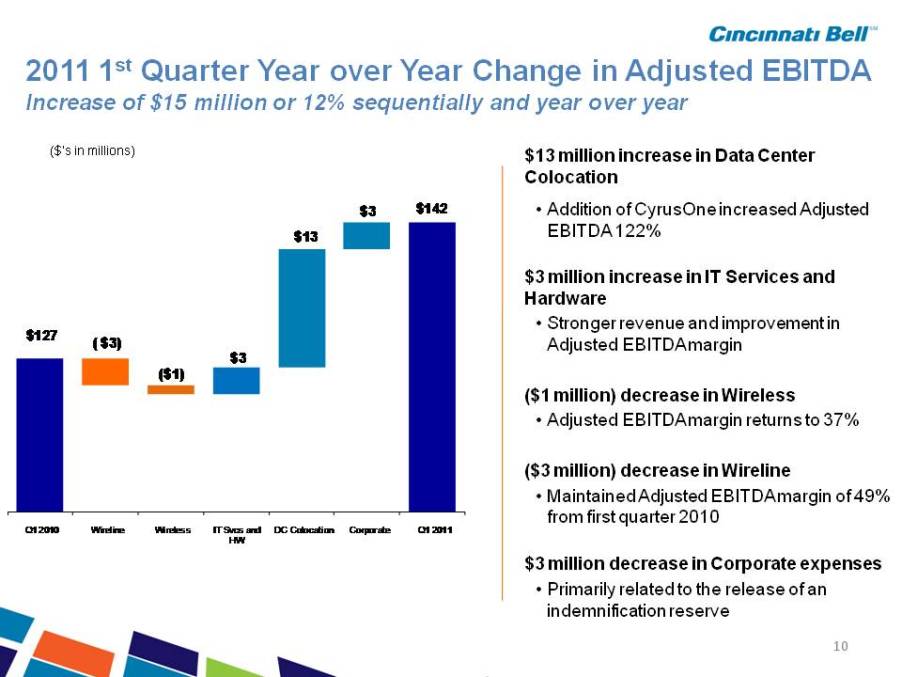
2011 1st Quarter Year over Year Change in Adjusted EBITDA $ Increase of 15 million or 12% sequentially and year over year $13 million increase in Data Center Colocation ($’s in millions) • Addition of CyrusOne increased Adjusted EBITDA 122% $3 million increase in IT Services and $142 $13 $3 Hardware • Stronger revenue and improvement in Adjusted EBITDA margin $127 ( $3) ($1) $3 ($1 million) decrease in Wireless • Adjusted EBITDA margin returns to 37% ($3 million) decrease in Wireline • Maintained Adjusted EBITDA margin of 49% from first quarter 2010 $3 million decrease in Corporate expenses Q1 2010 Wireline Wireless IT Svcs and HW DC Colocation Corporate Q1 2011 10 • Primarily related to the release of an indemnification reserve

Ted Torbeck President of Cincinnati Bell Communications
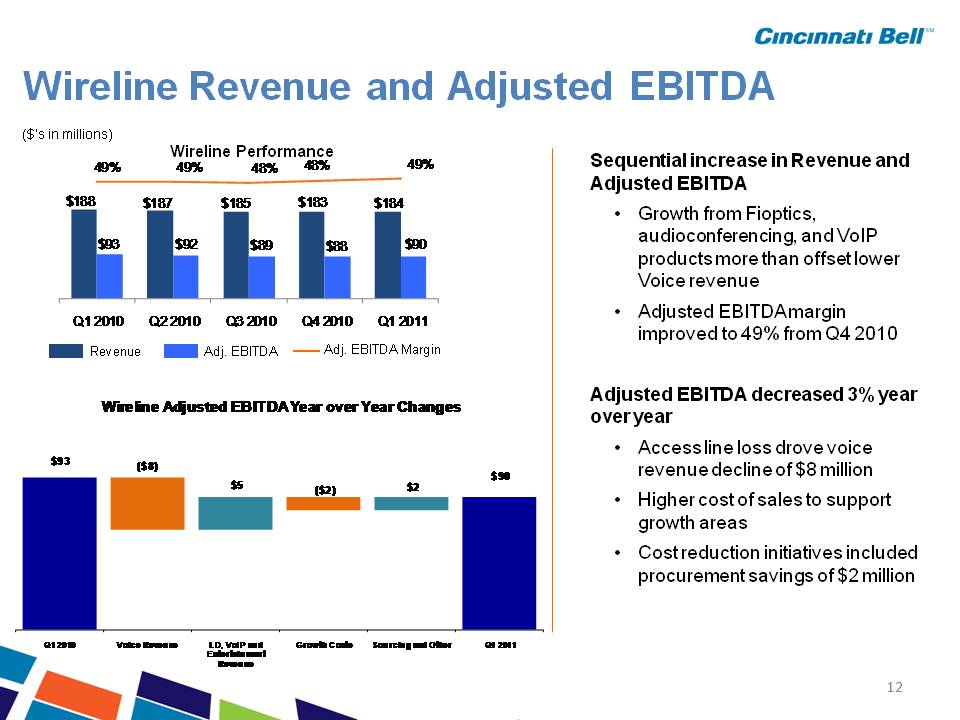
Wireline Revenue and Adjusted EBITDA Wireline Performance ($’s in millions) $188 $187 $185 $183 $184 49% 49% 48% 48% 49% Sequential increase in Revenue and Adjusted EBITDA $93 $92 $89 $88 $90 • Growth from Fioptics, audioconferencing, and VoIP products more than offset lower Voice revenue EBITDA Q1 2010 Q2 2010 Q3 2010 Q4 2010 Q1 2011 Revenue Adj. EBITDA Adj. EBITDA Margin Wireline Adjusted EBITDAYear over Year • Adjusted margin improved to 49% from Q4 2010 Adjusted EBITDA decreased 3% year $93 $90 ($8) $5 ($1) ($2) $3 EBITDA Year Changes over year • Access line loss decline drove voice revenue decline of $8 million • Higher cost of sales to support growth areas • Cost reduction initiatives included procurement savings of $2 million 12 Q1 2010 Voice Revenue LD, VoIP and Entertainment Other Revenue Growth Costs Sourcing, Headcount and Other Q1 2011 and headcount savings of $2 million
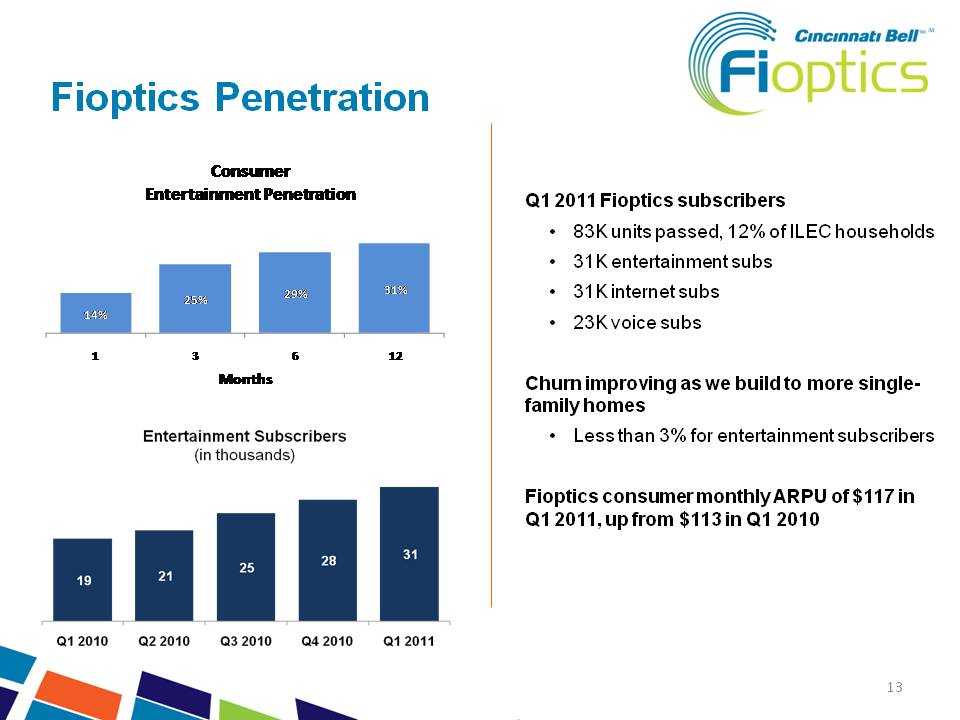
Fioptics Penetration Entertainment Penetration Q1 25% 29% 31% 2011 Fioptics subscribers • 83K units passed, 12% of ILEC households • 31K entertainment subs • 31K internet subs 14% 1 3 6 12 Months • 23K voice subs Churn improving as we build to more singlefamily homes family • Less than 3% for entertainment subscribers Fioptics consumer monthly ARPU of $117 in Q1 2011 $113 2011, up from in Q1 2010 13 Entertainment Subscribers (in thousands) 19 21 25 28 31 Q1 2010 Q2 Q3 Q4 Q1 2011
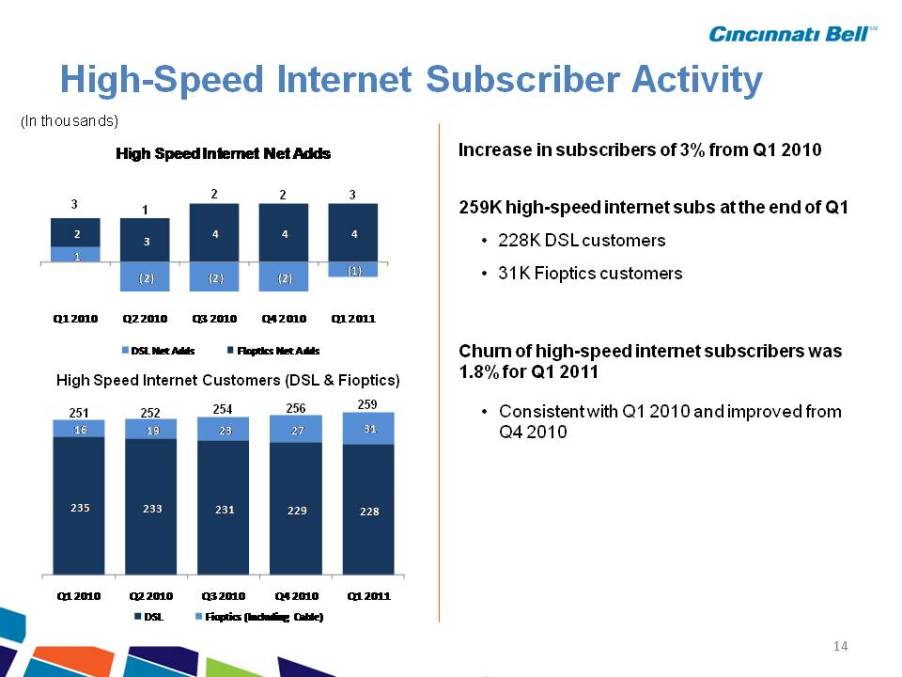
High-Speed Internet Subscriber Activity High Speed Internet Net Adds Increase in subscribers of 3% from Q1 2010 (In thousands) 2 2 3 1 (2) (2) (2) (1) 2 3 4 4 4 259K high-speed internet subs at the end of Q1 • 228K DSL customers • 31K Fioptics customers 3 1 High Speed Internet Customers (DSL & Fioptics) Q1 2010 Q2 2010 Q3 2010 Q4 2010 Q1 2011 DSL Net Adds Fioptics Net Adds Churn of high-speed internet subscribers was 1.8% for Q1 2011 High Speed Internet Customers DSL & Fioptics) 16 19 23 27 31 • Consistent with Q1 2010 and improved from Q4 2010 251 252 254 256 259 g p ( p ) 235 233 231 229 228 14 Q1 2010 Q2 2010 Q3 2010 Q4 2010 Q1 2011 DSL Fioptics (Including Cable)
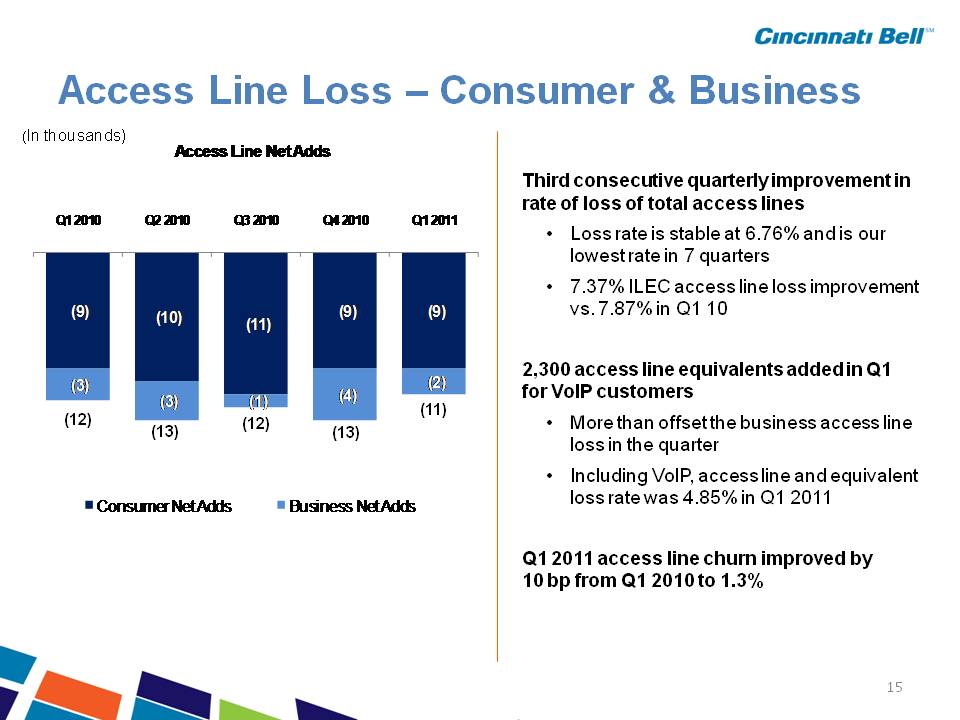
Access – Consumer Line Loss & Business Access Line Net Adds Total access lines lost were the fewest in 5 (In thousands) (9 3) (9 0) (8 8) Q1 2010 Q2 2010 Q3 2010 Q4 2010 Q1 2011 years • Loss rate is stable at 6.8% and is our lowest rate in 7 quarters • 7.4% ILEC access line loss improvement vs 7 9%9.3) (10.0) (10.7) 9.0) 8.8) (2.5) (2.7) (1.4) (3.8) (1.7) vs. 7.9% in Q1 10 2,300 access line equivalents added in Q1 for VoIP customers ( 10.5) Consumer Net Adds Business Net Adds • More than offset the business access line loss in the quarter • Including VoIP, access line and equivalent loss rate was 4.9% in Q1 2011 (11.8) (12.7) (12.1) (12.8) Q1 2011 access line churn improved by 10 bp from Q1 2010 to 1.3% 15
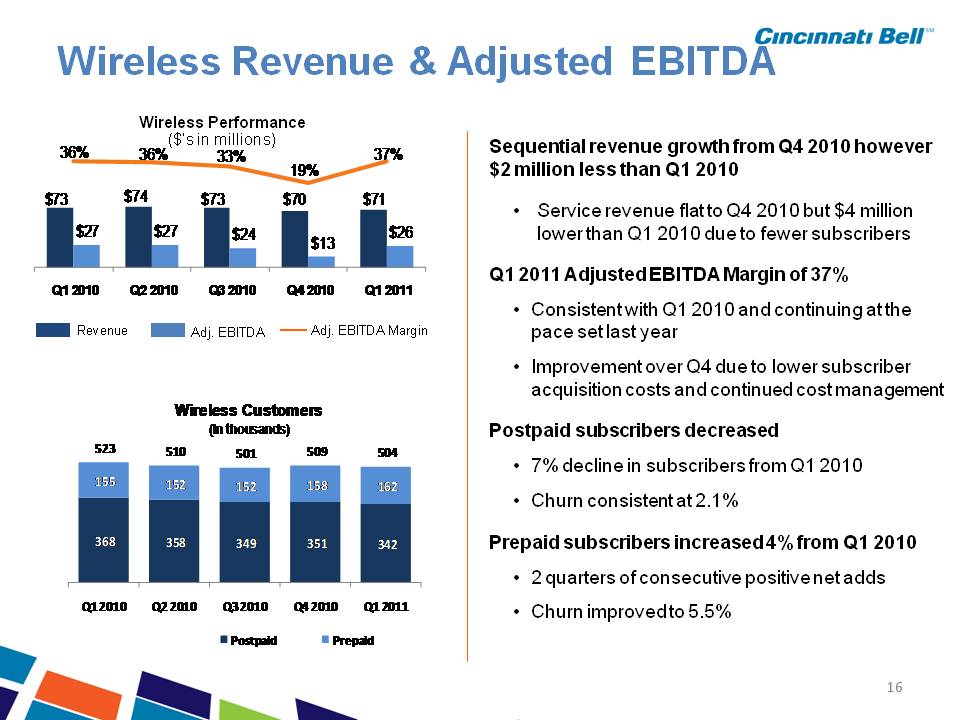
Wireless Revenue & Adjusted EBITDA Wireless Performance ($’s in millions) $ 73 $74 $ 73 $ 70 $ 71 36% 36% 33% 19% 37% Sequential revenue growth from Q4 2010 however $2 million less than Q1 2010 Q4 2010 $27 $27 $24 $13 $26 Q1 2010 Q2 2010 Q3 2010 Q4 2010 Q1 2011 • Service revenue flat to but $4 million lower than Q1 2010 due to fewer subscribers Q1 2011 Adjusted EBITDA Margin of 37% • Consistent with Q1 Revenue Adj. EBITDA Adj. EBITDA Margin 2010 and continuing at the pace set last year • Improvement over Q4 due to lower subscriber acquisition costs and continued cost management 155 152 152 158 162 523 510 501 509 504 Wireless Customers (In thousands) Postpaid subscribers decreased • 7% decline in subscribers from Q1 2010 • Churn consistent at 2.1% 368 358 349 351 342 • Postpaid ARPU holding at $49 with more data plans and data usage Prepaid subscribers increased 4% from Q1 2010 16 Q1 2010 Q2 2010 Q3 2010 Q4 2010 Q1 2011 Postpaid Prepaid • 2 quarters of consecutive positive net adds • Churn improved to 5.5%
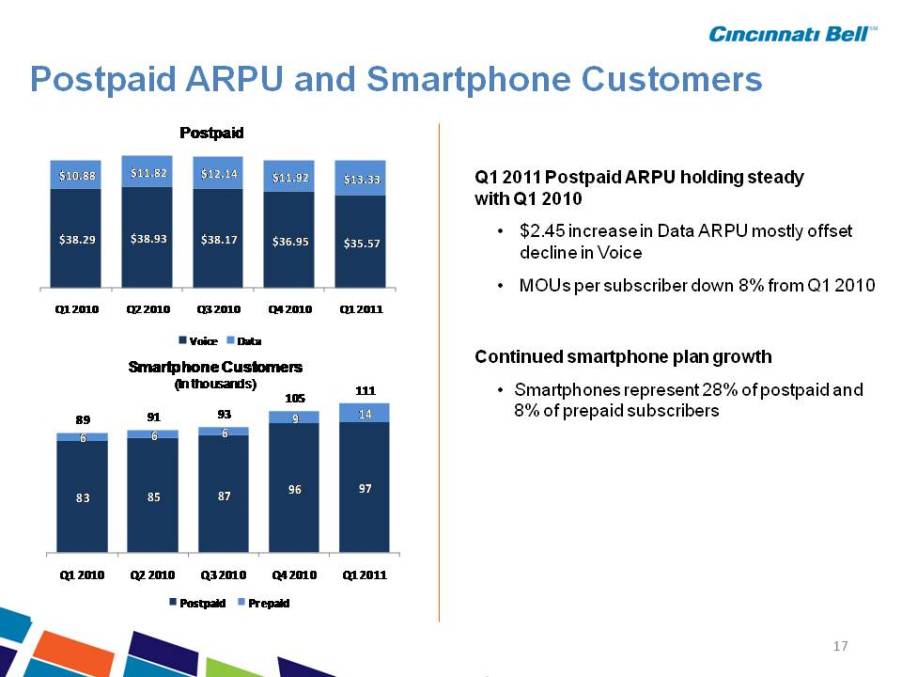
Postpaid ARPU and Smartphone Customers Q1 2011 Postpaid ARPU holding steady Q1 2010 $10.88 $11.82 $12.14 $11.92 $13.33 Postpaid with • $2.45 increase in Data ARPU mostly offset decline in Voice • MOUs per subscriber $38.29 $38.93 $38.17 $36.95 $35.57 down 8% from Q1 2010 Continued smartphone plan growth Smartphones represent 28% of postpaid and Q1 2010 Q2 2010 Q3 2010 Q4 2010 Q1 2011 Voice Data 111 Smartphone Customers (In thousands) • 8% of prepaid subscribers 6 6 6 9 14 89 91 93 105 83 85 87 96 97 Q1 2010 Q2 2010 Q3 2010 Q4 2010 Q1 2011 17 Postpaid Prepaid
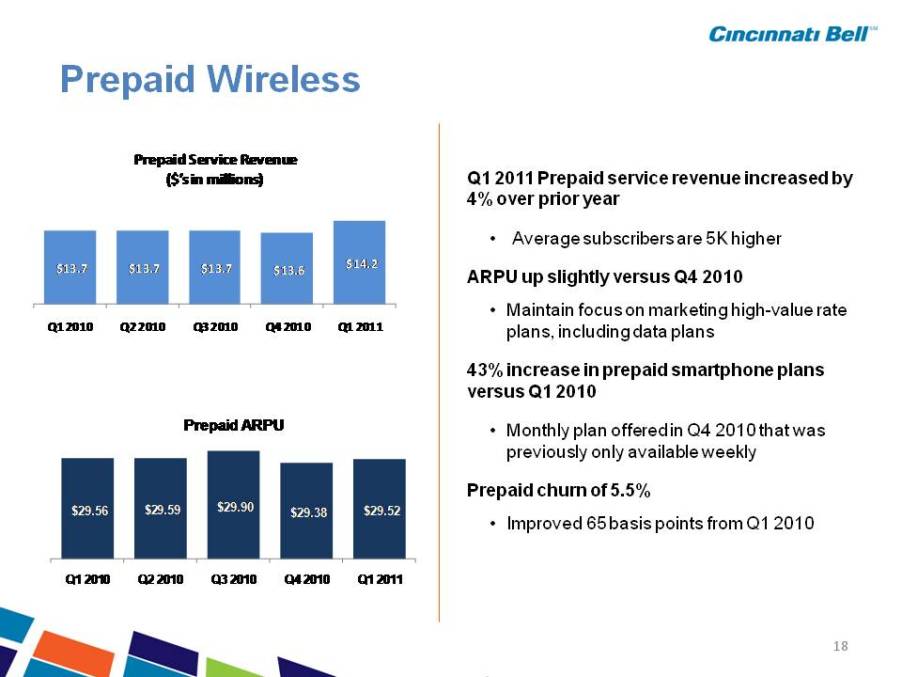
Prepaid Wireless Prepaid Service Revenue ($’s in millions) Q1 2011 Prepaid service revenue increased by 4% $13.7 $13.7 $13.7 $13.6 $14.2 over prior year • Average subscribers are 5K higher ARPU up slightly versus Q4 2010 Q1 2010 Q2 2010 Q3 2010 Q4 2010 Q1 2011 • Maintain focus on marketing high-value rate plans, including data plans 43% increase in prepaid smartphone plans Q1 Prepaid ARPU versus 2010 • Monthly plan offered in Q4 2010 that was previously only available weekly $29.56 $29.59 $29.90 $29.38 $29.52 2010 2010 2010 Q4 Q1 Prepaid churn of 5.5% • Improved 65 basis points from Q1 2010 18 Q1 Q2 Q3 2010 2011
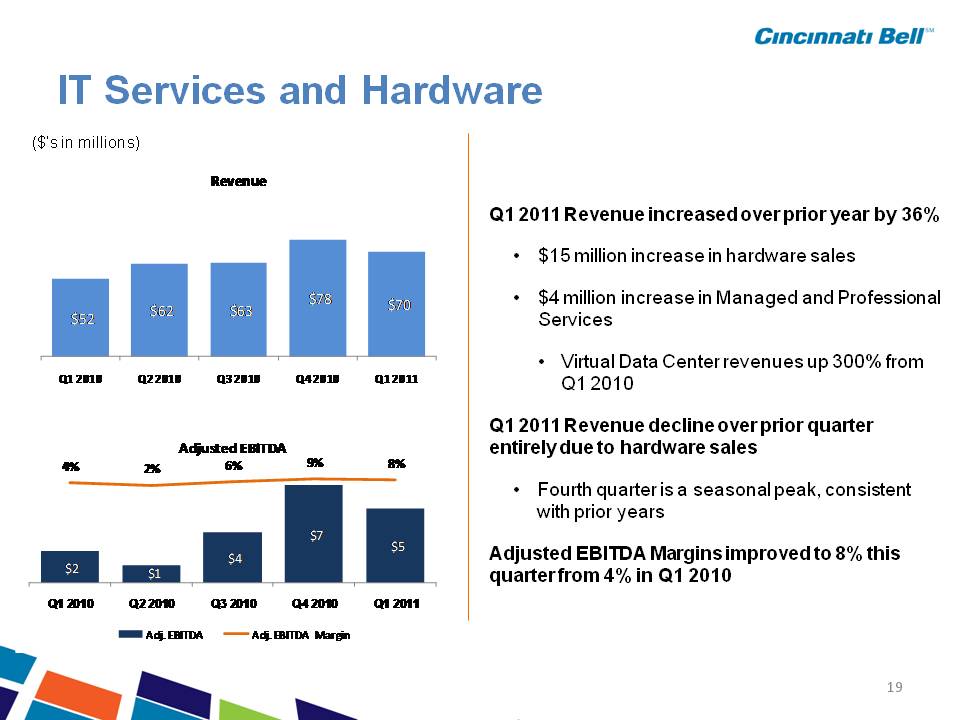
IT Hardware Services and Revenue $62 3 $62 6 $78.2 $70 3 Q1 2011 Revenue increased over prior year by 36% • $15 million increase in hardware sales • $4 million increase in Managed and Professional $51.6 62.3 62.6 70.3 Q1 2010 Q2 2010 Q3 2010 Q4 2010 Q1 2011 Services • Virtual Data Center revenues up 300% from Q1 2010 4% 2% 6% 9% 8% Adjusted EBITDA Q1 2011 Revenue decline over prior quarter entirely due to hardware sales • Fourth quarter is a seasonal peak, consistent with prior $2.3 $1.3 $3.7 $7.1 $5.4 Q1 2010 Q2 2010 Q3 2010 Q4 2010 Q1 2011 years Adjusted EBITDA Margins improved to 8% this quarter from 4% in Q1 2010 19 Adj. EBITDA Adj. EBITDA Margin

Gary Wojtaszek Chief Financial Officer
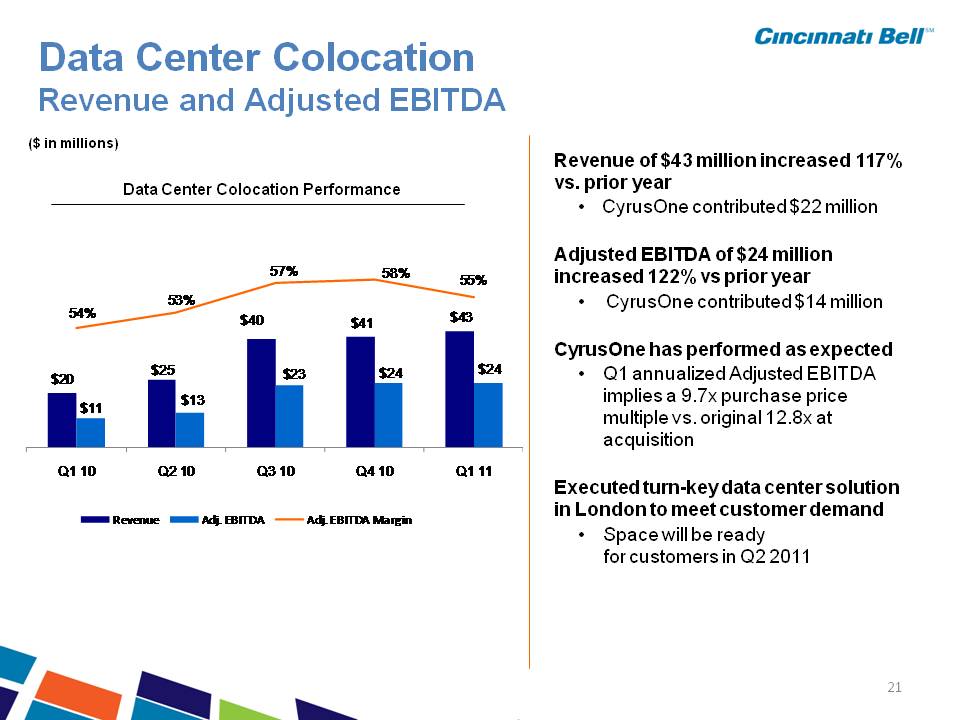
Data Center Colocation Revenue and Adjusted Revenue of $43 million increased 117% vs. prior year • CyrusOne contributed $22 million Data Center Colocation Performance ($ in millions) EBITDA Adjusted EBITDA of $24 million increased 122% vs prior year • CyrusOne contributed $ 14 million 4% 53% 57% 58% 55% y CyrusOne has performed as expected • Q1 annualized Adjusted EBITDA implies a 9.7x purchase price $20 $25 $40 $41 $43 $11 $13 $23 $24 $24 54% multiple vs. original 12.8x at acquisition Executed turn-key data center solution London to meet customer demand Q1 10 Q2 10 Q3 10 Q4 10 Q1 11 in • Space will be ready for customers in Q2 2011 Revenue Adj. EBITDA Adj. EBITDA Margin 21
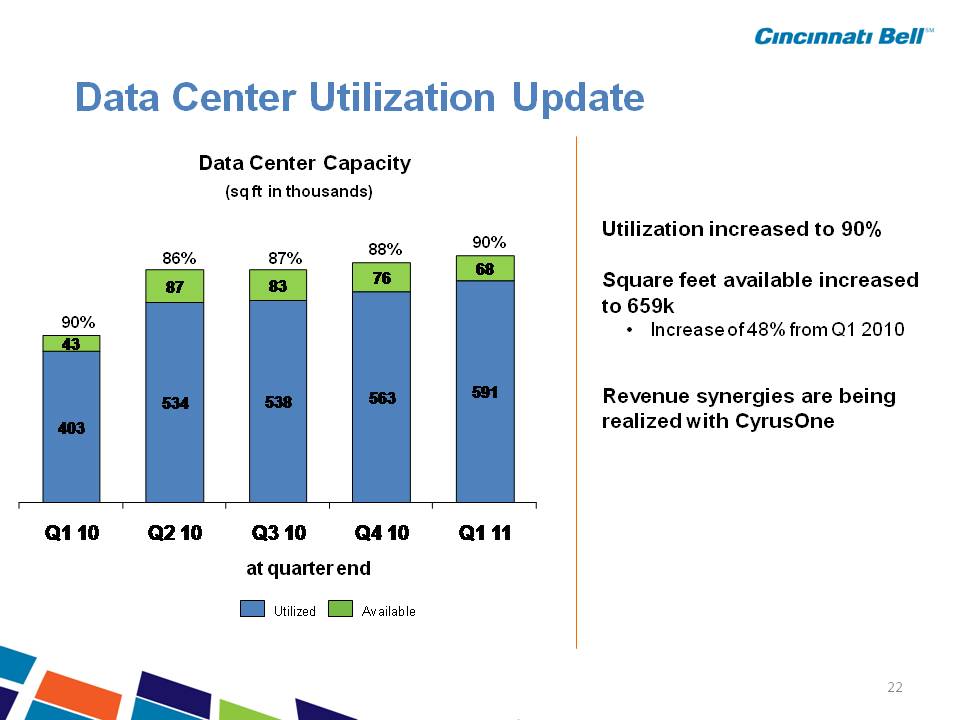
Data Utilization Update Data Center Capacity (sq ft in thousands) Utilization increased to 89% Square feet available increased 659k 88% 86% 89% 87% to • Increase of 48% from Q1 2010 Revenue synergies are being 90% realized with CyrusOne at quarter end Utilized Available 22
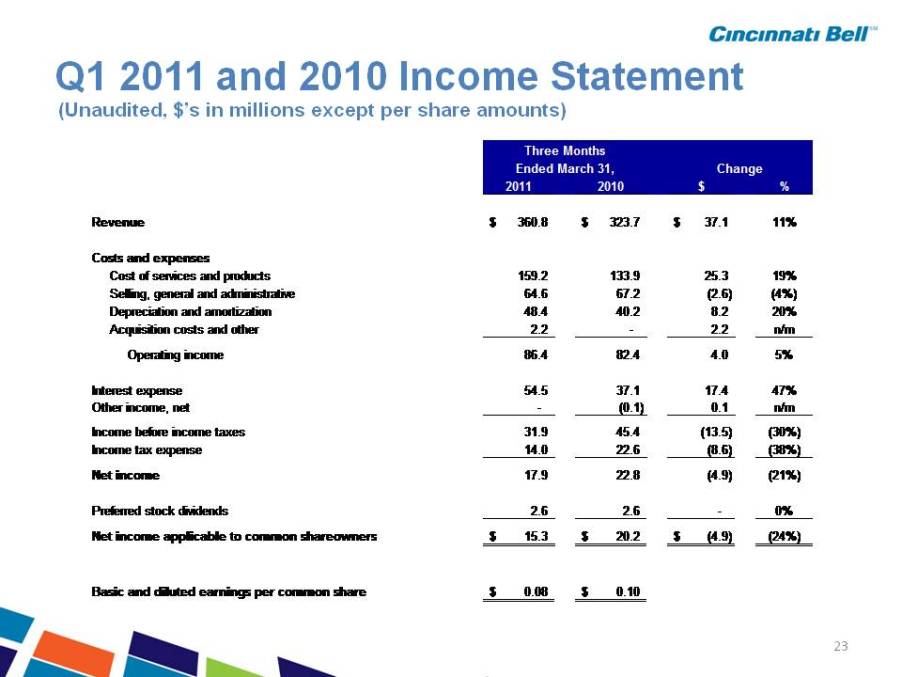
Q1 2011 and 2010 Income Statement (Unaudited, $’s in millions except per share amounts) 2011 2010 $ % Three Months Ended March 31, Change Revenue 360.8 $ 323.7 $ 37.1 $ 11% Costs and expenses Cost of services and products 159.2 133.9 25.3 19% 64 6 67 2 (2 6) (4%) Selling, general and administrative 64.6 67.2 2.6) Depreciation and amortization 48.4 40.2 8.2 20% Acquisition costs and other 2.2 - 2.2 n/m Operating income 86.4 82.4 4.0 5% I t t 54 5 37 1 17 4 47% Interest expense 54.5 37.1 17.4 Other income, net - (0.1) 0.1 n/m Income before income taxes 31.9 45.4 (13.5) (30%) Income tax expense 14.0 22.6 (8.6) (38%) Net income 17.9 22.8 (4.9) (21%) Preferred stock dividends 2.6 2.6 - 0% Net income applicable to common shareowners 15.3 $ 20.2 $ (4.9) $ (24%) 23 Basic and diluted earnings per common share 0.08 $ 0.10 $
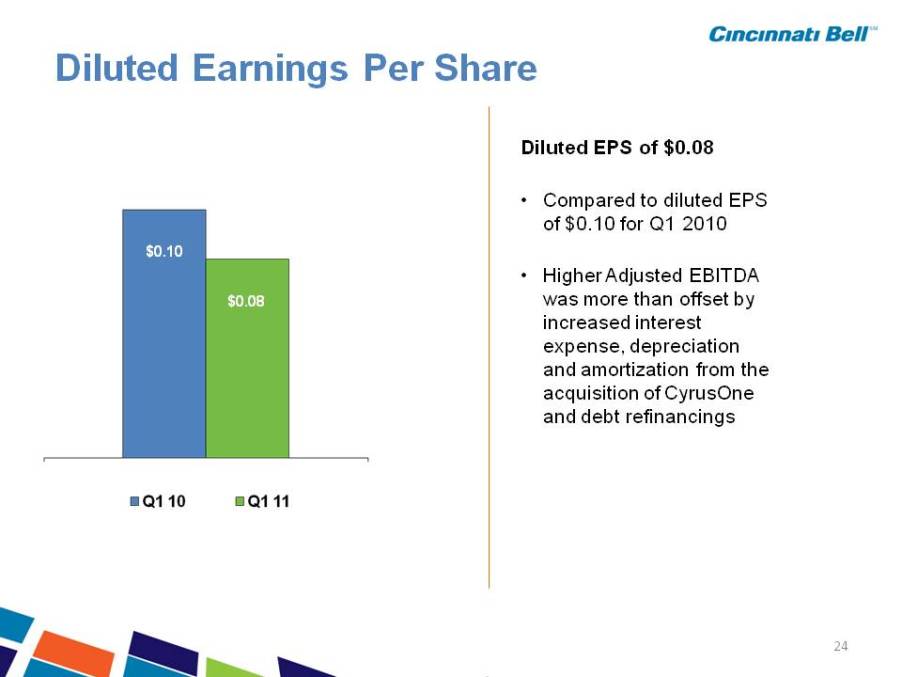
Diluted Earnings Per Share Diluted EPS of $0.08 $0.10 • Compared to diluted EPS of $0.10 for Q1 2010 • Higher Adjusted EBITDA $0.08 was more than offset by increased interest expense, depreciation and amortization from the acquisition of CyrusOne and debt refinancing 24 $0.10 $0.08 Q1 10 Q1 11
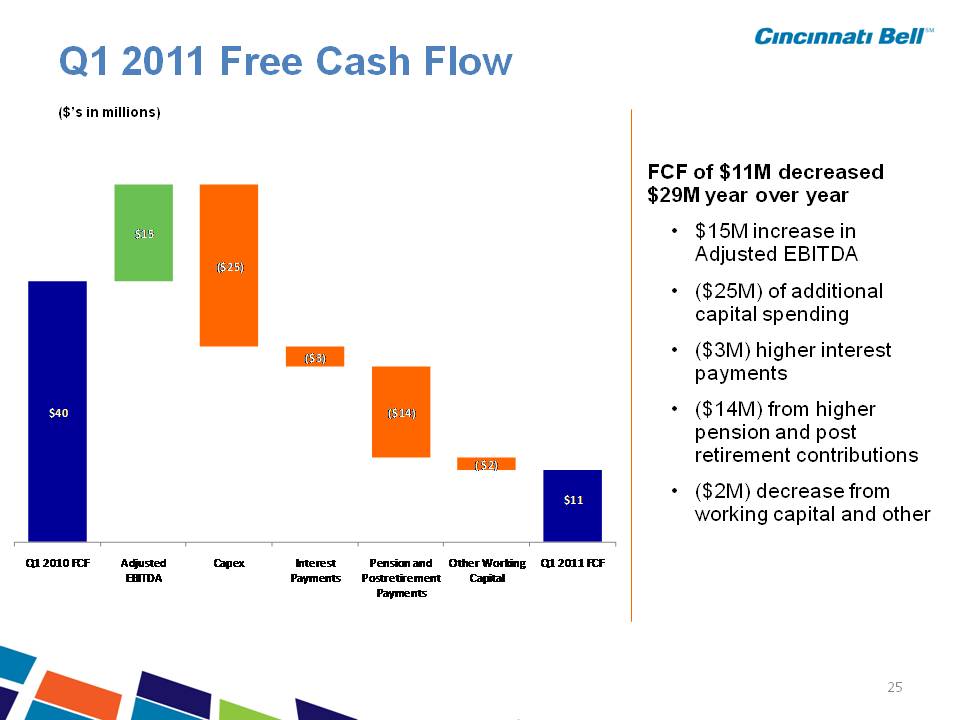
Q1 2011 Free Cash Flow FCF of $11M decreased $29M year over year ($’s in millions) • $15M increase in Adjusted EBITDA • ($25M) of additional $15 $25 capital spending • ($3M) higher interest payments • $40 $3 $ 14 ($14M) from higher pension and post retirement contributions • ($2M) decrease from $11 $2 working capital and other Q1 2010 FCF Adjusted EBITDA Capex Interest Payments Pension and Postretirement Payments Other Working Capital Q1 2011 FCF 25
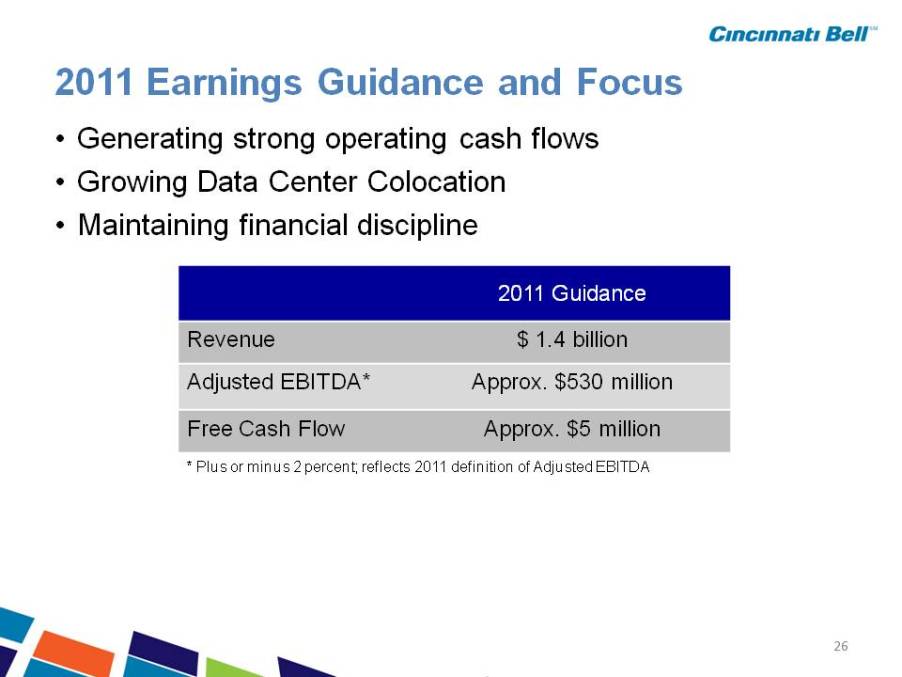
2011 Earnings Guidance and Focus • Generating strong operating cash flows • Growing Data Center Colocation • Maintaining financial discipline 2011 Guidance Revenue $ 1.4 billion EBITDA* Approx $530 Adjusted EBITDA Approx. million Free Cash Flow Approx. $5 million * Plus or minus 2 percent; reflects 2011 definition of Adjusted EBITDA 26