Attached files
| file | filename |
|---|---|
| 8-K - ARMSTRONG WORLD INDUSTRIES INC | awi8k.htm |
| EX-99.1 - PRESS RELEASE DATED MAY 2, 2011 - ARMSTRONG WORLD INDUSTRIES INC | exhibit.htm |

Armstrong World Industries
Earnings Call Presentation
First Quarter 2011
May 2, 2011
2
Safe Harbor Statement
This presentation contains “forward-looking statements” related to Armstrong
World Industries, Inc.’s, future financial performance. Our results could differ
materially from the results discussed in these forward-looking statements due to
known and unknown risks and uncertainties. A more detailed discussion of the
risks and uncertainties that may affect our ability to achieve the projected
performance is included in the “Risk Factors” and “Management’s Discussion
and Analysis” sections of our recent reports on Forms 10-K and 10-Q filed with
the SEC. We undertake no obligation to update any forward-looking statement
beyond what is required by applicable securities law.
In addition, we will be referring to non-GAAP financial measures within the
meaning of SEC Regulation G. A reconciliation of the differences between these
measures with the most directly comparable financial measures calculated in
accordance with GAAP is available on the Investor Relations page of our
website at www.armstrong.com.
meaning of SEC Regulation G. A reconciliation of the differences between these
measures with the most directly comparable financial measures calculated in
accordance with GAAP is available on the Investor Relations page of our
website at www.armstrong.com.
3
Key Metrics - First Quarter 2011 Adjusted (1)
Financial Overview
(1) Figures exclude non-recurring items such as charges for cost reduction initiatives, restructuring, etc. Figures also exclude the impact of foreign exchange
movements.
movements.
(2) As reported Net Sales: $685 million in 2011 and $659 million in 2010.
(3) As reported Operating Income: $52 million in 2011 and $13 million in 2010
(4) As reported EPS: $0.23 in 2011 and ($0.34) in 2010.
(5) Earnings per share reflect an adjusted tax rate of 42% for both 2011 and 2010.
(6) Total cash in 2011 of $244 million was comprised of $133 million in domestic cash and $111 million in foreign cash. Total cash in 2010 of $526 million
was comprised of $308 million in domestic cash and $218 million in foreign cash. Total debt was $849 million in 2011 and $467 million in 2010.
was comprised of $308 million in domestic cash and $218 million in foreign cash. Total debt was $849 million in 2011 and $467 million in 2010.
All figures in $ millions unless otherwise noted. Figures may not add due to rounding.
|
|
2011
Actual
|
2010
Actual
|
Variance
|
|
Net Sales (2)
|
$681
|
$659
|
3.3%
|
|
Operating Income (3)
|
66
|
27
|
144.4%
|
|
% of Sales
|
9.7%
|
4.1%
|
560 bps
|
|
EBITDA
|
93
|
55
|
69.1%
|
|
% of Sales
|
13.7%
|
8.3%
|
530 bps
|
|
Earnings Per Share (4), (5)
|
$0.51
|
$0.24
|
$0.27
|
|
Free Cash Flow
|
(44)
|
(30)
|
(14)
|
|
Net (Cash) Debt (6)
|
604
|
(59)
|
663
|
4
Q1 2011 - Adjusted EBITDA to
Reported Net Income
Reported Net Income
Financial Overview
All figures in $ millions unless otherwise noted. Figures may not add due to rounding.
(1) Figures exclude non-recurring items such as charges for cost reduction initiatives, restructuring, etc. Figures also exclude the impact of foreign
exchange movements.
exchange movements.
|
|
2011
|
2010
|
V
|
|
EBITDA- Adjusted (1)
|
$93
|
$55
|
$38
|
|
Depreciation and Amortization
|
(27)
|
(28)
|
1
|
|
Operating Income - Adjusted (1)
|
$66
|
$27
|
$39
|
|
Foreign Exchange Movements
|
1
|
(1)
|
2
|
|
Cost Reduction Initiatives
|
(5)
|
(2)
|
(3)
|
|
Accelerated Depreciation (not included above)
|
(5)
|
-
|
(5)
|
|
Restructuring
|
(5)
|
-
|
(5)
|
|
Executive Transition
|
-
|
(11)
|
11
|
|
Operating Income - As Reported
|
$52
|
$13
|
$39
|
|
Interest (Expense) Income
|
(14)
|
(3)
|
(11)
|
|
EBT
|
$38
|
$10
|
$28
|
|
Healthcare Reform- Medicare Subsidy Elimination
|
-
|
(22)
|
22
|
|
Tax (Expense) Benefit
|
(24)
|
(7)
|
(17)
|
|
Net Income
|
$14
|
($19)
|
$33
|
5
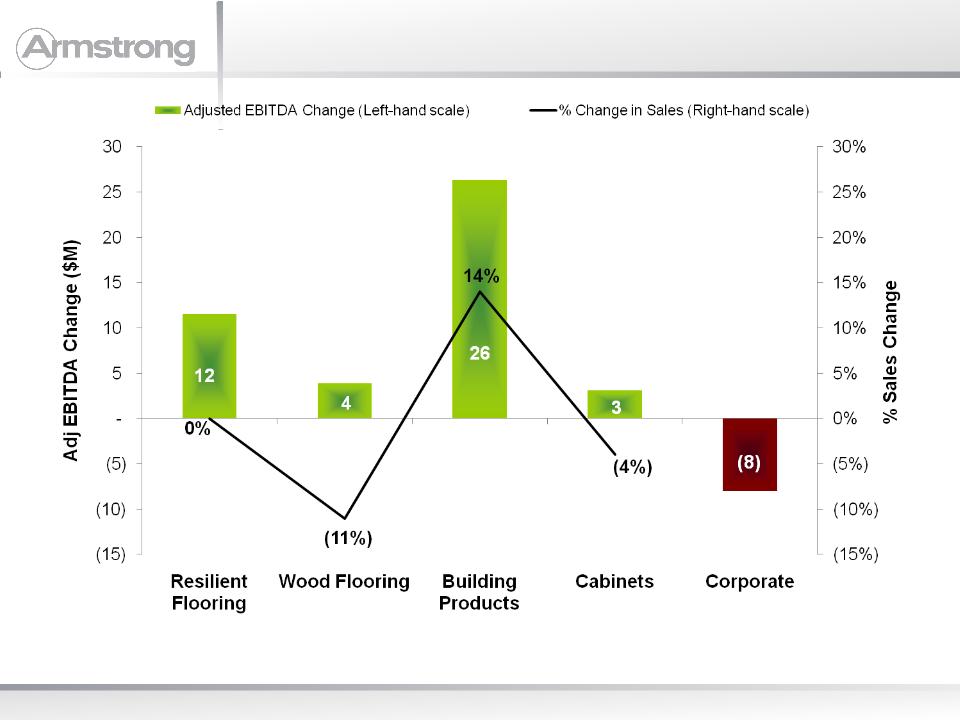
Q1 Sales and Adjusted EBITDA (1) by
Segment - 2011 vs. 2010
Segment - 2011 vs. 2010
Financial Overview
All figures in $ millions unless otherwise noted. Figures may not add due to rounding.
(1) Figures exclude non-recurring items such as charges for cost reduction initiatives, restructuring, etc. Figures also exclude the impact of foreign
exchange movements.
exchange movements.
6
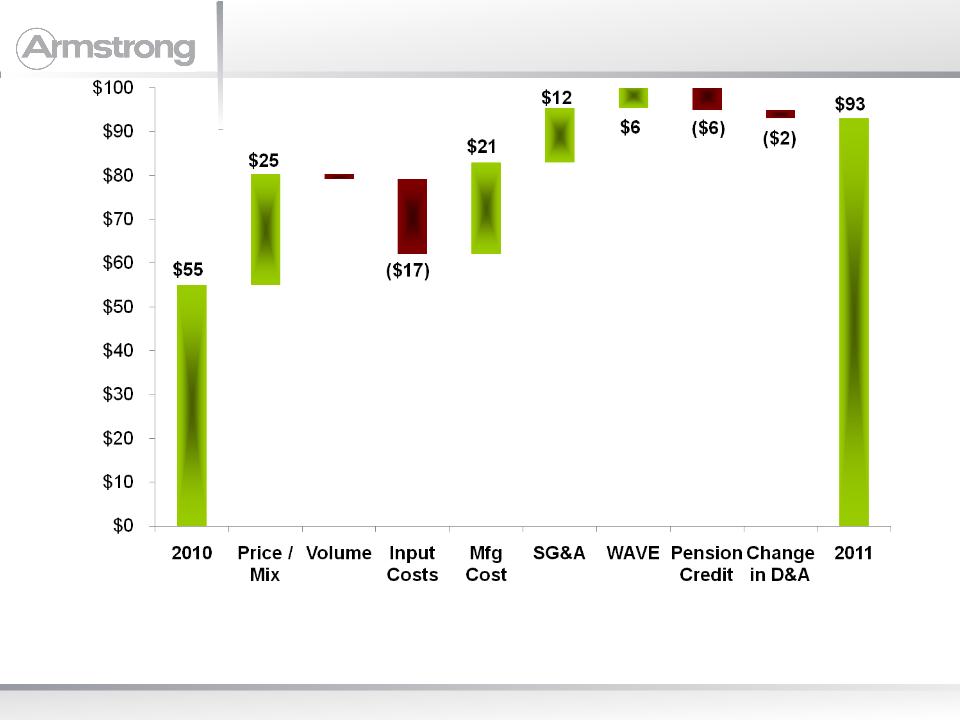
Adjusted EBITDA(1) Bridge -
Q1 2011 versus Prior Year
Q1 2011 versus Prior Year
Financial Overview
All figures in $ millions unless otherwise noted. Figures may not add due to rounding.
(1) Figures exclude non-recurring items such as charges for cost reduction initiatives, restructuring, etc. Figures also exclude the impact of foreign
exchange movements.
exchange movements.
($1)
7
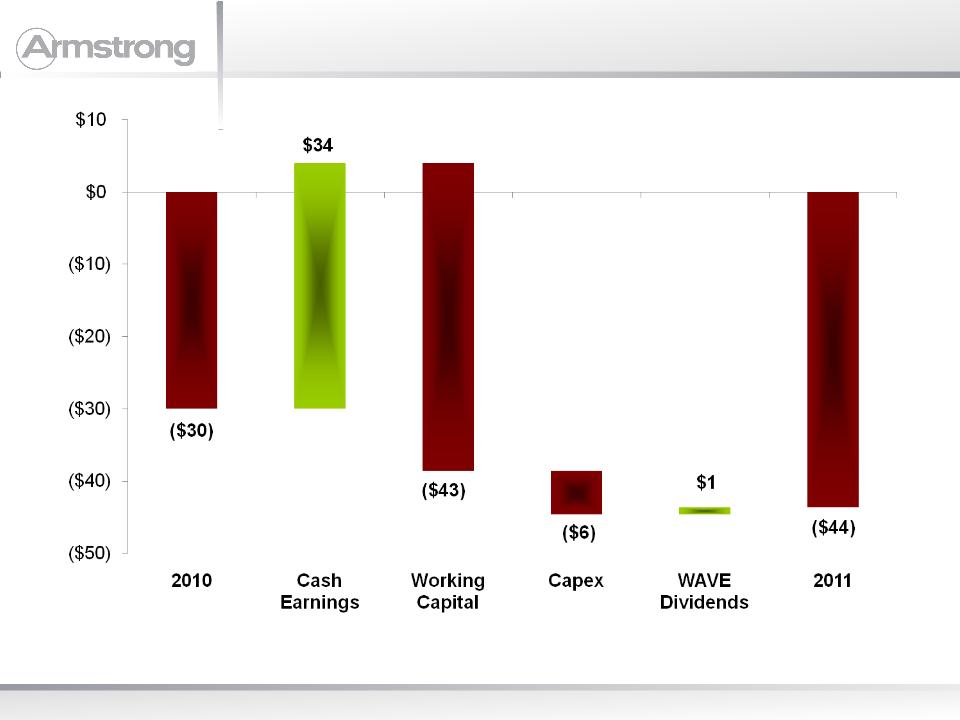
Free Cash Flow - First Quarter 2011
versus Prior Year
versus Prior Year
Financial Overview
All figures in $ millions unless otherwise noted. Figures may not add due to rounding.
8
Key Metrics (1) - Guidance
2011
2011
Financial Overview
All figures in $ millions unless otherwise noted.
|
|
2011
Estimate Range
|
|
2010
|
|
Variance
|
||||
|
Net Sales
|
2,800
|
to
|
3,000
|
|
2,766
|
|
1%
|
to
|
8%
|
|
Operating Income(2)
|
270
|
to
|
310
|
|
189
|
|
43%
|
to
|
64%
|
|
EBITDA
|
375
|
to
|
415
|
|
303
|
|
24%
|
to
|
37%
|
|
Earnings Per Share(3),(4)
|
$2.17
|
to
|
$2.57
|
|
$1.73
|
|
25%
|
to
|
49%
|
|
Free Cash Flow
|
80
|
to
|
120
|
|
180
|
|
(56%)
|
to
|
(33%)
|
(1) Figures exclude non-recurring items such as charges for cost reduction initiatives, restructuring, etc.
(2) As reported Operating Income: $240- 280 million in 2011 and $81 million 2010.
(3) Earnings per share reflect an adjusted tax rate of 42% for both 2011 and 2010.
(4) As reported earnings per share: $1.83 - $2.25 in 2011 and $0.19 in 2010.
9
2011 Financial Outlook
Financial Overview
¾ Raw Material & Energy Inflation* $40 - $50 million increase
¾ Manufacturing Productivity* Gross Margin +125 to +225 bps vs. 2010
¾ U.S. Pension Credit ~$25 million, down ~$25 million vs. 2010
60% manufacturing, 40% SG&A
60% manufacturing, 40% SG&A
¾ Earnings from WAVE $5 - $10 million vs. 2010
¾ Cash Taxes/ETR ~$15 million. Adjusted ETR of 42%
¾ Q2 Sales $740 - $790 million
EBITDA $105 - $120 million
EBITDA $105 - $120 million
¾ Capital Spending ~$180-$200 million
¾ Exclusions from EBITDA ~$18 - 27 million associated with already
announced actions
announced actions
* Changed from February Outlook

10
Appendix
11
Adjusted Operating Income to Free Cash Flow
Financial Overview Appendix
All figures in $ millions unless otherwise noted.
|
|
2011
Estimate Range
|
||
|
Adjusted Operating Income
|
270
|
to
|
310
|
|
D&A
|
105
|
||
|
Adjusted EBITDA
|
375
|
to
|
415
|
|
Changes in Working Capital
|
5
|
to
|
25
|
|
Capex
|
(180)
|
to
|
(200)
|
|
Pension Credit
|
(25)
|
||
|
Interest Expense
|
(50)
|
||
|
Cash Taxes
|
(15)
|
||
|
Other, including cash payments for
restructuring and one-time items |
(30)
|
||
|
Free Cash Flow
|
80
|
to
|
120
|
12
Consolidated Results
Financial Overview Appendix
All figures in $ millions unless otherwise noted. Figures may not add due to rounding.
(1) See earnings press release and 10-Qfor additional detail on comparability adjustments
(2) Eliminates impact of foreign exchange movements
|
First Quarter
|
||||||||
|
|
2011
Reported |
Comparability(1)
Adjustments
|
FX(2) Adj
|
2011
Adjusted |
2010
Reported |
Comparability(1)
Adjustments
|
FX(2) Adj
|
2010
Adjusted |
|
Net Sales
|
685
|
-
|
(4)
|
681
|
659
|
-
|
-
|
659
|
|
Operating Income
|
52
|
15
|
(1)
|
66
|
13
|
14
|
-
|
27
|
|
EPS
|
$0.23
|
$0.30
|
($0.02)
|
$0.51
|
($0.34)
|
$0.58
|
$ -
|
$0.24
|
13
Segment Operating Income (Loss)
Financial Overview Appendix
All figures in $ millions unless otherwise noted. Figures may not add due to rounding.
(1) Eliminates impact of foreign exchange movements and non-recurring items; see earnings press release and 10-Q for additional detail.
|
First Quarter
|
||||||
|
|
2011
Reported |
Comparability(1)
Adjustments |
2011 Adjusted
|
2010
Reported |
Comparability(1)
Adjustments |
2010 Adjusted
|
|
Resilient Flooring
|
(1)
|
8
|
7
|
(5)
|
-
|
(5)
|
|
Wood Flooring
|
3
|
-
|
3
|
(2)
|
-
|
(2)
|
|
Building Products
|
61
|
7
|
68
|
43
|
(1)
|
42
|
|
Cabinets
|
(1)
|
-
|
(1)
|
(4)
|
-
|
(4)
|
|
Unallocated Corporate
(Expense) Income |
(10)
|
(1)
|
(11)
|
(19)
|
15
|
(4)
|
|
|
||||||
14
Cash Flow
Financial Overview Appendix
All figures in $ millions unless otherwise noted. Figures may not add due to rounding.
|
|
First Quarter
|
|
|
($-millions)
|
2011
|
2010
|
|
Net Cash From Operations
|
(36)
|
(28)
|
|
Plus / (Minus) Net Cash from Investing
|
(8)
|
(2)
|
|
Equals Free Cash Flow
|
(44)
|
(30)
|
