Attached files
| file | filename |
|---|---|
| EX-99.1 - EX-99.1 - TRIMAS CORP | a11-10937_2ex99d1.htm |
| 8-K - 8-K - TRIMAS CORP | a11-10937_28k.htm |
Exhibit 99.2
|
|
First Quarter 2011 Earnings Presentation April 28, 2011 |
|
|
Safe Harbor Statement Any “forward-looking” statements contained herein, including those relating to market conditions or the Company’s financial condition and results, expense reductions, liquidity expectations, business goals and sales growth, involve risks and uncertainties, including, but not limited to, risks and uncertainties with respect to general economic and currency conditions, various conditions specific to the Company’s business and industry, the Company’s substantial leverage, liabilities imposed by the Company’s debt instruments, market demand, competitive factors, the Company’s ability to maintain compliance with the listing requirements of NASDAQ, supply constraints, material and energy costs, technology factors, litigation, government and regulatory actions, the Company’s accounting policies, future trends, and other risks which are detailed in the Company’s Annual Report on Form 10-K for the fiscal year ended December 31, 2010, and in the Company’s Quarterly Reports on Form 10-Q. These risks and uncertainties may cause actual results to differ materially from those indicated by the forward-looking statements. All forward-looking statements made herein are based on information currently available, and the Company assumes no obligation to update any forward-looking statements. 2 |
|
|
Agenda Opening Remarks Financial Highlights Segment Highlights Outlook and Summary Questions and Answers Appendix 3 |
|
|
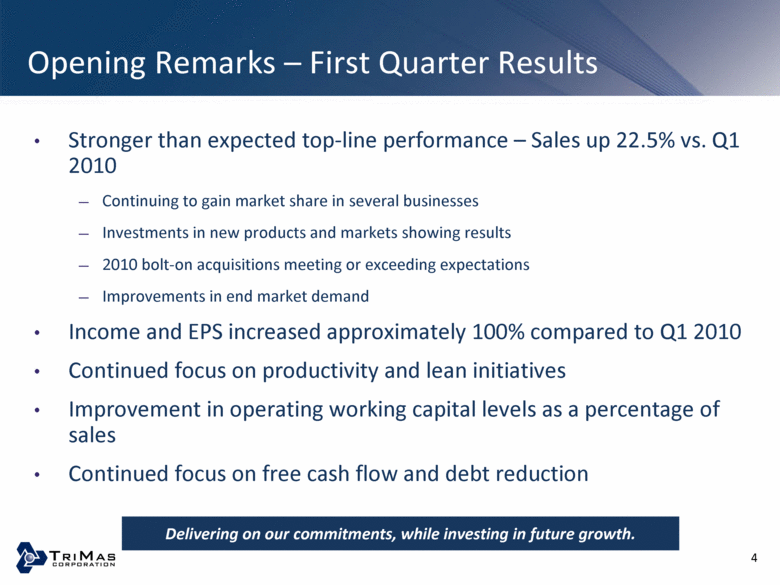
Opening Remarks – First Quarter Results Stronger than expected top-line performance – Sales up 22.5% vs. Q1 2010 Continuing to gain market share in several businesses Investments in new products and markets showing results 2010 bolt-on acquisitions meeting or exceeding expectations Improvements in end market demand Income and EPS increased approximately 100% compared to Q1 2010 Continued focus on productivity and lean initiatives Improvement in operating working capital levels as a percentage of sales Continued focus on free cash flow and debt reduction Delivering on our commitments, while investing in future growth. 4 |
|
|
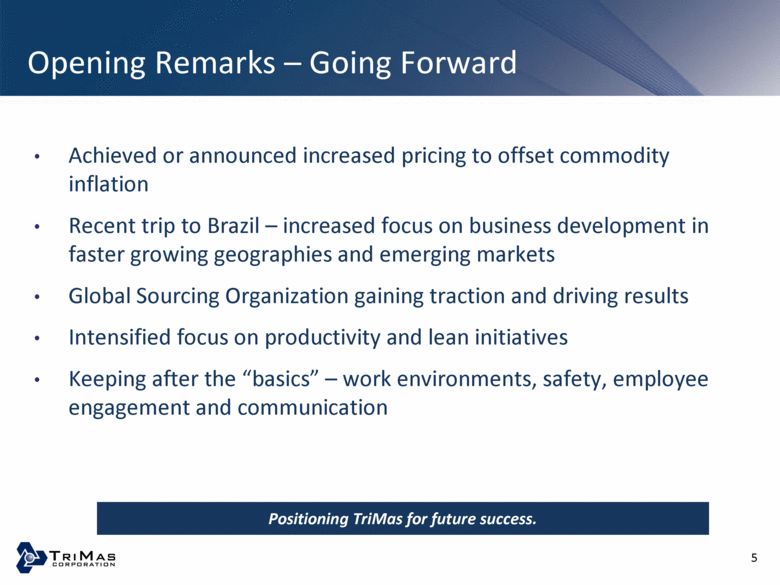
Opening Remarks – Going Forward Achieved or announced increased pricing to offset commodity inflation Recent trip to Brazil – increased focus on business development in faster growing geographies and emerging markets Global Sourcing Organization gaining traction and driving results Intensified focus on productivity and lean initiatives Keeping after the “basics” – work environments, safety, employee engagement and communication Positioning TriMas for future success. 5 Revenue 269.7 $220.1 22.5% Gross Profit 74.7 $63.1 18.4% Gross P rofit M argin 27.7% 28.7% -100 bps Operating Profit 30.0 $25.1 19.9% Operating Profit Margin 11.1% 11.4% -30 bps Income 11.8 $5.8 $104.3% Diluted earnings per share 0.34 $0.17 100.0% Free Cash Flow(1) (33.8) $(6.7) unfav Debt and A/R Securitization 495.6 $518.5 -4.4% |
|
|
Financial Highlights |
|
|
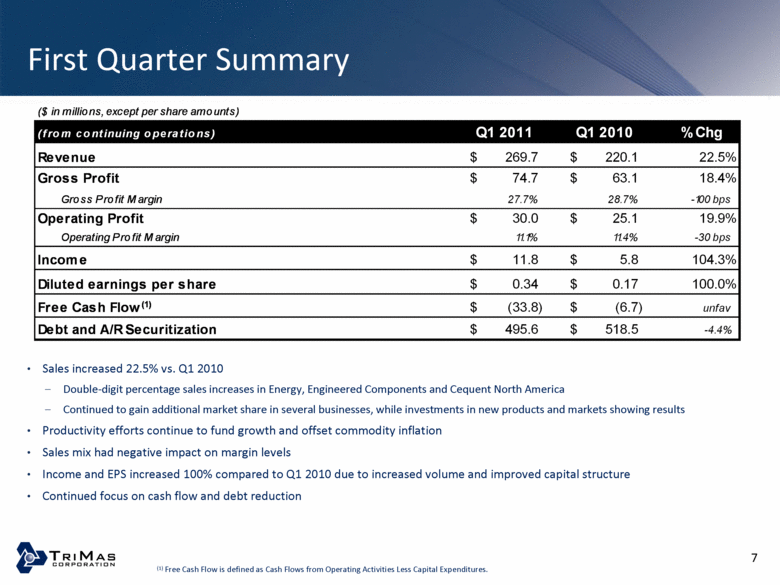
First Quarter Summary Sales increased 22.5% vs. Q1 2010 Double-digit percentage sales increases in Energy, Engineered Components and Cequent North America Continued to gain additional market share in several businesses, while investments in new products and markets showing results Productivity efforts continue to fund growth and offset commodity inflation Sales mix had negative impact on margin levels Income and EPS increased 100% compared to Q1 2010 due to increased volume and improved capital structure Continued focus on cash flow and debt reduction (1) Free Cash Flow is defined as Cash Flows from Operating Activities Less Capital Expenditures. 7 (from continuing operations) Q1 2011 Q1 2010 % Chg Revenue $ 269.7 $ 220.1 22.5% Gross Profit $ 74.7 $ 63.1 18.4% Gross Profit Margin 27.7% 28.7% -100 bps Operating Profit $ 30.0 $ 25.1 19.9% Operating Profit Margin 11.1% 11.4% -30 bps Income $ 11.8 $ 5.8 104.3% Diluted earnings per share $ 0.34 $ 0.17 100.0% Free Cash Flow(1) $ (33.8) $ (6.7) unfav Debt and A/R Securitization $ 495.6 $ 518.5 -4.4% |
|
|
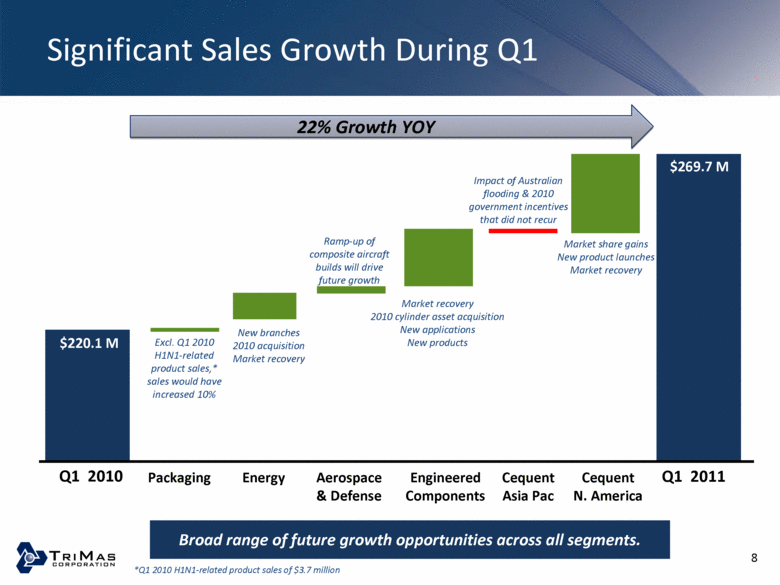
Significant Sales Growth During Q1 Q1 2010 Q1 2011 Broad range of future growth opportunities across all segments. 8 $220.1 M $269.7 M Packaging Aerospace & Defense Energy Engineered Components Cequent N. America Cequent Asia Pac Market share gains New product launches Market recovery Market recovery 2010 cylinder asset acquisition New applications New products New branches 2010 acquisition Market recovery 22% Growth YOY Excl. Q1 2010 H1N1-related product sales,* sales would have increased 10% Ramp-up of composite aircraft builds will drive future growth Impact of Australian flooding & 2010 government incentives that did not recur *Q1 2010 H1N1-related product sales of $3.7 million |
|
|
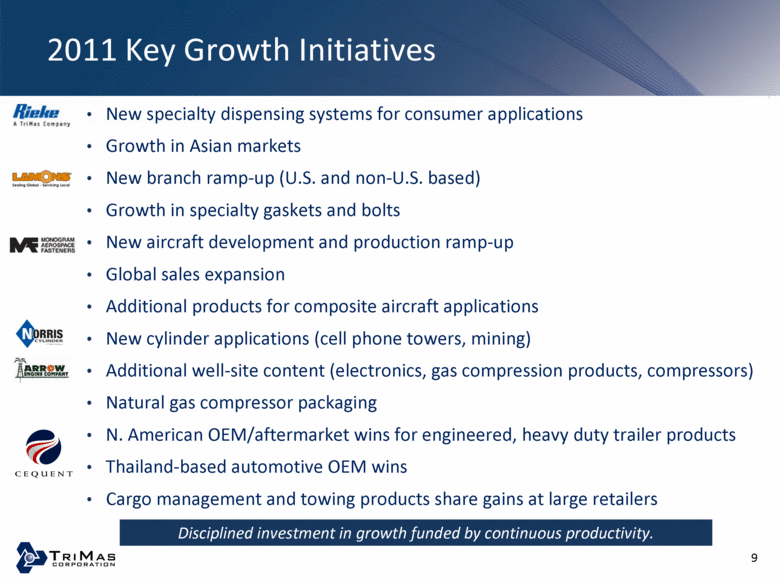
2011 Key Growth Initiatives New specialty dispensing systems for consumer applications Growth in Asian markets New branch ramp-up (U.S. and non-U.S. based) Growth in specialty gaskets and bolts New aircraft development and production ramp-up Global sales expansion Additional products for composite aircraft applications New cylinder applications (cell phone towers, mining) Additional well-site content (electronics, gas compression products, compressors) Natural gas compressor packaging N. American OEM/aftermarket wins for engineered, heavy duty trailer products Thailand-based automotive OEM wins Cargo management and towing products share gains at large retailers Disciplined investment in growth funded by continuous productivity. 9 |
|
|
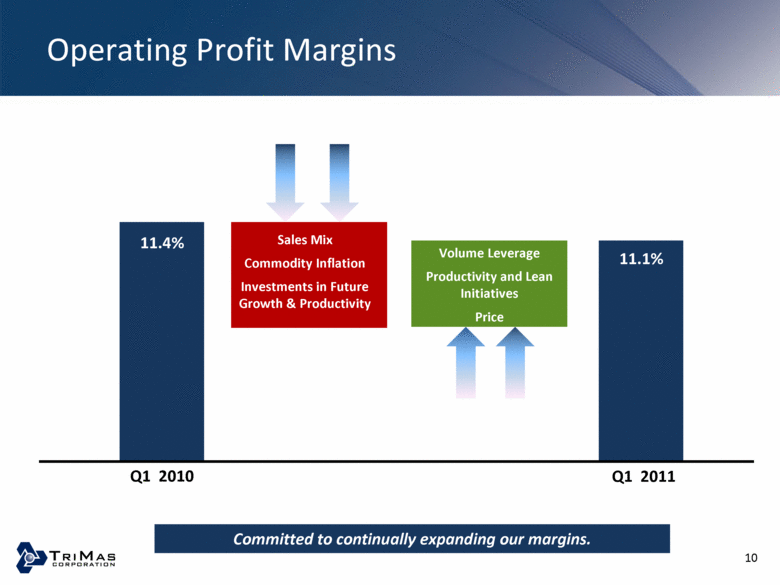
Operating Profit Margins Q1 2010 Q1 2011 11.1% Committed to continually expanding our margins. 10 11.4% Volume Leverage Productivity and Lean Initiatives Price Sales Mix Commodity Inflation Investments in Future Growth & Productivity |
|
|
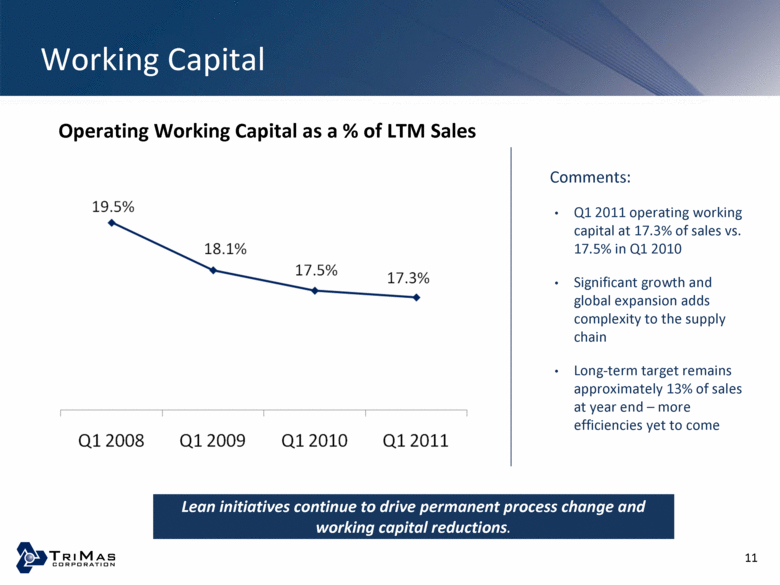
Working Capital Lean initiatives continue to drive permanent process change and working capital reductions. 11 Comments: Q1 2011 operating working capital at 17.3% of sales vs. 17.5% in Q1 2010 Significant growth and global expansion adds complexity to the supply chain Long-term target remains approximately 13% of sales at year end – more efficiencies yet to come Operating Working Capital as a % of LTM Sales |
|
|
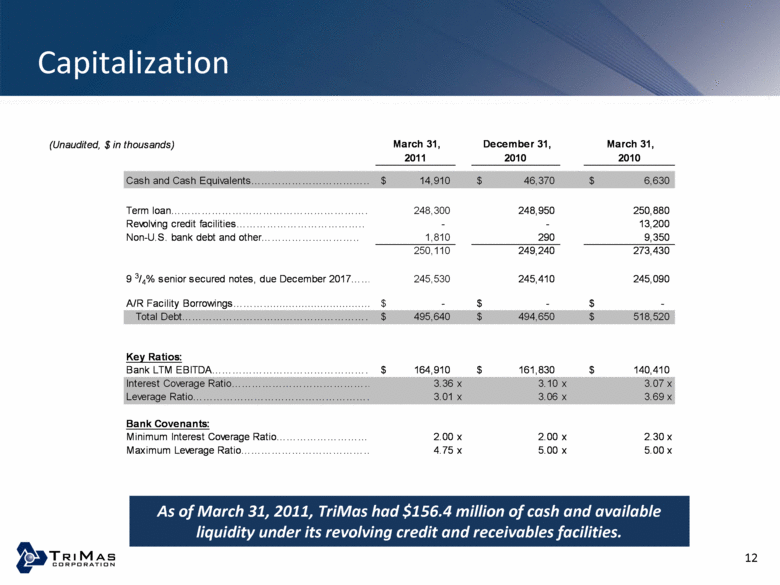
Capitalization As of March 31, 2011, TriMas had $156.4 million of cash and available liquidity under its revolving credit and receivables facilities. 12 5.00 x x 5.00 x 4.75 Maximum Leverage Ratio 2.30 x x 2.00 x 2.00 Minimum Interest Coverage Ratio Bank Covenants: 3.69 x x 3.06 x 3.01 Leverage Ratio 3.07 x x 3.10 x 3.36 Interest Coverage Ratio $ 140,410 $ 161,830 $ 164,910 Bank LTM EBITDA. Key Ratios: $ 518,520 $ 494,650 $ 495,640 Total Debt $ - $ - $ - A/R Facility Borrowings 245,090 245,410 245,530 9 3/4% senior secured notes, due December 2017. 273,430 249,240 250,110 9,350 290 1,810 Non-U.S. bank debt and other 13,200 - - Revolving credit facilities 250,880 248,950 248,300 Term loan. $ 6,630 $ 46,370 $ 14,910 Cash and Cash Equivalents 2010 2010 2011 March 31, December 31, March 31, (Unaudited, $ in thousands) |
|
|
Segment Highlights |
|
|
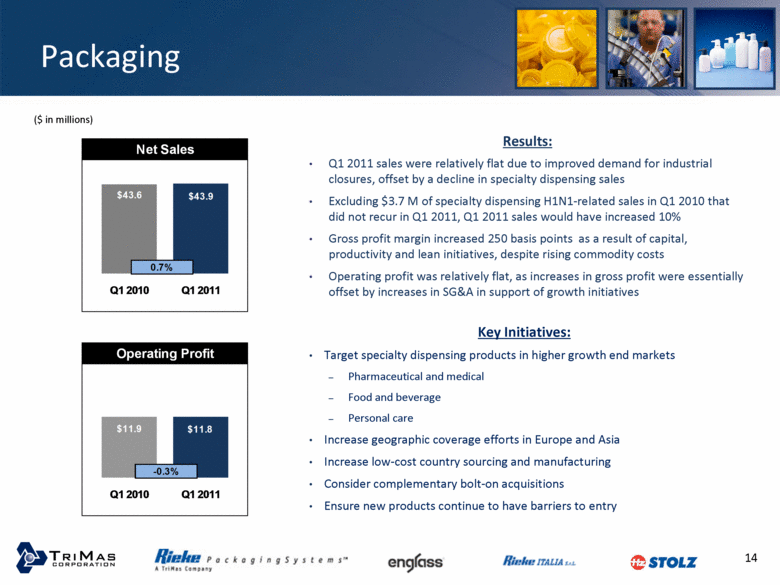
Packaging Results: Q1 2011 sales were relatively flat due to improved demand for industrial closures, offset by a decline in specialty dispensing sales Excluding $3.7 M of specialty dispensing H1N1-related sales in Q1 2010 that did not recur in Q1 2011, Q1 2011 sales would have increased 10% Gross profit margin increased 250 basis points as a result of capital, productivity and lean initiatives, despite rising commodity costs Operating profit was relatively flat, as increases in gross profit were essentially offset by increases in SG&A in support of growth initiatives ($ in millions) Key Initiatives: Target specialty dispensing products in higher growth end markets Pharmaceutical and medical Food and beverage Personal care Increase geographic coverage efforts in Europe and Asia Increase low-cost country sourcing and manufacturing Consider complementary bolt-on acquisitions Ensure new products continue to have barriers to entry 14 |
|
|
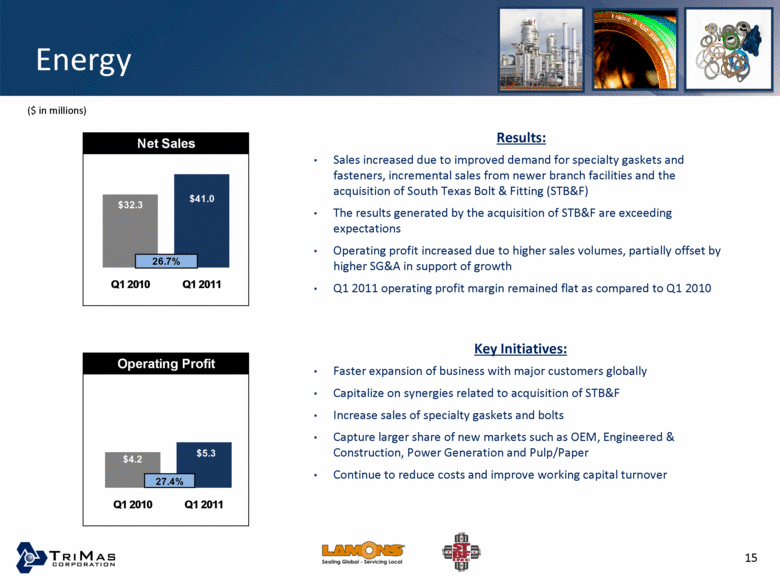
Energy ($ in millions) Results: Sales increased due to improved demand for specialty gaskets and fasteners, incremental sales from newer branch facilities and the acquisition of South Texas Bolt & Fitting (STB&F) The results generated by the acquisition of STB&F are exceeding expectations Operating profit increased due to higher sales volumes, partially offset by higher SG&A in support of growth Q1 2011 operating profit margin remained flat as compared to Q1 2010 Key Initiatives: Faster expansion of business with major customers globally Capitalize on synergies related to acquisition of STB&F Increase sales of specialty gaskets and bolts Capture larger share of new markets such as OEM, Engineered & Construction, Power Generation and Pulp/Paper Continue to reduce costs and improve working capital turnover 15 |
|
|
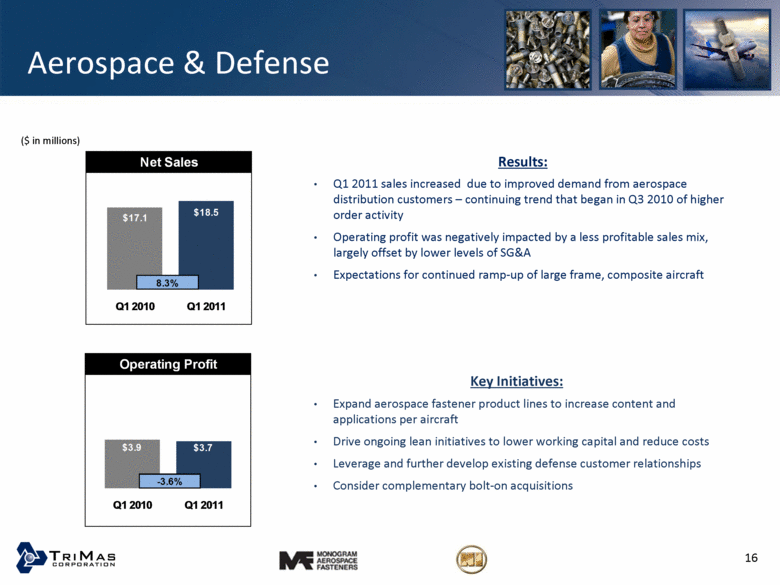
Aerospace & Defense Key Initiatives: Expand aerospace fastener product lines to increase content and applications per aircraft Drive ongoing lean initiatives to lower working capital and reduce costs Leverage and further develop existing defense customer relationships Consider complementary bolt-on acquisitions ($ in millions) Results: Q1 2011 sales increased due to improved demand from aerospace distribution customers – continuing trend that began in Q3 2010 of higher order activity Operating profit was negatively impacted by a less profitable sales mix, largely offset by lower levels of SG&A Expectations for continued ramp-up of large frame, composite aircraft 16 |
|
|
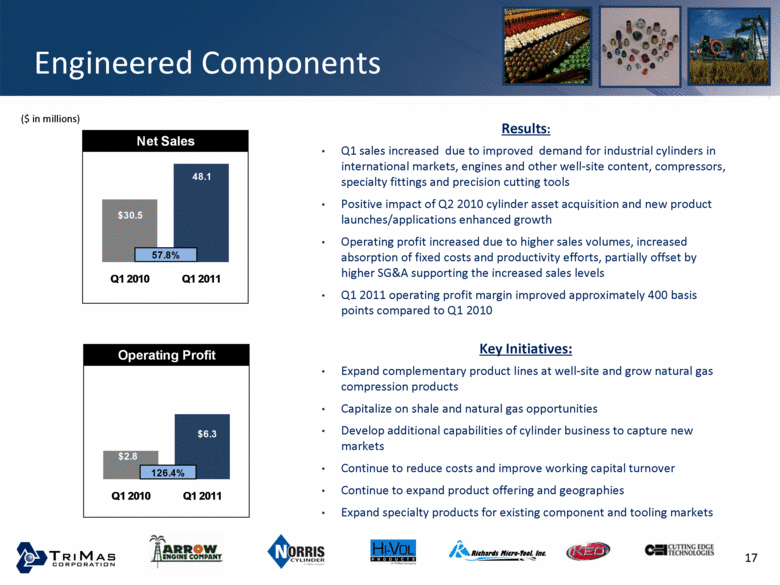
Engineered Components ($ in millions) Key Initiatives: Expand complementary product lines at well-site and grow natural gas compression products Capitalize on shale and natural gas opportunities Develop additional capabilities of cylinder business to capture new markets Continue to reduce costs and improve working capital turnover Continue to expand product offering and geographies Expand specialty products for existing component and tooling markets Results: Q1 sales increased due to improved demand for industrial cylinders in international markets, engines and other well-site content, compressors, specialty fittings and precision cutting tools Positive impact of Q2 2010 cylinder asset acquisition and new product launches/applications enhanced growth Operating profit increased due to higher sales volumes, increased absorption of fixed costs and productivity efforts, partially offset by higher SG&A supporting the increased sales levels Q1 2011 operating profit margin improved approximately 400 basis points compared to Q1 2010 17 |
|
|
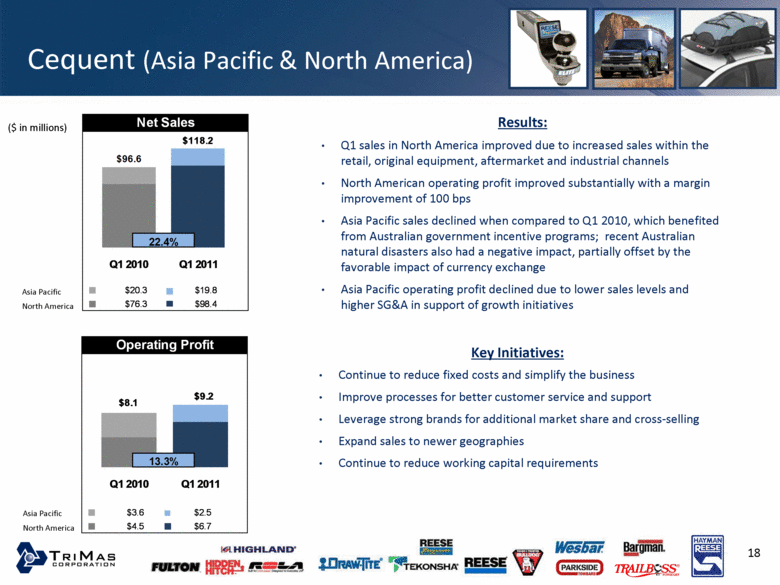
Cequent (Asia Pacific & North America) ($ in millions) $46.4 Results: Q1 sales in North America improved due to increased sales within the retail, original equipment, aftermarket and industrial channels North American operating profit improved substantially with a margin improvement of 100 bps Asia Pacific sales declined when compared to Q1 2010, which benefited from Australian government incentive programs; recent Australian natural disasters also had a negative impact, partially offset by the favorable impact of currency exchange Asia Pacific operating profit declined due to lower sales levels and higher SG&A in support of growth initiatives Key Initiatives: Continue to reduce fixed costs and simplify the business Improve processes for better customer service and support Leverage strong brands for additional market share and cross-selling Expand sales to newer geographies Continue to reduce working capital requirements Asia Pacific North America 18 Asia Pacific North America |
|
|
Outlook and Summary |
|
|
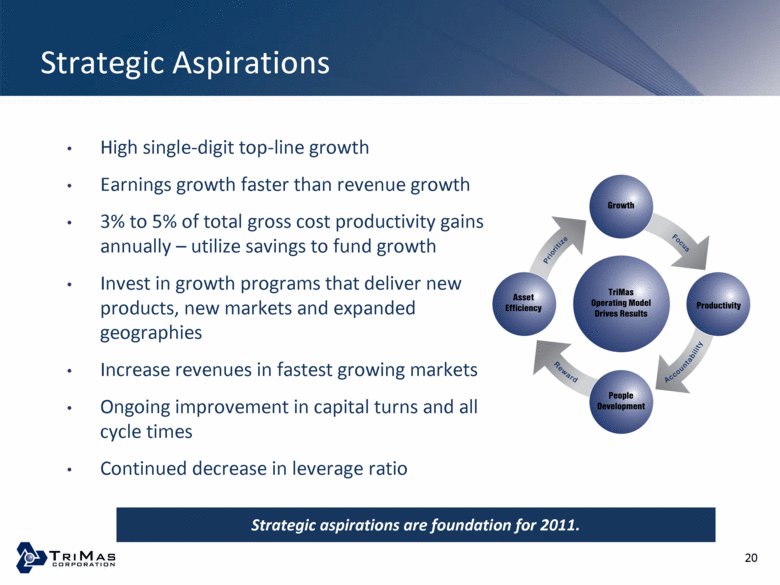
Strategic Aspirations High single-digit top-line growth Earnings growth faster than revenue growth 3% to 5% of total gross cost productivity gains annually – utilize savings to fund growth Invest in growth programs that deliver new products, new markets and expanded geographies Increase revenues in fastest growing markets Ongoing improvement in capital turns and all cycle times Continued decrease in leverage ratio Strategic aspirations are foundation for 2011. 20 |
|
|
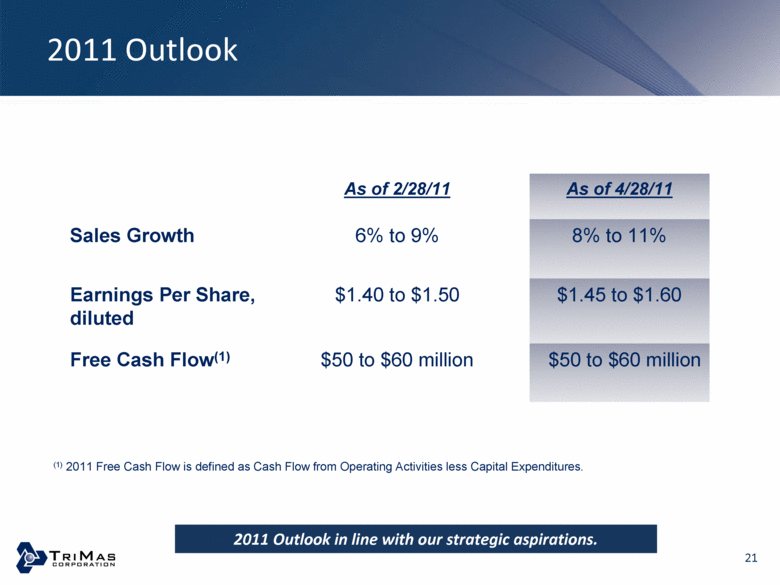
2011 Outlook As of 2/28/11 As of 4/28/11 Sales Growth 6% to 9% 8% to 11% Earnings Per Share, diluted $1.40 to $1.50 $1.45 to $1.60 Free Cash Flow(1) $50 to $60 million $50 to $60 million (1) 2011 Free Cash Flow is defined as Cash Flow from Operating Activities less Capital Expenditures. 2011 Outlook in line with our strategic aspirations. 21 |
|
|
|
|
|
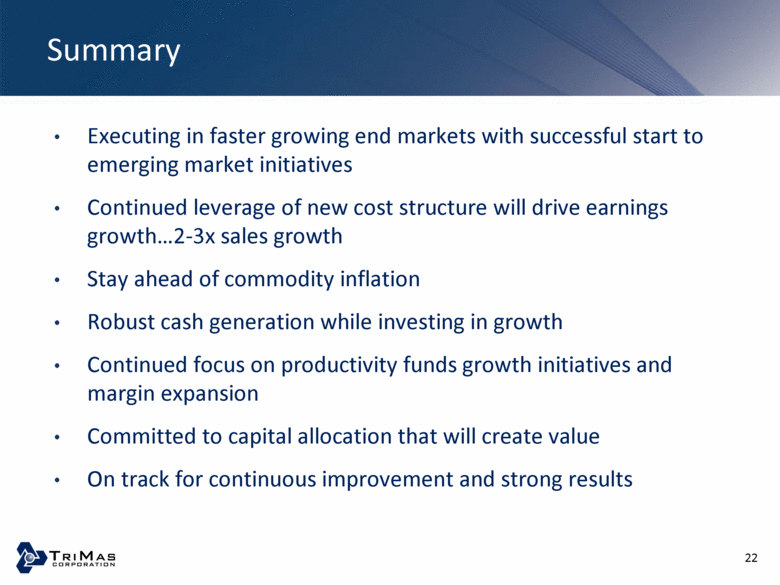
Summary Executing in faster growing end markets with successful start to emerging market initiatives Continued leverage of new cost structure will drive earnings growth...2-3x sales growth Stay ahead of commodity inflation Robust cash generation while investing in growth Continued focus on productivity funds growth initiatives and margin expansion Committed to capital allocation that will create value On track for continuous improvement and strong results 22 |
|
|
Questions & Answers |
|
|
Appendix |
|
|
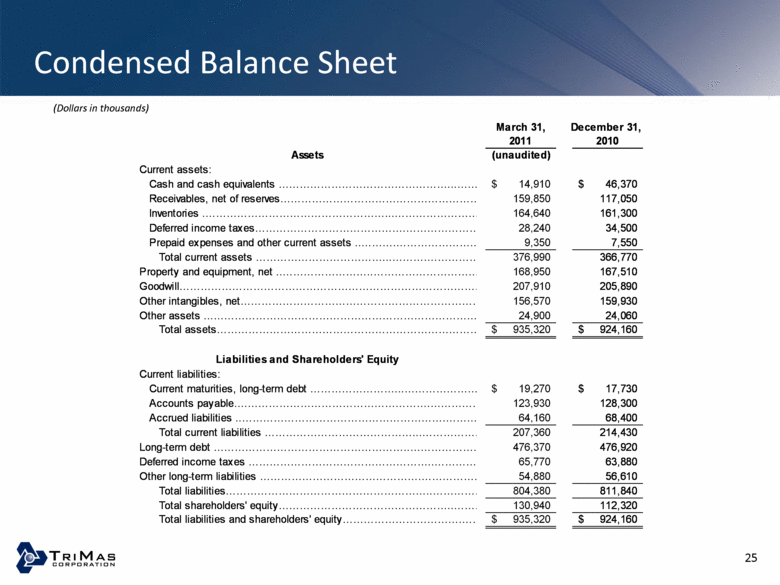
Condensed Balance Sheet (Dollars in thousands) 25 March 31, December 31, 2011 2010 Assets (unaudited) Current assets: Cash and cash equivalents 14,910 $ 46,370 $ Receivables, net of reserves 159,850 117,050 Inventories 164,640 161,300 Deferred income taxes 28,240 34,500 Prepaid expenses and other current assets 9,350 7,550 Total current assets 376,990 366,770 Property and equipment, net 168,950 167,510 Goodwil 207,910 205,890 Other intangibles, net 156,570 159,930 Other assets 24,900 24,060 Total assets 935,320 $ 924,160 $ Liabilities and Shareholders' Equity Current liabilities: Current maturities, long-term debt 19,270 $ 17,730 $ Accounts payable 123,930 128,300 Accrued liabilities 64,160 68,400 Total current liabilities 207,360 214,430 Long-term debt 476,370 476,920 Deferred income taxes 65,770 63,880 Other long-term liabilities 54,880 56,610 Total liabilities 804,380 811,840 Total shareholders' equity 130,940 112,320 Total liabilities and shareholders' equity 935,320 $ 924,160 $ |
|
|
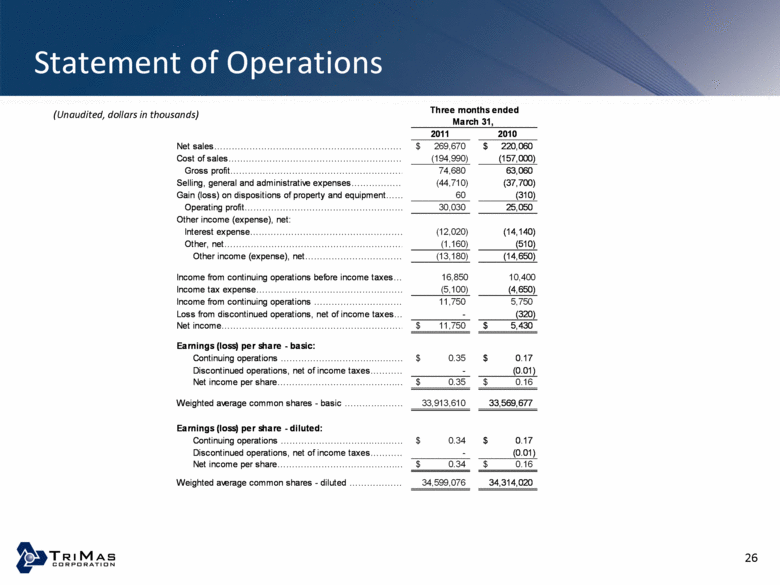
Statement of Operations (Unaudited, dollars in thousands) 26 Three months ended March 31, 2011 2010 Net sales 269,670 $ 220,060 $ Cost of sales (194,990) (157,000) Gross profit 74,680 63,060 Selling, general and administrative expenses (44,710) (37,700) Gain (loss) on dispositions of property and equipment 60 (310) Operating profit 30,030 25,050 Other income (expense), net: Interest expense (12,020) (14,140) Other, net (1,160) (510) Other income (expense), net (13,180) (14,650) Income from continuing operations before income taxes 16,850 10,400 Income tax expense (5,100) (4,650) Income from continuing operations 11,750 5,750 Loss from discontinued operations, net of income taxes - (320) Net income 11,750 $ 5,430 $ Earnings (loss) per share - basic: Continuing operations 0.35 $ 0.17 $ Discontinued operations, net of income taxes - (0.01) Net income per share 0.35 $ 0.16 $ Weighted average common shares - basic 33,913,610 33,569,677 Earnings (loss) per share - diluted: Continuing operations 0.34 $ 0.17 $ Discontinued operations, net of income taxes - (0.01) Net income per share 0.34 $ 0.16 $ Weighted average common shares - diluted 34,599,076 34,314,020 |
|
|
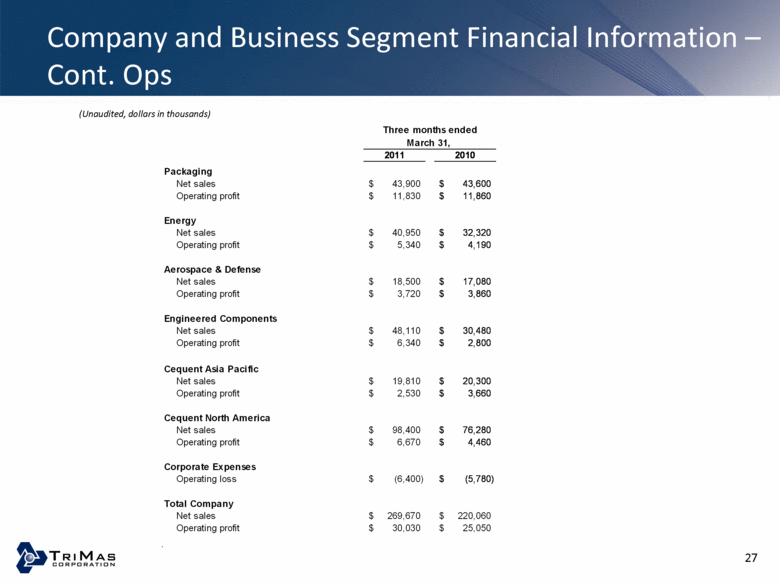
Company and Business Segment Financial Information – Cont. Ops (Unaudited, dollars in thousands) 27 Three months ended 2011 2010 Packaging Net sales $ 43,900 $ 43,600 Operating profit $ 11,830 $ 11,860 Energy Net sales $ 40,950 $ 32,320 Operating profit $ 5,340 $ 4,190 Aerospace & Defense Net sales $ 18,500 $ 17,080 Operating profit $ 3,720 $ 3,860 Engineered Components Net sales $ 48,110 $ 30,480 Operating profit $ 6,340 $ 2,800 Cequent Asia Pacific Net sales $ 19,810 $ 20,300 Operating profit $ 2,530 $ 3,660 Cequent North America Net sales $ 98,400 $ 76,280 $ Operating profit $ 6,670 $ 4,460 Corporate Expenses Operating loss $ (6,400) $ (5,780) Total Company Net sales $ 269,670 $ 220,060 $ Operating profit $ 30,030 $ 25,050 |
|
|
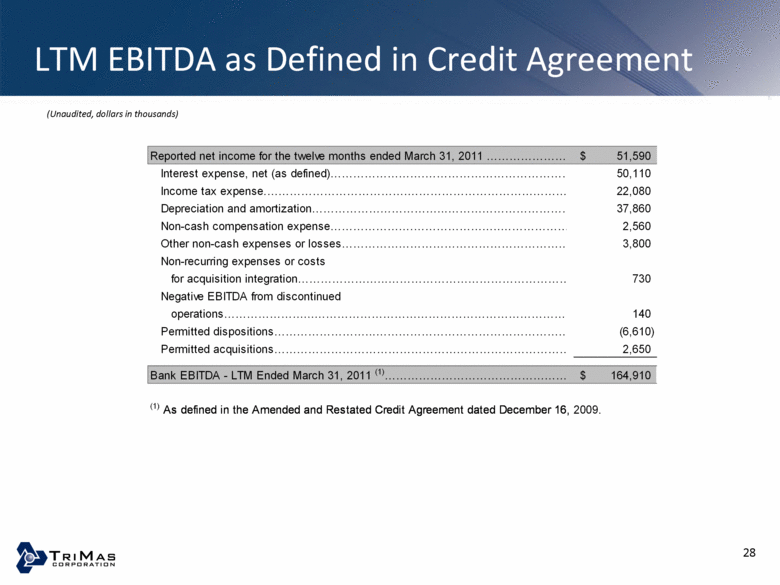
LTM EBITDA as Defined in Credit Agreement (Unaudited, dollars in thousands) 28 Reported net income for the twelve months ended March 31, 2011 $ 51,590 Interest expense, net (as defined) 50,110 Income tax expense 22,080 Depreciation and amortization 37,860 Non-cash compensation expense 2,560 Other non-cash expenses or losses 3,800 Non-recurring expenses or costs for acquisition integration 730 Negative EBITDA from discontinued operations 140 Permitted dispositions (6,610) Permitted acquisitions 2,650 Bank EBITDA - LTM Ended March 31, 2011 (1) $ 164,910 |

