Attached files
| file | filename |
|---|---|
| 8-K - FORM 8-K - CYTEC INDUSTRIES INC/DE/ | d8k.htm |
 Shane Fleming
– Chairman, President and CEO
Dave Drillock –
Vice President and CFO
First Quarter 2011 Earnings Review
April 25, 2011
Exhibit 99.1 |
 2
Forward Looking Statement
During the course of this meeting we may make forward-looking statements. All statements
that address expectations or projections about the future are forward-looking
statements.
Some of these statements include words such as “expects”, “anticipates,”
“plans,” “intends,” “projects,” and “outlook.”
Although they reflect our current expectations, these statements are not guarantees of future
performance because they involve a number of risks, uncertainties, and assumptions.
Included in this presentation are estimates for full year 2011 sales and earnings. These
were included in our April 21, 2011 press release, which was also furnished as an
exhibit to a current report on Form 8-K. These estimates set forth the
Company’s assumptions and management’s best estimate of the full year 2011 sales
and earnings at that time based on various assumptions set forth in the press release.
There can be no assurance that sales or earnings will develop in the manner then
projected or that the results for the year will be consistent with the results then
projected. Actual results may differ materially.
We recommend that you review Cytec’s SEC filings for a discussion of some of the factors
which could cause actual results to differ materially from its expectations and
projections. This and other Cytec information may be accessed at
www.cytec.com.
In sections of this presentation certain “non-GAAP” measures are provided and
identified as such. We believe that the “non-GAAP” measures can more
accurately reflect comparisons of year to year trends and is consistent with how we
review the information. A reconciliation of “non-GAAP” measures to the applicable
GAAP measure is provided in the appendix at the end of this presentation. |
 3
Results Overview
•
Overall sales up 18% year on year
•
Volume growth across all segments and regions indicating
stronger demand from continued global economic improvement
•
Selling prices cover raw material cost increases
•
Overall as-adjusted diluted per share earnings up 34% year on year
•
Improved earnings across all segments
•
Sale of Building Block Chemicals completed
1
Quarter
2011:
Sales of $766 million
Net Earnings of $0.78
per diluted share
(Continuing operations attributable
to Cytec, excluding special items)
st |
 4
Business Segment Results
Coating Resins
•
Demand improvement led by powder and
waterborne resins with strongest growth in
Asia and Europe
•
Strong sales in March reflecting robust
underlying and seasonal demand
•
$36 million in higher raw material
costs
Sales Growth
18%
Volume
5%
Price
12%
Currency
1%
Sales Comparison Q1 YOY
$MM USD
Q1 11
Q1 10
% chg
Sales
403.6
341.4
18%
Operating Earnings
18.8
16.8
12%
% Sales
5%
5% |
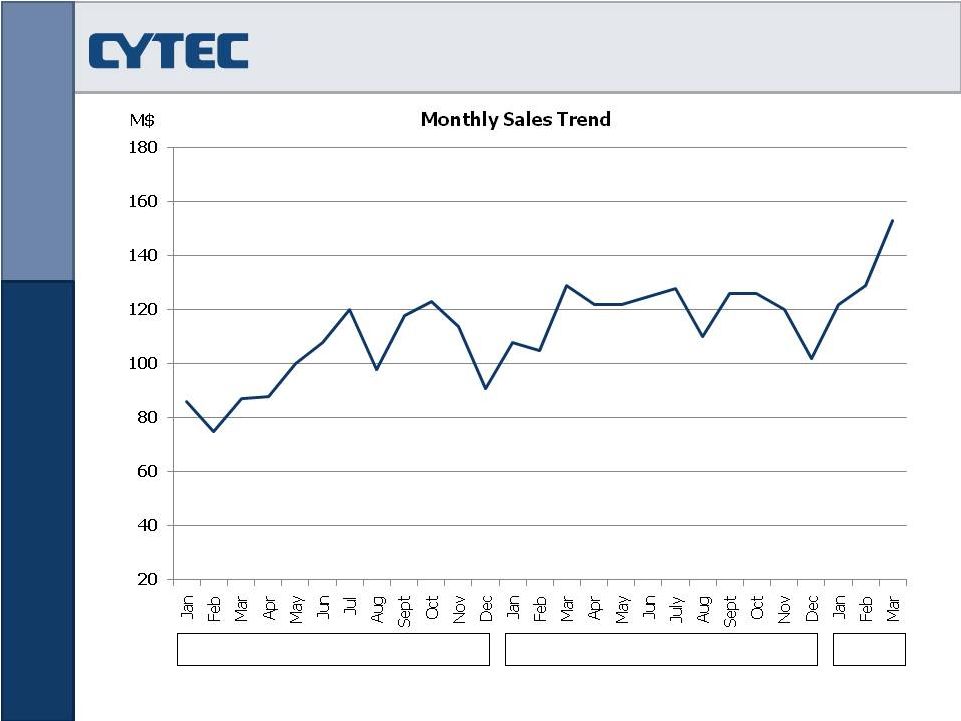 Coating
Resins 5
2009
2010
2011 |
 6
Business Segment Results
Additive Technologies
Sales Growth
8%
Volume
3%
Price
4%
Currency
1%
Sales Comparison Q1 YOY
•
Volume growth lead by specialty
additives across most regions
•
Lower polymer additives volume due
to capacity constraints
•
Operating earnings slightly down in the
quarter due to higher manufacturing
costs related to maintenance
$MM USD
Q1 11
Q1 10
% chg
Sales
67.4
62.3
8%
Operating Earnings
8.0
8.4
-5%
% Sales
12%
13% |
 7
Business Segment Results
In Process Separation
Sales Growth
20%
Volume
16%
Price
3%
Currency
1%
Sales Comparison Q1 YOY
•
Volume growth of 16% led by strong
demand in mining chemicals
reflecting higher production rates
from base metal customers as well
as new product commercializations
$MM USD
Q1 11
Q1 10
% chg
Sales
78.4
65.1
20%
Operating Earnings
16.4
14.9
10%
% Sales
21%
23% |
 8
Business Segment Results
Engineered Materials
•
Robust volume growth lead by higher
build rates in large commercial
transport, business jet, and rotorcraft
markets
•
Higher raw material costs of $6 million
primarily due to carbon fiber cost
escalation as a result of tight global
market supply
•
Continued positive outlook and trends
for aerospace markets
Sales Growth
22%
Volume
21%
Price
1%
Currency
0%
Sales Comparison Q1 YOY
$MM USD
Q1 11
Q1 10
% chg
Sales
216.6
177.7
22%
Operating Earnings
26.7
21.0
27%
% Sales
12%
12% |
 9
Financial Results
First
Quarter
2011
•
Special Items:
–
Pre-tax net restructuring credit of $0.7M
–
Pre-tax charge of $3.2Mrelated to an increase in environmental liability
at an inactive site
–
Pre-tax gain of $3.3M related to a sale of land at our manufacturing
site
in Colombia which was shutdown in the second half of 2009
•
Discontinued Operations:
–
Completed divestiture of Building Block Chemicals in February 2011 with
proceeds of $145M after-tax ($36.8M gain after-tax); greater focus on
core growth platforms
–
Earnings from two months of operations of $6.8M after-tax |
 10
Financial Results
First
Quarter
2011
•
As-Adjusted Comments:
–
Gross margin of 23.5% down slightly vs. prior year due to cost escalations
–
Lower Corporate and Unallocated vs. prior year due to reduced consulting
costs. Also includes $1.0 and $1.4M of costs previously allocated to Building
Block Chemicals for Q1 2011 and 2010, respectively.
–
Operating Expenses (as % of sales) are down 1% year on year
–
Estimated annual underlying income tax rate was 31.25%, down 1.25% vs.
Q1 ‘10 |
 11
Cash Flow
Cash flow from continuing operations was $22M in Q1’11 vs. $32M in Q1’10
Continued Focus on Working Capital
Working Capital Days |
 Balance
Sheet Capital
Expenditures
•
Q1’11 capital expenditures of $26M vs. Q1’10 of $28M
•
Outlook for Full Year 2011 is estimated to be $170 to $190M
Maintaining
Liquidity
and
Returning
Excess
Cash
to
Shareholders
•
Cash balance is $522M, up by $139M from year-end 2010
•
Pension contribution of $16.3M in the quarter vs. $16.0M in prior
year quarter
•
Purchased 440 thousand shares of our common stock for $24M
•
Cash dividend of $6M
12 |
 13
2011 Outlook
We reiterate our outlook for 2011 full year adjusted continuing EPS of $3.15 to
$3.50.
Business Segment
Net Sales
Operating Earnings Guidance
Coating Resins
$1,500 to $1,520
$70 to $80
Additive Technologies
$260 to $280
$37 to $40
In Process Separation
$320 to $330
$60 to $70
Engineered Materials
$825 to $845
$130 to $140
Total
$2,905 to $2,975
$297 to $330
Outlook table in Millions
Net sales and operating earnings guidance for all business segments
remains unchanged |
 CYT : NYSE |
 15
Appendix
Reconciliation of “Non-GAAP”
Measures to GAAP Measures
Management believes that net after
-
tax earnings and diluted earnings per share before special items, and gross margins
adjusted for special items, which are non
-
GAAP measures, are meaningful to investors because they provide a view of
the Company with respect to ongoing operations. Special items represent significant charges
or credits that are important to an understanding of the Company’s overall
operating results in the periods presented. Such measurements are not recognized in
accordance with generally accepted accounting principles (GAAP) and should not be viewed as an
alternative to GAAP measures of performance. The following table
summarizes the net special items used to adjust
reported net earnings and diluted earnings per share and gross margins for the quarters ended
March 31, 2011 and 2010. Period
Reported Net
Earnings from
Continuing
Operations less
Earnings
Attributable to
Noncontrolling
Interests
Net Special
Items
Non-GAAP Net
Earnings from
Continuing
Operations
Attributable to
Cytec
Reported Diluted
Continuing
Earnings Per Share
less Diluted
Earnings Per Share
Attributable to
Noncontrolling
Interests
Net Special
Items
Non-GAAP
Diluted
Earnings per
Share
Q1’11
$ 39.6
$ (0.5)
$ 39.1
$ 0.79
$ (0.01)
$ 0.78
Q1’10
$ 21.0
$ 7.9
$ 28.9
$ 0.42
$ 0.16
$ 0.58
Period
Reported Cost of
Sales
Net Special
Items
Adjusted Cost of
Sales
GAAP Gross
Margin
Net Special
Items
Adjusted Gross
Margin
Q1’11
$ 585.6
$ (0.1)
$ 585.7
$ 180.4
$ (0.1)
$ 180.3
Q1’10
$ 488.7
$ (0.3)
$ 489.0
$ 157.8
$ (0.3)
$ 157.5 |