Attached files
| file | filename |
|---|---|
| 8-K - FORM 8-K - BBX CAPITAL CORP | d8k.htm |
Exhibit 99.1

BankAtlantic Bancorp Reports Financial Results
For the First Quarter, 2011
FORT LAUDERDALE, Florida — April 25, 2011 — BankAtlantic Bancorp, Inc. (NYSE: BBX) today reported a net loss of ($22.9) million, or ($0.37) per diluted share, for the quarter ended March 31, 2011, compared to a net loss of ($20.5) million, or ($0.42) per diluted share, for the quarter ended March 31, 2010. BankAtlantic’s net loss was ($16.4) million for the first quarter of 2011, compared to a net loss of ($17.1) million for the first quarter of 2010.
BankAtlantic Bancorp’s Chairman and Chief Executive Officer, Alan B. Levan, commented, “Over the last several months, it appears that the decline in commercial real estate valuations in Florida has begun to stabilize and in some areas real estate valuations have actually improved. Unemployment levels in the state have stabilized or improved. As the economic picture in Florida gets brighter, the prospects for BankAtlantic become brighter as well. Losses are down (the quarter’s results represent the lowest quarterly loss for BankAtlantic since the third quarter of 2008), provisions and charge-offs have declined, and fewer loans are migrating to default status. Deposits continue to grow, leverage is low, and nonperforming assets are down. And our capital ratios, which have been generally stable since the downturn began in 2006, are expected to improve during the second quarter of 2011 as a result of the pending sale of BankAtlantic’s Tampa branches.
“We believe our continued focus on the fundamentals of Capital, Credit and Core Earnings, combined with the cautious optimism for the Florida economy, will result in a brighter outlook for BankAtlantic, particularly once the impairments resulting from lower valuations on collateral subside as the economy recovers.
Highlights of the BankAtlantic Operating Segment
| • | “Despite the challenges in the Florida economy, core operating earnings (1) have remained strong ranging from $51 million for the full year 2007 to $47 million for the full year 2010. For the first quarter of 2011, core earnings were $11.6 million versus $15.8 million for the first quarter of 2010 and $8.3 million for the fourth quarter of 2010. |
1
| • | “Core deposits (2) increased from $2.3 billion at December 31, 2007 to $2.8 billion at December 31, 2010. Core deposits for the first quarter of 2011 increased to $3.0 billion and we believe there is opportunity for continued growth of this low cost funding source in our markets as BankAtlantic remains one of the larger community banks in our markets. |
| • | “Total cost of deposits decreased from 2.15% in the fourth quarter of 2007 to 0.47% in the fourth quarter of 2010. For the first quarter of 2011, the total cost of deposits improved to 0.44% from the fourth quarter of 2010, reflecting the stable, relationship source of our deposits. For the first quarter of 2011, the funding cost of our core deposits was 25 basis points. |
| • | “Brokered deposits, which have never been a core funding source, totaled $14.7 million or 0.2% of total assets at December 31, 2007 and $14.1 million or 0.3% of total assets at December 31, 2010. Brokered deposits at March 31, 2011 totaled $10.8 million or 0.2% of total assets. |
“Net interest margin was 3.62% for the year ended December 31, 2007 and 3.55% for the year ended December 31, 2010. Net interest margin was 3.28% for the quarter ending March 31, 2011, down from 3.61% for the first quarter of 2010 due to increased liquidity being maintained in anticipation of the pending Tampa branch sale, but also reflecting both increased loan yields and decreased cost of interest-bearing liabilities.
| • | “Available liquidity, which includes cash, unpledged securities and unused Federal Funds and/or FHLB borrowing capacity, increased from 35.9% of deposits at December 31, 2007 to 37.7% at December 31, 2010. Available liquidity was 39.7% |
| (1) | Pre-tax core operating earnings is a non-GAAP measure that we use to refer to pre-tax earnings before provision for loan losses, tax certificate provisions, debt redemption costs, gains/losses on sales of real estate, and impairments, restructuring and exit activities. A reconciliation of loss from bank operations before income taxes to pre-tax core operating earnings is included in BankAtlantic Bancorp’s First Quarter, 2011 Supplemental Financials available at www.BankAtlanticBancorp.com. To view the financial data, access the “Investor Relations” section and click on the “Quarterly Financials or Supplemental Financials” navigation links. |
| (2) | Core deposits is a term that we use to refer to Demand, NOW and Savings accounts. A reconciliation of core deposits to total deposits is included in BankAtlantic Bancorp’s First Quarter, 2011 Supplemental Financials available at www.BankAtlanticBancorp.com. To view the financial data, access the “Investor Relations” section and click on the “Quarterly Financials or Supplemental Financials” navigation links. |
2
of deposits at March 31, 2011. Cash and unpledged securities balances increased from 12.7% of deposits at December 31, 2007 to 22.0% of deposits at December 31, 2010. Cash and unpledged securities balances were 25.0% of deposits at March 31, 2011.
| • | “Borrowings decreased from $1.6 billion at December 31, 2007 to $226 million at December 31, 2010. Borrowings at March 31, 2011 were only $87.9 million. The ratio of borrowings as a percentage of total borrowings and deposits declined from 28.7% at December 31, 2007 to 5.5% at December 31, 2010. At March 31, 2011, the ratio of borrowings as a percentage of total borrowings and deposits was only 2.2%. |
| • | “Total non-interest expense decreased from $314 million at December 31, 2007 to $236 million at December 31, 2010. For the first quarter of 2011, non-interest expense was $46 million, reflecting BankAtlantic’s lowest quarterly non-interest expense in over six years, and we anticipate additional efficiencies after the pending sale of our Tampa branch franchise. Core expenses (3) were $46 million in the first quarter of 2011, compared to core expenses of $52 million in the first quarter of 2010, reflecting a $6 million improvement. |
| • | “The allowance for loan losses to total loans increased from 2.04% at December 31, 2007 to 5.08% at December 31, 2010. At March 31, 2011, the allowance for loan losses to total loans was 5.20%. |
| • | “Tier 1/Core Capital ratios have remained generally stable with 6.94% at December 31, 2007 compared to 6.22% at December 31, 2010. Throughout that tumultuous period for the Florida economy, our capital ratios never fell below regulatory requirements. Our March 31, 2011 Tier 1/Core Capital ratio was 5.97%, and the previously announced Tampa branch sale (anticipated to close during the first week of June 2011, subject to customary and regulatory conditions), is estimated to add over 145 basis points to each of our regulatory capital ratios. |
| (3) | Core expense is a non-GAAP measure that we use to refer to total non-interest expenses excluding tax certificate provisions, debt redemption costs, gains/losses on sales of real estate, impairments, restructuring and exit activities. A reconciliation of total expense to core expense is included in BankAtlantic Bancorp’s First Quarter, 2011 Supplemental Financials available at www.BankAtlanticBancorp.com. To view the financial data, access the “Investor Relations” section and click on the “Quarterly Financials or Supplemental Financials” navigation links. |
3
“As we have previously discussed, we believe that BankAtlantic’s loan losses may have peaked in 2009. While the current quarter’s results reflect losses associated with our loan portfolios, we believe the trends support our optimism that we are on the path toward recovery. These trends, from the beginning of the recession through the current quarter, are set forth in the Supplemental Graphs to be viewed in conjunction with the Supplemental Financials on our BankAtlantic Bancorp’s Investor Relations website.
Supplemental graphs for BankAtlantic (bank only) are provided as a means to illustrate many of the metrics described above. To view the supplemental graphs, please visit our website at www.BankAtlanticBancorp.com, access the “Investor Relations” section and click on the “Supplemental Graphs” navigation link or visit http://www.snl.com/interactive/lookandfeel/101666/BBX_fin_supp.pdf.
Additional detailed financial data for BankAtlantic (bank only), the Parent- BankAtlantic Bancorp, and consolidated BankAtlantic Bancorp are available at www.BankAtlanticBancorp.com. To view the financial data, access the “Investor Relations” section and click on the “Quarterly Financials or Supplemental Financials” navigation links.
BANKATLANTIC PERFORMANCE
CAPITAL:
“Despite the sustained downturn in our markets, our capital ratios have been generally stable, primarily a result of capital contributions by BankAtlantic Bancorp into BankAtlantic, a focus on core earnings, and the reduction of assets. At March 31, 2011, BankAtlantic’s capital ratios were: Tier 1/Core capital of 5.97%, Tier 1 risk-based capital of 9.68%, and Total risk-based capital of 11.76%.
Capital Ratios at BankAtlantic at prior year-end periods were:
| 12/2006 | 12/2007 | 12/2008 | 12/2009 | 12/2010 | ||||||||||||||||
| Tier 1/Core |
7.55 | % | 6.94 | % | 6.80 | % | 7.58 | % | 6.22 | % | ||||||||||
| Tier 1 Risk-Based |
10.50 | % | 9.85 | % | 9.80 | % | 10.63 | % | 9.68 | % | ||||||||||
| Total Risk-Based |
12.08 | % | 11.63 | % | 11.63 | % | 12.56 | % | 11.72 | % | ||||||||||
“As previously disclosed, BankAtlantic agreed to sell its 19 branches and 2 related facilities in the Tampa – St. Petersburg area and the associated deposits to PNC Bank, N.A., part of the PNC Financial Services Group Inc. (NYSE: PNC). PNC and BankAtlantic have both
4
received regulatory approval for the transaction. The transaction is anticipated to close during the first week of June 2011, subject to the terms and conditions of the acquisition agreement and regulatory requirements. Upon closing, we anticipate recording a net gain of between $38 million and $39 million as part of the transaction (based on deposit levels of approximately $390.4 million at March 31, 2011), which we estimate will add over 145 basis points to each of our regulatory capital ratios.
CREDIT:
“Florida was especially hard hit during the current economic downturn as real estate values declined significantly and unemployment levels rose. However, when we compare the current 2011 quarter with the past two years, we are encouraged by recent credit trends and we continue to believe that 2009 may have been the peak of our impairments, provisions and delinquencies.
| • | “Delinquencies excluding non-accrual loans and matured loans in the process of renewal were $55.7 million, or 1.86% of total loans at March 31, 2011, as compared to $87.4 million, or 2.40% of total loans at March 31, 2010. |
| • | “Total non-accrual loans were $362.6 million at March 31, 2011, reflecting a decrease of $8.4 million as compared to the fourth quarter of 2010, and an increase of $61.2 million as compared to March 31, 2010. |
| • | “At March 31, 2011, approximately $93.0 million of commercial real estate and commercial business non-accrual loans were impaired but continued to be current and paying under the terms of their loan agreements. |
| • | “The new non-accrual commercial real estate and commercial business loans added in the first quarter of 2011 included the following: One defaulted loan for approximately $300,000; two loans totaling $5.1 million that were less than thirty days past due at March 31, 2011 (and continue to be past due); and one loan for $11.8 million that was impaired but continued to be current and paying under the terms of the loan agreement. |
| • | “BankAtlantic’s allowance for loan losses was $154.2 million at March 31, 2011. The allowance coverage to total loans increased to 5.20% at March 31, 2011 compared to 4.64% at March 31, 2010, and 5.08% at December 31, 2010. |
5
| • | “The provision for loan losses in the first quarter of 2011 was $27.8 million compared to $32.0 million in the first quarter of 2010, and included $7.1 million in provision related to non-performing residential and commercial real estate loans transferred to held-for-sale. |
| • | “Net charge-offs were $27.8 million in the first quarter of 2011, compared to $36.1 million in the first quarter of 2010. |
CORE EARNINGS:
Results of Operations – “BankAtlantic’s net loss was ($16.4) million for the first quarter of 2011, compared to a net loss of ($17.1) million for the first quarter of 2010 and a net loss of ($41.2) million for the fourth quarter of 2010. Pretax core operating earnings for the first quarter of 2011 were $11.6 million, compared to $15.8 million for the first quarter of 2010 and $8.3 million for the fourth quarter of 2010. Loan loss and tax certificate provisions, debt redemption costs, loss on real estate sold and impairment, restructuring and exit activity expenses, which are not included in pre-tax core operating earnings, were ($27.9) million for the first quarter of 2011 versus ($32.8) million for the first quarter of 2010. The individual components of earnings are described more fully below.”
BankAtlantic’s Chief Executive Officer, Jarett S. Levan, commented, “BankAtlantic’s core and total deposits at March 31, 2011 were $3.0 billion and $4.0 billion, respectively.
| • | “During the first quarter of 2011: |
| • | Core deposits increased by $106.2 million. |
| • | Total deposits increased by $113.3 million, reflecting primarily the increased core deposits. |
“In addition, the average cost of core deposits and total deposits for the first quarter of 2011 was 0.25% and 0.44%, respectively; brokered deposit balances represented 0.2% of assets; and non-CD balances represented approximately 84% of total deposits.
Net Interest Income and Margin – “Net interest income for the first quarter of 2011 was $34.7 million compared to $39.5 million for the first quarter of 2010. The reduction in the current quarter net interest income versus the comparable quarter reflected the impact of decreases in earning assets, increases in lower-yielding investments and net increases in nonperforming assets.
6
| • | “Net interest margin during the first quarter of 2011 was 3.28% as compared to 3.61% during the first quarter of 2010. |
| • | “Net interest spread during the first quarter of 2011 was 3.14% as compared to 3.39% during the first quarter of 2010. |
| • | “The cost of interest bearing liabilities during the first quarter of 2011 was 0.59%, improved from 0.99% in the first quarter of 2010. |
| • | “The yield on total loans (including nonperforming loans) during the first quarter of 2011 was 4.49%, increased from 4.43% in the first quarter of 2010. |
| • | “The yield on investments during the first quarter of 2011 was 1.63%, down significantly from 4.06% in the first quarter of 2010 due to average invested excess cash of $553.9 million during the first quarter of 2011 earning an average yield of 21 basis points. This compares to $162.2 million in average invested cash during the first quarter of 2010 earning a similar yield. We are holding excess cash in anticipation of the consummation of the Tampa branch sale in the second quarter of 2011, and these additional cash balances had a negative impact on the current quarter’s net interest margin. |
| • | “Other average balance sheet activity impacting net interest income included: |
| • | “Average earning assets for the first quarter of 2011 declined by $131.3 million from the first quarter of 2010, due primarily to routine asset paydowns and net charge-offs. |
| • | “Nonperforming assets increased by $88.6 million from March 31, 2010 to March 31, 2011. |
Non-interest income – “Total non-interest income for the first quarter of 2011 was $22.9 million, down $5.3 million from the first quarter of 2010. The decrease in the current quarter primarily reflects declines in service charges relating to customer non-sufficient funds activity, as compared to the first quarter of 2010, partially offset by additional deposit account fees related to monthly maintenance charges on certain products, foreign currency hedging income of approximately $420,000 and other fees earned in the current quarter.
7
Non-interest expense – “Total non-interest expenses were $46.2 million in the first quarter of 2011 compared to $52.7 million in the first quarter of 2010. Core expenses were $46.0 million in the first quarter of 2011, compared to core expenses of $51.9 million in the first quarter of 2010, reflecting a $5.6 million decrease in employee compensation and benefits and a $1.0 million decrease in occupancy and equipment expense.
“Expenses not included in ‘core expenses’ consisted of the following:
| • | “Impairment, restructuring and exit recovery of $0.4 million in the first quarter of 2011, versus charges of $0.1 million in the first quarter of 2010. The charges in the first quarter of 2011 included: |
| • | Charges totaling $0.4 million related to write-downs of real estate owned. |
| • | Net recovery of $1.0 million of restructuring charges, primarily related to favorable lease terminations on unused leased property sites. |
| • | Lower of cost or market adjustments on loans held for sale of $0.2 million. |
| • | “Tax certificate provision of $0.8 million in the first quarter of 2011, versus $0.7 million in the first quarter of 2010. |
| • | “Gain on sale of real estate of $0.3 million in the first quarter of 2011, versus a gain of $0.1 million in the first quarter of 2010. |
| • | “Costs associated with debt redemption of $10,000 in the first quarter of 2011, versus $7,000 in the first quarter of 2010.” |
BANKATLANTIC BANCORP (Parent Company level):
Alan B. Levan further commented, “BankAtlantic Bancorp’s net loss at the parent only level was ($6.5) million for the first quarter of 2011, compared to a net loss of ($3.4) million for the first quarter of 2010. The first quarter of 2011 included a net recovery for loan losses of $20,000 compared to a net recovery of $1.3 million in the first quarter of 2010. Additionally, the net loss in the first quarter of 2011 included a $2.3 million impairment charge relating to real estate owned.
8
“As first announced in the first quarter of 2009, we continue to defer the regularly scheduled interest payments on the outstanding junior subordinated debentures relating to all of our TruPS, which is permitted under the terms of the securities for up to another 11 consecutive quarterly periods.
Asset Workout Subsidiary – “The loans and real estate owned held by the parent company workout subsidiary at March 31, 2011 included real estate owned of $8.8 million, performing loans of $2.7 million and non-accrual loans of $11.4 million. Charge-offs of $21.1 million have been taken on these non-accrual loans, and $0.8 million in specific reserves are currently maintained related to these loans.
REGULATORY MATTERS:
“On February 23, 2011, BankAtlantic Bancorp and BankAtlantic each entered into agreements with the Office of Thrift Supervision (the “OTS”), their primary regulator, agreeing to continue taking actions to strengthen their financial condition and operations. Each agreement, known as a Stipulation and Consent to the issuance of an Order to Cease and Desist (the “Orders”) is a formal action by the OTS requiring corrective measures in a number of areas, including requiring BankAtlantic to meet by June 30, 2011 and maintain a Tier 1/Core capital ratio of 8% and a Total Risk Based capital ratio of 14%. No fines or penalties were imposed in connection with the Orders.
“In light of the economic climate, more than 70 banks in Florida and hundreds nationally have been asked by regulators to sign supervisory and enforcement agreements. We have been working closely with our regulators since the start of this economic recession to increase capital, reduce higher risk and non performing loans, return to profitability and continue safe and sound banking practices. These agreements formalize steps that we believe are already underway and many have already been fully implemented.
Mr. Alan B. Levan continued, “We have begun to see signs of improvement in areas of the Florida economy, and with improving trends, as well as declining losses, provisions and charge-offs at BankAtlantic, we believe there is cause for cautious optimism.”
- - -
Additional detailed financial data for BankAtlantic (bank only), the Parent- BankAtlantic Bancorp, and consolidated BankAtlantic Bancorp are available at www.BankAtlanticBancorp.com
To view the financial data, access the “Investor Relations” section and click on the “Quarterly Financials or Supplemental Financials” navigation links. Additionally, BankAtlantic’s financial information is provided quarterly to the OTS through Thrift Financial Reports, available to the public through the OTS and FDIC websites.
9
Additionally, copies of BankAtlantic Bancorp’s first quarter, 2011 financial results press release and financial data are available upon request via fax, email, or postal service mail. To request a copy, contact BankAtlantic Bancorp’s Investor Relations department using the contact information listed below.
About BankAtlantic Bancorp:
BankAtlantic Bancorp (NYSE: BBX) is a bank holding company and the parent company of BankAtlantic.
About BankAtlantic:
BankAtlantic, Florida’s Most Convenient Bank, is one of the largest financial institutions headquartered in Florida. Via its broad network of community branches and conveniently located ATMs, BankAtlantic provides a full line of personal, small business and commercial banking products and services. BankAtlantic is open 7 days a week and offers extended weekday hours, Online Banking & Bill Pay, a 7-Day Customer Service Center, Change Exchange coin counters, as well as retail and business checking accounts. Member FDIC.
For further information, please visit our websites:
www.BankAtlanticBancorp.com
www.BankAtlantic.com
To receive future BankAtlantic Bancorp news releases or announcements directly via Email, please click on the Email Broadcast Sign Up button on our website: www.BankAtlanticBancorp.com.
BankAtlantic Bancorp Contact Info:
Leo Hinkley, Investor and Media Relations Officer
Telephone: (954) 940-5300
Email: InvestorRelations@BankAtlanticBancorp.com
BankAtlantic, “Florida’s Most Convenient Bank,” Contact Info:
Media Relations:
Sharon Lyn, Vice President
Telephone: 954-940-6383, Fax: 954-940-5320
Email: CorpComm@BankAtlanticBancorp.com
# # #
Except for historical information contained herein, the matters discussed in this press release contain forward-looking statements within the meaning of Section 27A of the Securities Act of 1933, as amended (the “Securities Act”), and Section 21E of the Securities Exchange Act of 1934, as amended (the “Exchange Act”), that involve substantial risks and uncertainties. Actual
10
results, performance, or achievements could differ materially from those contemplated, expressed, or implied by the forward-looking statements contained herein. These forward-looking statements are based largely on the expectations of BankAtlantic Bancorp, Inc. (“the Company”) and are subject to a number of risks and uncertainties that are subject to change based on factors which are, in many instances, beyond the Company’s control. These include, but are not limited to, risks and uncertainties associated with: the impact of economic, competitive and other factors affecting the Company and its operations, markets, products and services, including the impact of the changing regulatory environment, a continued or deepening recession, continued decreases in real estate values, and increased unemployment or sustained high unemployment rates on our business generally, BankAtlantic’s regulatory capital ratios, the ability of our borrowers to service their obligations and of our customers to maintain account balances and the value of collateral securing our loans; credit risks and loan losses, and the related sufficiency of the allowance for loan losses, including the impact on the credit quality of our loans (including those held in the asset workout subsidiary of the Company) of a sustained downturn in the economy and in the real estate market and other changes in the real estate markets in our trade area, and where our collateral is located; the risks of additional charge-offs, impairments and required increases in our allowance for loan losses especially if the economy and real estate markets in Florida do not improve; the impact of regulatory proceedings and litigation regarding overdraft fees; risks associated with maintaining compliance with the Cease and Desist Orders entered into by the Company and BankAtlantic with the Office of Thrift Supervision, including risks that compliance will adversely impact operations, risks associated with failing to comply with regulatory mandates or the imposition of additional regulatory requirements and/or fines; the uncertain impact of legal proceedings on our financial condition or operations, including the risk that the securities class action litigation verdict may not be overturned; changes in interest rates and the effects of, and changes in, trade, monetary and fiscal policies and laws including their impact on the bank’s net interest margin; adverse conditions in the stock market, the public debt market and other financial and credit markets and the impact of such conditions on our activities and our ability to raise capital; that the sale of our Tampa branch operations may not be consummated pursuant to its terms, at the time anticipated or at all, and that the transaction may not have the positive financial impact currently anticipated; we may raise additional capital and such capital may be highly dilutive to BankAtlantic Bancorp’s shareholders or may not be available; and the risks associated with the impact of periodic valuation testing of goodwill, deferred tax assets and other assets. Past performance and perceived trends may not be indicative of future results. In addition to the risks and factors identified above, reference is also made to other risks and factors detailed in reports filed by the Company with the Securities and Exchange Commission, including the Company’s Annual Report on Form 10-K for the year ended December 31, 2010. The Company cautions that the foregoing factors are not exclusive.
11

Supplemental Financial Information
First Quarter 2011
Release Date: April 25, 2011
This information is preliminary, unaudited and based on data available at the time of the release.
BankAtlantic Bancorp, Inc. and Subsidiaries
Summary of Selected Financial Data (unaudited)
| For the Three Months Ended | ||||||||||||||||||||||||
| 3/31/2011 | 12/31/2010 | 9/30/2010 | 6/30/2010 | 3/31/2010 | ||||||||||||||||||||
| Earnings (in thousands): |
||||||||||||||||||||||||
| Net loss from continuing operations |
$ | (22,887 | ) | (45,795 | ) | (25,184 | ) | (51,250 | ) | (20,521 | ) | |||||||||||||
| Net loss |
$ | (22,887 | ) | (46,295 | ) | (25,184 | ) | (51,250 | ) | (20,521 | ) | |||||||||||||
| Net loss attributable to BankAtlantic Bancorp |
$ | (23,182 | ) | (46,554 | ) | (25,409 | ) | (51,489 | ) | (20,729 | ) | |||||||||||||
| Pre-tax core operating earnings - Non-GAAP |
(note 1 | ) | $ | 7,210 | 4,269 | 7,871 | 3,927 | 11,103 | ||||||||||||||||
| Average Common Shares Outstanding (in thousands): |
|
|||||||||||||||||||||||
| Basic |
62,724 | 62,571 | 60,784 | 50,679 | 49,335 | |||||||||||||||||||
| Diluted |
62,724 | 62,571 | 60,784 | 50,679 | 49,335 | |||||||||||||||||||
| Key Performance Ratios |
||||||||||||||||||||||||
| Basic and diluted loss per share from continuing operations |
(note 2 | ) | $ | (0.37 | ) | (0.74 | ) | (0.42 | ) | (1.02 | ) | (0.42 | ) | |||||||||||
| Basic and diluted loss per share |
(note 2 | ) | $ | (0.37 | ) | (0.74 | ) | (0.42 | ) | (1.02 | ) | (0.42 | ) | |||||||||||
| Return on average tangible assets from continuing operations |
(note 3 | ) | % | (2.02 | ) | (4.06 | ) | (2.22 | ) | (4.46 | ) | (1.74 | ) | |||||||||||
| Return on average tangible equity from continuing operations |
(note 3 | ) | % | (1,152.71 | ) | (356.19 | ) | (138.75 | ) | (193.89 | ) | (64.56 | ) | |||||||||||
| Average Balance Sheet Data (in millions): |
||||||||||||||||||||||||
| Assets |
$ | 4,550 | 4,530 | 4,548 | 4,616 | 4,744 | ||||||||||||||||||
| Tangible assets - Non-GAAP |
(note 3 | ) | $ | 4,536 | 4,515 | 4,533 | 4,600 | 4,728 | ||||||||||||||||
| Loans, gross |
$ | 3,123 | 3,360 | 3,513 | 3,627 | 3,799 | ||||||||||||||||||
| Investments |
$ | 1,118 | 883 | 748 | 648 | 604 | ||||||||||||||||||
| Deposits and escrows |
$ | 3,980 | 3,900 | 3,931 | 4,080 | 4,013 | ||||||||||||||||||
| Equity |
$ | 16 | 63 | 85 | 118 | 142 | ||||||||||||||||||
| Tangible equity - Non-GAAP |
(note 3 | ) | $ | 8 | 51 | 73 | 106 | 127 | ||||||||||||||||
| Period End ($ in thousands) |
||||||||||||||||||||||||
| Total loans, net |
$ | 2,821,429 | 3,018,179 | 3,239,542 | 3,387,725 | 3,515,542 | ||||||||||||||||||
| Total assets |
$ | 4,470,629 | 4,509,433 | 4,527,736 | 4,655,600 | 4,748,201 | ||||||||||||||||||
| Total equity |
$ | (8,729 | ) | 14,744 | 64,082 | 77,466 | 119,611 | |||||||||||||||||
| Class A common shares outstanding |
61,979,071 | 61,595,321 | 61,595,321 | 52,946,126 | 48,245,042 | |||||||||||||||||||
| Class B common shares outstanding |
975,225 | 975,225 | 975,225 | 975,225 | 975,225 | |||||||||||||||||||
| Book value per share |
$ | (0.14 | ) | 0.24 | 1.02 | 1.44 | 2.43 | |||||||||||||||||
| Tangible book value per share - Non-GAAP |
(note 4 | ) | $ | (0.26 | ) | 0.10 | 0.84 | 1.20 | 2.20 | |||||||||||||||
| High stock price for the quarter |
$ | 1.33 | 1.59 | 1.85 | 3.28 | 3.24 | ||||||||||||||||||
| Low stock price for the quarter |
$ | 0.82 | 0.60 | 0.75 | 1.35 | 1.14 | ||||||||||||||||||
| Closing stock price |
$ | 0.92 | 1.15 | 0.80 | 1.40 | 1.77 | ||||||||||||||||||
Notes:
| (1) | Pre-tax core operating earnings excludes provision for loan losses, cost associated with debt redemption, provision for tax certificates, gains/losses on sales of real estate and impairments, restructuring and exit activities. Pre-tax core operating earnings is a non-GAAP measure. See page 7 for a reconciliation of non-GAAP measures to GAAP financial measures. |
| (2) | Diluted and basic loss per share are the same for all periods presented. |
| (3) | Average tangible assets is defined as average total assets less average goodwill and core deposit intangibles. Average tangible equity is defined as average total equity less average goodwill, core deposit intangibles and other comprehensive income. Average tangible assets and average tangible equity are non-GAAP measures. See page 7 for a reconciliation of non-GAAP measures to GAAP financial measures. |
| (4) | Tangible book value per share is defined as equity less accumulated other comprehensive loss, goodwill and core deposit intangibles divided by the number of common shares outstanding. Tangible book value per share is a non-GAAP measure. See page 7 for a reconciliation of non-GAAP measures to GAAP financial measures. |
2
BankAtlantic Bancorp, Inc. and Subsidiaries
Consolidated Statements of Financial Condition (unaudited)
| March 31, | December 31, | |||||||
| (in thousands) | 2011 | 2010 | ||||||
| ASSETS |
||||||||
| Cash and due from depository institutions |
$ | 103,507 | 97,930 | |||||
| Interest bearing deposits at federal reserve and other banks |
656,424 | 455,538 | ||||||
| Securities available for sale and derivatives (at fair value) |
376,042 | 424,391 | ||||||
| Investment securities (approximate fair value: $1,500 and $1,500) |
1,500 | 1,500 | ||||||
| Tax certificates, net of allowance of $9,287 and $8,811 |
77,837 | 89,789 | ||||||
| Loans receivable, net of allowance for loan losses of $155,051 and $162,139 |
2,821,429 | 3,018,179 | ||||||
| Loans held for sale (at lower of cost or fair value) |
49,455 | 29,765 | ||||||
| Federal Home Loan Bank stock, at cost which approximates fair value |
43,557 | 43,557 | ||||||
| Real estate held for development and sale |
5,436 | 5,436 | ||||||
| Real estate owned |
75,146 | 74,488 | ||||||
| Office properties and equipment, net |
148,120 | 151,414 | ||||||
| Goodwill and other intangible assets |
14,260 | 14,569 | ||||||
| Assets held for sale |
36,909 | 37,334 | ||||||
| Other assets |
61,007 | 65,543 | ||||||
| Total assets |
$ | 4,470,629 | 4,509,433 | |||||
| LIABILITIES AND EQUITY |
||||||||
| Liabilities: |
||||||||
| Deposits |
||||||||
| Demand |
$ | 879,820 | 792,260 | |||||
| Savings |
452,533 | 418,304 | ||||||
| NOW |
1,307,041 | 1,370,568 | ||||||
| Money market |
366,968 | 354,282 | ||||||
| Certificates of deposit |
609,538 | 616,454 | ||||||
| Deposits held for sale |
390,432 | 341,146 | ||||||
| Total deposits |
4,006,332 | 3,893,014 | ||||||
| Advances from FHLB |
45,000 | 170,000 | ||||||
| Securities sold under agreements to repurchase |
17,006 | 21,524 | ||||||
| Short term borrowings |
1,367 | 1,240 | ||||||
| Subordinated debentures |
22,000 | 22,000 | ||||||
| Junior subordinated debentures |
325,974 | 322,385 | ||||||
| Liabilities held for sale |
79 | 87 | ||||||
| Other liabilities |
61,600 | 64,439 | ||||||
| Total liabilities |
4,479,358 | 4,494,689 | ||||||
| Equity: |
||||||||
| Common stock |
630 | 626 | ||||||
| Additional paid-in capital |
317,736 | 317,362 | ||||||
| Accumulated deficit |
(320,796 | ) | (297,614 | ) | ||||
| Accumulated other comprehensive loss |
(6,807 | ) | (6,088 | ) | ||||
| Total BankAtlantic Bancorp stockholders’ equity |
(9,237 | ) | 14,286 | |||||
| Noncontrolling interests |
508 | 458 | ||||||
| Total equity |
(8,729 | ) | 14,744 | |||||
| Total liabilities and equity |
$ | 4,470,629 | 4,509,433 | |||||
3
BankAtlantic Bancorp, Inc. and Subsidiaries
Consolidated Statements of Operations (unaudited)
| For the Three Months Ended | ||||||||||||||||||||
| (in thousands) | 3/31/2011 | 12/31/2010 | 9/30/2010 | 6/30/2010 | 3/31/2010 | |||||||||||||||
| INTEREST INCOME: |
||||||||||||||||||||
| Interest and fees on loans |
$ | 34,910 | 36,106 | 38,356 | 39,898 | 41,634 | ||||||||||||||
| Interest on securities available for sale |
2,597 | 2,815 | 2,847 | 2,714 | 3,645 | |||||||||||||||
| Interest on tax certificates |
1,410 | 1,544 | 2,837 | 514 | 2,356 | |||||||||||||||
| Interest and dividends on investments |
588 | 299 | 367 | 223 | 153 | |||||||||||||||
| Total interest income |
39,505 | 40,764 | 44,407 | 43,349 | 47,788 | |||||||||||||||
| INTEREST EXPENSE: |
||||||||||||||||||||
| Interest on deposits |
4,367 | 4,556 | 4,877 | 6,021 | 7,057 | |||||||||||||||
| Interest on advances from FHLB |
115 | 144 | 106 | 1 | 958 | |||||||||||||||
| Interest on short-term borrowed funds |
6 | 7 | 8 | 7 | 8 | |||||||||||||||
| Interest on debentures |
4,008 | 4,007 | 4,107 | 3,891 | 3,791 | |||||||||||||||
| Total interest expense |
8,496 | 8,714 | 9,098 | 9,920 | 11,814 | |||||||||||||||
| NET INTEREST INCOME |
31,009 | 32,050 | 35,309 | 33,429 | 35,974 | |||||||||||||||
| Provision for loan losses |
27,812 | 40,643 | 24,410 | 48,553 | 30,755 | |||||||||||||||
| NET INTEREST INCOME AFTER PROVISION |
3,197 | (8,593 | ) | 10,899 | (15,124 | ) | 5,219 | |||||||||||||
| NON-INTEREST INCOME: |
||||||||||||||||||||
| Service charges on deposits |
12,032 | 14,080 | 15,214 | 15,502 | 15,048 | |||||||||||||||
| Other service charges and fees |
7,191 | 7,528 | 7,495 | 7,739 | 7,378 | |||||||||||||||
| Securities activities, net |
(24 | ) | (34 | ) | (552 | ) | 312 | 3,138 | ||||||||||||
| Other |
4,008 | 3,091 | 5,204 | 2,970 | 2,900 | |||||||||||||||
| Total non-interest income |
23,207 | 24,665 | 27,361 | 26,523 | 28,464 | |||||||||||||||
| NON-INTEREST EXPENSE: |
||||||||||||||||||||
| Employee compensation and benefits |
19,290 | 19,868 | 23,549 | 25,155 | 25,378 | |||||||||||||||
| Occupancy and equipment |
12,585 | 12,999 | 13,263 | 13,745 | 13,582 | |||||||||||||||
| Advertising and business promotion |
1,695 | 2,389 | 2,026 | 2,239 | 1,944 | |||||||||||||||
| Professional fees |
3,359 | 6,518 | 6,209 | 4,824 | 2,887 | |||||||||||||||
| Check losses |
299 | 705 | 763 | 521 | 432 | |||||||||||||||
| Supplies and postage |
902 | 1,052 | 983 | 921 | 998 | |||||||||||||||
| Telecommunication |
575 | 635 | 702 | 662 | 534 | |||||||||||||||
| Cost associated with debt redemption |
10 | — | — | 53 | 7 | |||||||||||||||
| Provision for tax certificates |
779 | 800 | 885 | 2,134 | 733 | |||||||||||||||
| (Gain) loss on sale of real estate |
(453 | ) | 663 | (442 | ) | 1,490 | (104 | ) | ||||||||||||
| Impairment, restructuring and exit activities |
1,948 | 10,219 | 8,165 | 2,947 | 143 | |||||||||||||||
| Other |
8,301 | 8,280 | 7,304 | 7,958 | 7,580 | |||||||||||||||
| Total non-interest expense |
49,290 | 64,128 | 63,407 | 62,649 | 54,114 | |||||||||||||||
| Loss from continuing operations before income taxes |
(22,886 | ) | (48,056 | ) | (25,147 | ) | (51,250 | ) | (20,431 | ) | ||||||||||
| Provision (benefit) for income taxes |
1 | (2,261 | ) | 37 | — | 90 | ||||||||||||||
| Loss from continuing operations |
(22,887 | ) | (45,795 | ) | (25,184 | ) | (51,250 | ) | (20,521 | ) | ||||||||||
| Discontinued operations |
— | (500 | ) | — | — | — | ||||||||||||||
| Net loss |
(22,887 | ) | (46,295 | ) | (25,184 | ) | (51,250 | ) | (20,521 | ) | ||||||||||
| Less: net income attributable to noncontrolling interest |
(295 | ) | (259 | ) | (225 | ) | (239 | ) | (208 | ) | ||||||||||
| Net loss attributable to BankAtlantic Bancorp |
$ | (23,182 | ) | (46,554 | ) | (25,409 | ) | (51,489 | ) | (20,729 | ) | |||||||||
4
BankAtlantic Bancorp, Inc. and Subsidiaries
Consolidated Average Balance Sheet (unaudited)
| For the Three Months Ended | ||||||||||||||||||||||
| (in thousands except percentages and per share data) | 3/31/2011 | 12/31/2010 | 9/30/2010 | 6/30/2010 | 3/31/2010 | |||||||||||||||||
| Loans: |
||||||||||||||||||||||
| Residential real estate |
$ | 1,175,875 | 1,270,095 | 1,356,748 | 1,433,322 | 1,513,302 | ||||||||||||||||
| Commercial real estate |
891,043 | 1,010,148 | 1,061,918 | 1,079,760 | 1,148,435 | |||||||||||||||||
| Consumer |
620,986 | 635,564 | 653,631 | 670,173 | 688,173 | |||||||||||||||||
| Commercial business |
134,452 | 139,485 | 133,841 | 135,689 | 139,843 | |||||||||||||||||
| Small business |
300,931 | 304,406 | 306,927 | 308,254 | 309,549 | |||||||||||||||||
| Total Loans |
3,123,287 | 3,359,698 | 3,513,065 | 3,627,198 | 3,799,302 | |||||||||||||||||
| Investments |
1,117,901 | 882,974 | 748,299 | 648,462 | 603,874 | |||||||||||||||||
| Total interest earning assets |
4,241,188 | 4,242,672 | 4,261,364 | 4,275,660 | 4,403,176 | |||||||||||||||||
| Goodwill and core deposit intangibles |
14,411 | 14,718 | 15,028 | 15,353 | 15,652 | |||||||||||||||||
| Other non-interest earning assets |
294,489 | 272,805 | 271,950 | 324,727 | 324,910 | |||||||||||||||||
| Total assets |
$ | 4,550,088 | 4,530,195 | 4,548,342 | 4,615,740 | 4,743,738 | ||||||||||||||||
| Tangible assets - Non-GAAP |
(note 3) |
$ | 4,535,677 | 4,515,477 | 4,533,314 | 4,600,387 | 4,728,086 | |||||||||||||||
| Deposits: |
||||||||||||||||||||||
| Demand deposits |
$ | 944,956 | 924,035 | 907,294 | 916,131 | 864,413 | ||||||||||||||||
| Savings |
468,673 | 448,942 | 444,981 | 445,686 | 425,235 | |||||||||||||||||
| NOW |
1,519,105 | 1,476,258 | 1,484,558 | 1,525,475 | 1,467,103 | |||||||||||||||||
| Money market |
389,155 | 406,781 | 404,406 | 386,712 | 360,470 | |||||||||||||||||
| Certificates of deposit |
658,051 | 644,124 | 689,664 | 805,656 | 896,074 | |||||||||||||||||
| Total deposits |
3,979,940 | 3,900,140 | 3,930,903 | 4,079,660 | 4,013,295 | |||||||||||||||||
| Short-term borrowed funds |
19,191 | 18,099 | 26,187 | 25,528 | 26,332 | |||||||||||||||||
| FHLB advances |
134,833 | 149,130 | 106,685 | 1,264 | 173,011 | |||||||||||||||||
| Debentures |
344,971 | 341,409 | 340,230 | 334,507 | 331,403 | |||||||||||||||||
| Total borrowings |
498,995 | 508,638 | 473,102 | 361,299 | 530,746 | |||||||||||||||||
| Other liabilities |
55,040 | 58,015 | 59,207 | 57,152 | 57,755 | |||||||||||||||||
| Total liabilities |
4,533,975 | 4,466,793 | 4,463,212 | 4,498,111 | 4,601,796 | |||||||||||||||||
| Equity |
16,113 | 63,402 | 85,130 | 117,629 | 141,942 | |||||||||||||||||
| Total liabilities and equity |
$ | 4,550,088 | 4,530,195 | 4,548,342 | 4,615,740 | 4,743,738 | ||||||||||||||||
| Other comprehensive loss in equity |
(6,240 | ) | (2,743 | ) | (2,499 | ) | (3,454 | ) | (846 | ) | ||||||||||||
| Tangible equity - Non-GAAP |
(note 3) |
$ | 7,942 | 51,427 | 72,601 | 105,730 | 127,136 | |||||||||||||||
| Net Interest Margin |
2.92 | % | 3.03 | % | 3.32 | % | 3.13 | % | 3.33 | % | ||||||||||||
5
Consolidated BankAtlantic Bancorp, Inc. and Subsidiaries
Nonperforming Assets and Credit Quality Statistics
| (in thousands) | As of | |||||||||||||||||||
| 3/31/2011 | 12/31/2010 | 9/30/2010 | 6/30/2010 | 3/31/2010 | ||||||||||||||||
| Nonaccrual loans: |
||||||||||||||||||||
| BankAtlantic |
$ | 362,604 | 370,959 | 404,087 | 362,126 | 301,365 | ||||||||||||||
| Parent- Work out Sub |
11,360 | 14,508 | 19,916 | 24,358 | 35,326 | |||||||||||||||
| Consolidated nonaccrual loans |
$ | 373,964 | 385,467 | 424,003 | 386,484 | 336,691 | ||||||||||||||
| Quarter-to-Date Net Charge-offs: |
||||||||||||||||||||
| BankAtlantic |
$ | (27,823 | ) | (57,688 | ) | (21,887 | ) | (32,547 | ) | (36,074 | ) | |||||||||
| Parent- Work out Sub |
4 | (3,741 | ) | (4,438 | ) | (5,741 | ) | (4,302 | ) | |||||||||||
| Consolidated charge-offs |
$ | (27,819 | ) | (61,429 | ) | (26,325 | ) | (38,288 | ) | (40,376 | ) | |||||||||
| Quarter-to-date Loan Provision: |
||||||||||||||||||||
| BankAtlantic |
$ | 27,832 | 40,144 | 23,012 | 43,634 | 32,034 | ||||||||||||||
| Parent- Work out Sub |
(20 | ) | 498 | 1,398 | 4,919 | (1,279 | ) | |||||||||||||
| Consolidated loan provision |
$ | 27,812 | 40,642 | 24,410 | 48,553 | 30,755 | ||||||||||||||
| Allowance for Loan Loss: |
||||||||||||||||||||
| BankAtlantic |
$ | 154,237 | 161,309 | 181,760 | 180,635 | 169,548 | ||||||||||||||
| Parent- Work out Sub |
814 | 830 | 4,187 | 7,227 | 8,049 | |||||||||||||||
| Consolidated allowance for loan loss |
$ | 155,051 | 162,139 | 185,947 | 187,862 | 177,597 | ||||||||||||||
| Nonperforming Assets: |
||||||||||||||||||||
| BankAtlantic |
$ | 432,316 | 438,923 | 464,865 | 410,542 | 343,693 | ||||||||||||||
| Parent- Work out Sub |
20,195 | 24,668 | 29,682 | 34,190 | 45,858 | |||||||||||||||
| Consolidated nonperforming assets |
$ | 452,511 | 463,591 | 494,547 | 444,732 | 389,551 | ||||||||||||||
| Consolidated Credit Quality Statistics |
||||||||||||||||||||
| Allowance for loan losses to total loans |
% | 5.21 | 5.10 | 5.43 | 5.25 | 4.81 | ||||||||||||||
| Allowance to nonaccrual loans |
% | 41.46 | 42.06 | 43.86 | 48.61 | 52.75 | ||||||||||||||
| Provision to average loans |
% | 3.56 | 4.84 | 2.78 | 5.35 | 3.24 | ||||||||||||||
| Nonaccrual loans, gross to total assets |
% | 8.36 | 8.55 | 9.36 | 8.30 | 7.09 | ||||||||||||||
| Nonperforming assets, gross to total assets |
% | 10.12 | 10.28 | 10.92 | 9.55 | 8.20 | ||||||||||||||
6
BankAtlantic Bancorp, Inc. and Subsidiaries
Reconciliation of GAAP Financial Measures to Non-GAAP Measures
Management uses non-GAAP financial measures to supplement its GAAP financial information and to provide additional useful measures in the evaluation of the Company’s operating results and any related trends that may be affecting the Company’s business. Management uses pre-tax core operating earnings to measure the Company’s ongoing financial performance excluding items that are not currently controllable by management. Management uses book value per share and tangible book value per share to enable investors to compare these measures to the quoted market price of the Company’s Class A common stock and to other companies in the industry. The return on average tangible equity and average tangible assets is used by management to measure the Company’s effectiveness in its use of capital and assets, respectively, and to allow for comparison to other companies in the industry. These disclosures should not be viewed as a substitute for operating results determined in accordance with GAAP, nor are they necessarily comparable to non-GAAP performance measures that may be presented by other companies.
Reconciliation of loss from continuing operations before income taxes to pre-tax core operating earnings
| For the Three Months Ended | ||||||||||||||||||||
| (in thousands) | 3/31/2011 | 12/31/2010 | 9/30/2010 | 6/30/2010 | 3/31/2010 | |||||||||||||||
| Loss from continuing operations before income taxes |
$ | (22,886 | ) | (48,056 | ) | (25,147 | ) | (51,250 | ) | (20,431 | ) | |||||||||
| Costs associated with debt redemption |
10 | — | — | 53 | 7 | |||||||||||||||
| Provision for tax certificates |
779 | 800 | 885 | 2,134 | 733 | |||||||||||||||
| Loss (gain) on sale of real estate |
(453 | ) | 663 | (442 | ) | 1,490 | (104 | ) | ||||||||||||
| Impairment, restructuring and exit activities |
1,948 | 10,219 | 8,165 | 2,947 | 143 | |||||||||||||||
| Provision for loan losses |
27,812 | 40,643 | 24,410 | 48,553 | 30,755 | |||||||||||||||
| Non-GAAP pre-tax core operating earnings |
$ | 7,210 | 4,269 | 7,871 | 3,927 | 11,103 | ||||||||||||||
| Reconciliation of equity to tangible book value per share
|
| |||||||||||||||||||
| As of | ||||||||||||||||||||
| (in thousands) | 3/31/2011 | 12/31/2010 | 9/30/2010 | 6/30/2010 | 3/31/2010 | |||||||||||||||
| Equity |
$ | (8,729 | ) | 14,744 | 64,082 | 77,466 | 119,611 | |||||||||||||
| Goodwill and core deposit intangibles |
(14,260 | ) | (14,569 | ) | (14,877 | ) | (15,186 | ) | (15,494 | ) | ||||||||||
| Other comprehensive loss |
6,807 | 6,088 | 3,207 | 2,320 | 4,141 | |||||||||||||||
| Tangible book value |
$ | (16,182 | ) | 6,263 | 52,412 | 64,600 | 108,258 | |||||||||||||
| Common shares outstanding, period end |
62,954,296 | 62,570,546 | 62,570,546 | 53,921,351 | 49,220,267 | |||||||||||||||
| Book value per share |
$ | (0.14 | ) | 0.24 | 1.02 | 1.44 | 2.43 | |||||||||||||
| Tangible book value per share - Non-GAAP |
$ | (0.26 | ) | 0.10 | 0.84 | 1.20 | 2.20 | |||||||||||||
| Reconciliation of return on average assets and average equity to return on average tangible assets and average tangible equity
|
| |||||||||||||||||||
| For the Three Months Ended | ||||||||||||||||||||
| (in thousands) | 3/31/2011 | 12/31/2010 | 9/30/2010 | 6/30/2010 | 3/31/2010 | |||||||||||||||
| Net loss from continuing operations |
$ | (22,887 | ) | (45,795 | ) | (25,184 | ) | (51,250 | ) | (20,521 | ) | |||||||||
| Average total assets |
4,550,088 | 4,530,195 | 4,548,342 | 4,615,740 | 4,743,738 | |||||||||||||||
| Average goodwill and core deposit intangibles |
(14,411 | ) | (14,718 | ) | (15,028 | ) | (15,353 | ) | (15,652 | ) | ||||||||||
| Average tangible assets |
4,535,677 | 4,515,477 | 4,533,314 | 4,600,387 | 4,728,086 | |||||||||||||||
| Average equity |
16,113 | 63,402 | 85,130 | 117,629 | 141,942 | |||||||||||||||
| Average goodwill and core deposit intangibles |
(14,411 | ) | (14,718 | ) | (15,028 | ) | (15,353 | ) | (15,652 | ) | ||||||||||
| Other comprehensive loss |
6,240 | 2,743 | 2,499 | 3,454 | 846 | |||||||||||||||
| Average tangible equity |
$ | 7,942 | 51,427 | 72,601 | 105,730 | 127,136 | ||||||||||||||
| Return on average assets from continuing operations |
-2.01 | % | -4.04 | % | -2.21 | % | -4.44 | % | -1.73 | % | ||||||||||
| Return on average tangible assets from continuing operations - Non-GAAP |
-2.02 | % | -4.06 | % | -2.22 | % | -4.46 | % | -1.74 | % | ||||||||||
| Return on average equity from continuing operations |
-568.16 | % | -288.92 | % | -118.33 | % | -174.28 | % | -57.83 | % | ||||||||||
| Return on average tangible equity from continuing operations - Non-GAAP |
-1152.71 | % | -356.19 | % | -138.75 | % | -193.89 | % | -64.56 | % | ||||||||||
7
BankAtlantic (Bank Operations Business Segment)
Summary of Selected Financial Data (unaudited)
| (in thousands except percentages) | For the Three Months Ended | |||||||||||||||||||
| 3/31/2011 | 12/31/2010 | 9/30/2010 | 6/30/2010 | 3/31/2010 | ||||||||||||||||
| Statistics: |
||||||||||||||||||||
| Average interest earning assets |
$ | 4,224,423 | 4,220,720 | 4,234,115 | 4,240,545 | 4,355,771 | ||||||||||||||
| Average interest bearing liabilities |
$ | 3,221,899 | 3,177,611 | 3,189,179 | 3,220,458 | 3,383,776 | ||||||||||||||
| Period end borrowings to deposits and borrowings |
% | 2.15 | 5.50 | 5.76 | 4.13 | 4.84 | ||||||||||||||
| Efficiency ratio |
% | 80.10 | 105.60 | 91.87 | 94.05 | 77.86 | ||||||||||||||
| Yield on interest earning assets |
% | 3.73 | 3.86 | 4.19 | 4.08 | 4.38 | ||||||||||||||
| Cost of interest-bearing liabilities |
% | 0.59 | 0.62 | 0.65 | 0.78 | 0.99 | ||||||||||||||
| Interest spread |
% | 3.14 | 3.24 | 3.54 | 3.30 | 3.39 | ||||||||||||||
| Net interest margin |
% | 3.28 | 3.40 | 3.70 | 3.49 | 3.61 | ||||||||||||||
| Non-GAAP Measures (Note 1) |
||||||||||||||||||||
| Average tangible assets |
$ | 4,495,637 | 4,473,959 | 4,489,189 | 4,544,611 | 4,668,854 | ||||||||||||||
| Average tangible equity |
$ | 282,135 | 319,982 | 338,712 | 356,572 | 367,220 | ||||||||||||||
| Pre-tax core operating earnings |
$ | 11,575 | 8,323 | 13,922 | 9,078 | 15,774 | ||||||||||||||
| Core operating efficiency ratio |
% | 79.91 | 86.12 | 78.95 | 85.65 | 76.71 | ||||||||||||||
| Return on average tangible assets |
% | (1.46 | ) | (3.69 | ) | (1.57 | ) | (3.51 | ) | (1.47 | ) | |||||||||
| Return on average tangible equity |
% | (23.21 | ) | (51.56 | ) | (20.87 | ) | (44.73 | ) | (18.66 | ) | |||||||||
| Tangible capital to tangible assets |
% | 5.80 | 6.12 | 7.08 | 7.29 | 7.55 | ||||||||||||||
| Earning assets repricing at period end: |
||||||||||||||||||||
| Percent of earning assets that have fixed rates |
% | 46 | 45 | 45 | 47 | 48 | ||||||||||||||
| Percent of earning assets that have variable rates |
% | 54 | 55 | 55 | 53 | 52 | ||||||||||||||
| Regulatory capital ratios and statistics at period end |
||||||||||||||||||||
| Total risk-based capital |
% | 11.76 | 11.72 | 12.59 | 12.86 | 12.86 | ||||||||||||||
| Tier I risk-based capital |
% | 9.68 | 9.68 | 10.59 | 10.87 | 10.90 | ||||||||||||||
| Core capital |
% | 5.97 | 6.22 | 7.17 | 7.36 | 7.51 | ||||||||||||||
| Risk-weighted assets |
$ | 2,713,638 | 2,855,415 | 3,021,862 | 3,104,341 | 3,206,075 | ||||||||||||||
| Adjusted total assets |
$ | 4,401,218 | 4,444,797 | 4,459,875 | 4,584,519 | 4,656,270 | ||||||||||||||
Note 1
See page 15 for a reconciliation of non-GAAP measures to GAAP financial measures.
8
BankAtlantic (Bank Operations Business Segment)
Condensed Statements of Operations (unaudited)
| For the Three Months Ended | ||||||||||||||||||||
| (in thousands) | 3/31/2011 | 12/31/2010 | 9/30/2010 | 6/30/2010 | 3/31/2010 | |||||||||||||||
| Net interest income |
$ | 34,704 | 35,766 | 39,101 | 37,008 | 39,459 | ||||||||||||||
| Provision for loan losses |
27,832 | 40,145 | 23,012 | 43,634 | 32,034 | |||||||||||||||
| Net interest income after provision for loan losses |
6,872 | (4,379 | ) | 16,089 | (6,626 | ) | 7,425 | |||||||||||||
| Non-interest income |
||||||||||||||||||||
| Service charges on deposits |
12,032 | 14,080 | 15,214 | 15,502 | 15,048 | |||||||||||||||
| Other service charges and fees |
7,191 | 7,528 | 7,495 | 7,739 | 7,378 | |||||||||||||||
| Securities activities, net |
(24 | ) | (34 | ) | (543 | ) | 309 | 3,132 | ||||||||||||
| Other non-interest income |
3,714 | 2,625 | 4,869 | 2,721 | 2,699 | |||||||||||||||
| Total non-interest income |
22,913 | 24,199 | 27,035 | 26,271 | 28,257 | |||||||||||||||
| Non-interest expense |
||||||||||||||||||||
| Employee compensation and benefits |
18,763 | 20,028 | 22,475 | 24,254 | 24,374 | |||||||||||||||
| Occupancy and equipment |
12,585 | 12,996 | 13,263 | 13,745 | 13,581 | |||||||||||||||
| Advertising and business promotion |
1,669 | 2,333 | 1,917 | 2,121 | 1,934 | |||||||||||||||
| Professional fees |
2,981 | 5,638 | 4,942 | 4,220 | 2,565 | |||||||||||||||
| Check losses |
299 | 705 | 763 | 521 | 432 | |||||||||||||||
| Supplies and postage |
870 | 1,024 | 929 | 895 | 965 | |||||||||||||||
| Telecommunication |
572 | 632 | 697 | 655 | 529 | |||||||||||||||
| Cost associated with debt redemption |
10 | — | — | 53 | 7 | |||||||||||||||
| Provision for tax certificates |
779 | 800 | 885 | 2,134 | 733 | |||||||||||||||
| (Gain) loss on sale of real estate |
(278 | ) | 663 | (442 | ) | 880 | (104 | ) | ||||||||||||
| Impairment, restructuring and exit activities |
(399 | ) | 10,219 | 8,099 | 2,247 | 143 | ||||||||||||||
| Other |
8,303 | 8,286 | 7,228 | 7,790 | 7,562 | |||||||||||||||
| Total non-interest expense |
46,154 | 63,324 | 60,756 | 59,515 | 52,721 | |||||||||||||||
| Loss from bank operations business segment before income taxes |
(16,369 | ) | (43,504 | ) | (17,632 | ) | (39,870 | ) | (17,039 | ) | ||||||||||
| Provision (benefit) for income taxes |
1 | (2,261 | ) | 37 | — | 90 | ||||||||||||||
| Net loss from bank operations business segment |
(16,370 | ) | (41,243 | ) | (17,669 | ) | (39,870 | ) | (17,129 | ) | ||||||||||
| Less: net income attributable to noncontrolling interest |
(295 | ) | (259 | ) | (225 | ) | (239 | ) | (208 | ) | ||||||||||
| Net loss attributable to BankAtlantic |
$ | (16,665 | ) | (41,502 | ) | (17,894 | ) | (40,109 | ) | (17,337 | ) | |||||||||
9
BankAtlantic (Bank Operations Business Segment)
Condensed Statements of Financial Condition (unaudited)
| As of | ||||||||||||||||||||
| (in thousands) | 3/31/2011 | 12/31/2010 | 9/30/2010 | 6/30/2010 | 3/31/2010 | |||||||||||||||
| ASSETS |
||||||||||||||||||||
| Loans receivable, net |
$ | 2,813,097 | 3,009,771 | 3,218,097 | 3,361,772 | 3,480,198 | ||||||||||||||
| Loans held for sale (lower of cost or fair value) |
44,542 | 21,704 | 2,839 | 5,861 | 5,030 | |||||||||||||||
| Investment securities and FHLB stock |
121,394 | 133,371 | 150,035 | 189,120 | 137,189 | |||||||||||||||
| Available for sale securities |
376,034 | 424,360 | 446,591 | 275,065 | 243,779 | |||||||||||||||
| Goodwill |
13,081 | 13,081 | 13,081 | 13,081 | 13,081 | |||||||||||||||
| Core deposit intangible asset |
1,179 | 1,488 | 1,796 | 2,105 | 2,413 | |||||||||||||||
| Assets held for sale |
36,909 | 37,333 | 37,209 | — | — | |||||||||||||||
| Other assets |
1,018,330 | 828,060 | 615,828 | 764,278 | 806,311 | |||||||||||||||
| Total assets |
$ | 4,424,566 | 4,469,168 | 4,485,476 | 4,611,282 | 4,688,001 | ||||||||||||||
| LIABILITIES AND EQUITY |
||||||||||||||||||||
| Deposits |
||||||||||||||||||||
| Demand |
$ | 879,820 | 792,260 | 809,830 | 902,486 | 900,984 | ||||||||||||||
| Savings |
452,533 | 418,304 | 411,612 | 442,142 | 443,288 | |||||||||||||||
| NOW |
1,307,041 | 1,370,568 | 1,288,792 | 1,496,369 | 1,501,274 | |||||||||||||||
| Money market |
366,968 | 354,282 | 386,091 | 397,313 | 361,877 | |||||||||||||||
| Certificates of deposit |
609,538 | 616,454 | 601,956 | 749,948 | 840,017 | |||||||||||||||
| Deposits held for sale |
390,432 | 341,146 | 339,360 | — | — | |||||||||||||||
| Total deposits |
4,006,332 | 3,893,014 | 3,837,641 | 3,988,258 | 4,047,440 | |||||||||||||||
| Advances from Federal Home Loan Bank |
45,000 | 170,000 | 180,000 | 115,000 | 152,008 | |||||||||||||||
| Short term borrowings |
20,909 | 34,435 | 32,666 | 34,685 | 31,797 | |||||||||||||||
| Subordinated debentures |
22,000 | 22,000 | 22,000 | 22,000 | 22,000 | |||||||||||||||
| Liabilities held for sale |
79 | 87 | 100 | — | — | |||||||||||||||
| Other liabilities |
60,178 | 62,526 | 81,452 | 100,904 | 66,574 | |||||||||||||||
| Total liabilities |
4,154,498 | 4,182,062 | 4,153,859 | 4,260,847 | 4,319,819 | |||||||||||||||
| Equity |
270,068 | 287,106 | 331,617 | 350,435 | 368,182 | |||||||||||||||
| Total liabilities and equity |
$ | 4,424,566 | 4,469,168 | 4,485,476 | 4,611,282 | 4,688,001 | ||||||||||||||
10
BankAtlantic (Bank Operations Business Segment)
Average Balance Sheet - Yield / Rate Analysis
| For the Three Months Ended | ||||||||||||||||||||||||
| March 31, 2011 | March 31, 2010 | |||||||||||||||||||||||
| ( in thousands) | Average Balance |
Revenue/ Expense |
Yield/ Rate |
Average Balance |
Revenue/ Expense |
Yield/ Rate |
||||||||||||||||||
| Loans: |
||||||||||||||||||||||||
| Residential real estate |
$ | 1,175,875 | 13,894 | 4.73 | % | $ | 1,513,302 | 18,901 | 5.00 | % | ||||||||||||||
| Commercial real estate |
875,825 | 9,502 | 4.34 | 1,102,576 | 10,843 | 3.93 | ||||||||||||||||||
| Consumer |
620,986 | 4,527 | 2.92 | 688,173 | 4,900 | 2.85 | ||||||||||||||||||
| Commercial business |
132,916 | 2,252 | 6.78 | 138,307 | 2,092 | 6.05 | ||||||||||||||||||
| Small business |
300,930 | 4,687 | 6.23 | 309,549 | 4,843 | 6.26 | ||||||||||||||||||
| Total loans |
3,106,532 | 34,862 | 4.49 | 3,751,907 | 41,579 | 4.43 | ||||||||||||||||||
| Investments |
1,117,891 | 4,559 | 1.63 | 603,864 | 6,136 | 4.06 | ||||||||||||||||||
| Total interest earning assets |
4,224,423 | 39,421 | 3.73 | % | 4,355,771 | 47,715 | 4.38 | % | ||||||||||||||||
| Goodwill and core deposit intangibles |
14,411 | 15,652 | ||||||||||||||||||||||
| Other non-interest earning assets |
271,214 | 313,083 | ||||||||||||||||||||||
| Total Assets |
$ | 4,510,048 | $ | 4,684,506 | ||||||||||||||||||||
| Deposits: |
||||||||||||||||||||||||
| Savings |
$ | 468,673 | 272 | 0.24 | % | $ | 425,235 | 333 | 0.32 | % | ||||||||||||||
| NOW |
1,519,105 | 1,512 | 0.40 | 1,467,103 | 2,218 | 0.61 | ||||||||||||||||||
| Money market |
389,155 | 442 | 0.46 | 360,470 | 629 | 0.71 | ||||||||||||||||||
| Certificates of deposit |
658,050 | 2,141 | 1.32 | 896,074 | 3,877 | 1.75 | ||||||||||||||||||
| Total interest bearing deposits |
3,034,983 | 4,367 | 0.58 | 3,148,882 | 7,057 | 0.91 | ||||||||||||||||||
| Short-term borrowed funds |
30,083 | 10 | 0.13 | 39,376 | 13 | 0.13 | ||||||||||||||||||
| Advances from FHLB |
134,833 | 115 | 0.35 | 173,011 | 958 | 2.25 | ||||||||||||||||||
| Subordinated debentures and bonds payable |
22,000 | 225 | 4.15 | 22,507 | 228 | 4.11 | ||||||||||||||||||
| Total interest bearing liabilities |
3,221,899 | 4,717 | 0.59 | 3,383,776 | 8,256 | 0.99 | ||||||||||||||||||
| Demand deposits |
944,950 | 864,391 | ||||||||||||||||||||||
| Non-interest bearing other liabilities |
52,892 | 54,312 | ||||||||||||||||||||||
| Total Liabilities |
4,219,741 | 4,302,479 | ||||||||||||||||||||||
| Equity |
290,307 | 382,027 | ||||||||||||||||||||||
| Total liabilities and equity |
$ | 4,510,048 | $ | 4,684,506 | ||||||||||||||||||||
| Net interest income/net interest spread |
$ | 34,704 | 3.14 | % | $ | 39,459 | 3.39 | % | ||||||||||||||||
| Margin |
||||||||||||||||||||||||
| Interest income/interest earning assets |
3.73 | % | 4.38 | % | ||||||||||||||||||||
| Interest expense/interest earning assets |
0.45 | 0.77 | ||||||||||||||||||||||
| Net interest margin |
3.28 | % | 3.61 | % | ||||||||||||||||||||
11
BankAtlantic (Bank Operations Business Segment)
Allowance for Loan Loss and Credit Quality
| (in thousands) | For the Three Months Ended | |||||||||||||||||||
| 3/31/2011 | 12/31/2010 | 9/30/2010 | 6/30/2010 | 3/31/2010 | ||||||||||||||||
| Allowance for Loan Losses |
||||||||||||||||||||
| Beginning balance |
$ | 161,309 | 181,760 | 180,635 | 169,548 | 173,588 | ||||||||||||||
| Charge-offs: |
||||||||||||||||||||
| Residential real estate |
(8,011 | ) | (4,272 | ) | (4,619 | ) | (5,233 | ) | (4,181 | ) | ||||||||||
| Commercial real estate |
(11,277 | ) | (44,979 | ) | (5,969 | ) | (14,146 | ) | (21,332 | ) | ||||||||||
| Commercial business |
(464 | ) | (996 | ) | — | — | — | |||||||||||||
| Consumer |
(7,814 | ) | (7,009 | ) | (9,881 | ) | (11,822 | ) | (10,771 | ) | ||||||||||
| Small business |
(2,611 | ) | (2,409 | ) | (2,402 | ) | (2,225 | ) | (837 | ) | ||||||||||
| Total charge-offs |
(30,177 | ) | (59,665 | ) | (22,871 | ) | (33,426 | ) | (37,121 | ) | ||||||||||
| Recoveries: |
||||||||||||||||||||
| Residential real estate |
131 | 284 | 383 | 435 | 64 | |||||||||||||||
| Commercial real estate |
714 | 1,210 | — | 65 | 62 | |||||||||||||||
| Commercial business |
791 | 57 | — | 1 | 658 | |||||||||||||||
| Consumer |
408 | 300 | 294 | 254 | 194 | |||||||||||||||
| Small business |
310 | 126 | 307 | 124 | 69 | |||||||||||||||
| Total recoveries |
2,354 | 1,977 | 984 | 879 | 1,047 | |||||||||||||||
| Net charge-offs |
(27,823 | ) | (57,688 | ) | (21,887 | ) | (32,547 | ) | (36,074 | ) | ||||||||||
| Transfer to held for sale |
(7,081 | ) | (2,907 | ) | — | — | — | |||||||||||||
| Provision for loan losses |
27,832 | 40,144 | 23,012 | 43,634 | 32,034 | |||||||||||||||
| Ending balance |
$ | 154,237 | 161,309 | 181,760 | 180,635 | 169,548 | ||||||||||||||
| As of | ||||||||||||||||||||
| 3/31/2011 | 12/31/2010 | 9/30/2010 | 6/30/2010 | 3/31/2010 | ||||||||||||||||
| Credit Quality |
||||||||||||||||||||
| Nonaccrual loans |
||||||||||||||||||||
| Commercial real estate |
$ | 239,798 | 243,299 | 275,057 | 230,007 | 168,937 | ||||||||||||||
| Consumer |
13,231 | 14,120 | 13,282 | 13,818 | 14,428 | |||||||||||||||
| Small business |
12,172 | 10,879 | 10,995 | 12,248 | 10,971 | |||||||||||||||
| Residential real estate |
81,555 | 86,538 | 87,563 | 83,894 | 88,262 | |||||||||||||||
| Commercial business |
15,848 | 16,123 | 17,190 | 22,159 | 18,767 | |||||||||||||||
| Total Nonaccrual loans |
362,604 | 370,959 | 404,087 | 362,126 | 301,365 | |||||||||||||||
| Nonaccrual tax certificates |
3,402 | 3,636 | 2,761 | 2,836 | 1,495 | |||||||||||||||
| Real estate owned |
66,310 | 64,328 | 58,017 | 45,492 | 40,833 | |||||||||||||||
| Other repossessed assets |
— | — | — | 88 | — | |||||||||||||||
| Total nonperforming assets |
$ | 432,316 | 438,923 | 464,865 | 410,542 | 343,693 | ||||||||||||||
| Allowance for loan losses to total loans |
% | 5.20 | 5.08 | 5.34 | 5.08 | 4.64 | ||||||||||||||
| Allowance to nonaccrual loans |
% | 42.54 | 43.48 | 44.98 | 49.88 | 56.26 | ||||||||||||||
| Provision to average loans |
% | 3.58 | 4.81 | 2.64 | 4.86 | 3.42 | ||||||||||||||
| Annualized net charge-offs to average loans |
% | 3.58 | 6.91 | 2.51 | 3.62 | 3.85 | ||||||||||||||
| Nonaccrual loans to total assets |
% | 8.20 | 8.30 | 9.01 | 7.85 | 6.43 | ||||||||||||||
| Nonperforming assets to total assets |
% | 9.77 | 9.82 | 10.36 | 8.90 | 7.33 | ||||||||||||||
12
BankAtlantic (Bank Operations Business Segment)
Delinquencies, Excluding Non-Accrual Loans, at Period-End
| ($ in thousands) | 3/31/2011 | 12/31/2010 | 9/30/2010 | 6/30/2010 | 3/31/2010 | |||||||||||||||||||||||||||||||||||
| Commercial real estate |
$ | 1,400 | 31 | 14,317 | 7,537 | 40,642 | ||||||||||||||||||||||||||||||||||
| Consumer |
12,025 | 12,405 | 12,004 | 13,181 | 14,858 | |||||||||||||||||||||||||||||||||||
| Small business |
2,200 | 2,712 | 2,927 | 4,182 | 3,891 | |||||||||||||||||||||||||||||||||||
| Residential real estate |
20,528 | 23,053 | 17,946 | 18,472 | 26,893 | |||||||||||||||||||||||||||||||||||
| Commercial business |
19,552 | * | ** | — | — | — | 1,129 | |||||||||||||||||||||||||||||||||
| Total BankAtlantic |
$ | 55,705 | 38,201 | 47,194 | 43,372 | 87,413 | ||||||||||||||||||||||||||||||||||
| 3/31/2011 | 12/31/2010 | 9/30/2010 | 6/30/2010 | 3/31/2010 | ||||||||||||||||||||||||||||||||||||
| Commercial real estate |
% | 0.17 | * | 0.00 | * | 1.43 | * | 0.72 | * | 3.85 | * | |||||||||||||||||||||||||||||
| Consumer |
% | 2.00 | 2.01 | 1.90 | 2.04 | 2.23 | ||||||||||||||||||||||||||||||||||
| Small business |
% | 0.74 | 0.89 | 0.96 | 1.35 | 1.26 | ||||||||||||||||||||||||||||||||||
| Residential real estate |
% | 1.83 | * | * | 1.88 | * | * | 1.37 | * | * | 1.32 | * | * | 1.83 | * | * | ||||||||||||||||||||||||
| Commercial business |
% | 15.36 | * | ** | — | — | — | 0.84 | ||||||||||||||||||||||||||||||||
| Total BankAtlantic |
% | 1.86 | 1.20 | 1.39 | 1.23 | 2.40 | ||||||||||||||||||||||||||||||||||
| * | Excludes $0, $0, $12.0 million, $1.2 million and $0 of Commercial Real Estate loans at March 31, December 31, September 30, June 30, and March 31, 2010, respectively, which had matured and had been approved for renewal or forbearance but were not fully documented at period end. Including these loans, Commercial Real Estate delinquencies were 2.63% and.83% and total BankAtlantic delinquencies would have been 1.75% and 1.26% at September 30, 2010 and June 30, 2010, respectively. |
| ** | Includes $1.0 billion, $1.1 billion, $1.2 billion, $1.3 billion and $1.4 billion of purchased residential loans with delinquencies excluding non-accrual loans of 1.58%, 1.77%, 1.19%, 1.09% and 1.63% as of March 31, 2011, December 31, 2010, September 30, 2010, June 30, 2010 and March 31, 2010, respectively. |
| *** | Amount represents a loan relationship that is 59 days past due as to maturity and is in the process of renewal. |
BankAtlantic (Bank Operations Business Segment)
Loan Provision & Allowance for Loan Losses
| ($ in thousands) | 1Q 2011 Loan Provision |
Allowance for Loan Losses |
% of Reserves to Total Loans |
|||||||||
| Commercial real estate |
$ | 7,252 | 78,328 | 9.32 | % | |||||||
| Consumer |
2,873 | 27,510 | 4.57 | |||||||||
| Small business |
913 | 10,125 | 3.40 | |||||||||
| Residential real estate |
17,199 | 27,566 | 2.46 | |||||||||
| Commercial business |
(405 | ) | 10,708 | 8.41 | ||||||||
| Total BankAtlantic |
$ | 27,832 | 154,237 | 5.20 | % | |||||||
13
BankAtlantic (Bank Operations Business Segment)
Reconciliation of GAAP Financial Measures to Non-GAAP Measures
Management uses non-GAAP financial measures to supplement its GAAP financial information and to provide additional useful measures in the evaluation of BankAtlantic’s operating results and any related trends that may be affecting BankAtlantic’s business. Management uses pre-tax core operating earnings to measure BankAtlantic’s ongoing financial performance excluding items that are not currently controllable by management. Management uses core expenses to measure expense reduction trends excluding items that are not currently controllable by management. The core operating efficiency ratio is used by management to measure the costs expended to generate a dollar of revenues excluding items that are not currently controllable by management. The return on average tangible equity and average tangible assets is used by management to measure BankAtlantic’s effectiveness in its use of capital and assets, respectively, and to allow for comparison to other companies in the industry. The tangible equity to tangible asset ratio is used by management to evaluate capital adequacy trends and to allow for comparison to other companies in the industry. Management uses the core deposit measure to assess trends relating to its lower cost deposit categories, which management believes may generally be more indicative of relationship deposits. These disclosures should not be viewed as a substitute for operating results determined in accordance with GAAP, nor are they necessarily comparable to non-GAAP performance measures that may be presented by other companies.
Reconciliation of loss from bank operations business segment before income taxes to pre-tax core operating earnings
| For the Three Months Ended | ||||||||||||||||||||
| (in thousands) | 3/31/2011 | 12/31/2010 | 9/30/2010 | 6/30/2010 | 3/31/2009 | |||||||||||||||
| Loss from bank operations business segment before income taxes |
$ | (16,369 | ) | (43,504 | ) | (17,632 | ) | (39,870 | ) | (17,039 | ) | |||||||||
| Costs associated with debt redemption |
10 | — | — | 53 | 7 | |||||||||||||||
| Provision for tax certificates |
779 | 800 | 885 | 2,134 | 733 | |||||||||||||||
| Loss (gain) on sale of real estate |
(278 | ) | 663 | (442 | ) | 880 | (104 | ) | ||||||||||||
| Impairment, restructuring and exit activities |
(399 | ) | 10,219 | 8,099 | 2,247 | 143 | ||||||||||||||
| FDIC special assessment |
— | — | — | — | — | |||||||||||||||
| Provision for loan losses |
27,832 | 40,145 | 23,012 | 43,634 | 32,034 | |||||||||||||||
| Non-GAAP pre-tax core operating earnings |
$ | 11,575 | 8,323 | 13,922 | 9,078 | 15,774 | ||||||||||||||
Reconciliation of non-interest expense to core expenses and calculation of core operating efficiency ratio
| For the Three Months Ended | ||||||||||||||||||||
| ($ in thousands) | 3/31/2011 | 12/31/2010 | 9/30/2010 | 6/30/2010 | 3/31/2009 | |||||||||||||||
| Non-interest expense |
$ | 46,154 | 63,324 | 60,756 | 59,515 | 52,721 | ||||||||||||||
| Costs associated with debt redemption |
(10 | ) | — | — | (53 | ) | (7 | ) | ||||||||||||
| Provision for tax certificates |
(779 | ) | (800 | ) | (885 | ) | (2,134 | ) | (733 | ) | ||||||||||
| Gain (loss) on sale of real estate |
278 | (663 | ) | 442 | (880 | ) | 104 | |||||||||||||
| Impairment, restructuring and exit activities |
399 | (10,219 | ) | (8,099 | ) | (2,247 | ) | (143 | ) | |||||||||||
| FDIC special assessment |
— | — | — | — | — | |||||||||||||||
| Core expenses |
$ | 46,042 | 51,642 | 52,214 | 54,201 | 51,942 | ||||||||||||||
| Net interest income |
34,704 | 35,766 | 39,101 | 37,008 | 39,459 | |||||||||||||||
| Non-interest income |
22,913 | 24,199 | 27,035 | 26,271 | 28,257 | |||||||||||||||
| Total revenues |
$ | 57,617 | 59,965 | 66,136 | 63,279 | 67,716 | ||||||||||||||
| Non-GAAP core operating efficiency ratio |
79.91 | % | 86.12 | % | 78.95 | % | 85.65 | % | 76.71 | % | ||||||||||
Reconciliation of return on average assets and average equity to return on average tangible assets and average tangible equity
| For the Three Months Ended | ||||||||||||||||||||
| ($ in thousands) | 3/31/2011 | 12/31/2010 | 9/30/2010 | 6/30/2010 | 3/31/2009 | |||||||||||||||
| Net loss from bank operations business segment |
$ | (16,370 | ) | (41,243 | ) | (17,669 | ) | (39,870 | ) | (17,129 | ) | |||||||||
| Average total assets |
4,510,048 | 4,488,677 | 4,504,217 | 4,559,964 | 4,684,506 | |||||||||||||||
| Average goodwill and core deposit intangibles |
(14,411 | ) | (14,718 | ) | (15,028 | ) | (15,353 | ) | (15,652 | ) | ||||||||||
| Average tangible assets |
4,495,637 | 4,473,959 | 4,489,189 | 4,544,611 | 4,668,854 | |||||||||||||||
| Average equity |
290,307 | 331,957 | 351,241 | 368,472 | 382,027 | |||||||||||||||
| Average goodwill and core deposit intangibles |
(14,411 | ) | (14,718 | ) | (15,028 | ) | (15,353 | ) | (15,652 | ) | ||||||||||
| Other comprehensive loss |
6,239 | 2,743 | 2,499 | 3,453 | 845 | |||||||||||||||
| Average tangible equity |
$ | 282,135 | 319,982 | 338,712 | 356,572 | 367,220 | ||||||||||||||
| Return on average assets from continuing operations |
-1.45 | % | -3.68 | % | -1.57 | % | -3.50 | % | -1.46 | % | ||||||||||
| Return on average tangible assets from continuing operations - Non-GAAP |
-1.46 | % | -3.69 | % | -1.57 | % | -3.51 | % | -1.47 | % | ||||||||||
| Return on average equity from continuing operations |
-22.56 | % | -49.70 | % | -20.12 | % | -43.28 | % | -17.93 | % | ||||||||||
| Return on average tangible equity from continuing operations - Non-GAAP |
-23.21 | % | -51.56 | % | -20.87 | % | -44.73 | % | -18.66 | % | ||||||||||
Reconciliation of equity to total tangible capital; Total assets to total tangible assets; The calculation of tangible capital to tangible assets
| As of | ||||||||||||||||||||
| ($ in thousands) | 3/31/2011 | 12/31/2010 | 9/30/2010 | 6/30/2010 | 3/31/2009 | |||||||||||||||
| Equity |
$ | 270,068 | 287,106 | 331,617 | 350,435 | 368,182 | ||||||||||||||
| Goodwill and core deposit intangibles |
(14,260 | ) | (14,569 | ) | (14,877 | ) | (15,186 | ) | (15,494 | ) | ||||||||||
| Total tangible capital |
255,808 | 272,537 | 316,740 | 335,249 | 352,688 | |||||||||||||||
| Total assets |
4,424,566 | 4,469,168 | 4,485,476 | 4,611,282 | 4,688,001 | |||||||||||||||
| Goodwill and core deposit intangibles |
(14,260 | ) | (14,569 | ) | (14,877 | ) | (15,186 | ) | (15,494 | ) | ||||||||||
| Total tangible assets |
$ | 4,410,306 | $ | 4,454,599 | $ | 4,470,599 | $ | 4,596,096 | $ | 4,672,507 | ||||||||||
| Non-GAAP tangible capital to tangible assets |
5.80 | % | 6.12 | % | 7.08 | % | 7.29 | % | 7.55 | % | ||||||||||
Reconciliation of total deposits to core deposits
| As of | ||||||||||||||||||||
| (in thousands) | 3/31/2011 | 12/31/2010 | 9/30/2010 | 6/30/2010 | 3/31/2009 | |||||||||||||||
| Total deposits |
$ | 4,006,332 | 3,893,014 | 3,837,641 | 3,988,258 | 4,047,440 | ||||||||||||||
| Non-core deposits held for sale |
(75,813 | ) | (75,010 | ) | (78,088 | ) | — | — | ||||||||||||
| Money market |
(366,968 | ) | (354,282 | ) | (386,091 | ) | (397,313 | ) | (361,877 | ) | ||||||||||
| Certificates of deposit |
(609,538 | ) | (616,454 | ) | (601,956 | ) | (749,948 | ) | (840,017 | ) | ||||||||||
| Core deposits |
2,954,013 | 2,847,268 | 2,771,506 | 2,840,997 | 2,845,546 | |||||||||||||||
14
Parent Company Business Segment
Condensed Statements of Operations (unaudited)
| For the Three Months Ended | ||||||||||||||||||||
| (in thousands) | 3/31/2011 | 12/31/2010 | 9/30/2010 | 6/30/2010 | 3/31/2010 | |||||||||||||||
| Net interest expense |
$ | (3,695 | ) | (3,716 | ) | (3,792 | ) | (3,579 | ) | (3,485 | ) | |||||||||
| Provsion (recovery) for loan losses |
(20 | ) | 498 | 1,398 | 4,919 | (1,279 | ) | |||||||||||||
| Net interest income after provision for loan losses |
(3,675 | ) | (4,214 | ) | (5,190 | ) | (8,498 | ) | (2,206 | ) | ||||||||||
| Non-interest income |
||||||||||||||||||||
| Income from unconsolidated subsidiaries |
381 | 335 | 293 | 237 | 189 | |||||||||||||||
| Securities activities, net |
— | — | (9 | ) | 3 | 6 | ||||||||||||||
| Other |
209 | 431 | 292 | 271 | 263 | |||||||||||||||
| Non-interest income |
590 | 766 | 576 | 511 | 458 | |||||||||||||||
| Non-interest expense |
||||||||||||||||||||
| Employee compensation and benefits |
527 | (160 | ) | 1,074 | 901 | 1,004 | ||||||||||||||
| Advertising and business promotion |
26 | 56 | 109 | 118 | 10 | |||||||||||||||
| Professional fees |
378 | 881 | 1,267 | 604 | 322 | |||||||||||||||
| (Gain)/loss on sale of real estate |
(175 | ) | — | — | 610 | — | ||||||||||||||
| Impairment of real estate owned |
2,347 | — | 66 | 700 | — | |||||||||||||||
| Other |
329 | 328 | 385 | 460 | 308 | |||||||||||||||
| Non-interest expense |
3,432 | 1,105 | 2,901 | 3,393 | 1,644 | |||||||||||||||
| Loss from parent company activities before income taxes |
(6,517 | ) | (4,553 | ) | (7,515 | ) | (11,380 | ) | (3,392 | ) | ||||||||||
| Provision (benefit) for income taxes |
— | — | — | — | — | |||||||||||||||
| Net loss from parent company business segment |
$ | (6,517 | ) | (4,553 | ) | (7,515 | ) | (11,380 | ) | (3,392 | ) | |||||||||
Parent Company Business Segment
Condensed Statements of Financial Condition - Unaudited
| As of | ||||||||||||||||||||
| (in thousands) | 3/31/2011 | 12/31/2010 | 9/30/2010 | 6/30/2010 | 3/31/2010 | |||||||||||||||
| ASSETS |
||||||||||||||||||||
| Cash |
$ | 13,112 | 12,226 | 12,240 | 8,395 | 5,135 | ||||||||||||||
| Securities |
1,508 | 1,507 | 1,508 | 1,508 | 1,506 | |||||||||||||||
| Investment in subsidiaries |
291,616 | 313,319 | 359,368 | 379,776 | 413,759 | |||||||||||||||
| Investment in unconsolidated subsidiaries |
10,742 | 10,361 | 10,027 | 9,733 | 9,496 | |||||||||||||||
| Other assets |
882 | 945 | 1,635 | 2,430 | 2,329 | |||||||||||||||
| Total assets |
$ | 317,860 | 338,358 | 384,778 | 401,842 | 432,225 | ||||||||||||||
| LIABILITIES AND STOCKHOLDERS’ EQUITY |
||||||||||||||||||||
| Subordinated debentures and notes payable |
$ | 325,974 | 322,385 | 318,802 | 315,160 | 311,707 | ||||||||||||||
| Other liabilities |
1,123 | 1,687 | 2,314 | 9,632 | 1,288 | |||||||||||||||
| Total liabilities |
327,097 | 324,072 | 321,116 | 324,792 | 312,995 | |||||||||||||||
| Stockholders’ equity |
(9,237 | ) | 14,286 | 63,662 | 77,050 | 119,230 | ||||||||||||||
| Total liabilities and stockholders’ equity |
$ | 317,860 | 338,358 | 384,778 | 401,842 | 432,225 | ||||||||||||||
Parent Company Business Segment
Allowance for Loan Loss and Credit Quality
Parent Company and Work-out Subsidiary
| (in thousands) | For the Three Months Ended | |||||||||||||||||||
| 3/31/2011 | 12/31/2010 | 9/30/2010 | 6/30/2010 | 3/31/2010 | ||||||||||||||||
| Allowance for Loan Losses |
||||||||||||||||||||
| Beginning balance |
$ | 830 | 4,187 | 7,227 | 8,049 | 13,630 | ||||||||||||||
| Net charge-offs |
4 | (3,741 | ) | (4,438 | ) | (5,741 | ) | (4,302 | ) | |||||||||||
| Transfer to held for sale |
— | (114 | ) | — | — | — | ||||||||||||||
| Provision (recovery) for loan losses |
(20 | ) | 498 | 1,398 | 4,919 | (1,279 | ) | |||||||||||||
| Ending balance |
$ | 814 | 830 | 4,187 | 7,227 | 8,049 | ||||||||||||||
| As of | ||||||||||||||||||||
| 3/31/2011 | 12/31/2010 | 9/30/2010 | 6/30/2010 | 3/31/2010 | ||||||||||||||||
| Credit Quality |
||||||||||||||||||||
| Total Loans - gross |
$ | 14,058 | 17,300 | 22,793 | 27,319 | 38,363 | ||||||||||||||
| Nonaccrual loans |
$ | 11,360 | 14,508 | 19,916 | 24,358 | 35,326 | ||||||||||||||
| Specific reserves |
(814 | ) | (830 | ) | (4,187 | ) | (7,227 | ) | (8,049 | ) | ||||||||||
| Nonaccrual loans, net |
$ | 10,546 | 13,678 | 15,729 | 17,131 | 27,277 | ||||||||||||||
| Real estate owned |
8,835 | 10,160 | 9,766 | 9,832 | 10,532 | |||||||||||||||
| Total nonperforming assets |
$ | 19,381 | 23,838 | 25,495 | 26,963 | 37,809 | ||||||||||||||
15
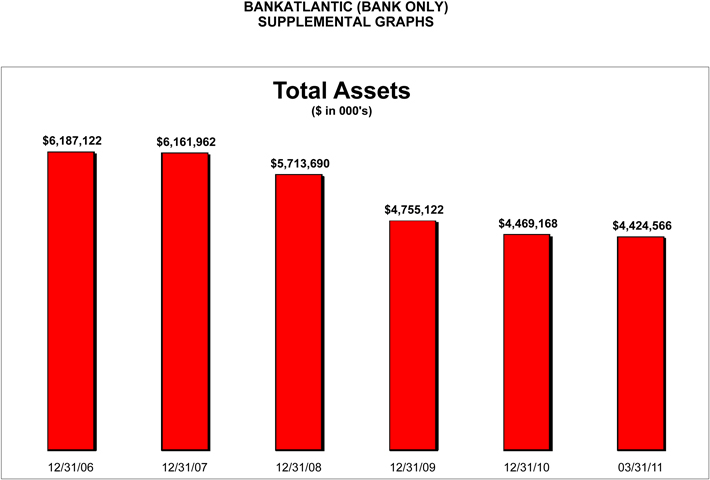
1
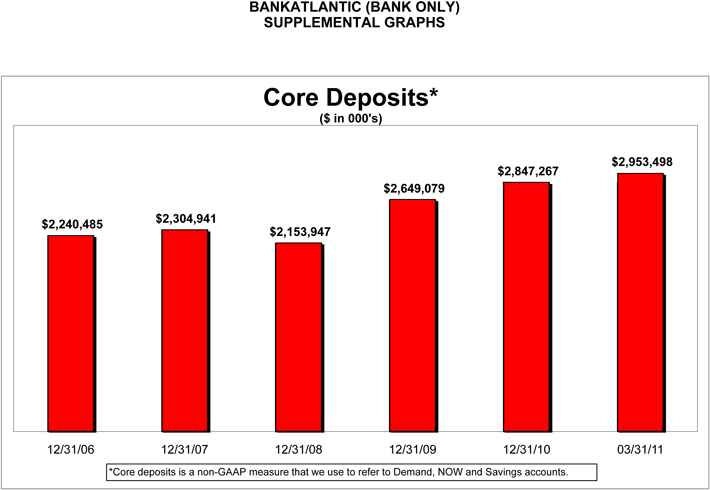
2
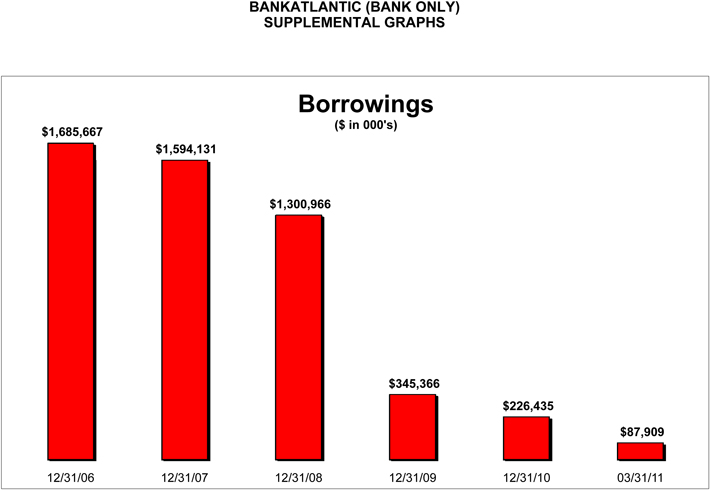
3
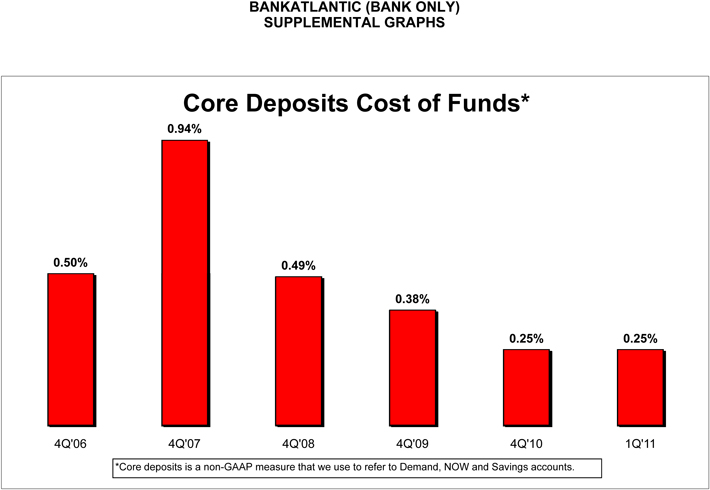
4
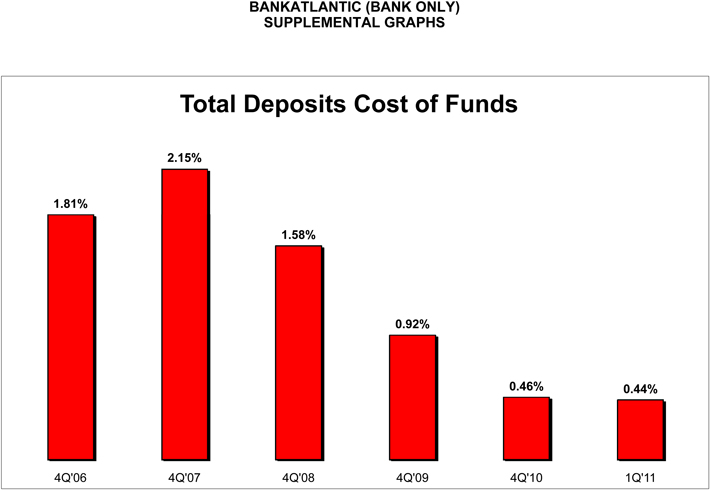
5
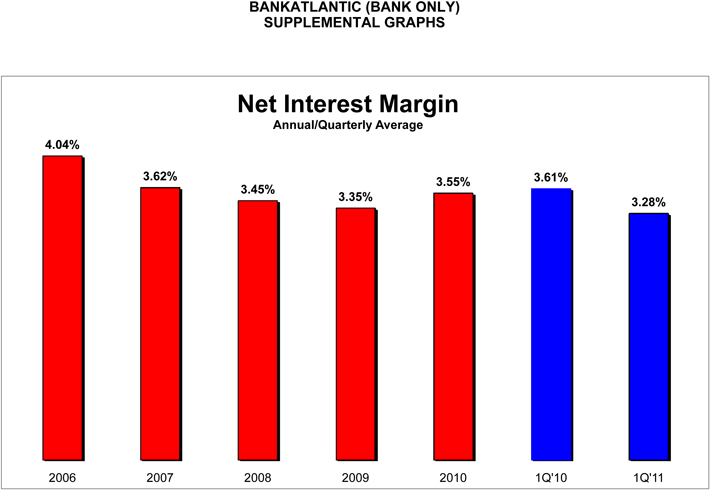
6
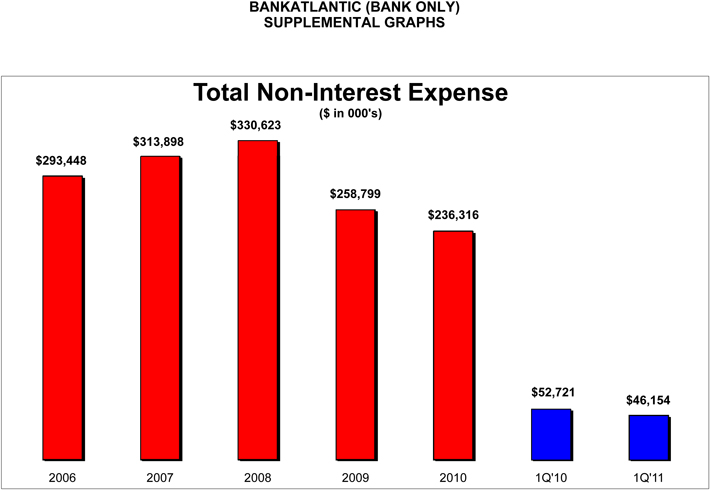
7
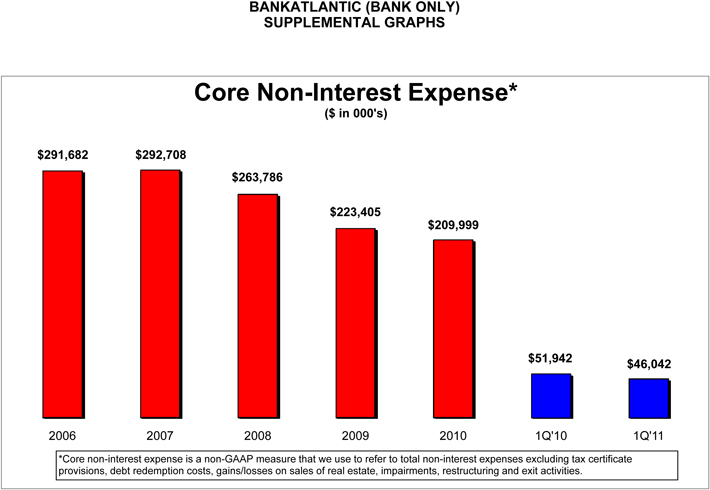
8
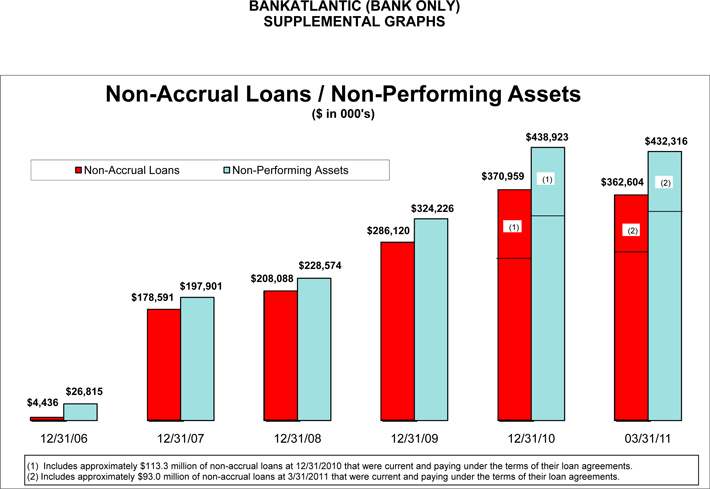
9
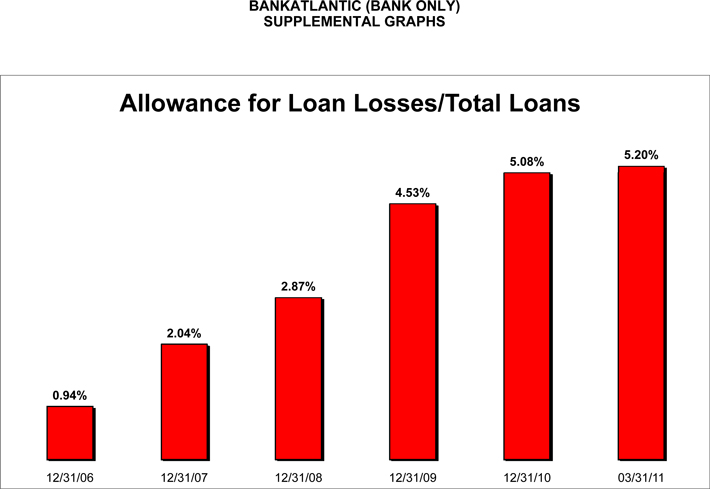
10
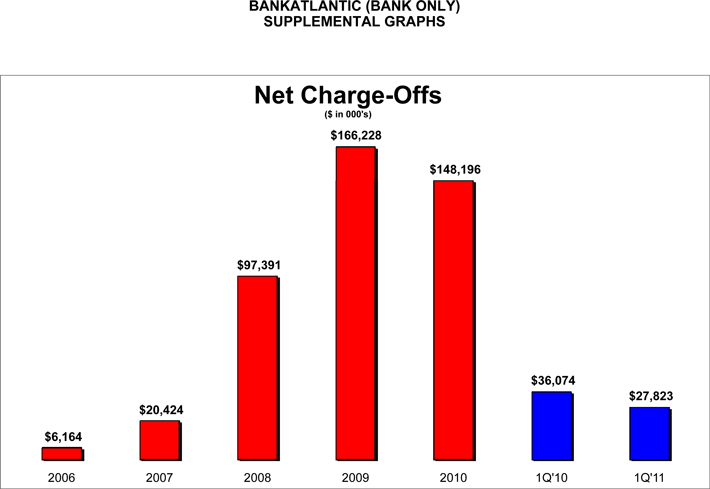
11
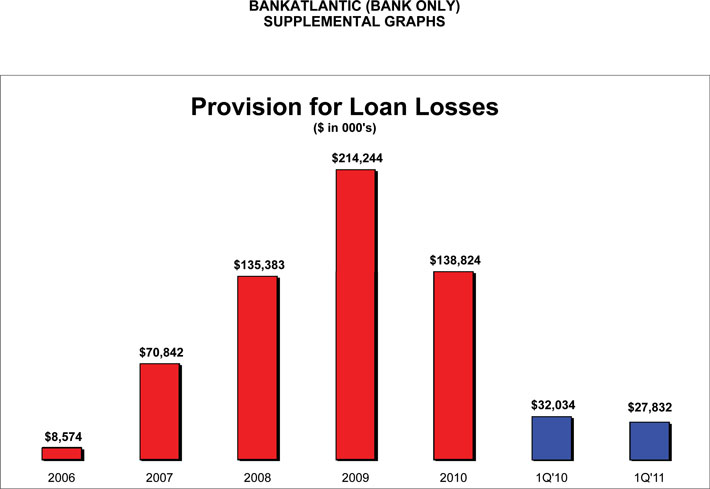
12
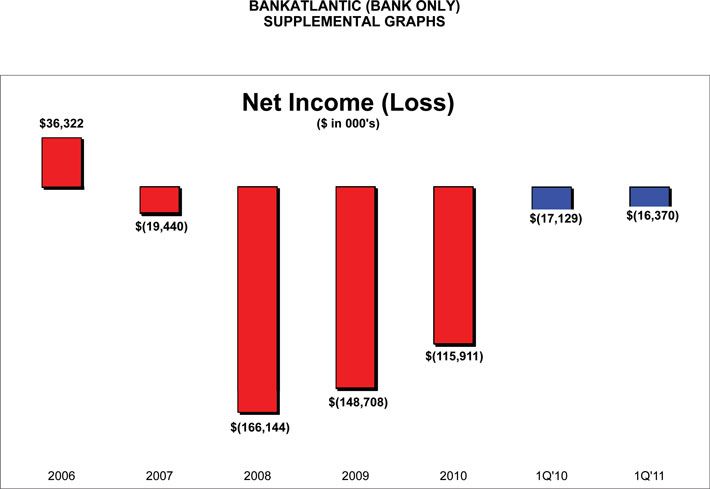
13
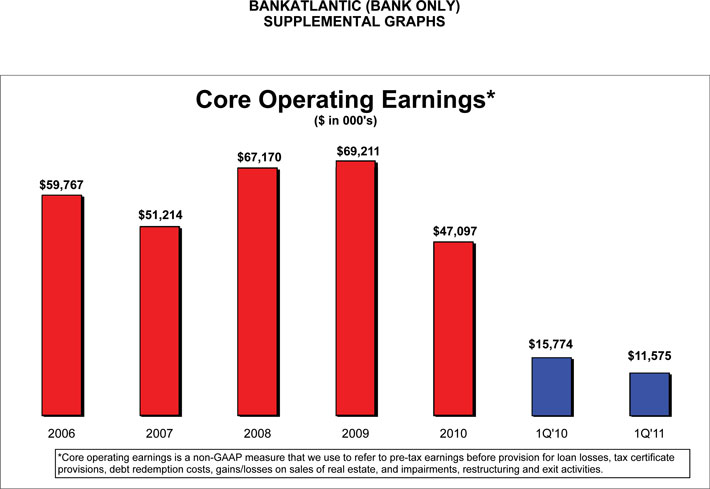
14
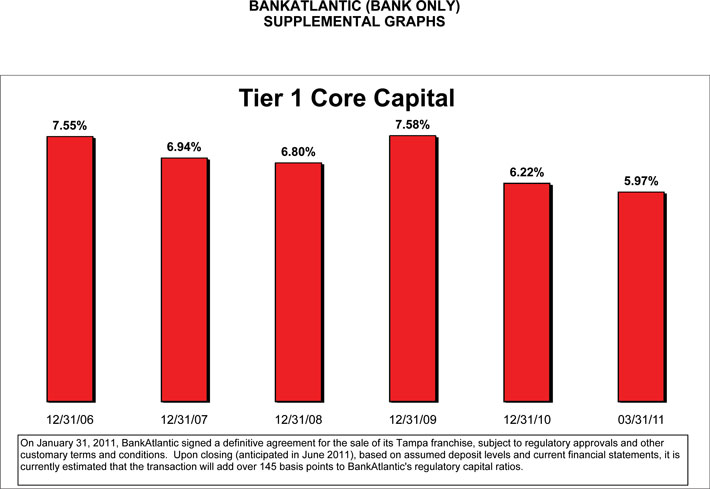
15
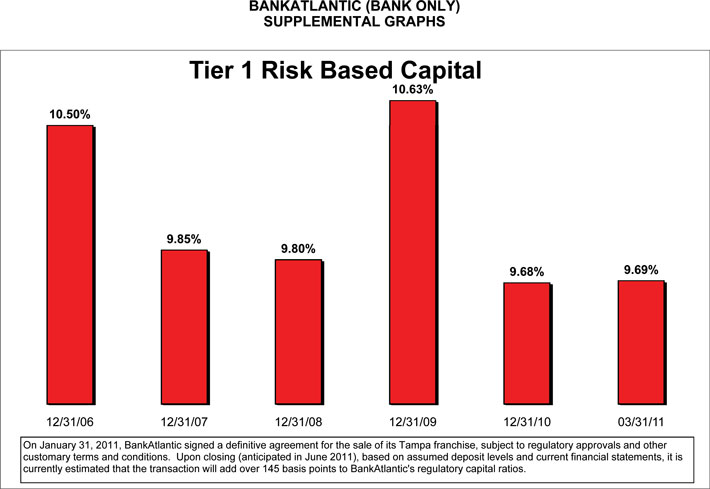
16
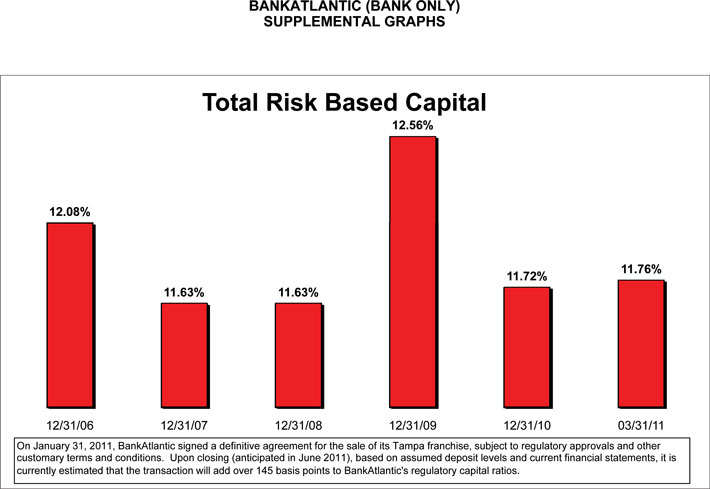
17