Attached files
| file | filename |
|---|---|
| 8-K - REPUBLIC BANCORP, INC. 8-K - REPUBLIC BANCORP INC /KY/ | a6690689.htm |
EXHIBIT 99.1

REPUBLIC BANCORP ANNUAL MEETING OF SHAREHOLDERS Thursday, April 21, 2011
2 Safe Harbor During the course of this presentation, we will be providing you with a discussion of some of the factors we currently anticipate may influence the future results of Republic Bancorp, Inc. (“Republic” or the “Company”), as well as certain financial projections. We want to emphasize that these forward-looking statements involve judgment, and that individual judgments may vary. Moreover, these statements are based on limited information available to us now, which is subject to change. Actual results may differ substantially from what we say today and no one should assume later that the comments we provide today are still valid. They speak only as of today. Specific risk factors that could change causing our projections not to be achieved are discussed in the “Risk Factors” section of our Form 10-K filed with the Securities and Exchange Commission (“SEC”) on March 3, 2011, and other reports filed with the SEC from time to time.

3 Steve Trager President and Chief Executive Officer

4 HighlightsYear ended December 31, 2010
5 2010 Highlights Total net income of $64.8 million, a 54% increase over 2009Record year at Tax Refund Solutions (“TRS”)Return On Average Assets (“ROA”) of 1.85%Return On Average Equity (“ROE”) of 17.92% Core banking low cost deposit balances increased $105 millionTraditional Bank net interest margin of 3.57% Capital ratios continued to exceed “well capitalized” with a total risk based capital ratio of 21.18% at Republic Bank & Trust CompanyImproved credit quality 2nd quarter - Increased cash dividends 8% - 11th consecutive year of increased dividends.
6 2010 Highlights Enhanced technologyNew core operating system Mobile BankingBranch Capture Republic Bank Foundation established with a $5 million initial contribution National Recognition - Four times during the year, Republic was recognized by a national publication as one of the best performing banks in the United States February 2010 - Sandler O'Neil & Partners released its annual rankings of the top 150 financial institutions in Bank Director Magazine and ranked Republic as #5 based on total assets, profitability, capital adequacy and asset quality. August 2010 - Republic was ranked as #7 in the American Banker’s ranking of the nation’s most efficient bank holding companies. September 2010 - With a 5-year dividend growth rate of nearly 14% and a 12-month trailing dividend yield of 2.9%, Republic was recognized as a top dividend paying Company by the popular financial website, The Motley Fool. April 2011 - the American Bankers Association's Banking Journal ranked Republic as #4 based on 2010 Return on Average Total Equity (ROAE).
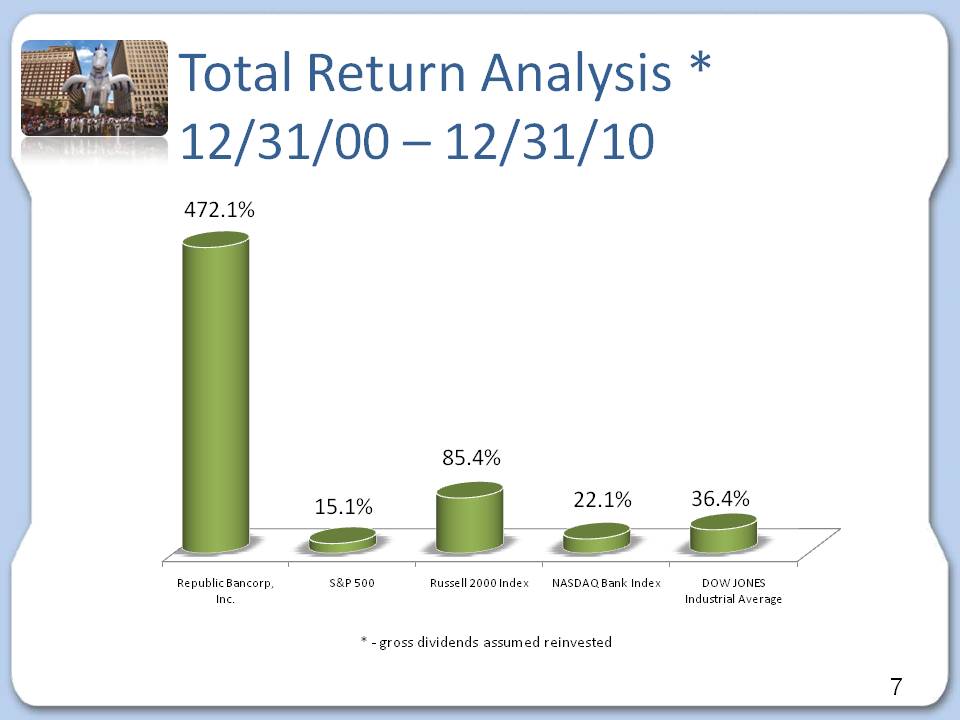
7 Total Return Analysis * 12/31/00 – 12/31/10 472.1% 15.1% 85.4% 22.1% 36.4% Republic Bancorp, Inc. S&P 500 Russell 2000 Index NASDAQ Bank Index DOW JONES Industrial Average * - gross dividends assumed reinvested
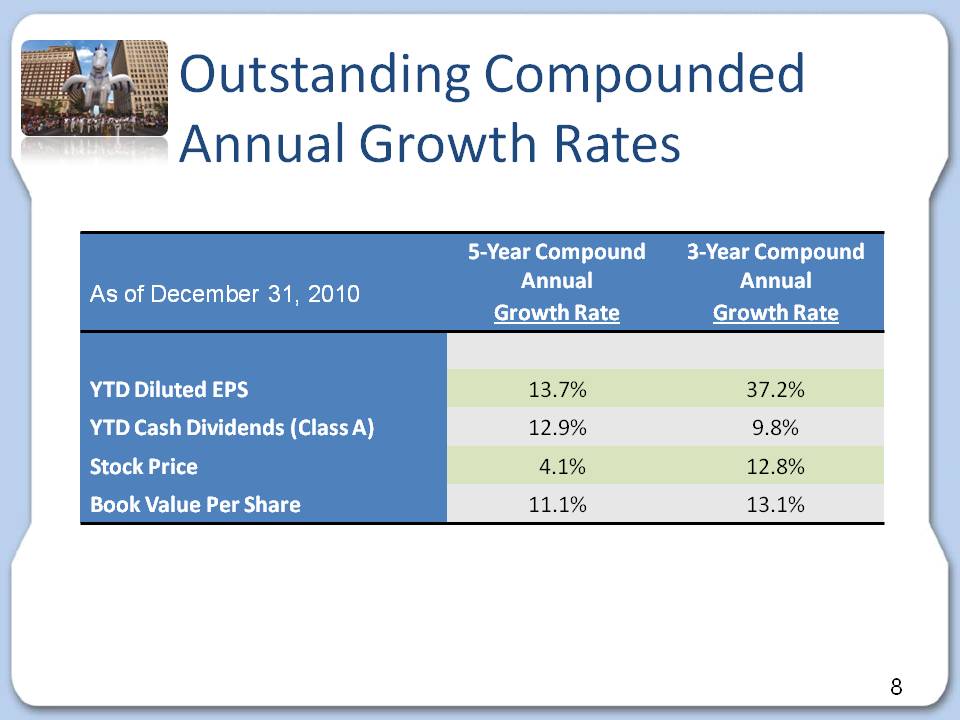
8 Outstanding Compounded Annual Growth Rates As of December 31, 2010 5-Year Compound Annual Growth Rate 3-Year Compound Annual Growth Rate YTD Diluted EPS 13.7% 37.2% YTD Cash Dividends (Class A) 12.9% 9.8% Stock Price 4.1% 12.8% Book Value Per Share 11.1% 13.1%
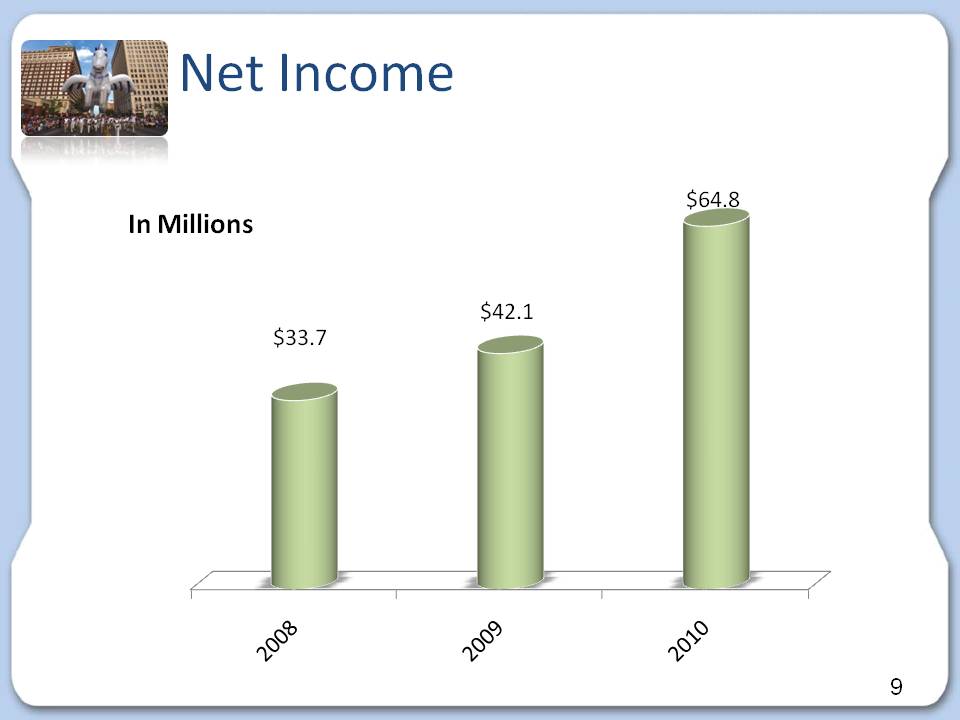
9 Net Income In Millions $33.7 $42.1 $64.8 2008 2009 2010
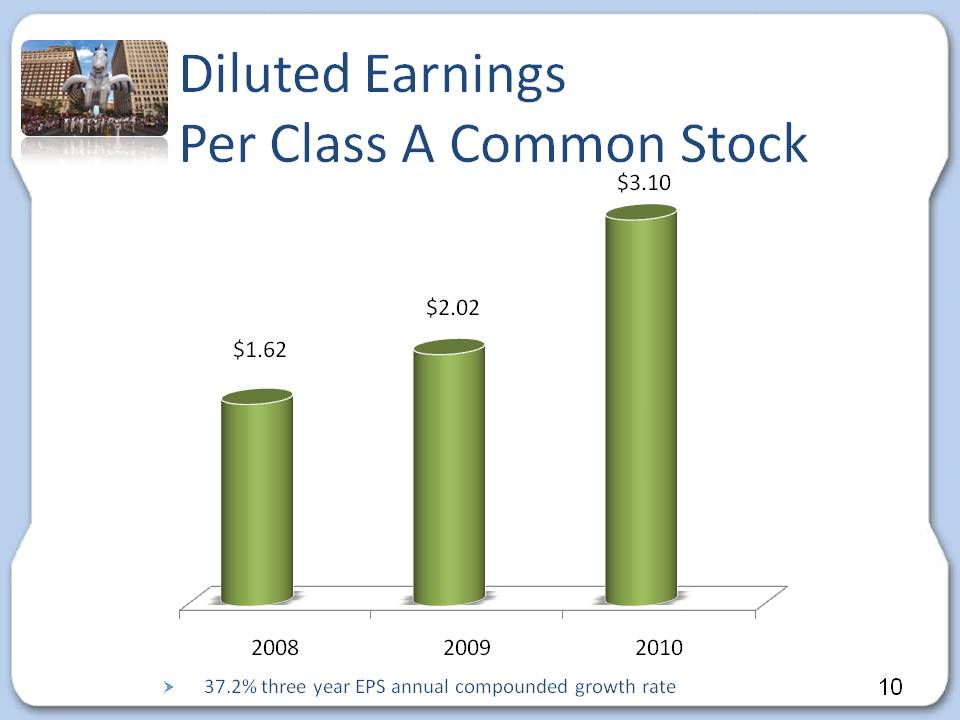
10 Diluted Earnings Per Class A Common Stock $1.62 $2.02 $3.10 2008 2009 2010 37.2% three year EPS annual compounded growth rate

11 Balance Sheet
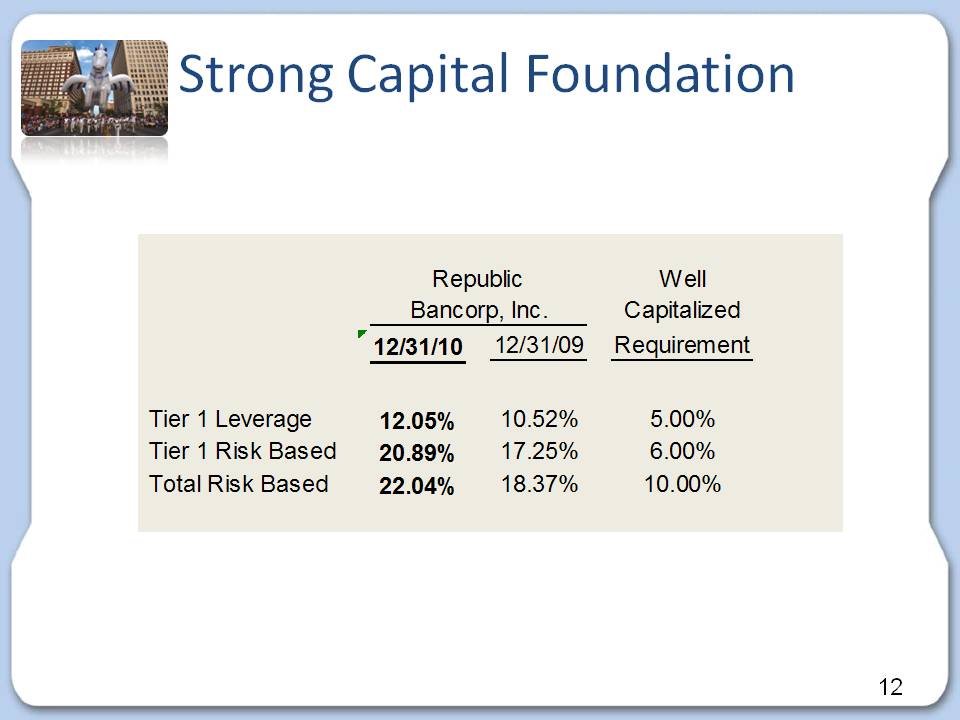
12 Strong Capital FoundationRepublic Bancorp, Inc. Well Capitalized Requirement 12/31/10 12/31/09 Tier 1 Leverage 12.05% 10.52% 5.00% Tier 1 Risk Based 20.89% 17.25% 6.00% Total Risk Based 22.04% 18.37% 10.00%
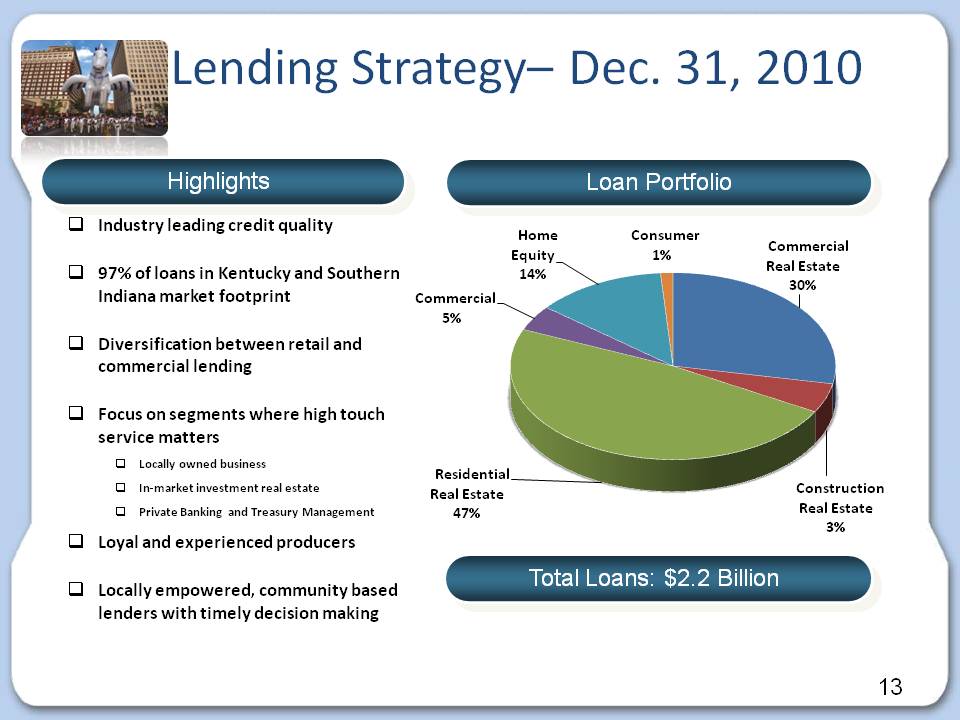
13 Lending Strategy– Dec. 31, 2010 Highlights Loan Portfolio Total Loans: $2.2 Billion Industry leading credit quality 97% of loans in Kentucky and Southern Indiana market footprint Diversification between retail and commercial lendingFocus on segments where high touch service matters Locally owned business In-market investment real estatePrivate Banking and Treasury Management Loyal and experienced producers Locally empowered, community based lenders with timely decision making Residential Real Estate 47% Commercial Real Estate 30% Home Equity 14% Commercial 5% Construction Real Estate 3% Consumer 1%
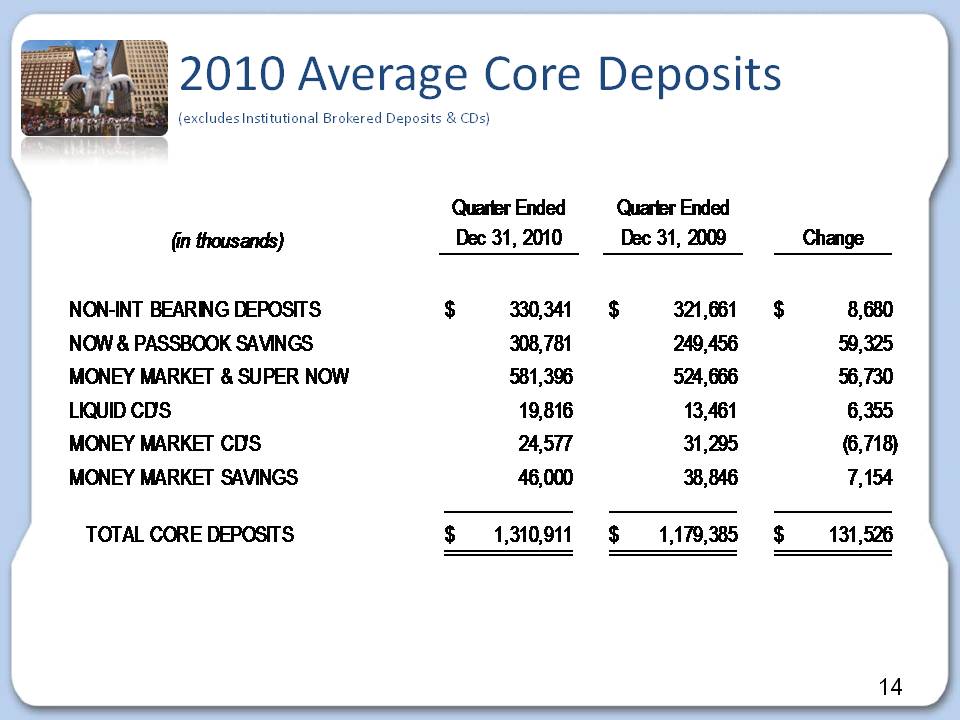
14 2010 Average Core Deposits (excludes Institutional Brokered Deposits & CDs) Quarter Ended Quarter Ended Dec 31, 2010 Dec 31, 2009 Change (in thousands) NON-INT BEARING DEPOSITS $ 330,341 $ 321,661 $ 8,680 NOW & PASSBOOK SAVINGS 308,781 249,456 59,325 MONEY MARKET & SUPER NOW 581,396 524,666 56,730 LIQUID CD'S 19,816 13,461 6,355 MONEY MARKET CD'S 24,577 31,295 (6,718) MONEY MARKET SAVINGS 46,000 38,846 7,154 TOTAL CORE DEPOSITS $ 1,310,911 $ 1,179,385 $ 131,526
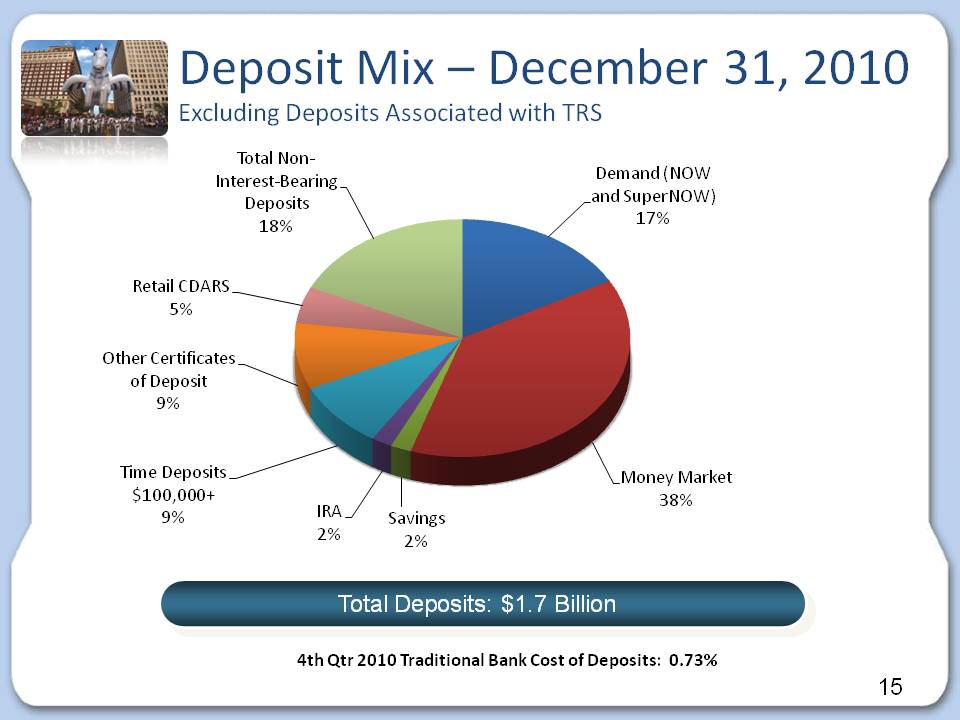
15 Deposit Mix – December 31, 2010 Excluding Deposits Associated with TRS Money Market 38% Total Non-Interest-Bearing Deposits 18% Demand (NOW and SuperNOW) 17% Time Deposits $100,000+ 9% Other Certificates of Deposit 9% Retail CDARS 5% IRA 2% Savings 2% Total Deposits: $1.7 Billion 4th Qtr 2010 Traditional Bank Cost of Deposits: 0.73%
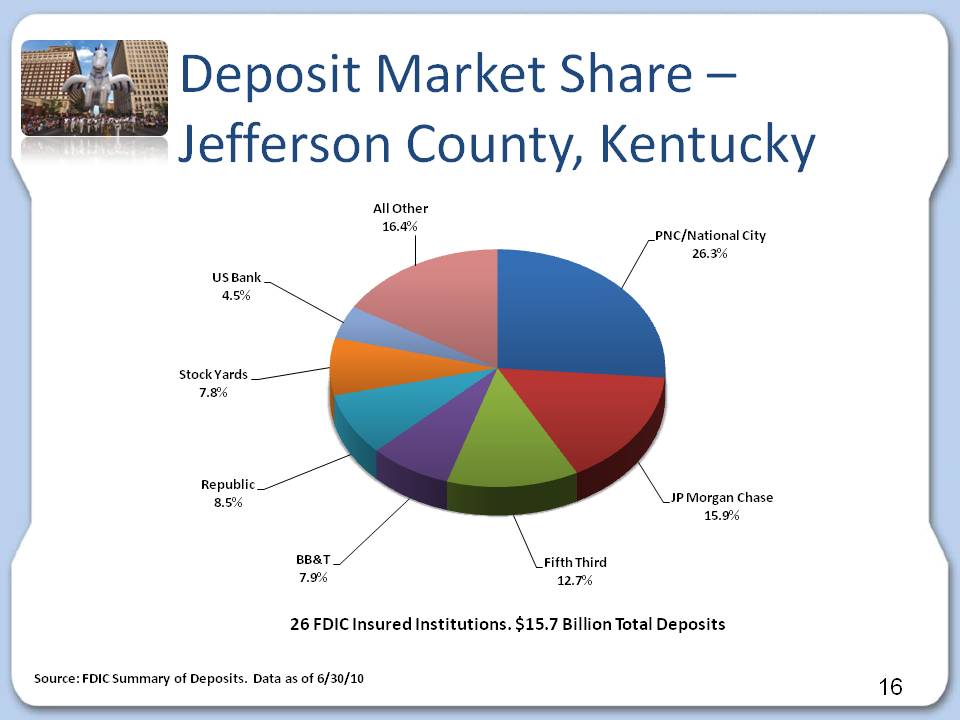
16 Deposit Market Share – Jefferson County, Kentucky PNC/National City 26.3% All Other 16.4% JP Morgan Chase 15.9% Fifth Third 12.7% Republic 8.5% BB&T 7.9% Stock Yards 7.8% US Bank 4.5% 26 FDIC Insured Institutions. $15.7 Billion Total Deposits Source: FDIC Summary of Deposits. Data as of 6/30/10

17 Industry Strong Credit Quality
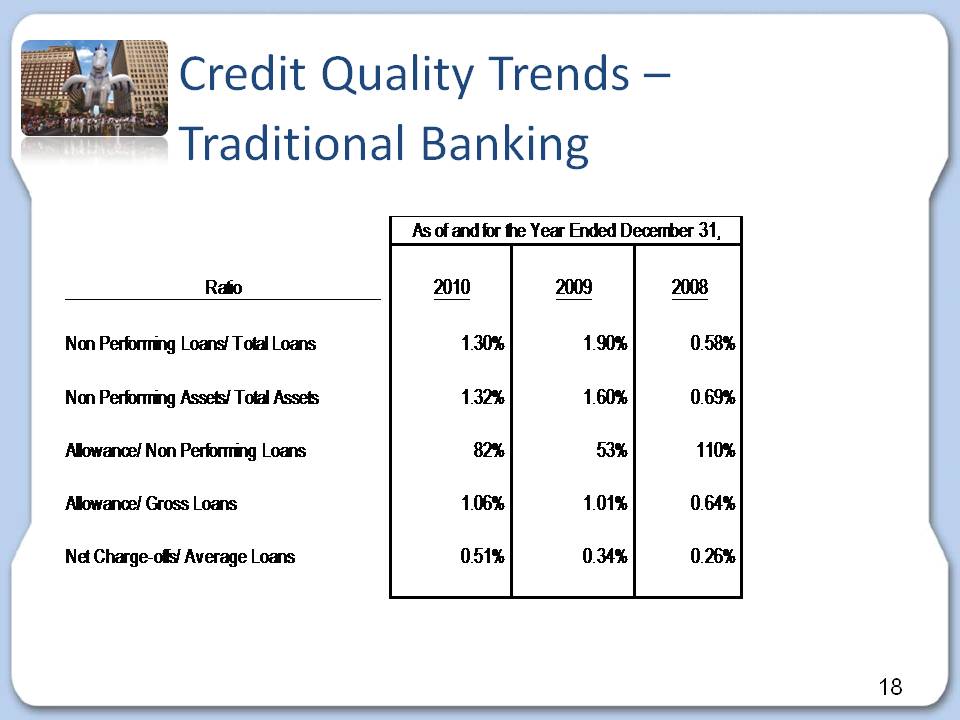
18 Credit Quality Trends – Traditional Banking As of and for the Year Ended December 31, Ratio 2010 2009 2008 Non Performing Loans/ Total Loans 1.30% 1.90% 0.58% Non Performing Assets/ Total Assets 1.32% 1.60% 0.69% Allowance/ Non Performing Loans 82% 53% 110% Allowance/ Gross Loans 1.06% 1.01% 0.64% Net Charge-offs/ Average Loans 0.51% 0.34% 0.26%
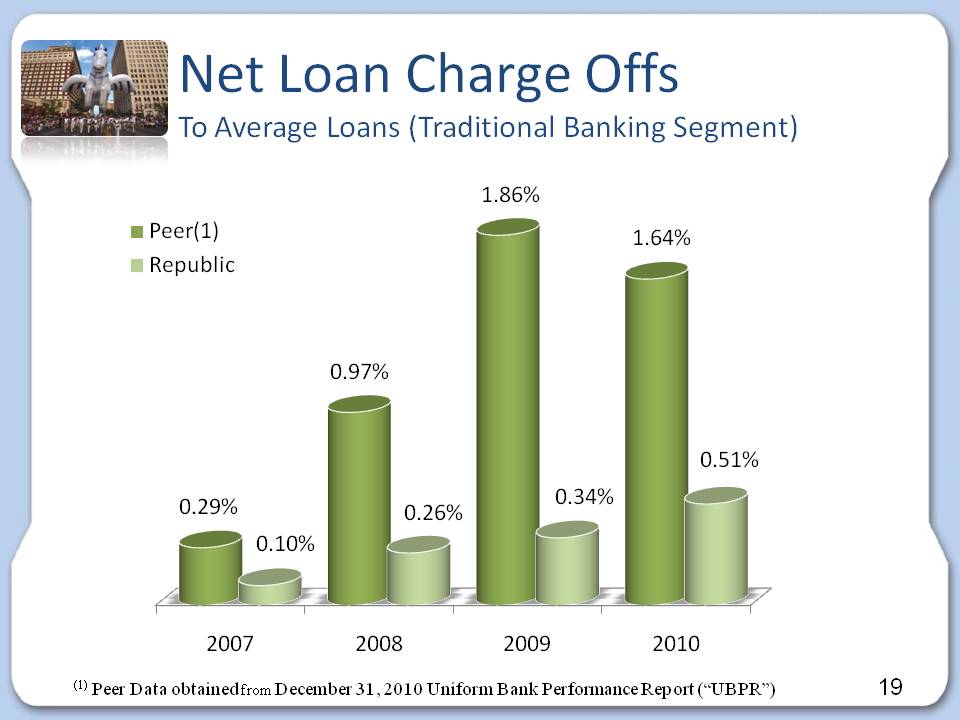
19 Net Loan Charge Offs To Average Loans (Traditional Banking Segment) Peer(1) Republic 2007 2008 2009 2010 0.29% 0.10% 0.97% 0.26% 1.86% 0.34% 1.64% 0.51% (1) Peer Data obtained from December 31, 2010 Uniform Bank Performance Report (“UBPR”)
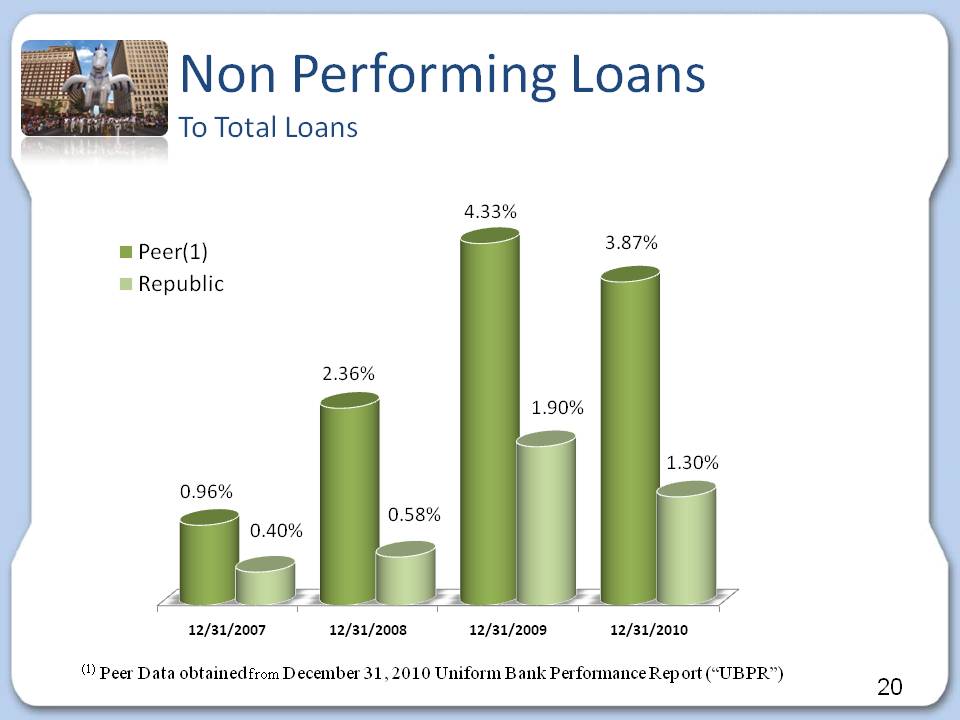
20 Non Performing Loans To Total Loans 12/31/2007 12/31/2008 12/31/2009 12/31/2010 0.96% 0.40% 2.36% 0.58% 4.33% 1.90% 3.87% 1.30% (1) Peer Data obtained from December 31, 2010 Uniform Bank Performance Report (“UBPR”)
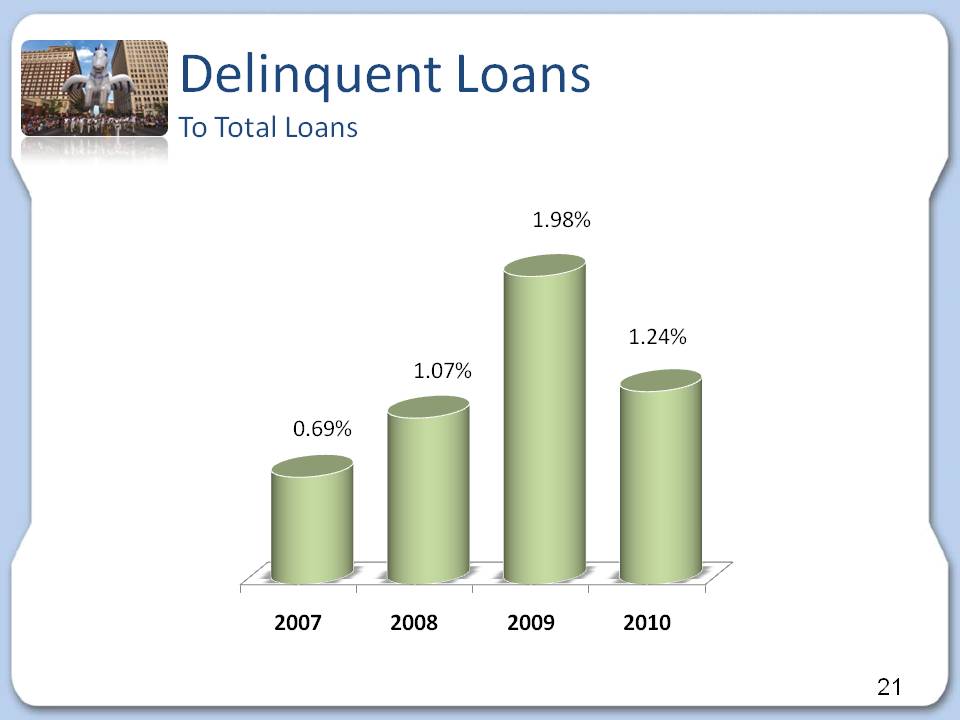
21 Delinquent Loans To Total Loans 2007 2008 2009 2010 0.69% 1.07% 1.98% 1.24%
22 Results of Operations
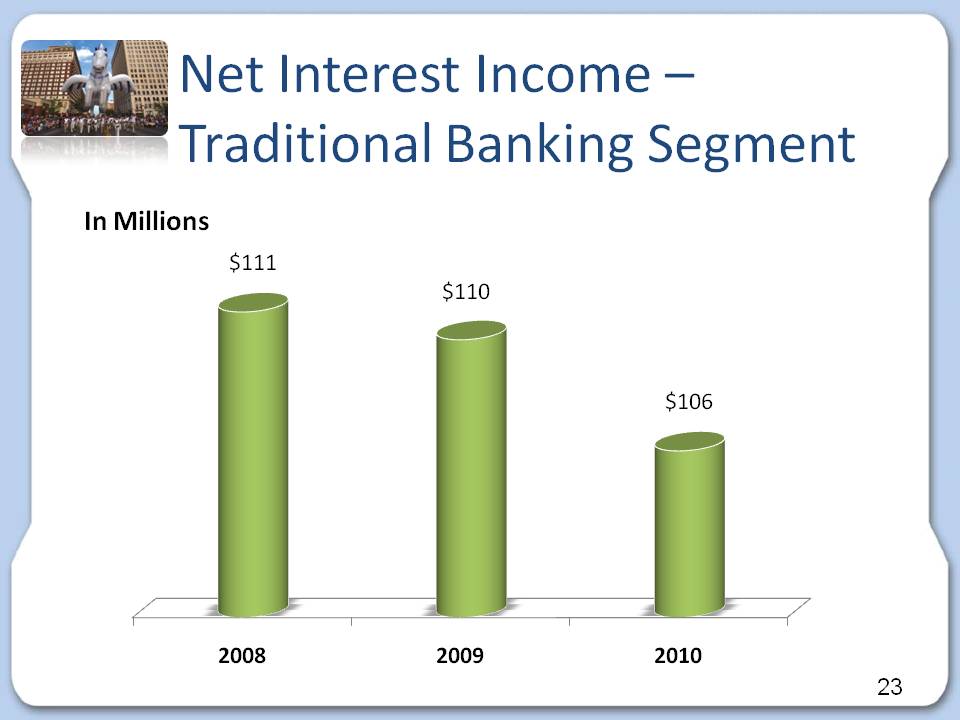
23 Net Interest Income – Traditional Banking Segment In Millions $111 $110 $106 2008 2009 2010
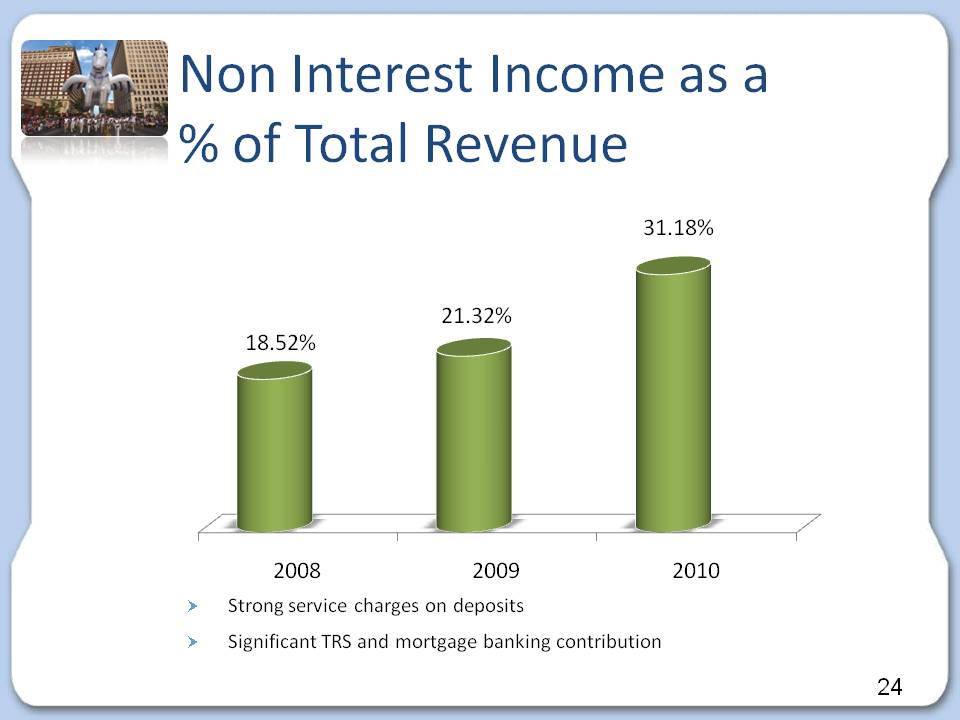
24 Non Interest Income as a % of Total Revenue 2009 2009 2010 18.52% 21.32% 31.18% Strong service charges on deposits Significant TRS and mortgage banking contribution

25 Highlights First Quarter 2011
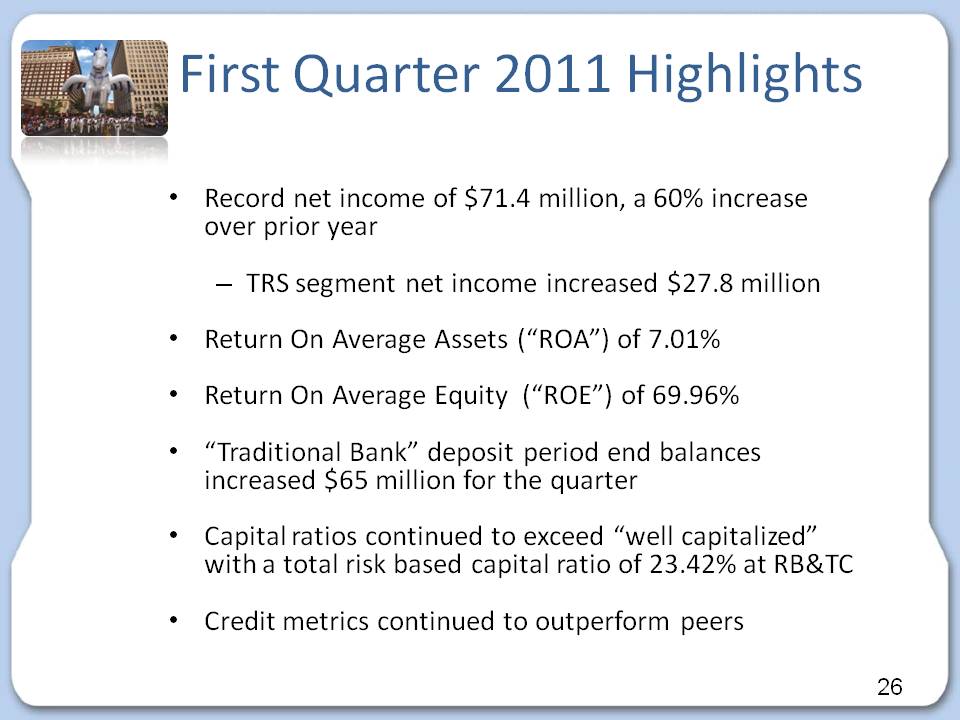
26 First Quarter 2011 Highlights Record net income of $71.4 million, a 60% increase over prior yearTRS segment net income increased $27.8 million Return On Average Assets (“ROA”) of 7.01% Return On Average Equity (“ROE”) of 69.96% “Traditional Bank” deposit period end balances increased $65 million for the quarter Capital ratios continued to exceed “well capitalized” with a total risk based capital ratio of 23.42% at RB&TC Credit metrics continued to outperform peers
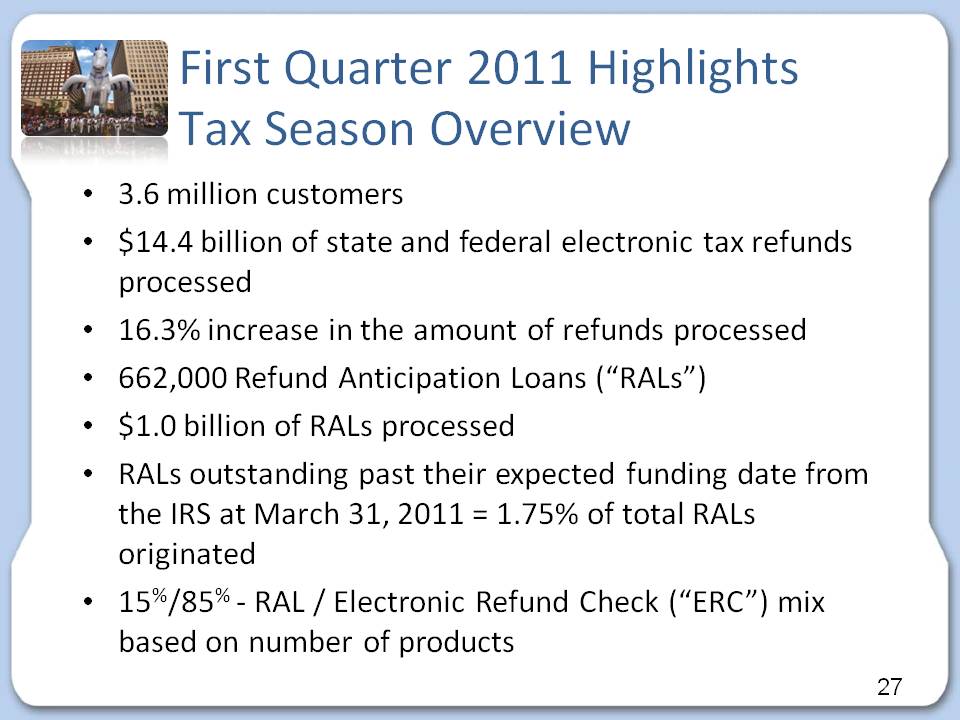
27 First Quarter 2011 HighlightsTax Season Overview 3.6 million customers $14.4 billion of state and federal electronic tax refunds processed 16.3% increase in the amount of refunds processed 662,000 Refund Anticipation Loans (“RALs”) $1.0 billion of RALs processed 31, 2010 15%/85% - RAL / Electronic Refund Check (“ERC”) mix based on number of products
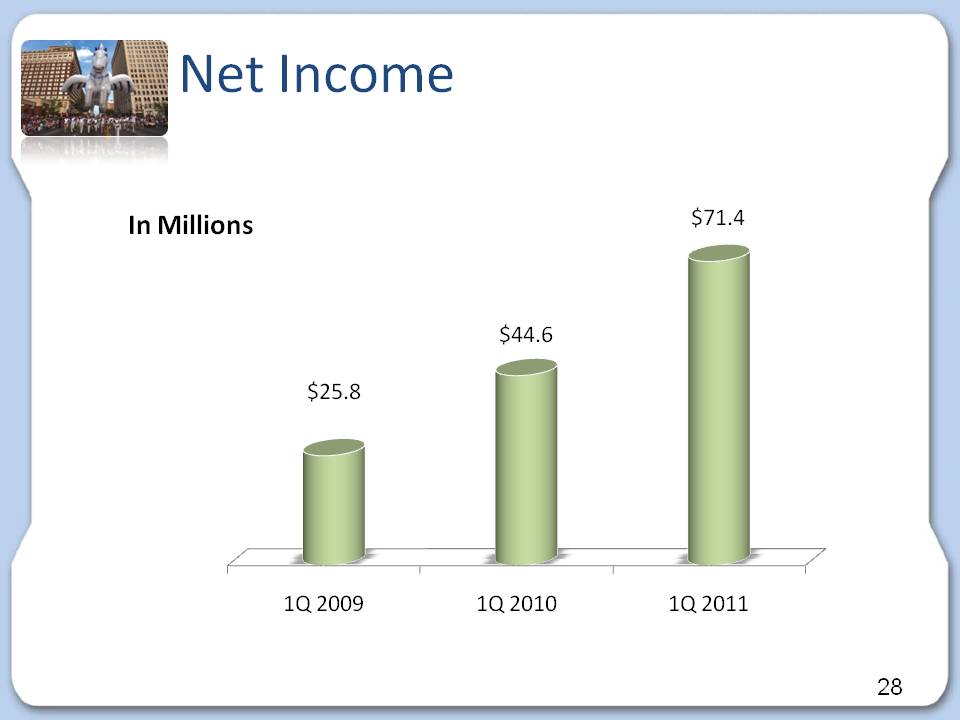
28 Net Income In Millions $25.8 $44.6 $71.4 1Q 2009 1Q 2010 1Q 2011
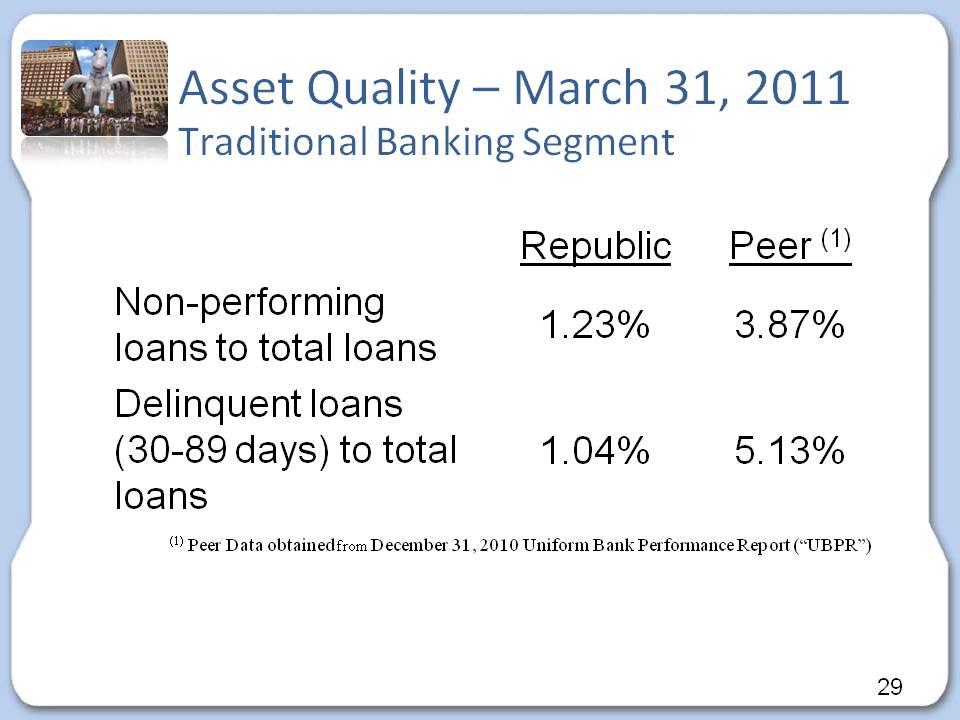
29 Asset Quality – March 31, 2011 Traditional Banking Segment Republic Peer(1) Non-performing loans to total loans 1.23% 3.87% Delinquent loans (30-89 days) to total loans 1.04% 5.13% (1) Peer Data obtained from December 31, 2010 Uniform Bank Performance Report (“UBPR”)
30 Growth Initiatives Develop new lines of business Secondary market lending Attract customers leaving troubled institutions looking for safety and soundness Add strategically located banking centers and make selective acquisitions Outperform peer financial performance Focus on core deposit growth initiatives Continue to improve on already solid loan quality metrics Remain positioned for sustainable, profitable growth
31 2011 Challenges & Opportunities Challenges New Regulation E requirements New FDIC overdraft guidanceOngoing regulatory dialogue regarding the TRS business Improving net interest margin by capitalizing on low cost deposit opportunities within Treasury Management Non-interest expense control Continue to increase the solid returns we achieved at TRSExpand product offerings to the under-served market through nontraditional delivery channels Maintain credit quality

32 THANK YOU