Attached files
| file | filename |
|---|---|
| EX-99.1 - PRESS RELEASE - BlackRock Inc. | dex991.htm |
| 8-K - FORM 8-K - BlackRock Inc. | d8k.htm |
 Q1
2011 Earnings Press Release Supplement
April 21,
2011
Exhibit 99.2 |
 1
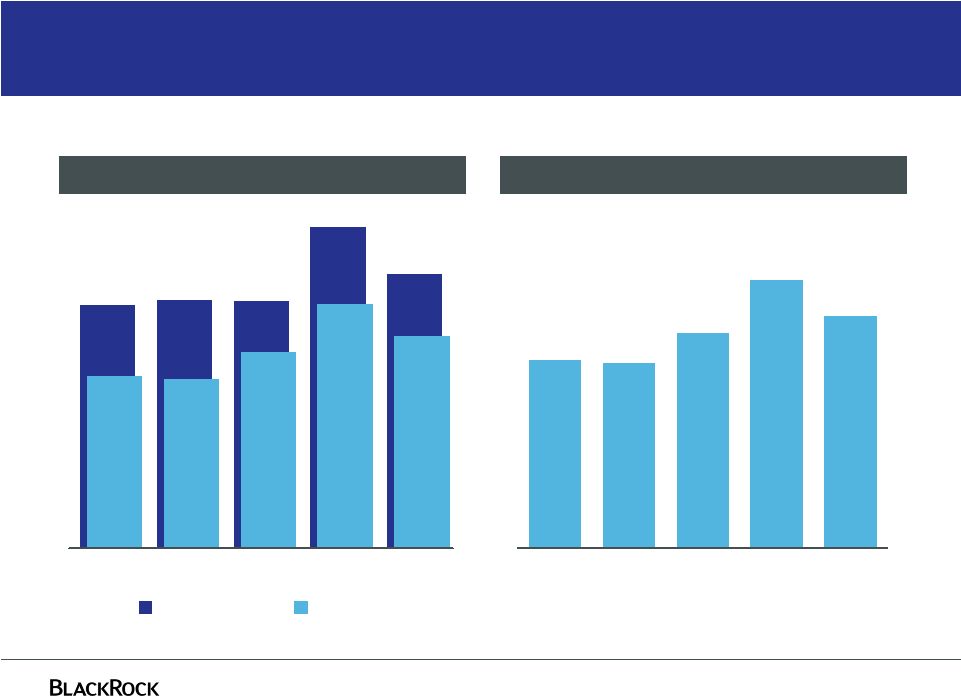
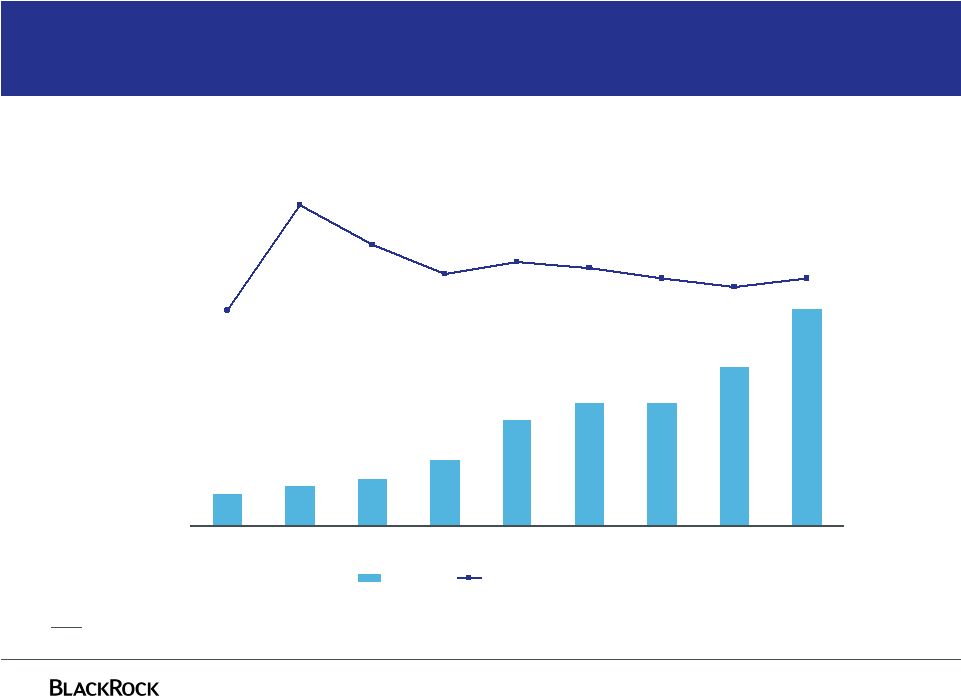
$727
$741
$737
$962
$819
Q1 2010
Q2 2010
Q3 2010
Q4 2010
Q1 2011
$582
$670
$469
$463
$537
$2.40
$2.96
$2.75
$3.42
$2.37
Q1 2010
Q2 2010
Q3 2010
Q4 2010
Q1 2011
Strong operating income includes continued growth of base fees
Operating and Net Income, as Adjusted ($ in millions)
Diluted Earnings Per Share, as Adjusted
Reconciliation between GAAP and as Adjusted is provided in the appendix
Operating Income
Net Income
Sequential operating results are affected by the timing of performance fee
recognition |
 2
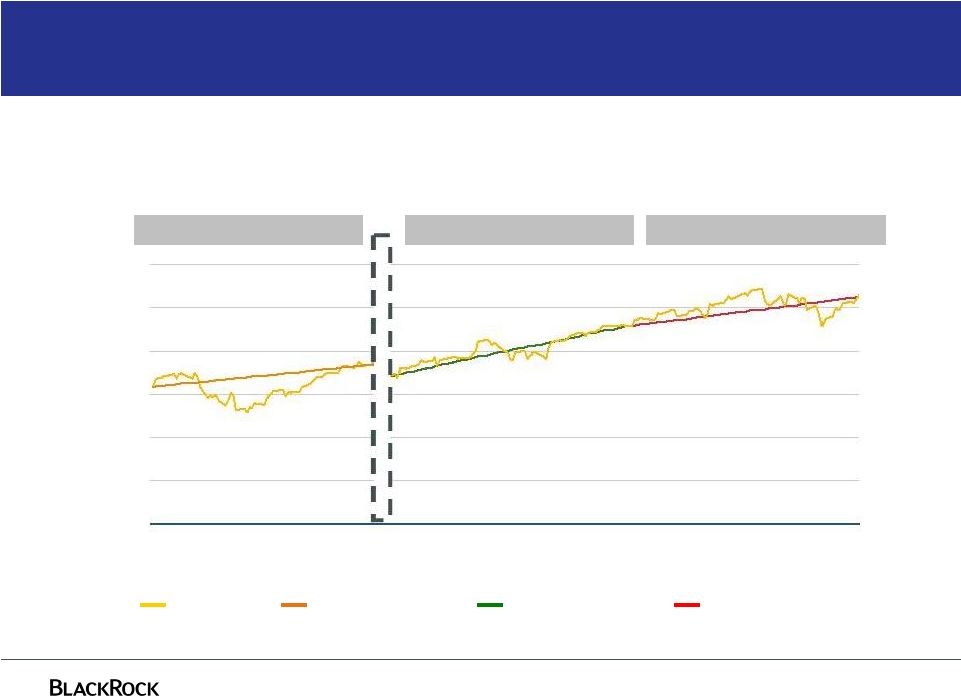
39.1%
40.7%
38.4%
37.4%
38.7%
38.2%
36.8%
38.9%
38.8%
2007
2008
2009
2009
Pro Forma
Q1 2010
Q2 2010
Q3 2010
Q4 2010
Q1 2011
Margin remains strong post BGI transaction
Operating Margins, as Adjusted
For
further
information
and
reconciliation
between
GAAP
and
as
Adjusted,
see
note
(a)
in
the
current
earnings
release
as
well
as
previously
filed
Form
10-K,
10-Q
and
8-Ks
Full Year 2010 = 39.3%
Q4 margin includes the seasonal effect of performance fees
|
 3
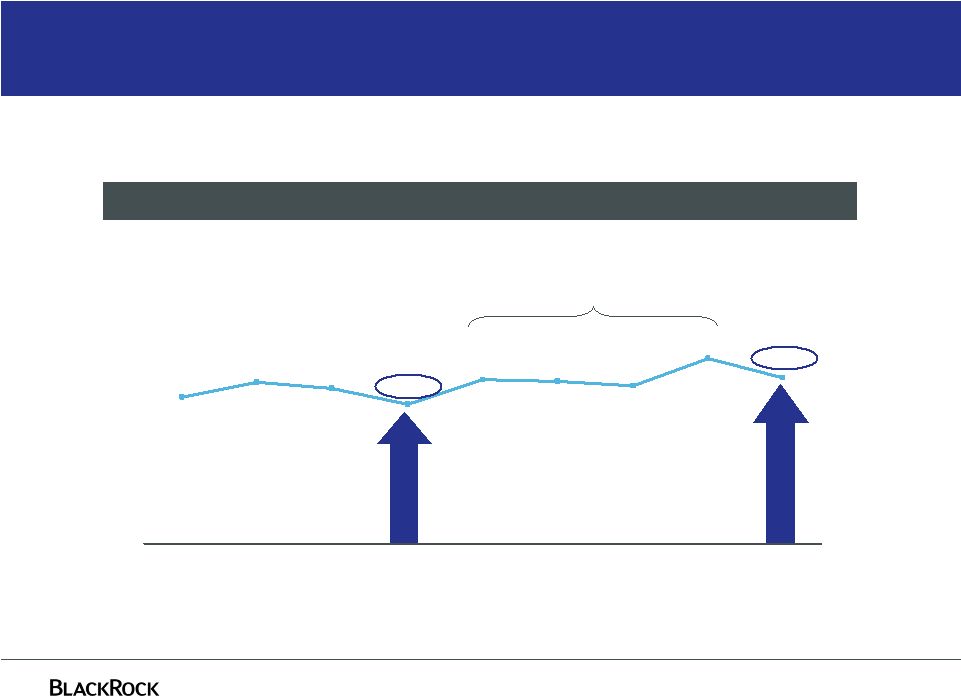
Equity markets continued to trend higher above 2010 levels
S&P 500
Q4 2010 Spot to Spot
Q1 2011 Spot to Spot
12/31/09
1/31/10
2/28/10
Q1 2010 Spot to Spot
3/31/10 9/30/10
10/31/10
11/30/10
12/31/10
1/31/11
2/28/11
3/31/11
Equity markets in Q1 2011 were slightly higher on average than Q1 2010 and Q4
2010 Q4-10 Average: 1,205
Q1-11 Average: 1,303
Q1-10 Average: 1,124
800
900
1,000
1,100
1,200
1,300
1,400 |
 4
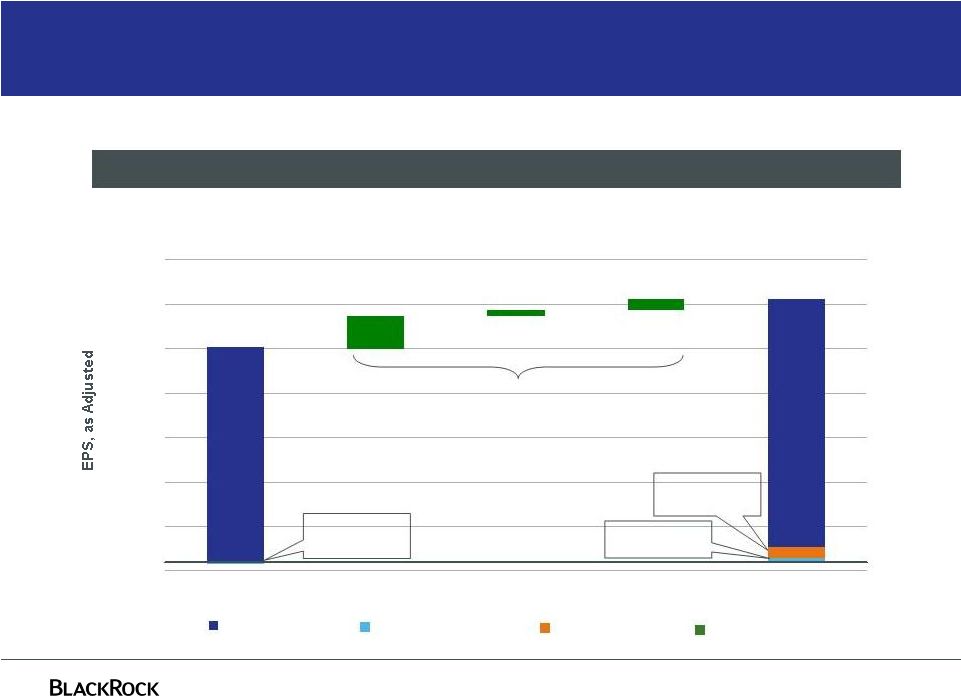
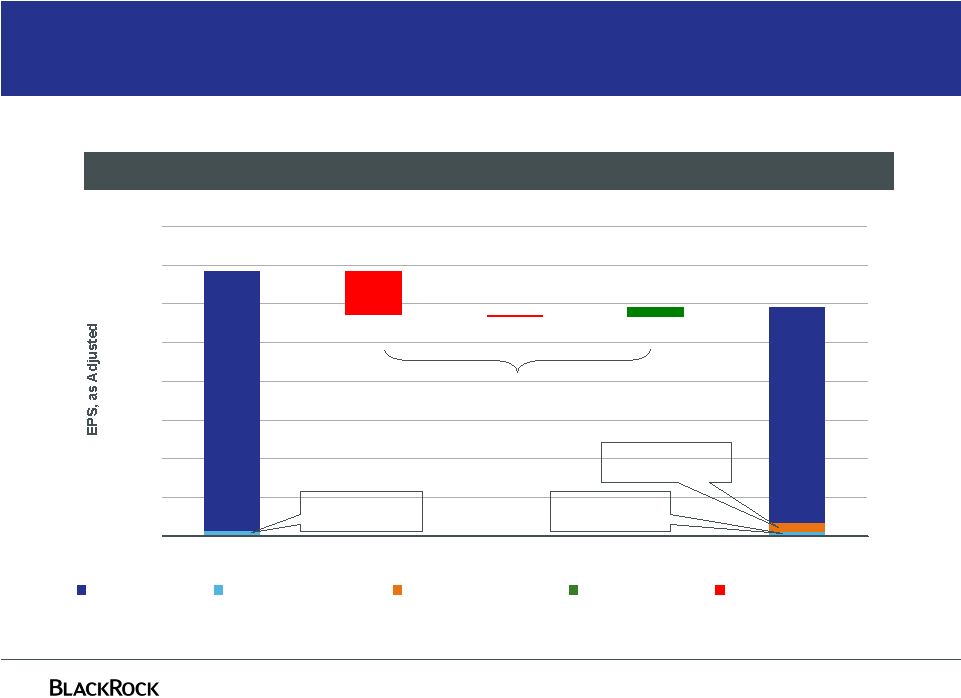
Year over year operating results continue to grow driven by base
fees
Increasing EPS
Non-Operating EPS
Operating EPS
Tax Adjustment
Total EPS:
$2.96
Total EPS:
$2.40
Non-Operating
EPS: $0.05
Non-Operating
EPS: ($0.02)
$0.56
Operating
EPS:
Operating
EPS:
For further information and reconciliation between GAAP and as Adjusted, see notes
(a) through (f) in the current earnings release $2.42
$0.07
$0.37
$0.12
$2.79
($0.10)
$0.40
$0.90
$1.40
$1.90
$2.40
$2.90
$3.40
Q1-10 EPS
Operating EPS
Non-Operating EPS
Tax Adjustment
Q1-11 EPS
Tax Adjustment
EPS: $0.12
Q1-11 Compared to Q1-10, as Adjusted |
 5
Sequential results effected by magnitude of Q4 performance “locks”
$3.35
($0.02)
($0.56)
$0.12
$2.79
$0.00
$0.50
$1.00
$1.50
$2.00
$2.50
$3.00
$3.50
$4.00
Q4-10 EPS
Operating EPS
Non-Operating EPS
Tax Adjustment
Q1-11 EPS
($0.46)
Increasing EPS
For further information and reconciliation between GAAP and as Adjusted, see notes
(a) through (f) in the current earnings release Decreasing EPS
Q1-11 Compared to Q4-10, as Adjusted
Non-Operating EPS
Operating EPS
Total EPS:
$3.42
Total EPS:
$2.96
Operating
EPS:
Non-Operating
EPS: $0.07
Non-Operating
EPS: $0.05
Operating
EPS:
Tax Adjustment
EPS: $0.12
Tax Adjustment |
 6
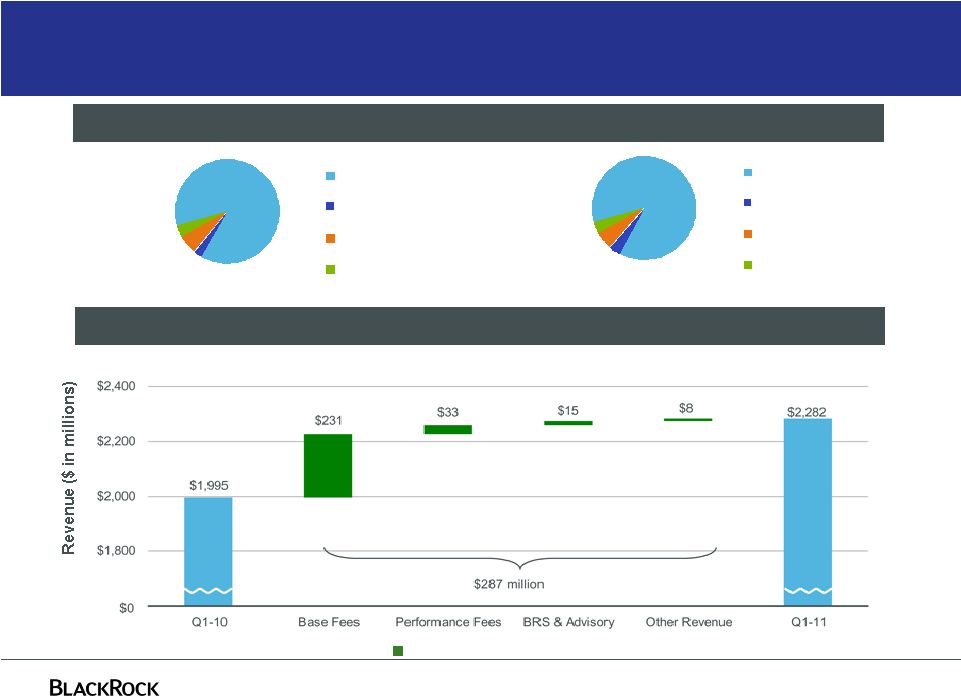
Year over year revenue growth of 14%
Q1-11 Compared to Q1-10
Increasing Revenue
Total Revenue
86%
4%
4%
6%
Base Fees
Performance Fees
BRS and Advisory
Other Revenue
Q1-10
$1.99 billion
Q1-11
$2.28 billion
87%
3%
4%
6%
Base Fees
Performance Fees
BRS and Advisory
Other Revenue |
 7
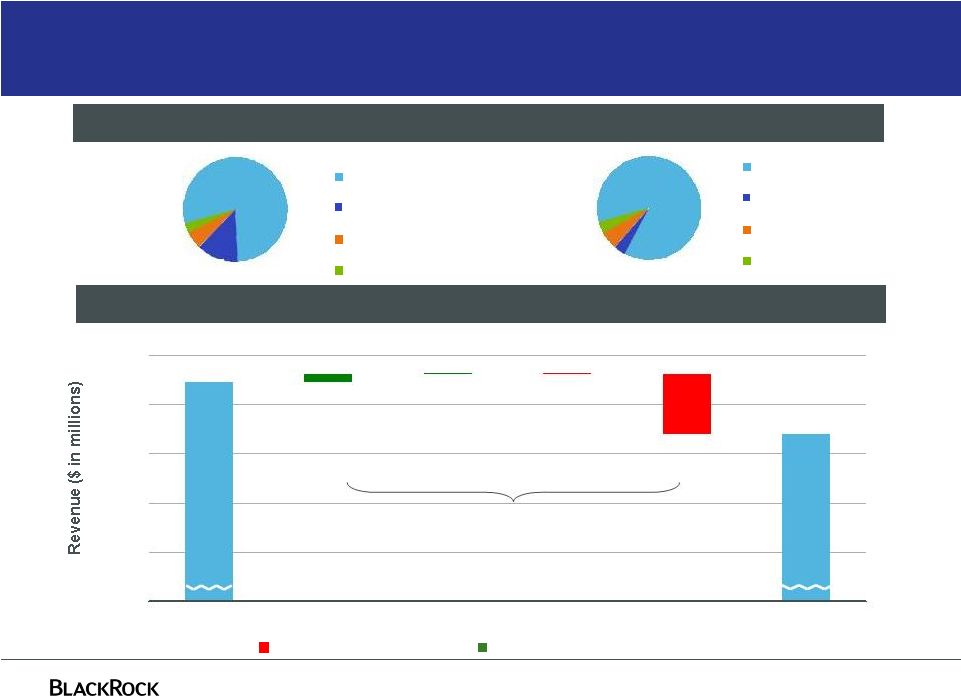
Magnitude of performance fees in Q4 exceeds first 3 quarters
($211) million
Decreasing Revenue
Q1-11 Compared to Q4-10
Increasing Revenue
Total Revenue
Q4-10
$2.49 billion
Q1-11
$2.28 billion
$2,493
$2,282
($243)
$33
($4)
$3
$0
$1,800
$2,000
$2,200
$2,400
$2,600
Q4-10
Base Fees
Other Revenue
BRS &
Advisory
Performance Fees
Q1-11
79%
13%
3%
5%
Base Fees
Performance Fees
BRS and Advisory
Other Revenue
86%
4%
4%
6%
Base Fees
Performance Fees
BRS and Advisory
Other Revenue |
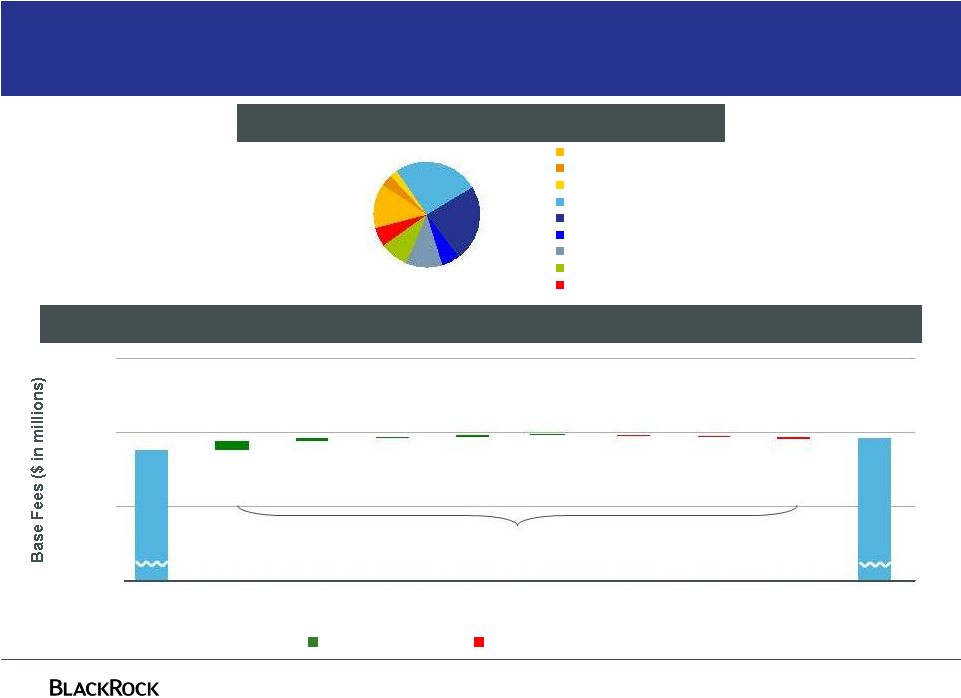
 8
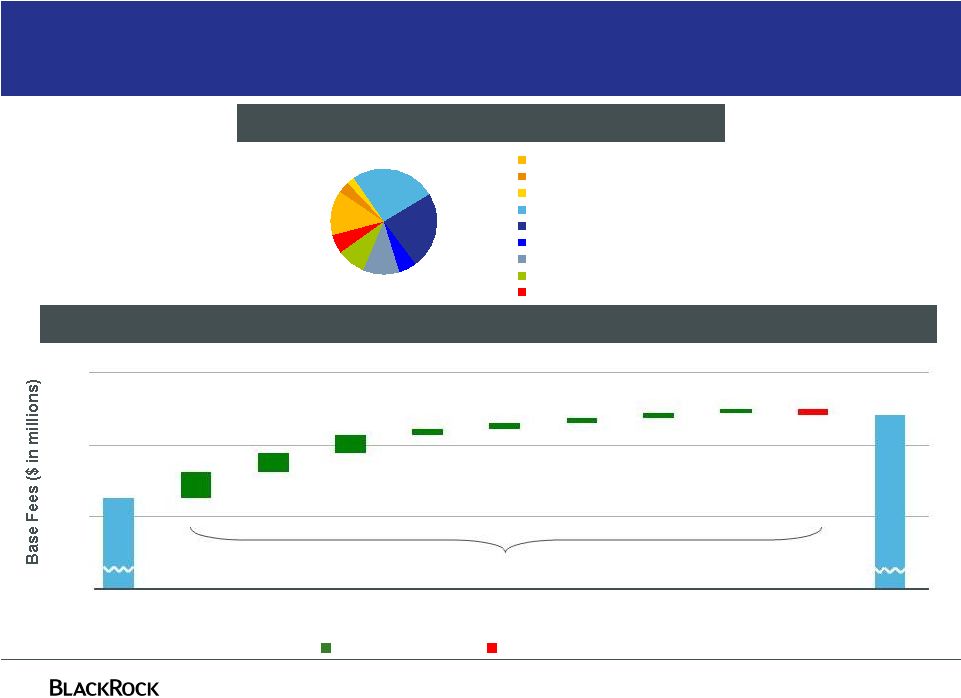
Base fees are higher in all long-term asset classes
Decreasing Base Fees
Increasing Base Fees
11%
9%
6%
3%
25%
22%
4%
14%
6%
Active Fixed Income
iShares/ ETP Fixed Income
Institutional Index Fixed Income
Active Equity
iShares/ ETP Equity
Institutional Index Equity
Multi-Asset
Alternatives
Cash
Q1-11 Base Fees
Q1-11 Compared to Q1-10
$1.98 billion
$231 million
$1,753
$1,984
$72
$52
$50
$17
$16
$15
$13
$12
($16)
$1,700
$1,900
$2,100
Q1-10
iShares/
ETP Equity
Multi-
Asset
Active
Equity
Alternatives
Institutional
Index Fixed
Income
Active
Fixed
Income
Institutional
Index Equity
iShares/
ETP Fixed
Income
Cash
Q1-11
$0 |
 9
Base fees continue to grow primarily due to improved markets and
long-term flows
$33 million
Decreasing Base Fees
Increasing Base Fees
Q1-11 Base Fees
Q1-11 Compared to Q4-10
$1.98 billion
$1,951
$27
$6
$5
$3
$2
($2)
($1)
($7)
$1,984
$0
$1,800
$2,000
$2,200
Q4-10
Active
Equity
Institutional
Index Fixed
Income
Alternatives
iShares/ ETP
Equity
Multi-
Asset
iShares/ETP
Fixed Income
Active
Fixed Income
Cash
Q1-11
11%
9%
6%
6%
14%
4%
22%
25%
3%
Active Fixed Income
iShares/ ETP Fixed Income
Institutional Index Fixed Income
Active Equity
iShares/ ETP Equity
Institutional Index Equity
Multi-Asset
Alternatives
Cash |
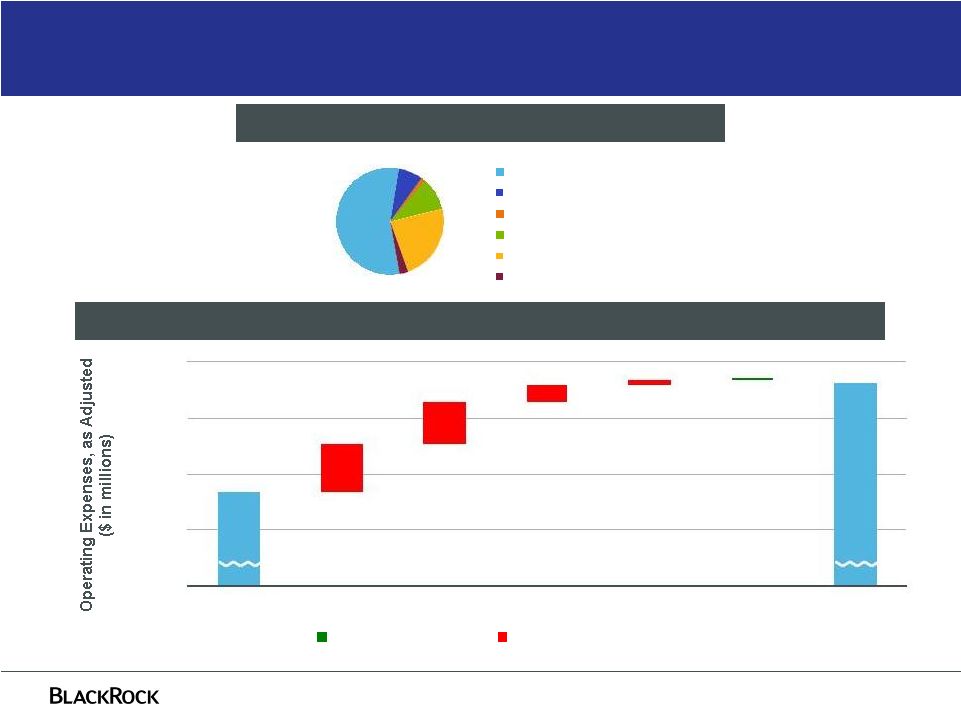 10
Expense growth due to continued growth in the business
$1.46 billion
Q1-11 Expense, as Adjusted, by Category
Q1-11 Compared to Q1-10, as Adjusted
For further information and reconciliation between GAAP and as Adjusted, see note
(a) in the current earnings release $1,268
$1,463
($4)
$30
$75
$85
$0
$1,200
$1,300
$1,400
$1,500
Q1-10
G&A
Compensation
& Benefits
Direct Fund Exp
Distribution &
Servicing
Amort.-Deferred
Commissions
Q1-11
Increasing Expenses
Decreasing Expenses
$9
55%
2%
10%
23%
3%
7%
Employee Comp. & Benefits
Distribution & Servicing Costs
Amort. of Deferred Sales Commissions
Direct Fund Expenses
General & Administration
Amortization of Intangibles |
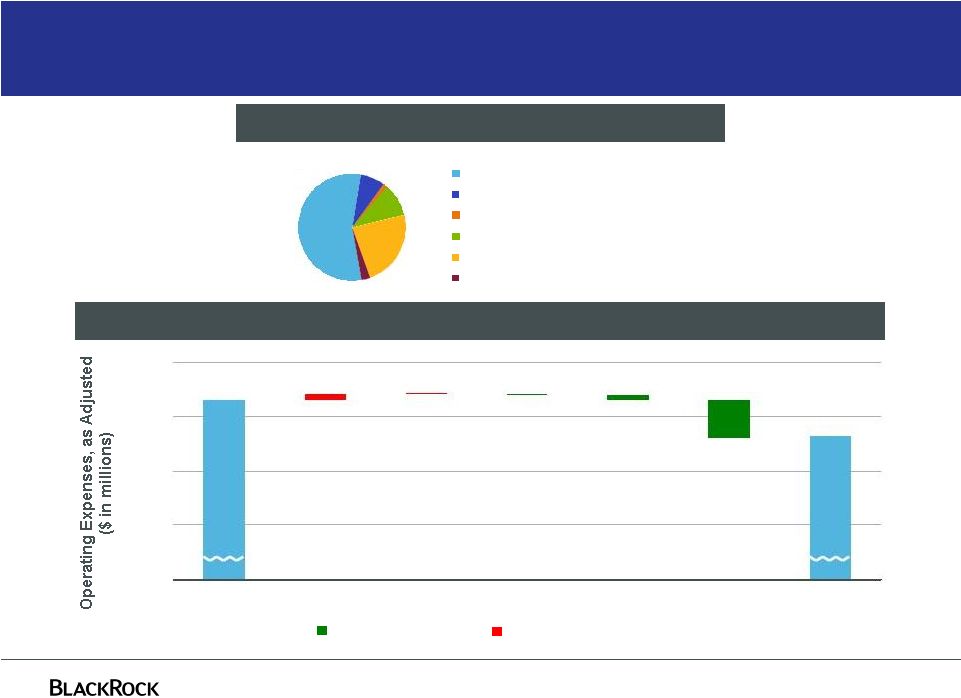 11
Lower expenses in Q1 due to certain Q4 G&A costs
$1.46 billion
Q1-11 Expense, as Adjusted, by Category
Q1-11 Compared to Q4-10, as Adjusted
For further information and reconciliation between GAAP and as Adjusted, see note
(a) in the current earnings release $1,531
$1,463
($69)
($10)
($1)
$3
$9
$1,300
$1,400
$1,500
$1,600
Q4-10
Direct Fund Exp
Distribution &
Servicing
Amort.-Deferred
Commissions
Compensation
& Benefits
G&A
Q1-11
Increasing Expenses
Decreasing Expenses
$0
55%
2%
10%
23%
3%
7%
Employee Comp. & Benefits
Distribution & Servicing Costs
Amort. of Deferred Sales Commissions
Direct Fund Expenses
General & Administration
Amortization of Intangibles |
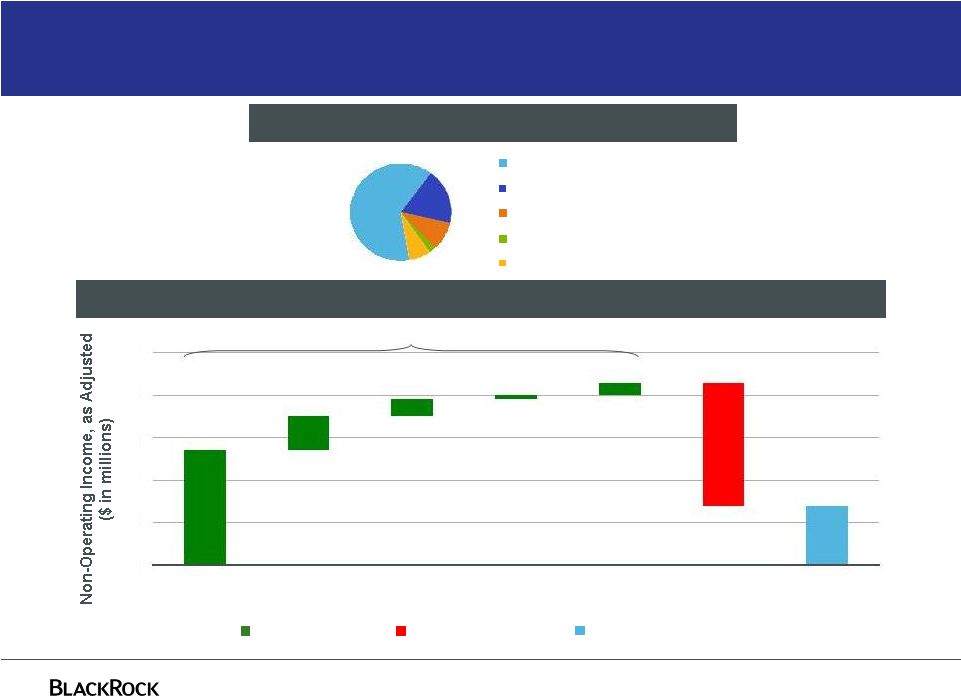 12
Continued investment gains driven by markets
$43 million
Q1-11 Investment Gain, as Adjusted, by Category
Q1-11 Non-Operating Income by Category, as Adjusted
Net Interest Expense
Investment Gain
Non-Operating Income
$43 million Investment Gain
$27
$14
$4
$8
$1
$3
($29)
$0
$10
$20
$30
$40
$50
Distressed
Credit/ Mortgage
Private Equity
Hedge Funds/
Funds of Hedge
Funds
Real Estate
Other
Investments
Net Interest
Expense
Q1-11
For further information and reconciliation between GAAP and as Adjusted, see note (b) in the current
earnings release as well as previously filed Form 10-Qs 63%
9%
2%
7%
19%
Distressed Credit/ Mortgage
Private Equity
Hedge Funds/ Funds of Hedge Funds
Real Estate
Other Investments |
 13
Increase in dividend supported by substantial cash flow
$4.00
$3.12
$3.12
$2.68
$1.68
$1.20
$1.00
$0.80
$5.50
33%
83%
64%
50%
56%
53%
48%
44%
48%
2011
2010
2009
2008
2007
2006
2005
2004
2003
Dividend (A)
Payout Ratio (B)
Notes:
(A) 2003 and 2011 dividends have been annualized
(B) Payout ratio = (dividends + share repurchases) / GAAP net income. 2011 ratio
includes Q1 2011 data only. N/A
2/26/04
2/15/05
2/17/06
2/27/07
2/15/08
N/A
2/25/10
3/7/11
Dividend Change
Declared: |
 Appendix |
 15
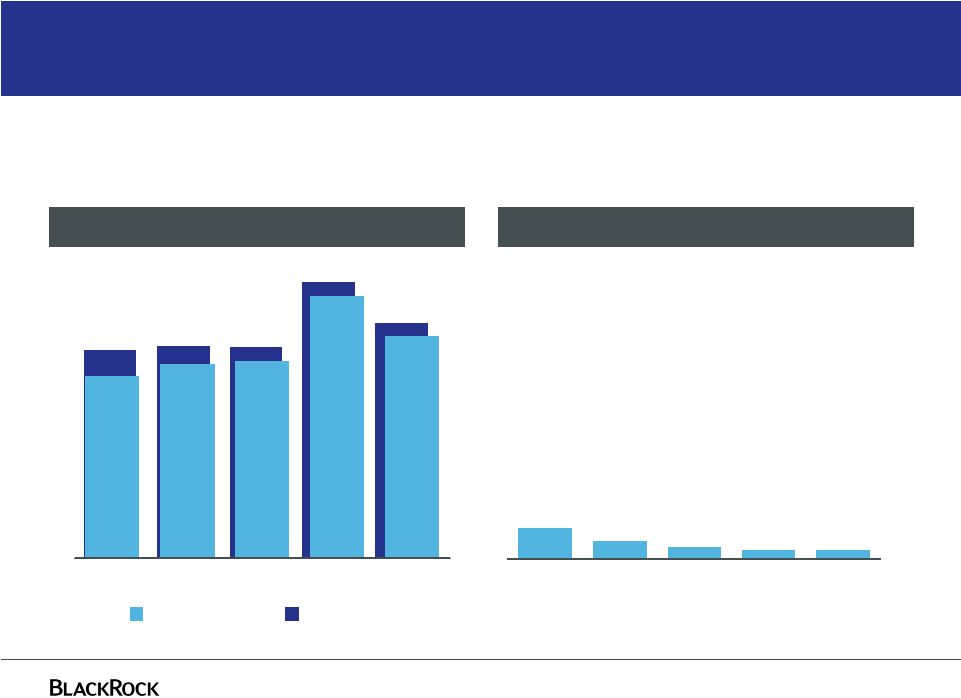
$962
$737
$741
$727
$819
$654
$697
$707
$940
$798
Q1 2010
Q2 2010
Q3 2010
Q4 2010
Q1 2011
GAAP
As Adjusted
Quarterly operating income –
GAAP and as Adjusted
Operating Income ($ in millions)
Non-GAAP Adjustments ($ in millions)
Non-GAAP adjustments include BGI integration costs, PNC LTIP funding
obligation, Merrill Lynch compensation
contribution, restructuring charges, and compensation related to
appreciation (depreciation) on deferred
compensation plans
$21
$22
$30
$73
$44
Q1 2010
Q2 2010
Q3 2010
Q4 2010
Q1 2011
For further information and reconciliation between GAAP and as Adjusted, see note (a) in the current
earnings release as well as previously filed Form 10-Qs |
 16
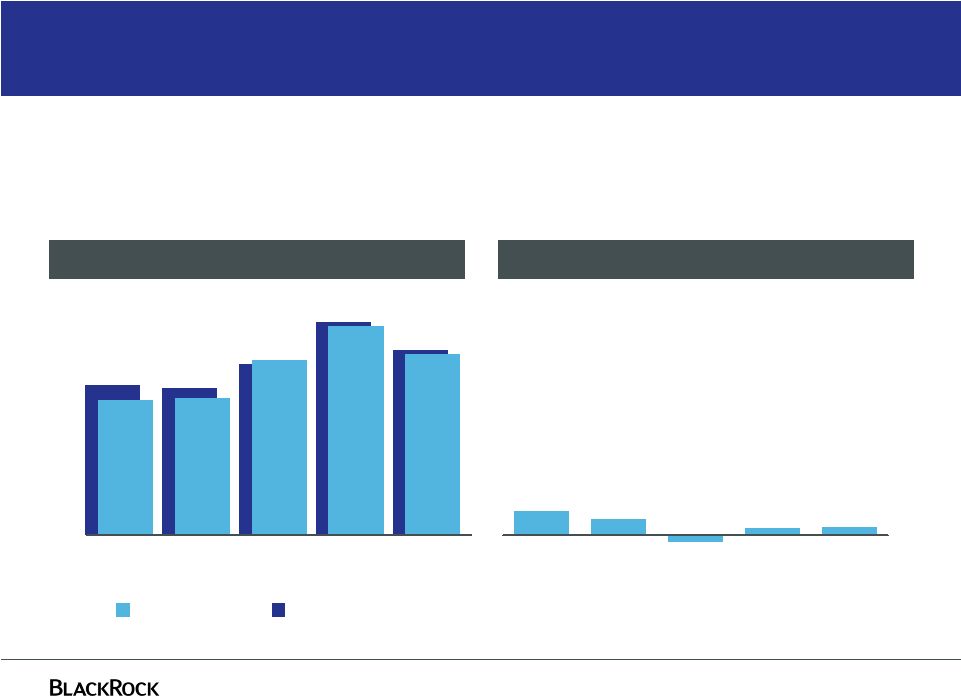
$582
$670
$469
$463
$537
$432
$551
$657
$568
$423
Q1 2010
Q2 2010
Q3 2010
Q4 2010
Q1 2011
Quarterly net income –
GAAP and as Adjusted
$14
$13
$46
$31
($14)
Q1 2010
Q2 2010
Q3 2010
Q4 2010
Q1 2011
Net Income ($ in millions)
Non-GAAP Adjustments ($ in millions)
Non-GAAP adjustments include BGI integration costs, PNC LTIP funding
obligation, Merrill Lynch compensation
contribution, restructuring charges, and income tax law changes
GAAP
As Adjusted
For further information and reconciliation between GAAP and as Adjusted, see notes
(c) and (d) in the current earnings release as well as previously filed Form 10-Qs |
 17
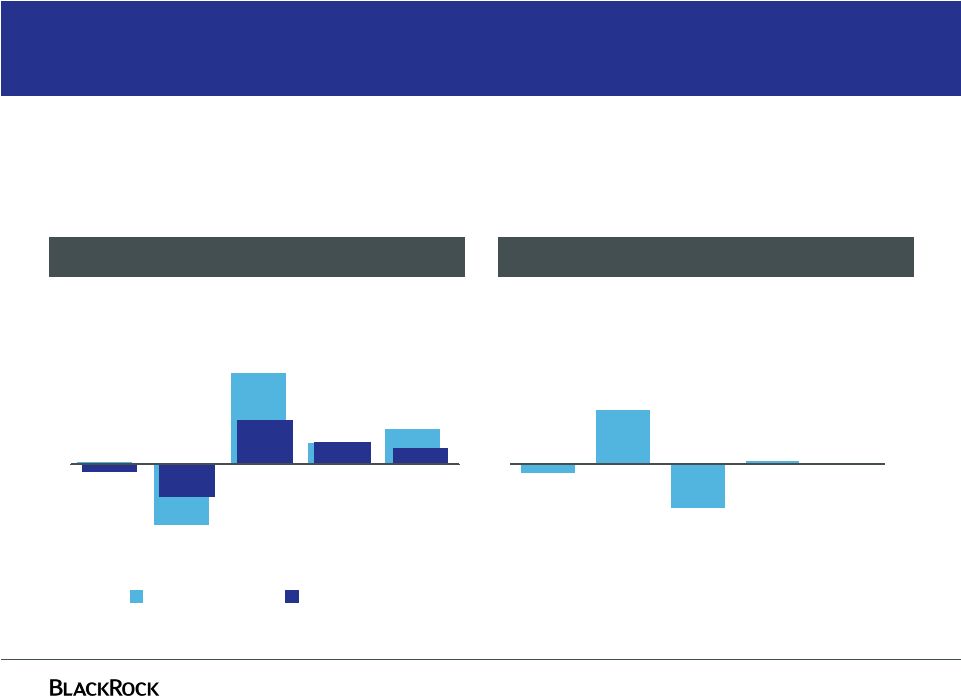
$78
$18
$15
$2
Q1 2010
Q2 2010
Q3 2010
Q4 2010
Q1 2011
$39
($28)
($6)
$20
$14
GAAP
As Adjusted
Quarterly non-operating income –
GAAP and as Adjusted
Non-Operating Income ($ in millions)
Non-GAAP Adjustments ($ in millions)
Non-GAAP adjustments include net income (loss) attributable to
non-controlling interests, and compensation expense related to
(appreciation) depreciation on deferred compensation plans $47
($8)
($39)
$2
($1)
Q1 2010
Q2 2010
Q3 2010
Q4 2010
Q1 2011
($75)
For further information and reconciliation between GAAP and as Adjusted, see note (b) in the current
earnings release as well as previously filed Form 10-Qs |
 18
Forward-looking statements
This presentation, and other statements that BlackRock may make, may contain forward-looking
statements within the meaning of the Private Securities Litigation Reform Act, with respect to
BlackRock’s future financial or business performance, strategies or expectations.
Forward-looking statements are typically identified by words or phrases such as
“trend,” “potential,” “opportunity,” “pipeline,” “believe,”
“comfortable,” “expect,” “anticipate,” “current,”
“intention,” “estimate,” “position,” “assume,” “outlook,”
“continue,” “remain,” “maintain,” “sustain,” “seek,”
“achieve,” and similar expressions, or future or conditional verbs such as
“will,” “would,” “should,” “could,” “may” or similar expressions.
BlackRock cautions that forward-looking statements are subject to numerous assumptions, risks and
uncertainties, which change over time. Forward-looking statements speak only as of
the date they are made, and BlackRock assumes no duty to and does not undertake to update
forward-looking statements. Actual results could differ materially from those anticipated in
forward-looking statements and future results could differ materially from historical
performance. |
 19
Forward-looking statements
In addition to risk factors previously disclosed in BlackRock’s Securities and Exchange
Commission (“SEC”) reports and those identified elsewhere in this presentation the
following factors, among others, could cause actual results to differ materially from
forward-looking statements or historical performance: (1) the introduction, withdrawal,
success and timing of business initiatives and strategies; (2) changes and volatility in political,
economic or industry conditions, the interest rate environment, foreign exchange rates or financial
and capital markets, which could result in changes in demand for products or services or in the
value of assets under management; (3) the relative and absolute investment performance of
BlackRock’s investment products; (4) the impact of increased competition; (5) the impact
of capital improvement projects; (6) the impact of future acquisitions or divestitures; (7) the
unfavorable resolution of legal proceedings; (8) the extent and timing of any share
repurchases; (9) the impact, extent and timing of technological changes and the adequacy of intellectual
property protection; (10) the impact of legislative and regulatory actions and reforms, including the
Dodd-Frank Wall Street Reform and Consumer Protection Act, and regulatory, supervisory or
enforcement actions of government agencies relating to BlackRock, Barclays Bank PLC, Bank of
America Corporation, Merrill Lynch & Co., Inc. or The PNC Financial Services Group, Inc.;
(11) terrorist activities, international hostilities and natural disasters, which may adversely
affect the general economy, domestic and local financial and capital markets, specific
industries or BlackRock; (12) the ability to attract and retain highly talented professionals;
(13) fluctuations in the carrying value of BlackRock’s economic investments; (14) the impact of
changes to tax legislation and, generally, the tax position of the Company; (15)
BlackRock’s success in maintaining the distribution of its products; (16) the impact of
BlackRock electing to provide support to its products from time to time; (17) the impact of
problems at other financial institutions or the failure or negative performance of products at
other financial institutions; and (18) the ability of BlackRock to complete the integration of the operations of
Barclays Global Investors.
|
 |