Attached files
| file | filename |
|---|---|
| 8-K - 8-K - IRON MOUNTAIN INC | a11-10553_18k.htm |
Exhibit 99.1
|
|
Iron Mountain Incorporated April 20, 2011 |
|
|
Cautionary Note Regarding Forward-Looking Statements: This presentation contains certain forward-looking statements within the meaning of the Private Securities Litigation Reform Act of 1995 and federal securities laws, and is subject to the safe-harbor created by such Act. Forward-looking statements include our 2011 through 2013 financial performance outlook and statements regarding our operations, economic performance, financial condition, goals, assumptions, beliefs, future growth strategies, investment objectives and expected capital spending, plans and current expectations, such as our three year financial objectives, increased Adjusted OIBDA margins and cash contributions, the exploration of strategic alternatives for our digital business, commitment to stockholder payouts, expected dividend payout and leverage ratios, expected continued productivity improvements and plans to maximize value and international expansion. These statements involve known and unknown risks, uncertainties and other factors that may cause the actual results to be materially different from those contemplated in the forward-looking statements. Such factors include, but are not limited to: (i) the cost to comply with current and future laws, regulations and customer demands relating to privacy issues; (ii) the impact of litigation or disputes that may arise in connection with incidents in which we fail to protect our customers’ information; (iii) changes in the price for our services relative to the cost of providing such services; (iv) changes in customer preferences and demand for our services; (v) the cost or potential liabilities associated with real estate necessary for our business; (vi) the performance of business partners upon whom we depend for technical assistance or management expertise outside the United States; (vii) changes in the political and economic environments in the countries in which our international subsidiaries operate; (viii) in the various digital businesses in which we are engaged, our ability to keep up with rapid technological changes, evolving industry expectations and changing customer requirements or competition for customers; (ix) the successful completion of our strategic alternative review process for our digital business; (x) claims that our technology violates the intellectual property rights of a third party; (xi) the impact of legal restrictions or limitations under stock repurchase plans on price, volume or timing of stock repurchases; (xii) the impact of alternative, more attractive investments on dividends or stock repurchases; (xiii) our ability or inability to complete acquisitions on satisfactory terms and to integrate acquired companies efficiently; (xiv) other trends in competitive or economic conditions affecting our financial condition or results of operations not presently contemplated; and (xv) other risks described more fully in our most recently filed Annual Report on Form 10-K under “Item 1A. Risk Factors.” and other documents that we file with, or furnish to, the SEC from time to time. Except as required by law, we undertake no obligation to release publicly the result of any revision to these forward-looking statements that may be made to reflect events or circumstances after the date hereof or to reflect the occurrence of unanticipated events. Reconciliation of Non-GAAP Measures: Throughout this presentation, Iron Mountain will be discussing Adjusted Operating Income Before Depreciation & Amortization and Goodwill Impairment (Adjusted OIBDA), Free Cash Flow Before Acquisitions & Investments (FCF), Adjusted EPS, Cash Contribution and ROIC, which do not conform to accounting principles generally accepted in the United States (GAAP). For additional information and the reconciliation of these measures to the appropriate GAAP measure, as required by Securities and Exchange Commission Regulation G, please refer to the Appendix at the end of this presentation or access the “Non-GAAP Measures” link on the Investor Relations page of the Company’s website at www.ironmountain.com. Cautionary Note Regarding Forward-Looking Statements and Reconciliations of Non-GAAP Measures |
|
|
Additional Information: This may be deemed to be solicitation material in respect of the proposals described in Iron Mountain’s preliminary proxy statement in connection with its 2011 Annual Meeting of Stockholders, filed by Iron Mountain with the Securities and Exchange Commission (the “SEC”) on April 1, 2011. In addition, Iron Mountain will file with, or furnish to, the SEC all relevant materials, including a definitive proxy statement (when available). BEFORE MAKING ANY VOTING DECISION, STOCKHOLDERS OF IRON MOU NTAIN ARE URGED TO READ ALL RELEVANT DOCUMENTS FILED WITH OR FURNISHED TO THE SEC, INCLUDING, THE PRELIMINARY PROXY STATEMENT FILED BY IRON MOUNTAIN ON APRIL 1, 2011 AND, WHEN AVAILABLE, THE DEFINITIVE PROXY STATEMENT, BECAUSE THEY WILL CONTAIN IMPORTANT INFORMATION ABOUT THE PROPOSALS. The definitive proxy statement (when available) will be mailed to stockholders of Iron Mountain. Stockholders will be able to obtain, without charge, a copy of the preliminary proxy statement, the definitive proxy statement (when available) and other documents that Iron Mountain files with the SEC from the SEC’s website at www.sec.gov. The preliminary proxy statement, definitive proxy statement (when available) and other relevant documents will also be available, without charge, by directing a request by mail or telephone to Iron Mountain Incorporated, Attn: Investor Relations, 745 Atlantic Avenue, Boston, Massachusetts 02111, or from Iron Mountain’s website, www.ironmountain.com, or by contacting Innisfree, toll free at (877) 717-3898. Iron Mountain, its directors and executive officers and certain other members of its management and employees may be deemed to be participants in the solicitation of proxies in connection with the 2011 Annual Meeting of Stockholders. Additional information regarding the interests of such potential participants is included in the preliminary proxy statement and will be included in the definitive proxy statement (when available). Additional Information |
|
|
Market-Leading Global Business Delivering Increased Returns to Shareholders |
|
|
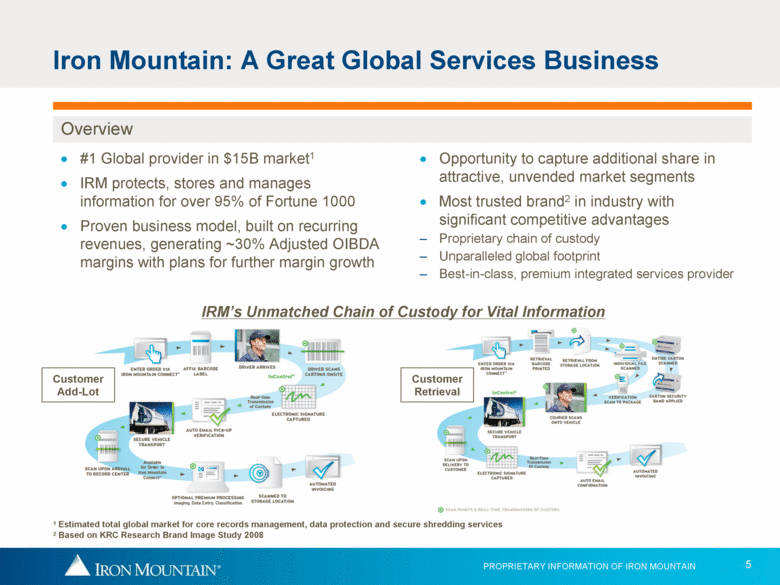
Overview #1 Global provider in $15B market1 IRM protects, stores and manages information for over 95% of Fortune 1000 Proven business model, built on recurring revenues, generating ~30% Adjusted OIBDA margins with plans for further margin growth IRM’s Unmatched Chain of Custody for Vital Information 1 Estimated total global market for core records management, data protection and secure shredding services 2 Based on KRC Research Brand Image Study 2008 Opportunity to capture additional share in attractive, unvended market segments Most trusted brand2 in industry with significant competitive advantages Proprietary chain of custody Unparalleled global footprint Best-in-class, premium integrated services provider Iron Mountain: A Great Global Services Business Customer Add-Lot Customer Retrieval |
|
|
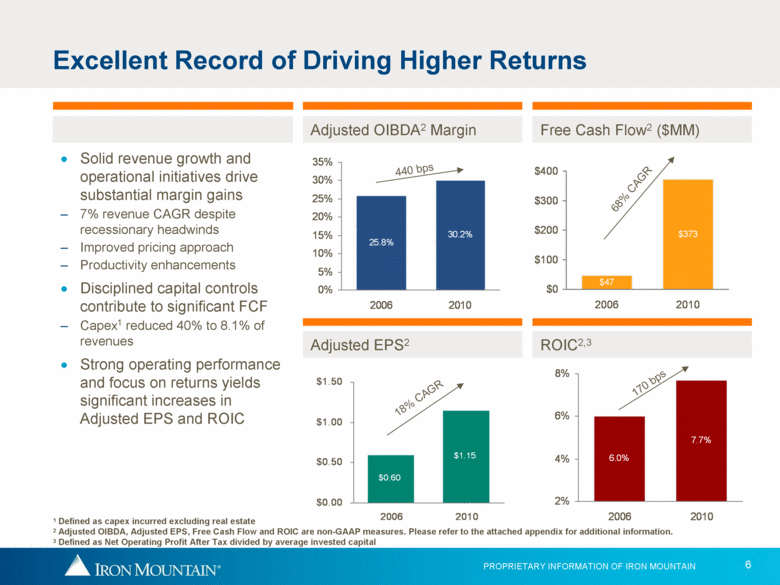
Free Cash Flow2 ($MM) ROIC2,3 68% CAGR Adjusted OIBDA2 Margin Adjusted EPS2 Solid revenue growth and operational initiatives drive substantial margin gains 7% revenue CAGR despite recessionary headwinds Improved pricing approach Productivity enhancements Disciplined capital controls contribute to significant FCF Capex1 reduced 40% to 8.1% of revenues Strong operating performance and focus on returns yields significant increases in Adjusted EPS and ROIC 170 bps 18% CAGR 440 bps Excellent Record of Driving Higher Returns 1 Defined as capex incurred excluding real estate 2 Adjusted OIBDA, Adjusted EPS, Free Cash Flow and ROIC are non-GAAP measures. Please refer to the attached appendix for additional information. 3 Defined as Net Operating Profit After Tax divided by average invested capital $47 $373 $0 $100 $200 $300 $400 2006 2010 6.0% 7.7% 2% 4% 6% 8% 2006 2010 $0.60 $1.15 $0.00 $0.50 $1.00 $1.50 2006 2010 |
|
|
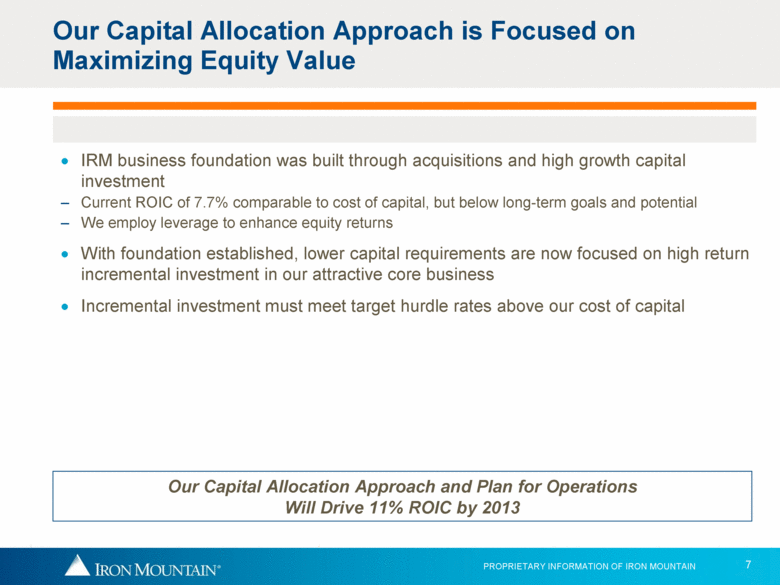
IRM business foundation was built through acquisitions and high growth capital investment Current ROIC of 7.7% comparable to cost of capital, but below long-term goals and potential We employ leverage to enhance equity returns With foundation established, lower capital requirements are now focused on high return incremental investment in our attractive core business Incremental investment must meet target hurdle rates above our cost of capital Our Capital Allocation Approach is Focused on Maximizing Equity Value Our Capital Allocation Approach and Plan for Operations Will Drive 11% ROIC by 2013 |
|
|
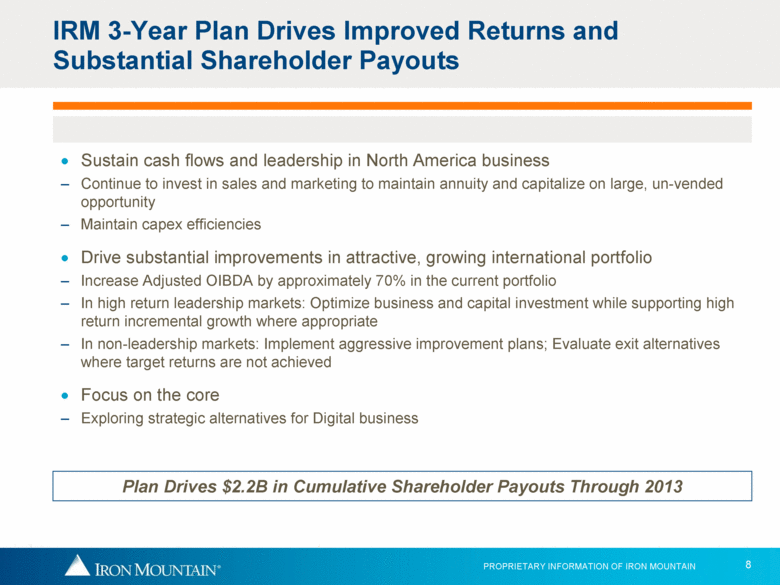
Sustain cash flows and leadership in North America business Continue to invest in sales and marketing to maintain annuity and capitalize on large, un-vended opportunity Maintain capex efficiencies Drive substantial improvements in attractive, growing international portfolio Increase Adjusted OIBDA by approximately 70% in the current portfolio In high return leadership markets: Optimize business and capital investment while supporting high return incremental growth where appropriate In non-leadership markets: Implement aggressive improvement plans; Evaluate exit alternatives where target returns are not achieved Focus on the core Exploring strategic alternatives for Digital business IRM 3-Year Plan Drives Improved Returns and Substantial Shareholder Payouts Plan Drives $2.2B in Cumulative Shareholder Payouts Through 2013 |
|
|
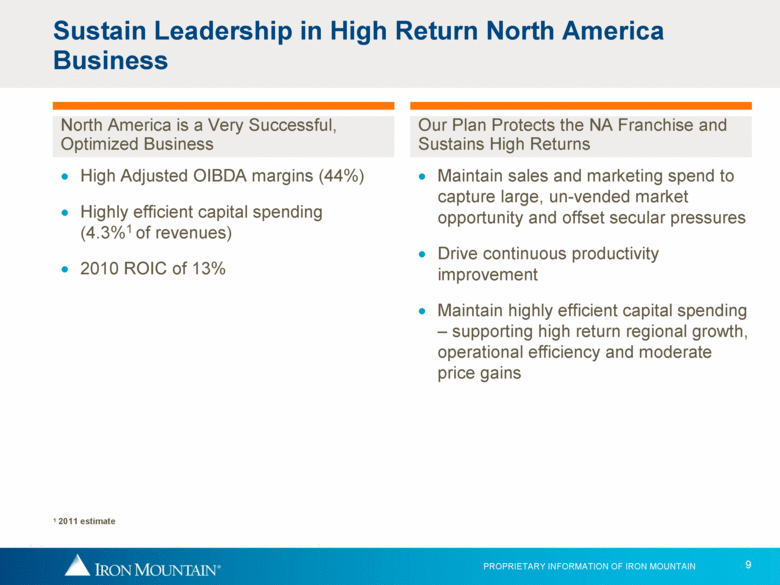
Maintain sales and marketing spend to capture large, un-vended market opportunity and offset secular pressures Drive continuous productivity improvement Maintain highly efficient capital spending – supporting high return regional growth, operational efficiency and moderate price gains Sustain Leadership in High Return North America Business Our Plan Protects the NA Franchise and Sustains High Returns North America is a Very Successful, Optimized Business High Adjusted OIBDA margins (44%) Highly efficient capital spending (4.3%1 of revenues) 2010 ROIC of 13% 1 2011 estimate |
|
|
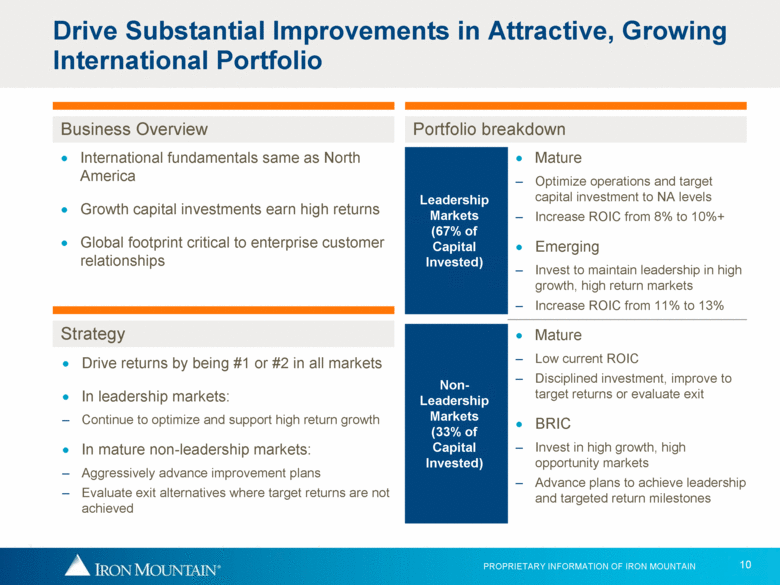
Drive Substantial Improvements in Attractive, Growing International Portfolio Portfolio breakdown Business Overview International fundamentals same as North America Growth capital investments earn high returns Global footprint critical to enterprise customer relationships Mature Optimize operations and target capital investment to NA levels Increase ROIC from 8% to 10%+ Emerging Invest to maintain leadership in high growth, high return markets Increase ROIC from 11% to 13% Leadership Markets (67% of Capital Invested) Non-Leadership Markets (33% of Capital Invested) Mature Low current ROIC Disciplined investment, improve to target returns or evaluate exit BRIC Invest in high growth, high opportunity markets Advance plans to achieve leadership and targeted return milestones Strategy Drive returns by being #1 or #2 in all markets In leadership markets: Continue to optimize and support high return growth In mature non-leadership markets: Aggressively advance improvement plans Evaluate exit alternatives where target returns are not achieved |
|
|
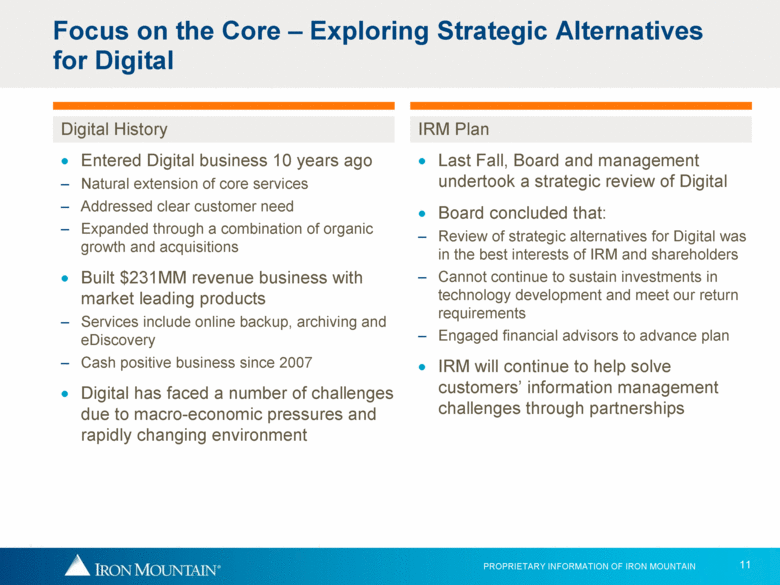
Entered Digital business 10 years ago Natural extension of core services Addressed clear customer need Expanded through a combination of organic growth and acquisitions Built $231MM revenue business with market leading products Services include online backup, archiving and eDiscovery Cash positive business since 2007 Digital has faced a number of challenges due to macro-economic pressures and rapidly changing environment Last Fall, Board and management undertook a strategic review of Digital Board concluded that: Review of strategic alternatives for Digital was in the best interests of IRM and shareholders Cannot continue to sustain investments in technology development and meet our return requirements Engaged financial advisors to advance plan IRM will continue to help solve customers’ information management challenges through partnerships Focus on the Core – Exploring Strategic Alternatives for Digital IRM Plan Digital History |
|
|
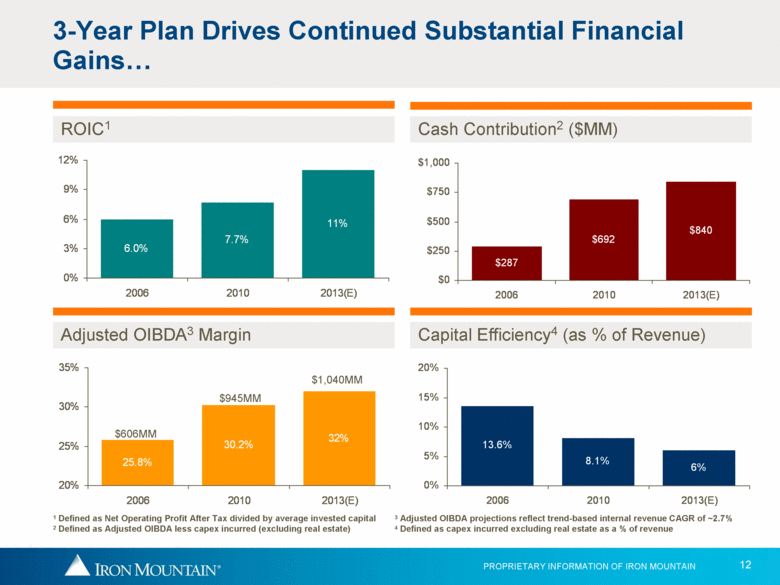
Adjusted OIBDA3 Margin $606MM $945MM $1,040MM ROIC1 Cash Contribution2 ($MM) 3-Year Plan Drives Continued Substantial Financial Gains 1 Defined as Net Operating Profit After Tax divided by average invested capital 2 Defined as Adjusted OIBDA less capex incurred (excluding real estate) Capital Efficiency4 (as % of Revenue) 3 Adjusted OIBDA projections reflect trend-based internal revenue CAGR of ~2.7% 4 Defined as capex incurred excluding real estate as a % of revenue 25.8% 30.2% 32% 20% 25% 30% 35% 2006 2010 2013(E) $287 $692 $840 $0 $250 $500 $750 $1,000 2006 2010 2013(E) 13.6% 8.1% 6% 0% 5% 10% 15% 20% 2006 2010 2013(E) 6.0% 7.7% 11% 0% 3% 6% 9% 12% 2006 2010 2013(E) |
|
|
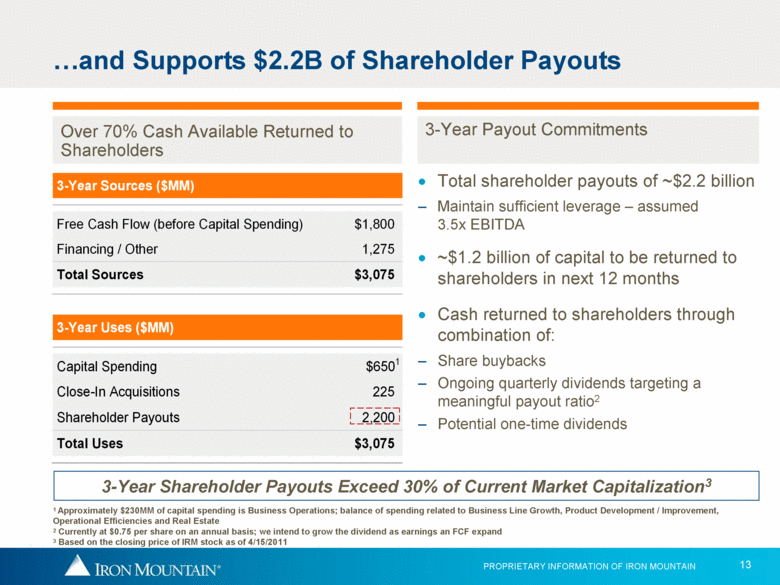
Total shareholder payouts of ~$2.2 billion Maintain sufficient leverage – assumed 3.5x EBITDA ~$1.2 billion of capital to be returned to shareholders in next 12 months Cash returned to shareholders through combination of: Share buybacks Ongoing quarterly dividends targeting a meaningful payout ratio2 Potential one-time dividends 3-Year Payout Commitments Over 70% Cash Available Returned to Shareholders and Supports $2.2B of Shareholder Payouts 1 Approximately $230MM of capital spending is Business Operations; balance of spending related to Business Line Growth, Product Development / Improvement, Operational Efficiencies and Real Estate 2 Currently at $0.75 per share on an annual basis; we intend to grow the dividend as earnings an FCF expand 3 Based on the closing price of IRM stock as of 4/15/2011 3-Year Shareholder Payouts Exceed 30% of Current Market Capitalization3 3-Year Sources ($MM) Free Cash Flow (before Capital Spending) $1,800 Financing / Other 1,275 Total Sources $3,075 3-Year Uses ($MM) Capital Spending $6501 Close-In Acquisitions 225 Shareholder Payouts 2,200 Total Uses $3,075 |
|
|
North America: Proven Formula for High Returns |
|
|
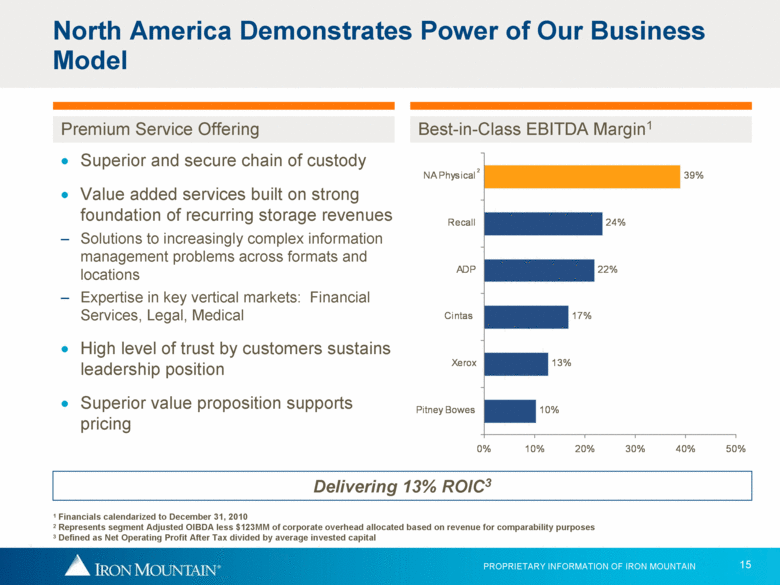
Delivering 13% ROIC3 2 Superior and secure chain of custody Value added services built on strong foundation of recurring storage revenues Solutions to increasingly complex information management problems across formats and locations Expertise in key vertical markets: Financial Services, Legal, Medical High level of trust by customers sustains leadership position Superior value proposition supports pricing North America Demonstrates Power of Our Business Model Best-in-Class EBITDA Margin1 Premium Service Offering 1 Financials calendarized to December 31, 2010 2 Represents segment Adjusted OIBDA less $123MM of corporate overhead allocated based on revenue for comparability purposes 3 Defined as Net Operating Profit After Tax divided by average invested capital 10% 13% 17% 22% 24% 39% 0% 10% 20% 30% 40% 50% Pitney Bowes Xerox Cintas ADP Recall NA Physical |
|
|
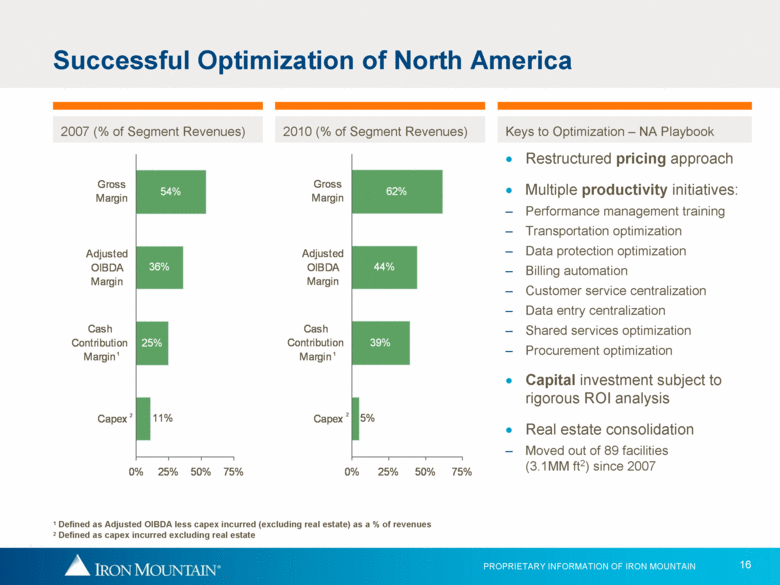
2007 (% of Segment Revenues) 2010 (% of Segment Revenues) Keys to Optimization – NA Playbook Restructured pricing approach Multiple productivity initiatives: Performance management training Transportation optimization Data protection optimization Billing automation Customer service centralization Data entry centralization Shared services optimization Procurement optimization Capital investment subject to rigorous ROI analysis Real estate consolidation Moved out of 89 facilities (3.1MM ft2) since 2007 1 2 1 2 Successful Optimization of North America 1 Defined as Adjusted OIBDA less capex incurred (excluding real estate) as a % of revenues 2 Defined as capex incurred excluding real estate |
|
|
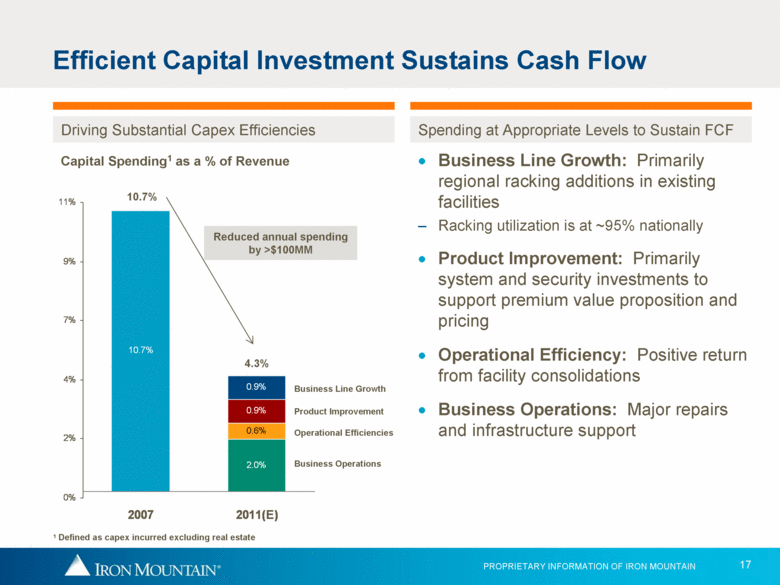
Operational Efficiencies 4.3% Product Improvement Business Line Growth Business Operations Capital Spending1 as a % of Revenue Business Line Growth: Primarily regional racking additions in existing facilities Racking utilization is at ~95% nationally Product Improvement: Primarily system and security investments to support premium value proposition and pricing Operational Efficiency: Positive return from facility consolidations Business Operations: Major repairs and infrastructure support 10.7% Reduced annual spending by >$100MM Spending at Appropriate Levels to Sustain FCF Driving Substantial Capex Efficiencies Efficient Capital Investment Sustains Cash Flow 1 Defined as capex incurred excluding real estate 10.7% 2.0% 0.6% 0.9% 0.9% 0% 2% 4% 7% 9% 11% 2007 2011(E) |
|
|
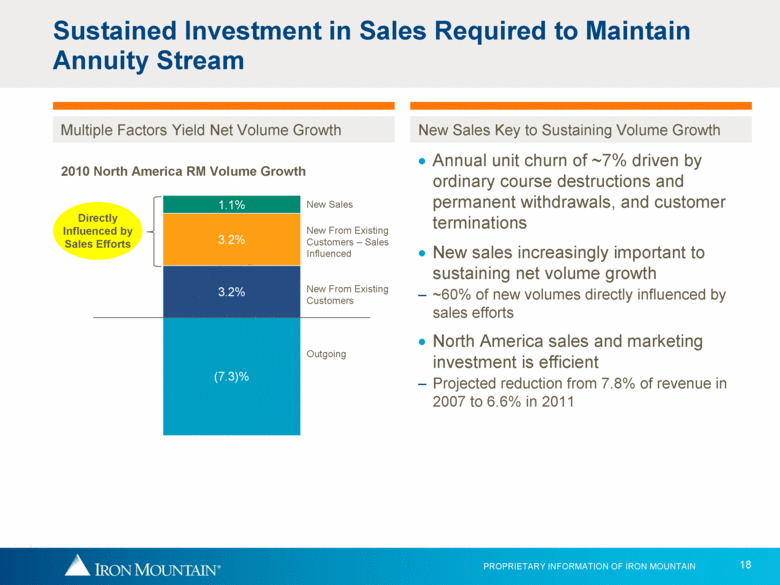
Annual unit churn of ~7% driven by ordinary course destructions and permanent withdrawals, and customer terminations New sales increasingly important to sustaining net volume growth ~60% of new volumes directly influenced by sales efforts North America sales and marketing investment is efficient Projected reduction from 7.8% of revenue in 2007 to 6.6% in 2011 Directly Influenced by Sales Efforts New Sales New From Existing Customers – Sales Influenced New From Existing Customers Outgoing Sustained Investment in Sales Required to Maintain Annuity Stream New Sales Key to Sustaining Volume Growth Multiple Factors Yield Net Volume Growth 2010 North America RM Volume Growth 3.2% 3.2% 1.1% (7.3)% |
|
|
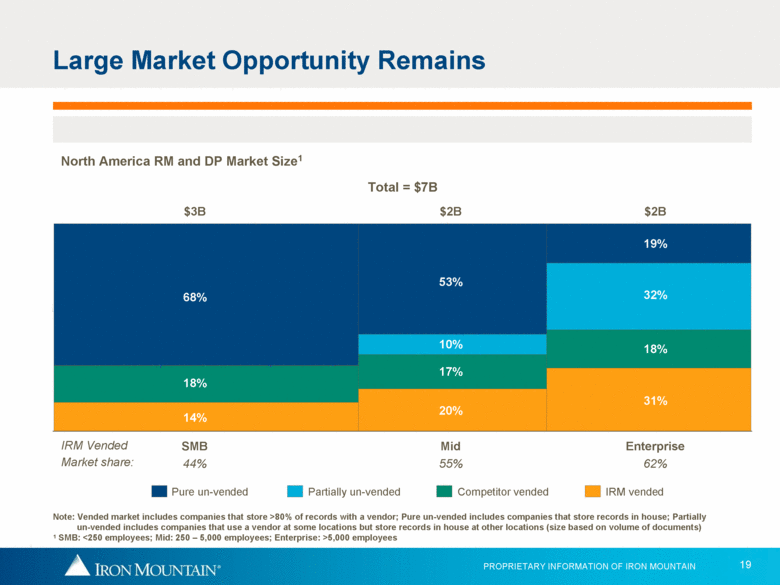
Large Market Opportunity Remains Enterprise Mid SMB Total = $7B 44% 55% 62% IRM Vended North America RM and DP Market Size1 Note: Vended market includes companies that store >80% of records with a vendor; Pure un-vended includes companies that store records in house; Partially un-vended includes companies that use a vendor at some locations but store records in house at other locations (size based on volume of documents) 1 SMB: <250 employees; Mid: 250 – 5,000 employees; Enterprise: >5,000 employees Partially un-vended Pure un-vended IRM vended Market share: $2B 31% 18% 32% 19% 20% $2B 17% 10% 53% $3B 14% 18% 68% Competitor vended |
|
|
International: Opportunity to Drive ROIC Through Growth and Optimization |
|
|
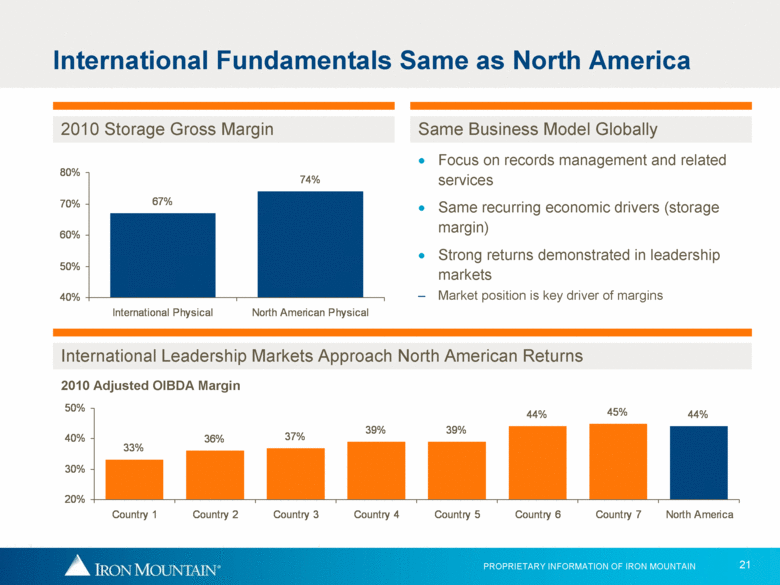
Focus on records management and related services Same recurring economic drivers (storage margin) Strong returns demonstrated in leadership markets Market position is key driver of margins International Fundamentals Same as North America Same Business Model Globally 2010 Storage Gross Margin International Leadership Markets Approach North American Returns 2010 Adjusted OIBDA Margin 67% 74% 40% 50% 60% 70% 80% International Physical North American Physical 33% 36% 37% 39% 39% 44% 45% 44% 20% 30% 40% 50% Country 1 Country 2 Country 3 Country 4 Country 5 Country 6 Country 7 North America |
|
|
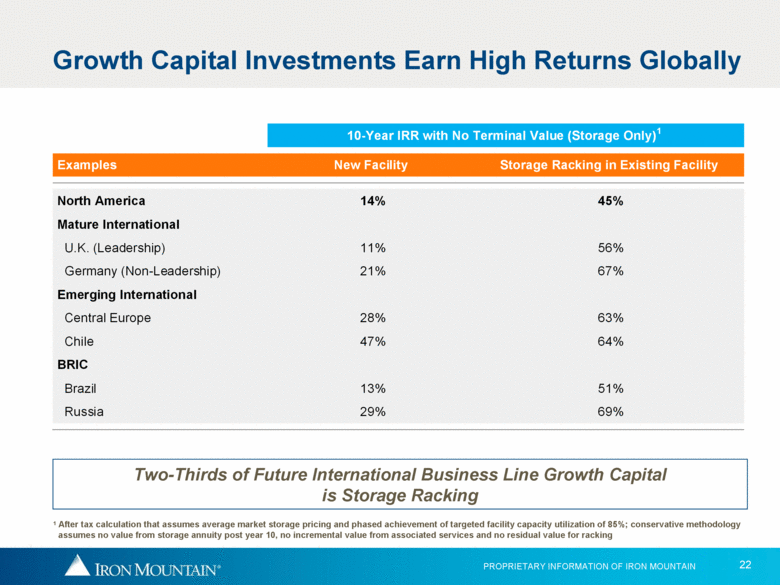
Growth Capital Investments Earn High Returns Globally 1 After tax calculation that assumes average market storage pricing and phased achievement of targeted facility capacity utilization of 85%; conservative methodology assumes no value from storage annuity post year 10, no incremental value from associated services and no residual value for racking Two-Thirds of Future International Business Line Growth Capital is Storage Racking 10-Year IRR with No Terminal Value (Storage Only)1 Examples New Facility Storage Racking in Existing Facility North America 14% 45% Mature International U.K. (Leadership) 11% 56% Germany (Non-Leadership) 21% 67% Emerging International Central Europe 28% 63% Chile 47% 64% BRIC Brazil 13% 51% Russia 29% 69% |
|
|
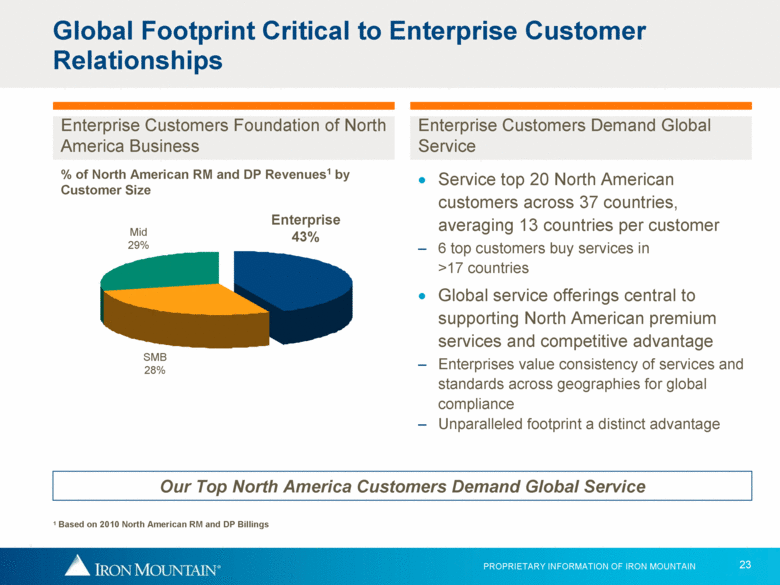
Enterprise 43% SMB 28% Mid 29% Service top 20 North American customers across 37 countries, averaging 13 countries per customer 6 top customers buy services in >17 countries Global service offerings central to supporting North American premium services and competitive advantage Enterprises value consistency of services and standards across geographies for global compliance Unparalleled footprint a distinct advantage Global Footprint Critical to Enterprise Customer Relationships Enterprise Customers Foundation of North America Business % of North American RM and DP Revenues1 by Customer Size Our Top North America Customers Demand Global Service 1 Based on 2010 North American RM and DP Billings Enterprise Customers Demand Global Service |
|
|
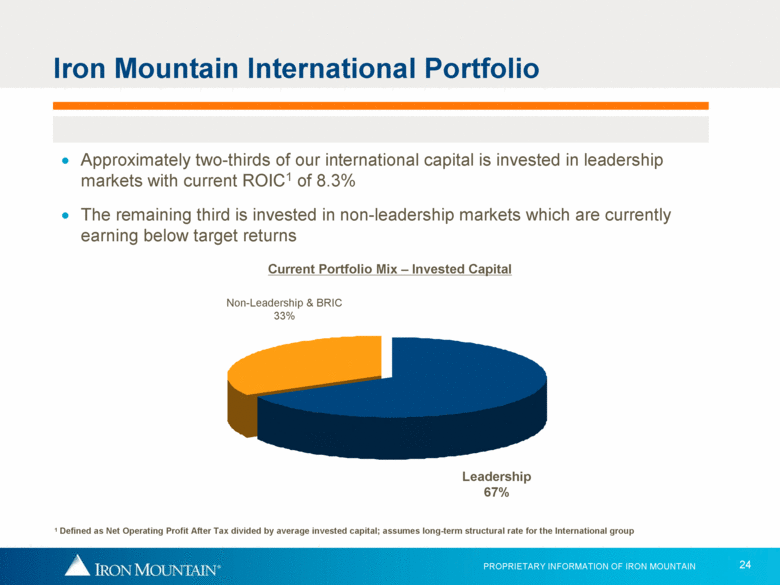
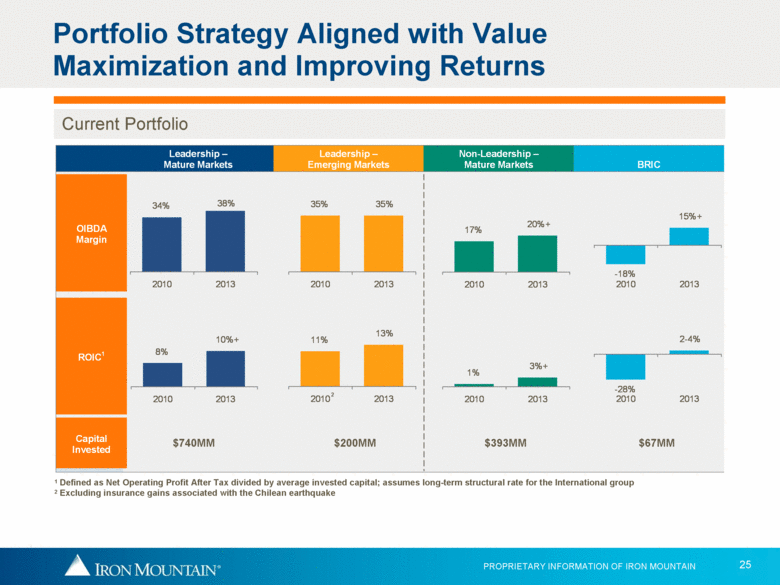
Iron Mountain International Portfolio Leadership 67% Approximately two-thirds of our international capital is invested in leadership markets with current ROIC1 of 8.3% The remaining third is invested in non-leadership markets which are currently earning below target returns Non-Leadership & BRIC 33% Current Portfolio Mix – Invested Capital 1 Defined as Net Operating Profit After Tax divided by average invested capital; assumes long-term structural rate for the International group |
|
|
Portfolio Strategy Aligned with Value Maximization and Improving Returns 1 Defined as Net Operating Profit After Tax divided by average invested capital; assumes long-term structural rate for the International group 2 Excluding insurance gains associated with the Chilean earthquake 2 $740MM $200MM $393MM $67MM Current Portfolio Leadership – Mature Markets Leadership – Emerging Markets Non-Leadership – Mature Markets BRIC OIBDA Margin ROIC1 Capital Invested 8% 10%+ 2010 2013 1% 3%+ 2010 2013 35% 35% 2010 2013 -18% 15%+ 2010 2013 11% 13% 2010 2013 17% 20%+ 2010 2013 |
|
|
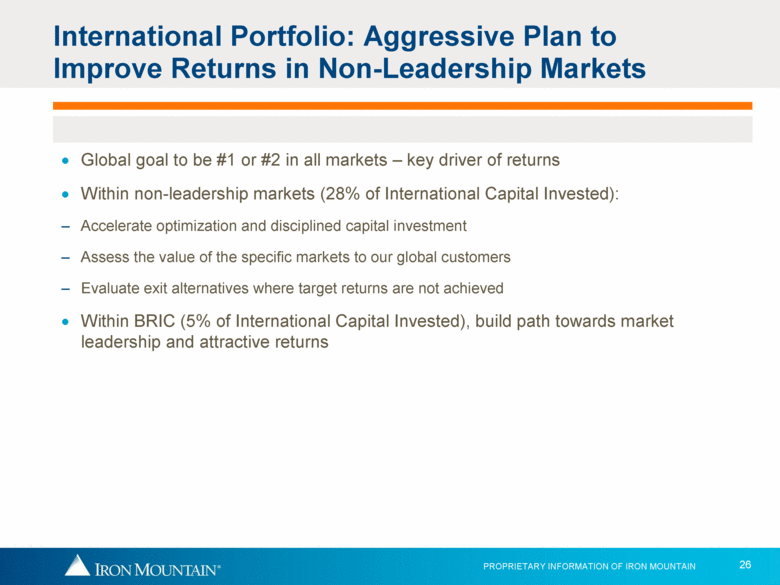
International Portfolio: Aggressive Plan to Improve Returns in Non-Leadership Markets Global goal to be #1 or #2 in all markets – key driver of returns Within non-leadership markets (28% of International Capital Invested): Accelerate optimization and disciplined capital investment Assess the value of the specific markets to our global customers Evaluate exit alternatives where target returns are not achieved Within BRIC (5% of International Capital Invested), build path towards market leadership and attractive returns |
|
|
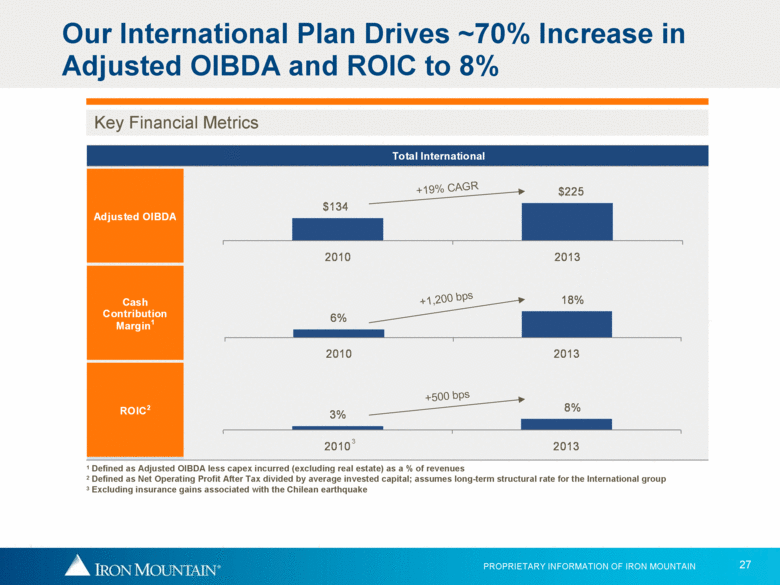
Our International Plan Drives ~70% Increase in Adjusted OIBDA and ROIC to 8% Key Financial Metrics +19% CAGR +1,200 bps +500 bps 1 Defined as Adjusted OIBDA less capex incurred (excluding real estate) as a % of revenues 2 Defined as Net Operating Profit After Tax divided by average invested capital; assumes long-term structural rate for the International group 3 Excluding insurance gains associated with the Chilean earthquake 3 Total International Adjusted OIBDA Cash Contribution Margin1 ROIC2 $134 $225 2010 2013 3% 8% 2010 2013 6% 18% 2010 2013 |
|
|
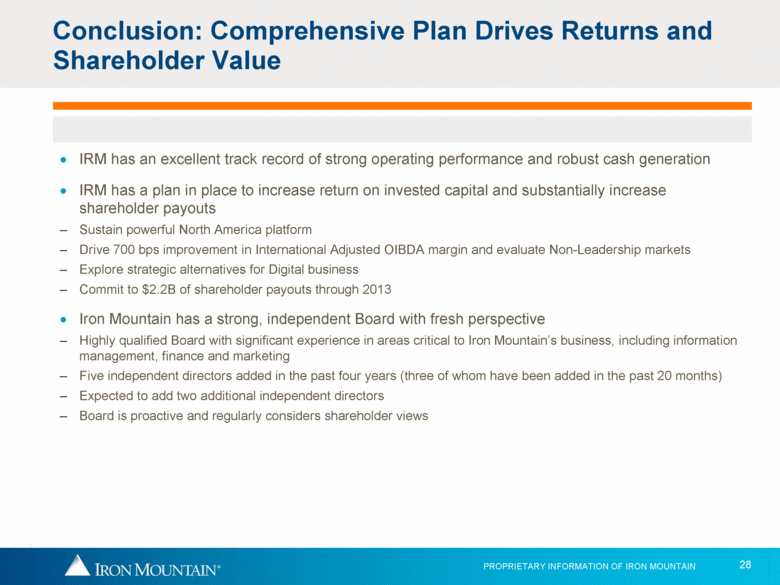
IRM has an excellent track record of strong operating performance and robust cash generation IRM has a plan in place to increase return on invested capital and substantially increase shareholder payouts Sustain powerful North America platform Drive 700 bps improvement in International Adjusted OIBDA margin and evaluate Non-Leadership markets Explore strategic alternatives for Digital business Commit to $2.2B of shareholder payouts through 2013 Iron Mountain has a strong, independent Board with fresh perspective Highly qualified Board with significant experience in areas critical to Iron Mountain’s business, including information management, finance and marketing Five independent directors added in the past four years (three of whom have been added in the past 20 months) Expected to add two additional independent directors Board is proactive and regularly considers shareholder views Conclusion: Comprehensive Plan Drives Returns and Shareholder Value |
|
|
Appendix |
|
|
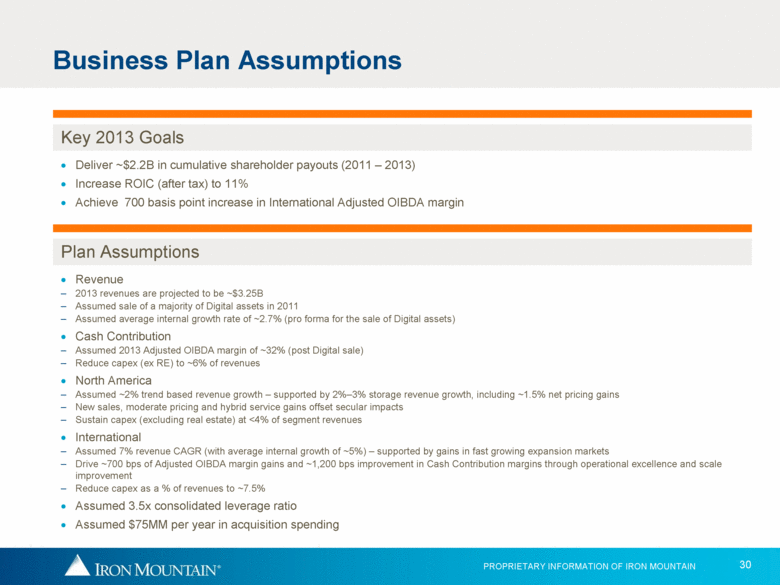
Revenue 2013 revenues are projected to be ~$3.25B Assumed sale of a majority of Digital assets in 2011 Assumed average internal growth rate of ~2.7% (pro forma for the sale of Digital assets) Cash Contribution Assumed 2013 Adjusted OIBDA margin of ~32% (post Digital sale) Reduce capex (ex RE) to ~6% of revenues North America Assumed ~2% trend based revenue growth – supported by 2%–3% storage revenue growth, including ~1.5% net pricing gains New sales, moderate pricing and hybrid service gains offset secular impacts Sustain capex (excluding real estate) at <4% of segment revenues International Assumed 7% revenue CAGR (with average internal growth of ~5%) – supported by gains in fast growing expansion markets Drive ~700 bps of Adjusted OIBDA margin gains and ~1,200 bps improvement in Cash Contribution margins through operational excellence and scale improvement Reduce capex as a % of revenues to ~7.5% Assumed 3.5x consolidated leverage ratio Assumed $75MM per year in acquisition spending Deliver ~$2.2B in cumulative shareholder payouts (2011 – 2013) Increase ROIC (after tax) to 11% Achieve 700 basis point increase in International Adjusted OIBDA margin Business Plan Assumptions Key 2013 Goals Plan Assumptions |
|
|
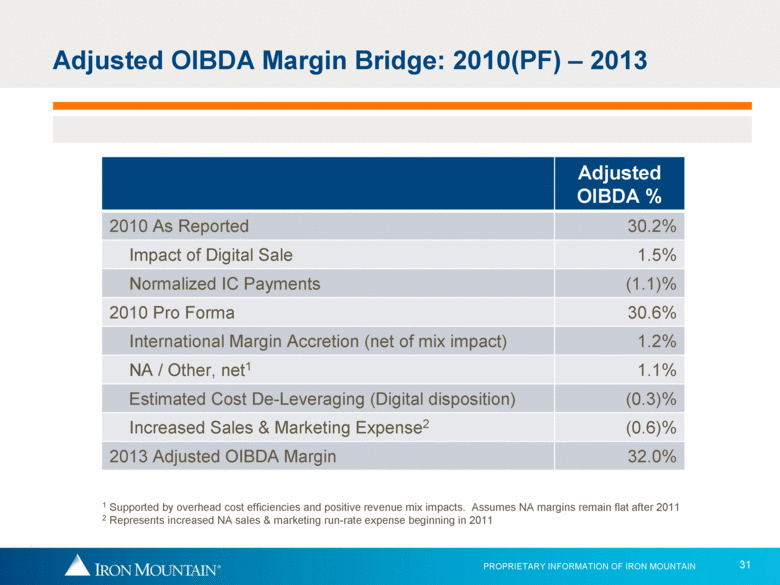
Adjusted OIBDA Margin Bridge: 2010(PF) – 2013 Adjusted OIBDA % 2010 As Reported 30.2% Impact of Digital Sale 1.5% Normalized IC Payments (1.1)% 2010 Pro Forma 30.6% International Margin Accretion (net of mix impact) 1.2% NA / Other, net1 1.1% Estimated Cost De-Leveraging (Digital disposition) (0.3)% Increased Sales & Marketing Expense2 (0.6)% 2013 Adjusted OIBDA Margin 32.0% 1 Supported by overhead cost efficiencies and positive revenue mix impacts. Assumes NA margins remain flat after 2011 2 Represents increased NA sales & marketing run-rate expense beginning in 2011 |
|
|
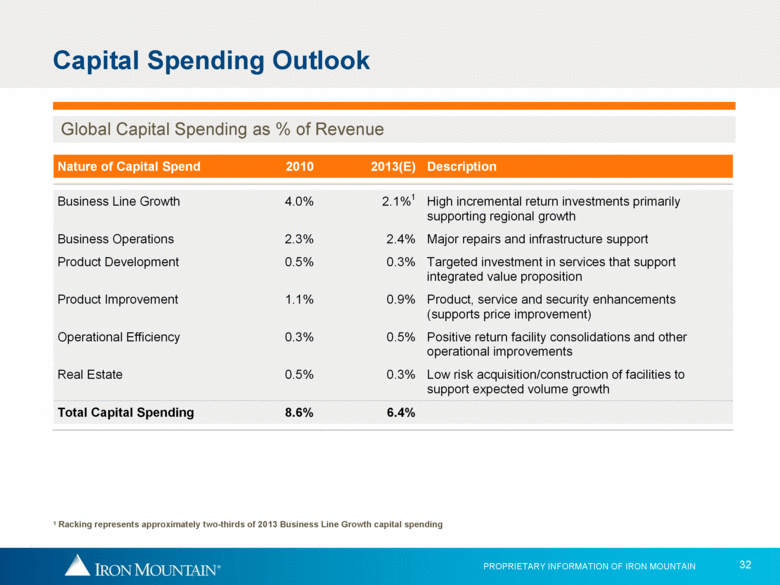
Capital Spending Outlook Global Capital Spending as % of Revenue 1 Racking represents approximately two-thirds of 2013 Business Line Growth capital spending Nature of Capital Spend 2010 2013(E) Description Business Line Growth 4.0% 2.1%1 High incremental return investments primarily supporting regional growth Business Operations 2.3% 2.4% Major repairs and infrastructure support Product Development 0.5% 0.3% Targeted investment in services that support integrated value proposition Product Improvement 1.1% 0.9% Product, service and security enhancements (supports price improvement) Operational Efficiency 0.3% 0.5% Positive return facility consolidations and other operational improvements Real Estate 0.5% 0.3% Low risk acquisition/construction of facilities to support expected volume growth Total Capital Spending 8.6% 6.4% |
|
|
Non-GAAP Measure Reconciliations |
|
|
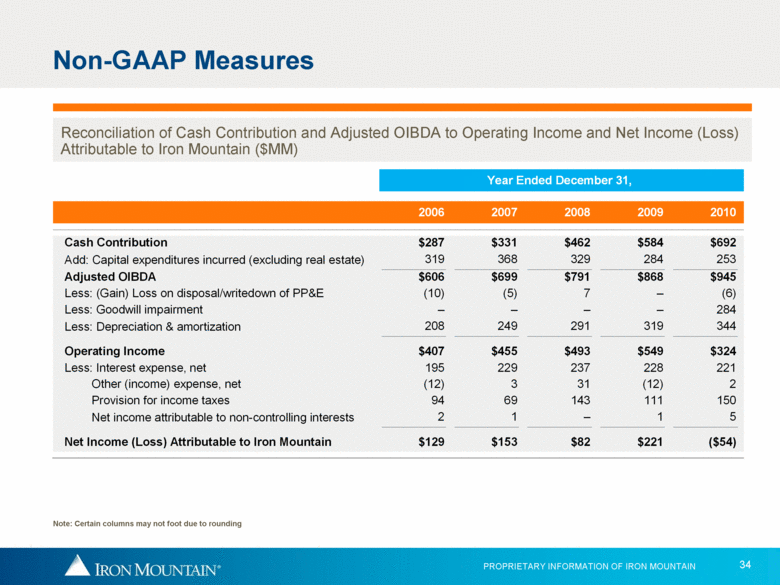
Non-GAAP Measures Note: Certain columns may not foot due to rounding Reconciliation of Cash Contribution and Adjusted OIBDA to Operating Income and Net Income (Loss) Attributable to Iron Mountain ($MM) Year Ended December 31, 2006 2007 2008 2009 2010 Cash Contribution $287 $331 $462 $584 $692 Add: Capital expenditures incurred (excluding real estate) 319 368 329 284 253 Adjusted OIBDA $606 $699 $791 $868 $945 Less: (Gain) Loss on disposal/writedown of PP&E (10) (5) 7 – (6) Less: Goodwill impairment – – – – 284 Less: Depreciation & amortization 208 249 291 319 344 Operating Income $407 $455 $493 $549 $324 Less: Interest expense, net 195 229 237 228 221 Other (income) expense, net (12) 3 31 (12) 2 Provision for income taxes 94 69 143 111 150 Net income attributable to non-controlling interests 2 1 – 1 5 Net Income (Loss) Attributable to Iron Mountain $129 $153 $82 $221 ($54) |
|
|
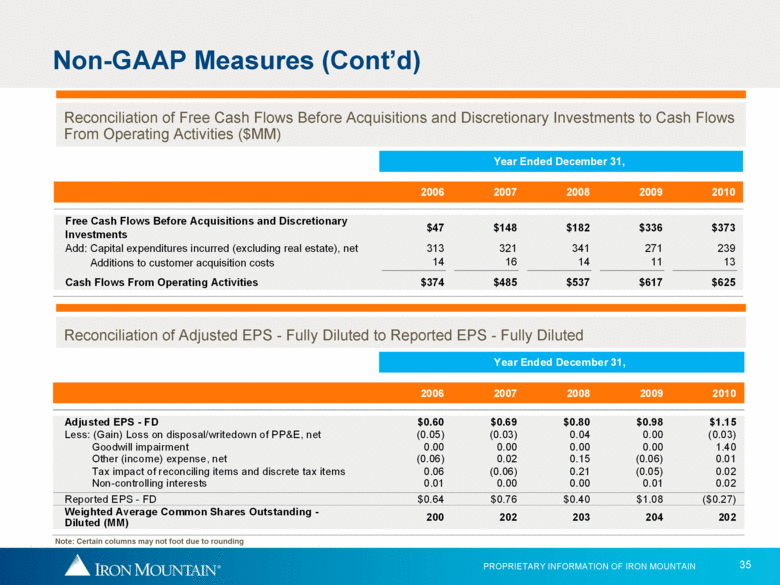
Non-GAAP Measures (Cont’d) Note: Certain columns may not foot due to rounding Reconciliation of Free Cash Flows Before Acquisitions and Discretionary Investments to Cash Flows From Operating Activities ($MM) Reconciliation of Adjusted EPS - Fully Diluted to Reported EPS - Fully Diluted Year Ended December 31, 2006 2007 2008 2009 2010 Adjusted EPS - FD $0.60 $0.69 $0.80 $0.98 $1.15 Less: (Gain) Loss on disposal/writedown of PP&E, net (0.05) (0.03) 0.04 0.00 (0.03) Goodwill impairment 0.00 0.00 0.00 0.00 1.40 Other (income) expense, net (0.06) 0.02 0.15 (0.06) 0.01 Tax impact of reconciling items and discrete tax items 0.06 (0.06) 0.21 (0.05) 0.02 Non-controlling interests 0.01 0.00 0.00 0.01 0.02 Reported EPS - FD $0.64 $0.76 $0.40 $1.08 ($0.27) Weighted Average Common Shares Outstanding - Diluted (MM) 200 202 203 204 202 Year Ended December 31, 2006 2007 2008 2009 2010 Free Cash Flows Before Acquisitions and Discretionary Investments $47 $148 $182 $336 $373 Add: Capital expenditures incurred (excluding real estate), net 313 321 341 271 239 Additions to customer acquisition costs 14 16 14 11 13 Cash Flows From Operating Activities $374 $485 $537 $617 $625 |
|
|
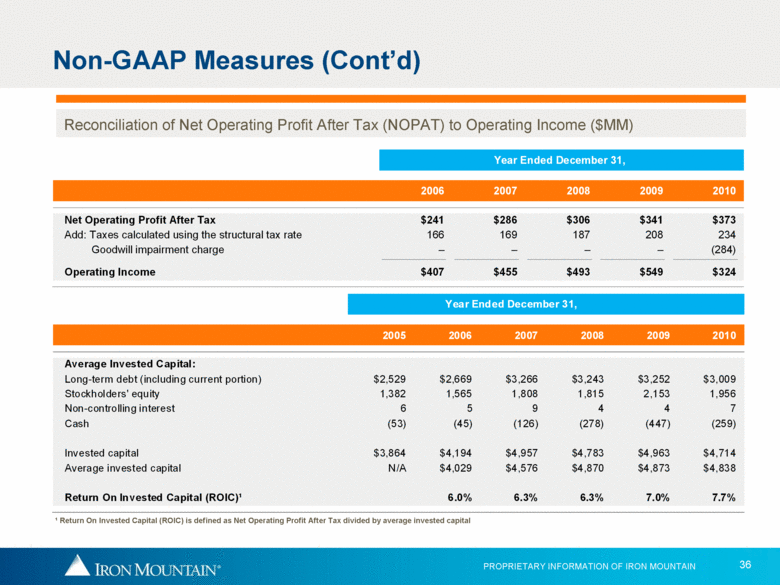
Non-GAAP Measures (Cont’d) ¹ Return On Invested Capital (ROIC) is defined as Net Operating Profit After Tax divided by average invested capital Reconciliation of Net Operating Profit After Tax (NOPAT) to Operating Income ($MM) Year Ended December 31, 2005 2006 2007 2008 2009 2010 Average Invested Capital: Long-term debt (including current portion) $2,529 $2,669 $3,266 $3,243 $3,252 $3,009 Stockholders' equity 1,382 1,565 1,808 1,815 2,153 1,956 Non-controlling interest 6 5 9 4 4 7 Cash (53) (45) (126) (278) (447) (259) Invested capital $3,864 $4,194 $4,957 $4,783 $4,963 $4,714 Average invested capital N/A $4,029 $4,576 $4,870 $4,873 $4,838 Return On Invested Capital (ROIC)¹ 6.0% 6.3% 6.3% 7.0% 7.7% Year Ended December 31, 2006 2007 2008 2009 2010 Net Operating Profit After Tax $241 $286 $306 $341 $373 Add: Taxes calculated using the structural tax rate 166 169 187 208 234 Goodwill impairment charge – – – – (284) Operating Income $407 $455 $493 $549 $324 |

