Attached files
| file | filename |
|---|---|
| 8-K - American Realty Capital Trust, Inc. | v219170_8-k.htm |
Exhibit 99.1

      American Realty Capital
405 Park Avenue
12th Floor
New York, NY 10022
_______________________
American Realty Capital
proprietary products are
securities offered through
Realty Capital Securities,
LLC (member FINRA/SIPC).
|
After more than three years of continuously and successfully raising and investing equity capital, ARCT is pleased to inform you that it will complete its current public offering on or before July 25, 2011,(1) and intends to provide a full-cycle liquidity event promptly, when it is prudent to do so, market conditions permitting. We indicated in a recent press release that the Company would be hiring bankers to evaluate strategic exit options which may include:
Exit Option
 Listing of the REIT’s common stock on a national securities exchange Listing of the REIT’s common stock on a national securities exchange
Exit Option
Sale of the assets
Exit Option
Sale or merger of the REITThe determination of when to create a liquidity event and which option is most appropriate will be made upon advice of financial advisors selected by the board of directors and after consideration of all relevant factors, including prevailing economic conditions, specific real estate and capital market circumstances, asset pricing and price risk, all with a view of achieving maximum shareholder value. American Realty Capital Advisors, LLC, the advisor, has waived any internalization fee upon listing, truly aligning its incentive payments with the value created for shareholders. In addition, in order to have supported coverage of historical distributions, the Company’s management has already waived over $12.8 million of asset management fees.
ARCT’s management will update its shareholders when there is more visibility on the timing of a liquidity event.
(1) This offering will close to new investments upon the earlier of (i) raising a total of $1.5 billion in gross proceeds, or (ii) July 25, 2011.
2010 was a great year for ARCT to invest in real estate.
ARCT continued to execute its core investment strategy in 2010, growing the size of its portfolio by 2.7 times; at year end 2010 the portfolio included 259 properties for an aggregate purchase price of $867 million, compared to 126 total assets purchased for $324 million at the end of 2009. Our investment strategy continues to be anchored on: (i) acquiring a diversified portfolio of freestanding, single tenant properties, net leased on a long-term basis primarily to investment grade tenants; and (ii) utilizing prudent amounts of fixed-rate, non-recourse, property-level financing. Our investment strategy focuses on delivering returns, reducing risk and positioning for the exit.
ARCT lives “Best Practices.”
In continuing to put our shareholders first, we have made great strides in incorporating our “Best Practices” into our Company DNA. These practices include: (i) covering and sustaining distributions from cash flow from operations; (ii) focusing on quality of assets, income and management; (iii) maintaining sector focus while diversifying our asset base; (iv) deploying capital efficiently; (v) using leverage prudently; (vi) eliminating internalization fees; (vii) crafting a defined exit strategy; (viii) fielding an experienced management team; and (ix) reporting clearly and transparently to shareholders. We believe that the entire direct investment industry, including sponsors, broker dealers, and most importantly, investors, will benefit as a result of these business principles.
|
|
EXHIBIT A
|
|
ARCT Portfolio Diversity
|
|
Data for the period ended March 31, 2011
|
|
Tenant Diversity (by Revenue) / 75.5% Investment Grade
|
|
Fed Ex
|
12.5 | % | ||
|
Walgreens
|
11.5 | % | ||
|
CVS
|
10.0 | % | ||
|
Express Scripts
|
4.5 | % | ||
|
Payless
|
4.1 | % | ||
|
Bridgestone Firestone
|
3.6 | % | ||
|
PNC
|
3.4 | % | ||
|
IHOP
|
3.4 | % | ||
|
3M
|
3.2 | % | ||
|
First Niagara
|
3.0 | % | ||
|
Home Depot
|
2.7 | % | ||
|
Reckitt Benckiser
|
2.6 | % | ||
|
Rockland
|
2.4 | % | ||
|
Texas Instruments
|
2.4 | % | ||
|
Brown Shoe
|
2.3 | % | ||
|
Kum & Go
|
2.3 | % | ||
|
Bojangles
|
2.1 | % | ||
|
Tractor Supply
|
2.0 | % | ||
|
Super Stop & Shop
|
1.9 | % | ||
|
Citigroup
|
1.8 | % | ||
|
Jack in the Box
|
1.6 | % | ||
|
DaVita Dialysis
|
1.4 | % | ||
|
Rite Aid
|
1.4 | % | ||
|
Wawa
|
1.2 | % | ||
|
Fresenius
|
1.1 | % | ||
|
Dollar General
|
1.0 | % | ||
|
Coats & Clark
|
0.9 | % | ||
|
Advance Auto
|
0.9 | % | ||
|
Walmart
|
0.9 | % | ||
|
Jared Jewelry
|
0.9 | % | ||
|
Dillons
|
0.8 | % | ||
|
Auto Zone
|
0.8 | % | ||
|
Sam’s Club
|
0.8 | % | ||
|
Saint Joseph’s Mercy
|
0.7 | % | ||
|
Kohls
|
0.7 | % | ||
|
Lowe’s
|
0.7 | % | ||
|
Chase Bank
|
0.6 | % | ||
|
Fifth Third Bank
|
0.5 | % | ||
|
Citizens
|
0.3 | % | ||
|
BB&T
|
0.3 | % | ||
|
QuikTrip
|
0.3 | % | ||
|
Provident Bank
|
0.2 | % | ||
|
O’Reilly Auto
|
0.2 | % |
Industry Diversity (by Revenue) / 43 Tenants

Geographic Diversity (by Revenue) / 39 States & U.S. territories

Letter continues on next page
American Realty Capital • 405 Park Avenue • New York, NY 10022 • www.americanrealtycap.com
ARCT has increased its property portfolio diversity while reducing its borrowings.
Our portfolio is diversified by tenancy, industry and geography, and our acquisition pipeline remains robust. As in prior years, we have been able to buy properties at attractive pricing—the average capitalization rate for the portfolio increased to 8.41% at the end of 2010, compared to 8.20% as of the end of 2009. Financing remains cheap when compared to historical norms and readily available to us. ARCT has been prudent here, locking in historically low long-term interest rates using 40% to 50% leverage on long-term assets.
ARCT continues to take advantage of favorable property pricing coupled with strong risk-adjusted returns.
The profound weakness in the U.S. and global economies, although showing moderate improvement, together with continuing low interest rates, have permitted ARCT to acquire properties at historically low prices and generate high levels of income. These factors have enabled ARCT to provide its shareholders with stable distributions. This investment solution is particularly timely given the current market conditions and the lack of higher yielding income alternatives.
We remain diversified by tenancy, industry and geography.
In acquiring single tenant, freestanding, net leased properties, we have assembled a portfolio of homogenous assets, well diversified by tenant, industry and geography. (See Exhibit A on previous page.) As of December 31, 2010, ARCT’s 259 properties were located in 39 states and U.S. territories, and leased to 28 tenants operating in 13 industry sectors. Importantly, ARCT has diversified its tenant roster and increased its exposure to strong retail credit tenants. This balanced portfolio mix, coupled with a weighted average remaining primary lease term of 15.5 years, provides investors with diversification, which we believe is durable, and positioning the portfolio for a successful near-term exit or permitting us to hold the properties until a liquidity event is profitable.
Our First Quarter 2011 acquisitions were robust.
Our acquisitions in the first quarter 2011 approached $400 million, representing approximately 80% of our total 2010 purchases. (See table below.) During 2010, we acquired 134 properties for $543.9 million, representing approximately 3.6 million square feet. During the first quarter of 2011, we greatly accelerated our purchases, acquiring 60 properties containing approximately 2.9 million square feet for an aggregate price of $393 million. These additional 2011 acquisitions have:
|
n
|
Increased number of properties to 318;
|
|
n
|
Further diversified tenant mix and industry concentration; and
|
|
n
|
Grown our rentable square feet to 8.2 million.
|
First Quarter 2011 Property Acquisitions (1) (Period ended March 31, 2011)
|
Purchase Price
|
Rentable
|
|||||||||
|
Tenant
|
Number of Properties
|
(in millions)
|
Square Feet
|
|||||||
|
Walgreens
|
12 Properties
|
$ | 69.0 | 164,292 | ||||||
|
Express Scripts
|
2 Properties
|
$ | 51.3 | 416,141 | ||||||
|
Texas Instruments
|
1 Property
|
$ | 32.0 | 125,000 | ||||||
|
Citigroup
|
1 Property
|
$ | 27.3 | 64,036 | ||||||
|
Wawa
|
2 Properties
|
$ | 17.2 | 12,433 | ||||||
|
CVS
|
3 Properties
|
$ | 16.3 | 39,463 | ||||||
|
Sam’s Club
|
1 Property
|
$ | 12.6 | 141,583 | ||||||
|
Wal-Mart
|
1 Property
|
$ | 12.6 | 183,442 | ||||||
|
3M
|
1 Property
|
$ | 44.8 | 650,760 | ||||||
|
Bojangles’
|
13 Properties
|
$ | 24.8 | 48,019 | ||||||
|
Fed Ex
|
1 Property
|
$ | 9.1 | 105,109 | ||||||
|
Citizens
|
2 Properties
|
$ | 3.8 | 14,307 | ||||||
|
Coats & Clark
|
1 Property
|
$ | 9.5 | 401,512 | ||||||
|
DaVita Dialysis
|
5 Properties
|
$ | 14.6 | 41,339 | ||||||
|
Dillons
|
2 Properties
|
$ | 11.5 | 120,706 | ||||||
|
Dollar General
|
6 Properties
|
$ | 5.2 | 55,363 | ||||||
|
Lowe’s
|
1 Property
|
$ | 10.0 | 141,393 | ||||||
|
QuikTrip
|
1 Property
|
$ | 3.3 | 4,555 | ||||||
|
Tractor Supply
|
2 Properties
|
$ | 5.1 | 38,194 | ||||||
|
Kohl’s
|
1 Property
|
$ | 10.2 | 88,408 | ||||||
|
Provident Bank
|
1 Property
|
$ | 2.6 | 2,950 | ||||||
|
Total:
|
60 Properties
|
$ | 392.8 | 2,859,005 | ||||||
|
(1)
|
The property acquisition information detailed in the above table reflects data included in the Company’s 2010 Form 10-K as filed with the Securities and Exchange Commission on March 31, 2011, and includes additional acquisitions that have occurred through March 31, 2011 which are attached to the Form 8-K as filed with the Securities and Exchange Commission on April 20, 2011.
|
American Realty Capital • 405 Park Avenue • New York, NY 10022 • www.americanrealtycap.com
We continue to utilize low leverage and source financing that is well priced.
ARCT’s portfolio debt level is 43% loan-to-cost as of December 31, 2010, down from 57% at the end of 2009 and comfortably below the leverage target for the property portfolio of 50%. Attractive debt financing continues to be available in today’s market, and such borrowings continue to be significantly accretive to the portfolio’s cash flows and investor returns. During the fourth quarter, we encumbered 42 properties with $88.2 million of secured, fixed-rate debt at a weighted average 5.0% interest rate. As of year-end 2010, the weighted average interest rate on the entire portfolio was 5.73% and the average maturity was 6.1 years. (See Exhibit B.) Our financially strong tenants, operating durable business models, continue to attract considerable lender interest in today’s challenging economic environment. We are able to obtain favorable financing rates in exchange for lower leverage loans (i.e., 50% or less), further supporting distribution coverage.
ARCT maintains two separate secured revolving credit facilities with availability of $60 million at LIBOR plus 3.25%. We believe this to be cost effective borrowing that will further assist in accretive acquisitions.
EXHIBIT B
Cost of Debt Financing Remains Low
Weighted average interest rate (quarter over quarter)

Our investment strategy focuses on delivering returns, reducing risk and positioning for the exit.
Our investment strategy is designed with the intent to support and grow shareholder distributions, reduce risk and allow for a seamless liquidity event. Our portfolio is constructed with the following key attributes:
Portfolio highlights
|
Inception-to-Date:
|
||||||||
|
Dec. 31, 2010
|
Mar. 31, 2011
|
|||||||
|
Total Assets (Base Purchase Price)
|
$ | 867 Million | $ | 1.3 Billion | ||||
|
Capital Raised (1)
|
$ | 641 Million | $ | 932 Million | ||||
|
Number of Properties
|
259 | 318 | ||||||
|
States and U.S. territories
|
39 | 39 | ||||||
|
Square Feet
|
5.3 Million | 8.2 Million | ||||||
|
Number of Tenants
|
28 | 43 | ||||||
|
Capitalization Rate (Weighted Average)
|
8.41 | % | 8.21 | % | ||||
|
Average Remaining Lease Terms
|
15.5 Years
|
14.8 Years
|
||||||
|
Percent Investment Grade Tenants (2)
|
73 | % | 76 | % | ||||
|
Leverage Ratio
|
42.7 | % | 42.9 | % | ||||
|
Average Mortgage Interest Rate
|
5.73 | % | 5.44 | % | ||||
|
(1)
|
Amount includes gross proceeds raised through the issuance of common shares, exchange transactions and our Company-sponsored note program.
|
|
(2)
|
6.92% of the 73% for the year ended December 31, 2010, is attributable to annualized rental income generated by 18 properties whose lease payments are guaranteed by Bridgestone Retail Operations, LLC. For reporting purposes we use the rating for the non-guarantor parent, Bridgestone Corporation (S&P BBB+ rated), as Bridgestone Retail, a wholly-owned subsidiary that makes up less than 50% of the parent’s assets, is not rated and it does not qualify as “investment grade” as defined in the Prospectus.
|
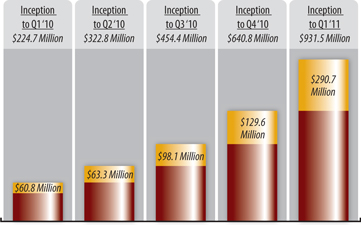
We raised significantly more equity in 2010.
As of December 31, 2010, ARCT has raised total equity proceeds of approximately $641 million, with $188.4 million or 30% of this amount raised during the fourth quarter. (See Exhibit C.)
EXHIBIT C
Capital Raising Continues to Grow Dramatically (1)
|
(1)
|
Amount includes gross proceeds raised through the issuance of common shares, exchange transactions and our Company-sponsored note program.
|
Letter continues on next page
American Realty Capital • 405 Park Avenue • New York, NY 10022 • www.americanrealtycap.com
We have adopted “Best Practices” to ensure our shareholders come first.
American Realty Capital (“ARC”), the Sponsor, has adopted a number of Best Practices and embraced these same ideals across all of our externally managed products, including American Realty Capital Trust. These Best Practices include:
|
n
|
Defined Exit Strategy – The determination of when a portfolio should be sold, listed or otherwise disposed of should be made after consideration of all relevant factors, including prevailing economic conditions and specific real estate market circumstances, with a view to achieving maximum capital appreciation with the lowest possible risk. A well-planned exit strategy is the linchpin of our real estate investment strategy. The portfolio must be well assembled and appropriately sized to optimize the exit.
|
|
n
|
Investment Focus/Diversification – Sponsors must maintain a disciplined approach to acquiring real estate and create a diversified portfolio. In maintaining a robust pipeline, the management must be sure not to deviate or “style-drift” from the stated investment goals.
|
|
n
|
Experienced Management Team – The track record and experience of the management team must instill confidence in investors. The management team must be able to deploy capital efficiently and effectively into accretive investments consistent with the investment strategy, while maintaining a full pipeline of acquisitions throughout the investment cycle.
|
|
n
|
Distribution Coverage – While this seems fundamental, historically non-traded REITs have paid distributions from capital raised or from borrowings, rather than from property level cash flows. ARC intends that all of its sponsored companies will pay distributions entirely from cash flows from operations as adjusted for certain items.
|
|
n
|
Distribution Sustainability – Now more than ever sustainable and dependable cash flows matter to today’s investor. FINRA issued Regulatory Notice 09-09, which clearly discussed the responsibility of firms to consider the, “composition of a real estate investment program’s dividend distributions,” and whether distribution levels are sustainable over the long-term.
|
|
n
|
Capital Deployment – Management must be relentlessly efficient in deploying the REIT’s capital, matching quarterly acquisitions closely with its equity raising efforts.
|
|
n
|
Use of Leverage – The use of prudent leverage supports portfolio cash flows and distribution coverage by using a highly accretive source of debt capital. By structuring fixed-rate, non-recourse financing, investors are assured of improved risk-adjusted returns.
|
|
n
|
Reporting and Transparency – An experienced institutional management team which oversees day-to-day operations must adopt a philosophy of full, clear and regular disclosure and transparency.
|
|
n
|
Continuing Due Diligence – In addition to initial due diligence, ongoing due diligence reviews are equally important. These continuing evaluations act in the same manner as a “report card,” and can be used to gauge performance over time. Additionally, ongoing portfolio examination will determine if management is acting consistent with the announced investment strategy.
|
|
n
|
Alignment of Interests – Quality of assets, quality of income and quality of management are the most important factors when selecting any investment. However, even with the soundest investment strategy and most experienced management team, management’s interests must be aligned closely with those of its investors. In order to make an informed investment decision, investors must understand how, when and under what circumstances managers are compensated. We believe management should be rewarded for performance, after the investor has received a return of capital and a fair return on capital for the risk assumed. Outsized and highly questionable “internalization fees” have long provided a rich “pay-day” for management teams, many of whom have additionally collected hefty annual advisory fees. ARCT has kept its fees low and waived this internalization fee, and linked management’s pay to performance.
|
In Conclusion
ARCT has been thoughtfully designed as a durable real estate investment program which intends to provide its investors current income generated from a portfolio of properties leased to strong credit tenants subject to long-term leases. Growth and tax efficiency are potential attributes of this investment, providing investors inflation protection, strong after tax yields and durable income. We have always placed our shareholders first, and you may be assured we will continue to do so.
We would like to thank not only our very talented acquisitions and financing teams, but also our investors and advisors that helped make our growth aspirations a reality.
Sincerely,
 |
 |
|
Nicholas S. Schorsch
|
William M. Kahane
|
|
Chairman & CEO
|
President & COO
|
American Realty Capital • 405 Park Avenue • New York, NY 10022 • www.americanrealtycap.com
AMERICAN REALTY CAPITAL TRUST, INC.
CONSOLIDATED BALANCE SHEETS
|
(In thousands, except share and per share data)
|
||||||||
|
December 31,
|
||||||||
|
2010
|
2009
|
|||||||
|
ASSETS
|
||||||||
|
Real estate investments, at cost:
|
||||||||
|
Land
|
$ | 142,401 | $ | 37,779 | ||||
|
Buildings, fixtures and improvements
|
631,999 | 261,939 | ||||||
|
Acquired intangible lease assets
|
108,193 | 38,838 | ||||||
|
Total real estate investments, at cost
|
882,593 | 338,556 | ||||||
|
Less accumulated depreciation and amortization
|
(32,777 | ) | (11,292 | ) | ||||
|
Total real estate investments, net
|
849,816 | 327,264 | ||||||
|
Cash and cash equivalents
|
31,985 | 5,010 | ||||||
|
Restricted cash
|
90 | 43 | ||||||
|
Prepaid expenses and other assets
|
12,049 | 4,458 | ||||||
|
Investment in joint venture with affiliate
|
11,945 | — | ||||||
|
Deferred financing costs, net
|
8,169 | 2,502 | ||||||
|
Total assets
|
$ | 914,054 | $ | 339,277 | ||||
|
LIABILITIES AND EQUITY
|
||||||||
|
Short-term bridge funds
|
$ | — | $ | 15,878 | ||||
|
Mortgage notes payable
|
372,755 | 183,811 | ||||||
|
Mortgage premium, net
|
1,163 | — | ||||||
|
Long-term notes payable
|
12,790 | 13,000 | ||||||
|
Below-market lease liabilities, net
|
8,454 | 9,085 | ||||||
|
Derivatives, at fair value
|
5,214 | 2,768 | ||||||
|
Accounts payable and accrued expenses
|
3,638 | 1,536 | ||||||
|
Deferred rent and other liabilities
|
3,858 | 1,144 | ||||||
|
Distributions payable
|
3,518 | 1,499 | ||||||
|
Total liabilities
|
411,390 | 228,721 | ||||||
|
Preferred stock, $0.01 par value; 10,000,000 shares authorized, none issued and outstanding
|
— | — | ||||||
|
Common stock, $0.01 par value; 240,000,000 shares authorized, 61,824,238 and
|
||||||||
|
14,672,237 shares issued and outstanding at December 31, 2010 and 2009, respectively
|
618 | 147 | ||||||
|
Additional paid-in capital
|
529,740 | 122,506 | ||||||
|
Accumulated other comprehensive loss
|
(3,878 | ) | (1,737 | ) | ||||
|
Accumulated deficit
|
(46,464 | ) | (13,669 | ) | ||||
|
Total American Realty Capital Trust, Inc. equity
|
480,016 | 107,247 | ||||||
|
Noncontrolling interests
|
22,648 | 3,309 | ||||||
|
Total equity
|
502,664 | 110,556 | ||||||
|
Total liabilities and equity
|
$ | 914,054 | $ | 339,277 | ||||
American Realty Capital • 405 Park Avenue • New York, NY 10022 • www.americanrealtycap.com
AMERICAN REALTY CAPITAL TRUST, INC.
CONSOLIDATED STATEMENTS OF OPERATIONS
|
(In thousands, except share and per share data)
|
||||||||||||
|
Year Ended December 31,
|
||||||||||||
|
2010
|
2009
|
2008
|
||||||||||
|
Rental income
|
$ | 44,773 | $ | 14,964 | $ | 5,546 | ||||||
|
Expenses:
|
||||||||||||
|
Fees to affiliate
|
1,350 | 145 | 4 | |||||||||
|
Acquisition and transaction related
|
12,471 | 506 | — | |||||||||
|
General and administrative
|
1,444 | 507 | 380 | |||||||||
|
Depreciation and amortization
|
21,654 | 8,315 | 3,056 | |||||||||
|
Total operating expenses
|
36,919 | 9,473 | 3,440 | |||||||||
|
Operating income
|
7,854 | 5,491 | 2,106 | |||||||||
|
Other income (expenses):
|
||||||||||||
|
Interest expense
|
(18,109 | ) | (10,352 | ) | (4,774 | ) | ||||||
|
Other income
|
220 | 51 | 3 | |||||||||
|
Gains (losses) on derivative instruments
|
(305 | ) | 495 | (1,618 | ) | |||||||
|
Gain on disposition of property
|
143 | — | — | |||||||||
|
Gains on sales to non-controlling interest holders, net of taxes
|
545 | — | — | |||||||||
|
Total other income (expenses)
|
(17,506 | ) | (9,806 | ) | (6,389 | ) | ||||||
|
Net loss
|
(9,652 | ) | (4,315 | ) | (4,283 | ) | ||||||
|
Net income (loss) attributable to non-controlling interests
|
(181 | ) | 49 | — | ||||||||
|
Net loss attributable to American Realty Capital Trust, Inc.
|
$ | (9,833 | ) | $ | (4,266 | ) | $ | (4,283 | ) | |||
|
Basic and diluted weighted average common shares outstanding
|
32,539,393 | 5,768,761 | 711,524 | |||||||||
|
Basic and diluted loss per share
|
$ | (0.31 | ) | $ | (0.74 | ) | $ | (6.02 | ) | |||
American Realty Capital • 405 Park Avenue • New York, NY 10022 • www.americanrealtycap.com
AMERICAN REALTY CAPITAL TRUST, INC.
CONSOLIDATED STATEMENTS OF CASH FLOWS
|
(In thousands)
|
||||||||||||
|
Year Ended December 31,
|
||||||||||||
|
2010
|
2009
|
2008
|
||||||||||
|
Cash flows from operating activities:
|
||||||||||||
|
Net loss
|
$ | (9,652 | ) | $ | (4,315 | ) | $ | (4,283 | ) | |||
|
Adjustments to reconcile net loss to net cash provided by (used in) operating activities:
|
||||||||||||
|
Depreciation
|
17,280 | 6,661 | 2,534 | |||||||||
|
Amortization of intangibles
|
4,374 | 1,654 | 522 | |||||||||
|
Amortization of deferred finance costs
|
1,158 | 562 | 135 | |||||||||
|
Amortization of restricted share grants
|
431 | — | — | |||||||||
|
Accretion of below-market lease liability
|
(311 | ) | (315 | ) | (26 | ) | ||||||
|
Gain on disposition of property
|
(143 | ) | — | — | ||||||||
|
loss (gain) on derivative instruments
|
305 | (495 | ) | 1,618 | ||||||||
|
Gains on sales to non-controlling interest holders
|
(778 | ) | — | — | ||||||||
|
Changes in assets and liabilities:
|
||||||||||||
|
Prepaid expenses and other assets
|
(7,616 | ) | (4,236 | ) | (302 | ) | ||||||
|
Accounts payable and accrued expenses
|
2,102 | (181 | ) | 1,095 | ||||||||
|
Due to affiliated entity
|
— | (2,223 | ) | 1,938 | ||||||||
|
Deferred rent and other liabilities
|
2,714 | 362 | 782 | |||||||||
|
Net cash provided by (used in) operating activities
|
9,864 | (2,526 | ) | 4,013 | ||||||||
|
Cash flows from investing activities:
|
||||||||||||
|
Investment in real estate and other assets
|
(543,893 | ) | (173,786 | ) | (97,456 | ) | ||||||
|
Investment in joint venture with affiliate
|
(12,000 | ) | — | |||||||||
|
Proceeds from disposition of real estate and other assets
|
757 | — | — | |||||||||
|
Net cash used in investing activities
|
(555,136 | ) | (173,786 | ) | (97,456 | ) | ||||||
|
Cash flows from financing activities:
|
||||||||||||
|
Proceeds from mortgage notes payable
|
217,827 | 72,084 | 62,311 | |||||||||
|
Payments on mortgage notes payable
|
(28,883 | ) | (1,016 | ) | (343 | ) | ||||||
|
Proceeds from line of credit
|
13,448 | — | — | |||||||||
|
Payments on line of credit
|
(13,448 | ) | — | — | ||||||||
|
Proceeds from related party facility bridge and revolver
|
— | 12,268 | 14,977 | |||||||||
|
Payments on related party facility bridge and revolver
|
— | (27,245 | ) | — | ||||||||
|
Proceeds from short-term bridge funds
|
— | 15,878 | 8,000 | |||||||||
|
Payments on short-term bridge funds
|
(15,878 | ) | (11,954 | ) | — | |||||||
|
Proceeds from issuance of convertible redeemable preferred
|
— | — | 3,995 | |||||||||
|
Payments on convertible redeemable preferred
|
— | (3,995 | ) | — | ||||||||
|
Proceeds from long-term notes payable
|
— | 11,911 | 1,090 | |||||||||
|
Payment on long-term notes payable
|
(210 | ) | — | — | ||||||||
|
Contributions from non-controlling interest holders
|
21,003 | 3,458 | — | |||||||||
|
Distributions to non-controlling interest holders
|
(1,067 | ) | (100 | ) | — | |||||||
|
Proceeds from issuance of common stock, net
|
400,916 | 112,102 | 6,769 | |||||||||
|
Payments of deferred financing costs
|
(6,827 | ) | (1,073 | ) | (2,125 | ) | ||||||
|
Distributions paid
|
(11,626 | ) | (1,888 | ) | (296 | ) | ||||||
|
Redemptions paid
|
(2,961 | ) | — | — | ||||||||
|
Restricted cash
|
(47 | ) | 5 | (48 | ) | |||||||
|
Net cash provided by financing activities
|
572,247 | 180,435 | 94,330 | |||||||||
|
Net increase in cash and cash equivalents
|
26,975 | 4,123 | 887 | |||||||||
|
Cash and cash equivalents, beginning of period
|
5,010 | 887 | — | |||||||||
|
Cash and cash equivalents, end of period
|
$ | 31,985 | $ | 5,010 | $ | 887 | ||||||
American Realty Capital • 405 Park Avenue • New York, NY 10022 • www.americanrealtycap.com

INVESTOR INQUIRIES
For more information on American Realty Capital Trust, Inc., please
contact your financial professional.
Realty Capital Securities, LLC (Member FINRA, SIPC), is the dealer
manager for American Realty Capital Trust, Inc., an affiliate.
www.americanrealtycap.com/arct-reit/
The financial statements included herein should be read in connection with reviewing American Realty Capital Trust, Inc.’s current Prospectus and Form 10-K as of and for the quarterly period ended December 31, 2010 (filed with the Securities and Exchange Commission on March 31, 2011) and the Form 8-K as filed with the Securities and Exchange Commission on April 20, 2011.
This Is A Shareholder Communication.
Not For Use As Sales Material