Attached files
| file | filename |
|---|---|
| 8-K - FORM 8-K - HOLLY ENERGY PARTNERS LP | c15653e8vk.htm |
Exhibit 99.1
| Holly Energy Partners, L.P. American Association of Individual Investors Silicon Valley Chapter April 2011 |

| Safe Harbor Disclosure Statement 2 Statements made during the course of this presentation that are not historical facts are "forward- looking statements" within the meaning of the U.S. Private Securities Litigation Reform Act of 1995 including, but not limited to, statements identified by the words "anticipate," "believe," "expect," "estimate,", "plan," "intend," "will," and "forecast," and similar expressions and statements regarding our business strategy, plans and objectives for future operations. Forward-looking statements are inherently uncertain and necessarily involve risks that may affect our business prospects and performance, and actual results may differ materially from those discussed during the presentation. Such risks and uncertainties include but are not limited to risks and uncertainties with respect to the future performance of the pipelines and terminals, the actions of actual or potential competitive suppliers and transporters of refined petroleum products in our markets and the markets of Holly Corporation and Alon USA, the demand for and supply of crude oil and refined products, the spread between market prices for refined products and market prices for crude oil, the possibility of constraints on the transportation of refined products, the possibility of inefficiencies or shutdowns in refinery operations or pipelines, effects of governmental regulations and policies, the availability and cost of financing, the effectiveness of capital investments and marketing and acquisition strategies, our ability to complete announced acquisition transactions, the possibility of terrorist attacks and the consequences of any such attacks, and general economic conditions. Also please see additional information on risks and uncertainties that could affect the business prospects and performance of Holly Energy Partners which is provided in our reports filed with the Securities and Exchange Commission from time to time. All forward-looking statements included in this presentation are expressly qualified in their entirety by the foregoing cautionary statements. Holly Energy Partners undertakes no obligation to publicly update or revise any forward-looking statements, whether as a result of new information, future events or otherwise. |

| Holly Energy Partners Investment Highlights Holly Energy Partners Investment Highlights 3 |
| Presentation Topics HEP IPO Formation & Asset History Growth Approach / Orientation Low Risk Profile Parent Sponsor: Holly Corporation Growth Opportunities Key Strengths 4 |
| HEP Formation 2004: IPO Detail 5 HEP formed in 2004 as an Initial Public Offering sponsored by Holly. 49% of common units sold to public holders Holly retained 49% ownership of common units Holly became 2% General Partner owner |
| HEP Formation 2004: Rationale for formation 6 Holly Corporation (NYSE:HOC) had built significant logistic assets (pipelines, terminals & loading rack facilities) to support its Southwest U.S. refining business Holly knew the value of this business would not be fully recognized & appreciated by Wall Street investors as it played only a support role for Holly & was not a separate standalone business Refining business tends to be cyclical & volatile Logistics businesses (pipelines & terminals) tend to be more steady & stable Because of these differences, the logistics business-if standalone-would likely command a higher valuation by Wall Street investors if separated from the volatile refining business. Holly IPO'd HEP in July 2004 to achieve better value recognition & create a better holding entity for these logistics assets. |
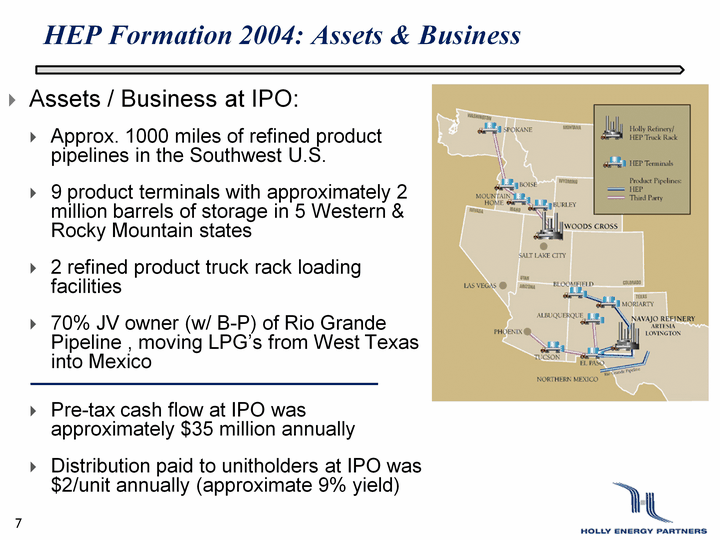
| HEP Formation 2004: Assets & Business 7 Assets / Business at IPO: Approx. 1000 miles of refined product pipelines in the Southwest U.S. 9 product terminals with approximately 2 million barrels of storage in 5 Western & Rocky Mountain states 2 refined product truck rack loading facilities 70% JV owner (w/ B-P) of Rio Grande Pipeline , moving LPG's from West Texas into Mexico Pre-tax cash flow at IPO was approximately $35 million annually Distribution paid to unitholders at IPO was $2/unit annually (approximate 9% yield) |
| Growth 8 |
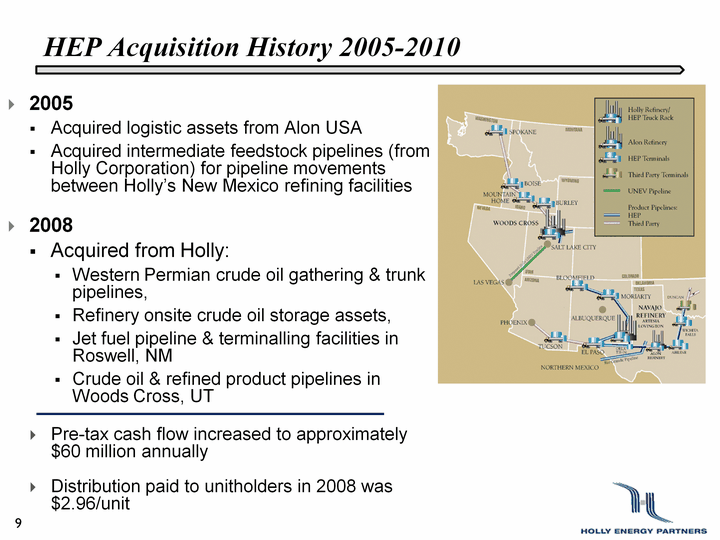
| HEP Acquisition History 2005-2010 9 2005 Acquired logistic assets from Alon USA Acquired intermediate feedstock pipelines (from Holly Corporation) for pipeline movements between Holly's New Mexico refining facilities 2008 Acquired from Holly: Western Permian crude oil gathering & trunk pipelines, Refinery onsite crude oil storage assets, Jet fuel pipeline & terminalling facilities in Roswell, NM Crude oil & refined product pipelines in Woods Cross, UT Pre-tax cash flow increased to approximately $60 million annually Distribution paid to unitholders in 2008 was $2.96/unit |
| HEP Acquisition History 2005-2010 10 2009 Acquired 25% JV interest in SLC Pipeline, LLC, a crude oil transportation pipeline with Plains, (NYSE:PAA), as 75% JV partner Acquired 16" Intermediate Pipeline from Holly Corporation providing additional pipeline capacity from Lovington, NM to Artesia, NM refinery facilities Acquired Loading Rack Facilities at Holly's Tulsa Refinery Acquired Roadrunner & Beeson Pipelines from Holly Corporation to deliver crudes from Cushing, OK to Holly's New Mexico refining facilities Acquired Sinclair Refining, Tulsa, OK, tankage and logistics assets along with Holly's purchase of Sinclair's Refining assets 2010 Acquired petroleum storage tanks and rail loading rack facilities at Holly's Tulsa refinery site and an asphalt truck loading rack at Holly's Lovington, NM, facility |

| HEP Assets: Current Footprint -- 2011 Over 1,500 miles of product pipelines Over 900 miles of crude gathering and trunk pipelines Approximately 6.1 million bbls of refined product and crude oil storage 11 Terminals & 8 loading rack facilities in 7 Western and Mid- continent states 25% Joint Venture interest SLC Pipeline, LLC-a crude oil pipeline moving crude into the Salt Lake City area 11 Pre-tax cash flow at approx. $135 million annually Distribution paid to unitholders in 2010 was $3.28/unit |
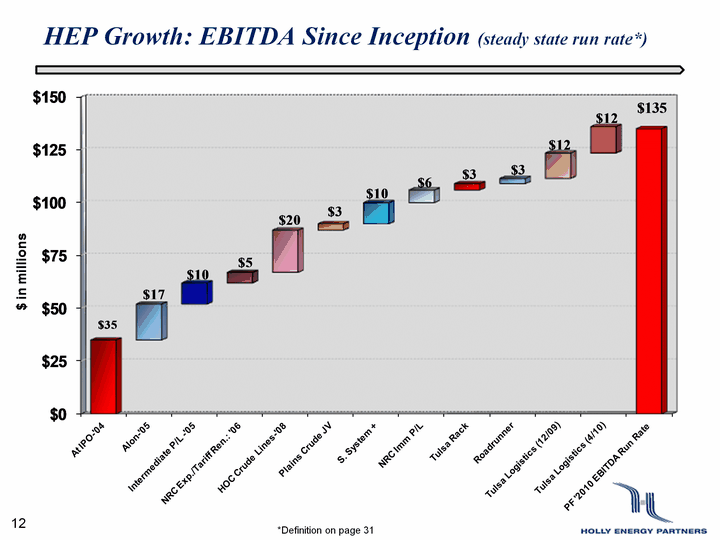
| HEP Growth: EBITDA Since Inception (steady state run rate*) 12 *Definition on page 31 |
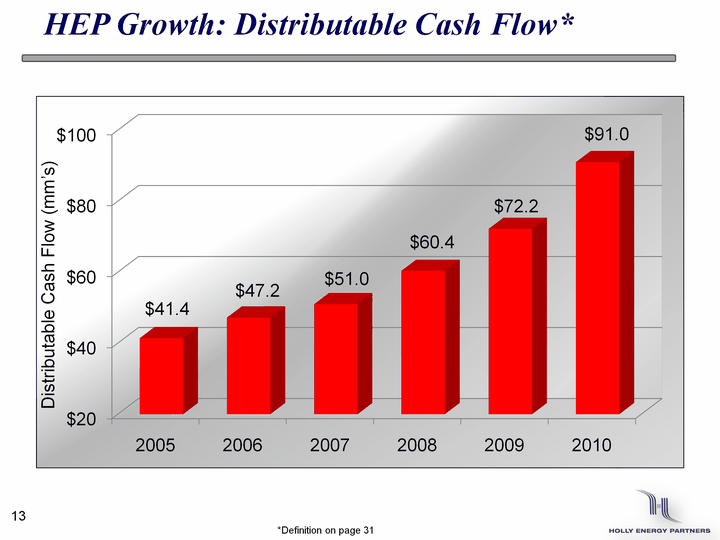
| 13 HEP Growth: Distributable Cash Flow* (CHART) Distributable Cash Flow (mm's) *Definition on page 31 |
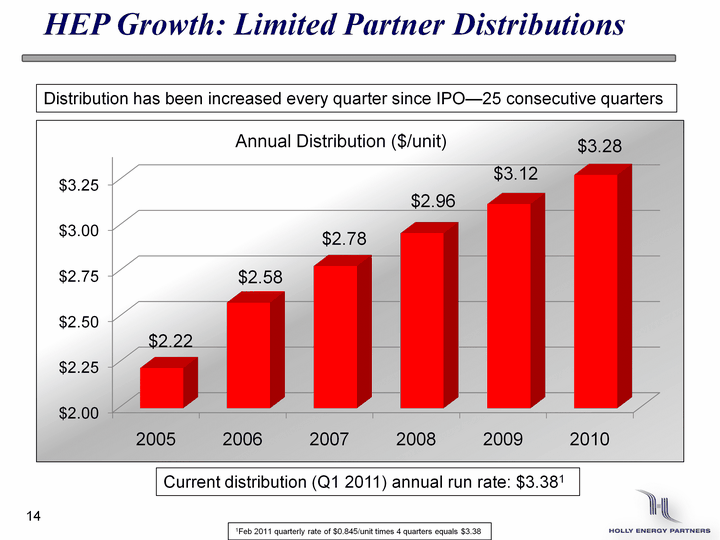
| 14 HEP Growth: Limited Partner Distributions (CHART) Annual Distribution ($/unit) Distribution has been increased every quarter since IPO-25 consecutive quarters Current distribution (Q1 2011) annual run rate: $3.381 1Feb 2011 quarterly rate of $0.845/unit times 4 quarters equals $3.38 |

| U.S. Population Growth By State (2000 - 2010) Traditionally High Growth, Niche Markets States served by HEP are among the fastest growing in the country UNEV project to provide greater access to Nevada and southern Utah markets Source: U.S. Census Bureau. Reflects 2010 Census Results. 15 |
| Low Risk Profile / Orientation 16 |
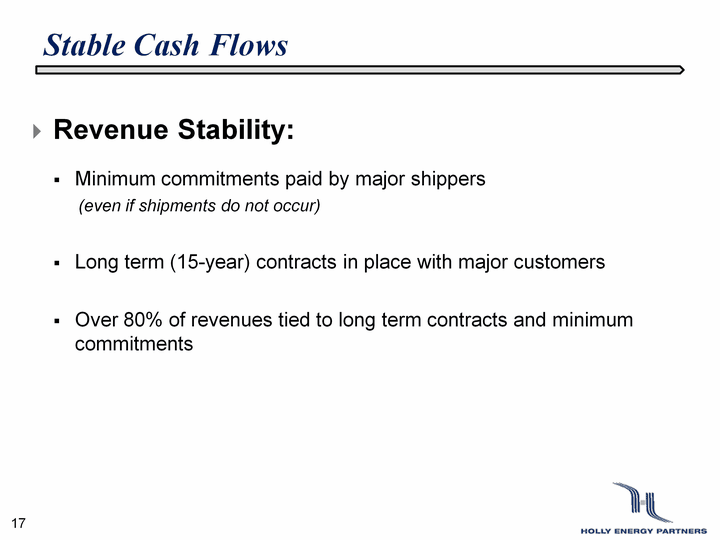
| Stable Cash Flows Revenue Stability: Minimum commitments paid by major shippers (even if shipments do not occur) Long term (15-year) contracts in place with major customers Over 80% of revenues tied to long term contracts and minimum commitments 17 |

| No Commodity Risk No Commodity Risk: 100% fee based revenue stream HEP owns no inventories-no inventory price risk No commodity ownership risk or hedging necessary 18 |
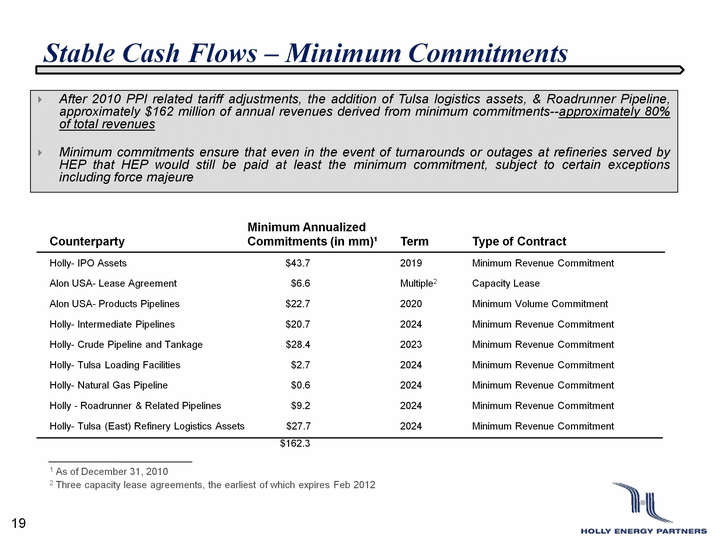
| Stable Cash Flows - Minimum Commitments After 2010 PPI related tariff adjustments, the addition of Tulsa logistics assets, & Roadrunner Pipeline, approximately $162 million of annual revenues derived from minimum commitments--approximately 80% of total revenues Minimum commitments ensure that even in the event of turnarounds or outages at refineries served by HEP that HEP would still be paid at least the minimum commitment, subject to certain exceptions including force majeure 1 As of December 31, 2010 2 Three capacity lease agreements, the earliest of which expires Feb 2012 19 Minimum Annualized Counterparty Commitments (in mm)1 Term Type of Contract Holly- IPO Assets $43.7 2019 Minimum Revenue Commitment Alon USA- Lease Agreement $6.6 Multiple2 Capacity Lease Alon USA- Products Pipelines $22.7 2020 Minimum Volume Commitment Holly- Intermediate Pipelines $20.7 2024 Minimum Revenue Commitment Holly- Crude Pipeline and Tankage $28.4 2023 Minimum Revenue Commitment Holly- Tulsa Loading Facilities $2.7 2024 Minimum Revenue Commitment Holly- Natural Gas Pipeline $0.6 2024 Minimum Revenue Commitment Holly - Roadrunner & Related Pipelines $9.2 2024 Minimum Revenue Commitment Holly- Tulsa (East) Refinery Logistics Assets $27.7 2024 Minimum Revenue Commitment $162.3 |
| Relationship w/ Parent Sponsor--Holly 20 |
| Strategic Relationship with Holly Corp HEP's assets are integral to Holly Corp's refineries Currently Holly Corp owns 32% of the MLP through a limited partner interest and 2% through a general partner interest HEP generally has right of first refusal on all logistics assets Holly acquires or builds 21 |
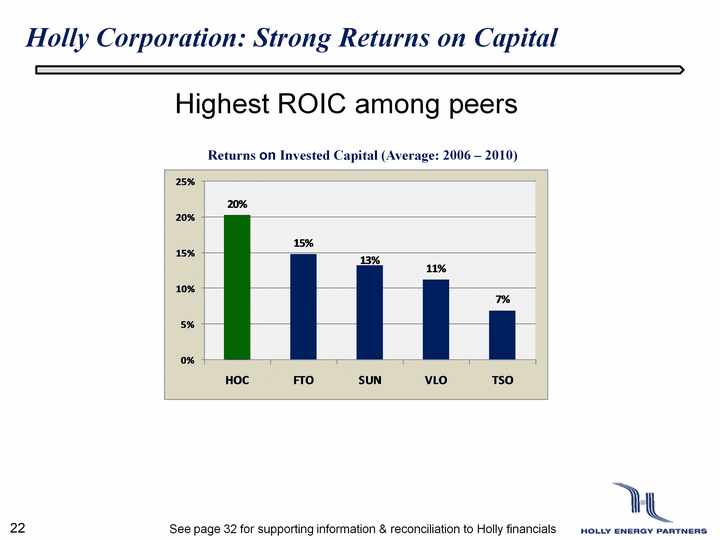
| Holly Corporation: Strong Returns on Capital 22 Highest ROIC among peers 3 4 4 See page 32 for supporting information & reconciliation to Holly financials |
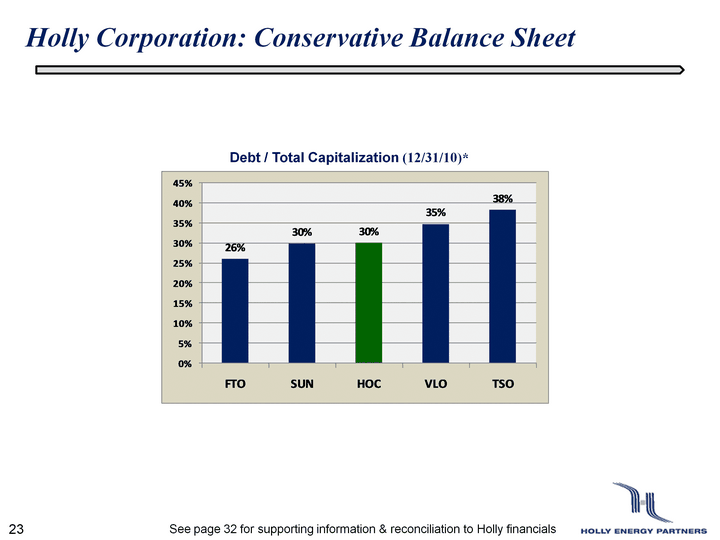
| Holly Corporation: Conservative Balance Sheet 23 3 See page 32 for supporting information & reconciliation to Holly financials |
| Future Growth Opportunities 24 |
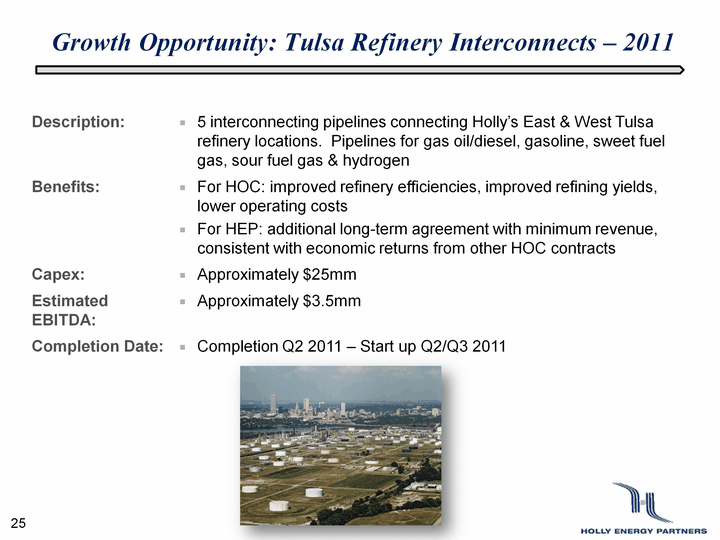
| Growth Opportunity: Tulsa Refinery Interconnects - 2011 Description: 5 interconnecting pipelines connecting Holly's East & West Tulsa refinery locations. Pipelines for gas oil/diesel, gasoline, sweet fuel gas, sour fuel gas & hydrogen Benefits: For HOC: improved refinery efficiencies, improved refining yields, lower operating costsFor HEP: additional long-term agreement with minimum revenue, consistent with economic returns from other HOC contracts Capex: Approximately $25mm Estimated EBITDA: Approximately $3.5mm Completion Date: Completion Q2 2011 - Start up Q2/Q3 2011 25 |
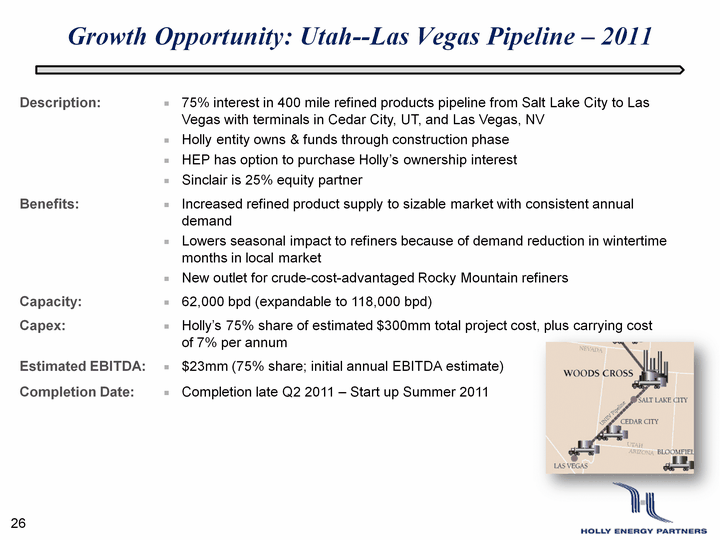
| Growth Opportunity: Utah--Las Vegas Pipeline - 2011 Description: 75% interest in 400 mile refined products pipeline from Salt Lake City to Las Vegas with terminals in Cedar City, UT, and Las Vegas, NVHolly entity owns & funds through construction phaseHEP has option to purchase Holly's ownership interestSinclair is 25% equity partner Benefits: Increased refined product supply to sizable market with consistent annual demandLowers seasonal impact to refiners because of demand reduction in wintertime months in local marketNew outlet for crude-cost-advantaged Rocky Mountain refiners Capacity: 62,000 bpd (expandable to 118,000 bpd) Capex: Holly's 75% share of estimated $300mm total project cost, plus carrying cost of 7% per annum Estimated EBITDA: $23mm (75% share; initial annual EBITDA estimate) Completion Date: Completion late Q2 2011 - Start up Summer 2011 26 |
| Conclusion / Key Strengths 27 |
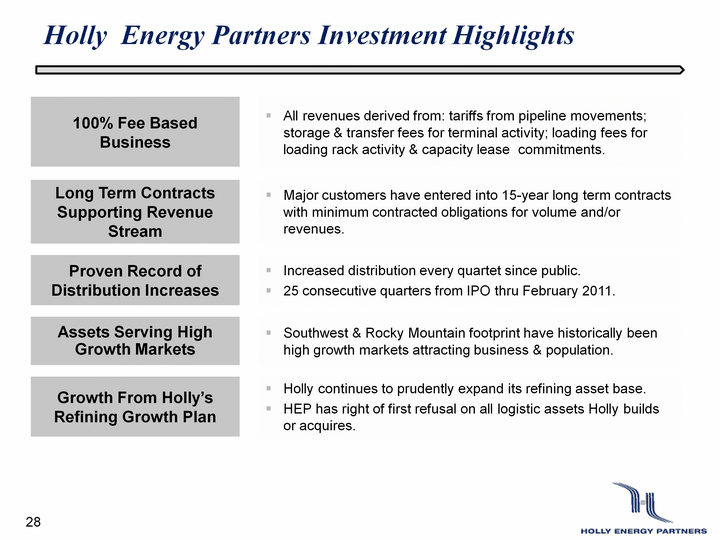
| Holly Energy Partners Investment Highlights Holly Energy Partners Investment Highlights 28 |

| Contact Information: 29 Holly Energy Partners, L.P. (NYSE: HEP) 100 Crescent Court, Suite 1600 Dallas, Texas 75201 (214) 871-3555 For investor relations questions please contact: Neale Hickerson, Vice President-Investor Relations Neale.hickerson@hollyenergy.com |
| 30 Appendix |
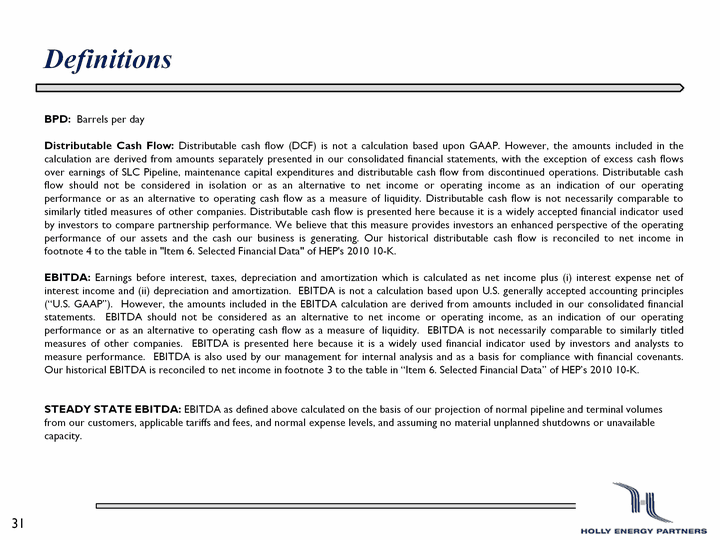
| Definitions 31 BPD: Barrels per day Distributable Cash Flow: Distributable cash flow (DCF) is not a calculation based upon GAAP. However, the amounts included in the calculation are derived from amounts separately presented in our consolidated financial statements, with the exception of excess cash flows over earnings of SLC Pipeline, maintenance capital expenditures and distributable cash flow from discontinued operations. Distributable cash flow should not be considered in isolation or as an alternative to net income or operating income as an indication of our operating performance or as an alternative to operating cash flow as a measure of liquidity. Distributable cash flow is not necessarily comparable to similarly titled measures of other companies. Distributable cash flow is presented here because it is a widely accepted financial indicator used by investors to compare partnership performance. We believe that this measure provides investors an enhanced perspective of the operating performance of our assets and the cash our business is generating. Our historical distributable cash flow is reconciled to net income in footnote 4 to the table in "Item 6. Selected Financial Data" of HEP's 2010 10-K. EBITDA: Earnings before interest, taxes, depreciation and amortization which is calculated as net income plus (i) interest expense net of interest income and (ii) depreciation and amortization. EBITDA is not a calculation based upon U.S. generally accepted accounting principles ("U.S. GAAP"). However, the amounts included in the EBITDA calculation are derived from amounts included in our consolidated financial statements. EBITDA should not be considered as an alternative to net income or operating income, as an indication of our operating performance or as an alternative to operating cash flow as a measure of liquidity. EBITDA is not necessarily comparable to similarly titled measures of other companies. EBITDA is presented here because it is a widely used financial indicator used by investors and analysts to measure performance. EBITDA is also used by our management for internal analysis and as a basis for compliance with financial covenants. Our historical EBITDA is reconciled to net income in footnote 3 to the table in "Item 6. Selected Financial Data" of HEP's 2010 10-K. STEADY STATE EBITDA: EBITDA as defined above calculated on the basis of our projection of normal pipeline and terminal volumes from our customers, applicable tariffs and fees, and normal expense levels, and assuming no material unplanned shutdowns or unavailable capacity. |
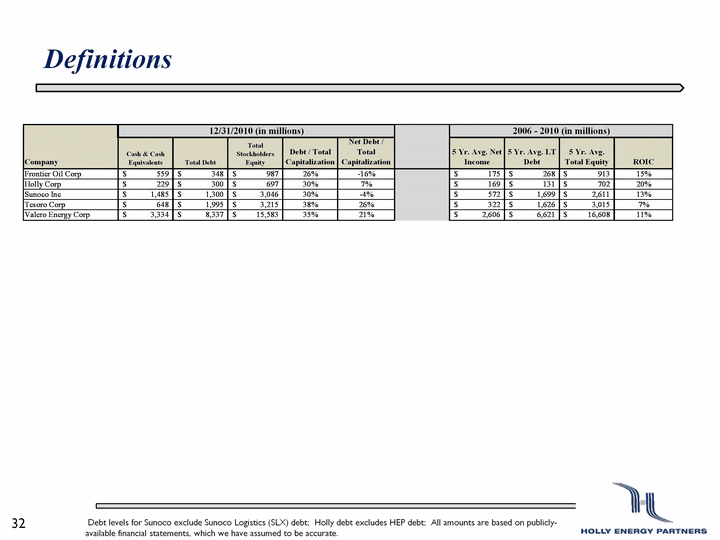
| Definitions 32 Debt levels for Sunoco exclude Sunoco Logistics (SLX) debt; Holly debt excludes HEP debt; All amounts are based on publicly- available financial statements, which we have assumed to be accurate. |
