As filed with the Securities and Exchange
Commission on April 13, 2011
Registration
No. 333-173262
UNITED STATES SECURITIES AND
EXCHANGE COMMISSION
Washington, D.C.
20549
Amendment No. 1 to
Form S-1
REGISTRATION
STATEMENT
UNDER
THE SECURITIES ACT OF
1933
TARGA RESOURCES CORP.
(Exact name of registrant as
specified in its charter)
| |
|
|
|
|
Delaware
(State or other jurisdiction
of
incorporation or organization)
|
|
4922
(Primary Standard
Industrial
Classification Code Number)
|
|
20-3701075
(I.R.S. Employer
Identification Number)
|
1000 Louisiana, Suite 4300
Houston, Texas 77002
(713) 584-1000
(Address, including zip code,
and telephone number,
including area code, of
registrant’s principal executive offices)
Rene R. Joyce
Chief Executive Officer
1000 Louisiana, Suite 4300
Houston, Texas 77002
(713) 584-1000
(Name, address, including zip
code, and telephone number,
including area code, of agent
for service)
Copies to:
| |
|
|
|
David P. Oelman
Christopher S. Collins
Vinson & Elkins LLP
1001 Fannin Street, Suite 2500
Houston, Texas 77002
(713) 758-2222
|
|
Douglass M. Rayburn
Baker Botts L.L.P.
2001 Ross Avenue
Dallas, Texas 75201
(214) 953-6500
|
Approximate date of commencement of proposed sale to the
public: As soon as practicable after this
Registration Statement becomes effective.
If any of the securities being registered on this Form are to be
offered on a delayed or continuous basis pursuant to
Rule 415 under the Securities Act, check the following
box. o
If this Form is filed to register additional securities for an
offering pursuant to Rule 462(b) under the Securities Act,
please check the following box and list the Securities Act
registration statement number of the earlier effective
registration statement for the same
offering. o
If this Form is a post-effective amendment filed pursuant to
Rule 462(c) under the Securities Act, check the following
box and list the Securities Act registration statement number of
the earlier effective registration statement for the same
offering. o
If this Form is a post-effective amendment filed pursuant to
Rule 462(d) under the Securities Act, check the following
box and list the Securities Act registration statement number of
the earlier effective registration statement for the same
offering. o
Indicate by check mark whether the registrant is a large
accelerated filer, an accelerated filer, a non-accelerated
filer, or a smaller reporting company. See the definitions of
“large accelerated filer,” “accelerated
filer” and “smaller reporting company” in Rule
12b-2 of the Exchange Act. (Check one):
| |
|
|
|
|
|
|
|
Large accelerated filer o
|
|
Accelerated filer o
|
|
Non-accelerated filer þ
(Do not check if a smaller reporting company)
|
|
Smaller reporting company o
|
The Registrant hereby amends this Registration Statement on
such date or dates as may be necessary to delay its effective
date until the registrant shall file a further amendment which
specifically states that this Registration Statement shall
thereafter become effective in accordance with Section 8(a)
of the Securities Act of 1933 or until the Registration
Statement shall become effective on such date as the Securities
and Exchange Commission acting pursuant to said
Section 8(a), may determine.
The
information in this prospectus is not complete and may be
changed. We may not sell these securities until the registration
statement filed with the Securities and Exchange Commission is
effective. This prospectus is not an offer to sell these
securities and it is not soliciting offers to buy these
securities in any state where the offer or sale is not
permitted.
|
Subject to Completion, dated
April 13, 2011
PROSPECTUS
5,650,000 Shares
Targa Resources Corp.
Common Stock
The selling stockholders identified in this prospectus are
offering 5,650,000 shares of our common stock. We will not
receive any proceeds from the sale of shares by the selling
stockholders.
An affiliate of Merrill Lynch, Pierce, Fenner & Smith
Incorporated, an underwriter in this offering, is a selling
stockholder. See “Underwriting (Conflicts of
Interest)—Conflicts of Interest.”
Our common stock trades on the New York Stock Exchange under the
symbol “TRGP.” The last reported trading price of our
common stock on the New York Stock Exchange on April 12,
2011 was $32.78 per share of common stock.
Investing in our common stock involves risks. See “Risk
Factors” beginning on page 20 of this prospectus.
| |
|
|
|
|
|
|
|
|
|
|
|
Per Share
|
|
Total
|
|
|
|
Price to the public
|
|
$
|
|
|
|
$
|
|
|
|
Underwriting discounts and commissions
|
|
$
|
|
|
|
$
|
|
|
|
Proceeds to the selling stockholders
|
|
$
|
|
|
|
$
|
|
|
Certain of the selling stockholders have granted the
underwriters a
30-day
option to purchase up to an additional 847,500 shares of
common stock on the same terms and conditions as set forth above
if the underwriters sell more than 5,650,000 shares of
common stock in this offering.
Neither the Securities and Exchange Commission nor any state
securities commission has approved or disapproved of these
securities or passed on the adequacy or accuracy of this
prospectus. Any representation to the contrary is a criminal
offense.
Barclays Capital, on behalf of the underwriters, expects to
deliver the shares on or
about ,
2011.
|
|
|
| Barclays
Capital |
Morgan Stanley |
BofA Merrill Lynch |
|
|
|
Citi |
Deutsche Bank Securities |
|
|
|
| Credit
Suisse |
J.P. Morgan |
Wells Fargo Securities |
|
|
|
|
Raymond James |
RBC Capital Markets |
UBS Investment Bank |
Prospectus
dated ,
2011
TABLE OF
CONTENTS
| |
|
|
|
|
|
|
|
Page
|
|
|
|
|
|
|
1
|
|
|
|
|
|
20
|
|
|
|
|
|
47
|
|
|
|
|
|
48
|
|
|
|
|
|
49
|
|
|
|
|
|
51
|
|
|
|
|
|
53
|
|
|
|
|
|
84
|
|
|
|
|
|
90
|
|
|
|
|
|
93
|
|
|
|
|
|
123
|
|
|
|
|
|
148
|
|
|
|
|
|
152
|
|
|
|
|
|
160
|
|
|
|
|
|
164
|
|
|
|
|
|
171
|
|
|
|
|
|
183
|
|
|
|
|
|
186
|
|
|
|
|
|
195
|
|
|
|
|
|
195
|
|
|
|
|
|
195
|
|
|
|
|
|
195
|
|
|
|
|
|
F-1
|
|
|
|
|
|
A-1
|
|
| EX-5.1 |
| EX-23.1 |
You should rely only on the information contained in this
prospectus. We have not, and the underwriters have not,
authorized anyone to provide you with different information. If
anyone provides you with different or inconsistent information,
you should not rely on it. We are not, and the underwriters are
not, making an offer to sell these securities in any
jurisdiction where an offer or sale is not permitted. You should
assume that the information appearing in this prospectus is
accurate as of the date on the front cover of this prospectus.
Our business, financial condition, results of operations and
prospects may have changed since that date.
i
SUMMARY
This summary provides a brief overview of information
contained elsewhere in this prospectus. Because it is
abbreviated, this summary may not contain all of the information
that you should consider before investing in our common stock.
You should read the entire prospectus carefully, including the
historical financial statements and the notes to those financial
statements. Unless indicated otherwise, the information
presented in this prospectus assumes that the underwriters do
not exercise their option to purchase additional shares of our
common stock. You should read “Risk Factors” beginning
on page 20 for more information about important risks that
you should consider carefully before investing in our common
stock. We include a glossary of some of the terms used in this
prospectus as Appendix A.
As used in this prospectus, unless we indicate otherwise:
(1) “our,” “we,” “us,”
“TRC,” “Targa,” and the “Company,”
and similar terms refer either to Targa Resources Corp., in its
individual capacity, or to Targa Resources Corp. and its
subsidiaries collectively, as the context requires, (2) the
“General Partner” refers to Targa Resources GP LLC,
the general partner of the Partnership, (3) the
“Partnership” refers to Targa Resources Partners LP,
in its individual capacity, to Targa Resources Partners LP and
its subsidiaries collectively, or to Targa Resources Partners LP
together with combined entities for predecessor periods under
common control, as the context requires and
(4) “TRI” refers to TRI Resources Inc., an
indirect
wholly-owned
subsidiary of us.
Targa Resources
Corp.
We own general and limited partner interests, including
incentive distribution rights (“IDRs”), in Targa
Resources Partners LP (NYSE: NGLS), a publicly traded Delaware
limited partnership that is a leading provider of midstream
natural gas and natural gas liquid services in the United
States. The Partnership is engaged in the business of gathering,
compressing, treating, processing and selling natural gas,
storing, fractionating, treating, transporting and selling
natural gas liquids, or NGLs, and NGL products and storing and
terminaling refined petroleum products and crude oil.
Our primary business objective is to increase our cash available
for dividends to our stockholders by assisting the Partnership
in executing its business strategy. We may facilitate the
Partnership’s growth through various forms of financial
support, including, but not limited to, modifying the
Partnership’s IDRs, exercising the Partnership’s IDR
reset provision contained in its partnership agreement, making
loans, making capital contributions in exchange for yielding or
non-yielding equity interests or providing other financial
support to the Partnership, if needed, to support its ability to
make distributions. We also may enter into other economic
transactions intended to increase our ability to make cash
available for dividends over time. In addition, we may acquire
assets that could be candidates for acquisition by the
Partnership, potentially after operational or commercial
improvement or further development.
As of April 12, 2011, our interests in the Partnership
consist of the following:
|
|
|
| |
•
|
a 2% general partner interest, which we hold through our 100%
ownership interest in the general partner of the Partnership;
|
| |
| |
•
|
all of the outstanding IDRs; and
|
| |
| |
•
|
11,645,659 of the 84,756,009 outstanding common units of the
Partnership, representing 13.7% of the limited partnership
interest in the Partnership.
|
Our cash flows are generated from the cash distributions we
receive from the Partnership. The Partnership is required to
distribute all available cash at the end of each quarter after
establishing reserves to provide for the proper conduct of its
business or to provide for future distributions. Our ownership
of the general partner interest entitles us to receive:
|
|
|
| |
•
|
2% of all cash distributed in respect for that quarter;
|
1
Our ownership in respect to the IDRs’ of the Partnership
that we hold entitles us to receive:
|
|
|
| |
•
|
13% of all cash distributed in a quarter after $0.3881 has been
distributed in respect of each common unit of the Partnership
for that quarter;
|
| |
| |
•
|
23% of all cash distributed in a quarter after $0.4219 has been
distributed in respect of each common unit of the Partnership
for that quarter; and
|
| |
| |
•
|
48% of all cash distributed in a quarter after $0.50625 has been
distributed in respect of each common unit of the Partnership
for that quarter.
|
On April 11, 2011, the Partnership announced that the board
of directors of the General Partner declared a quarterly cash
distribution of $0.5575 per common unit, or $2.23 per common
unit on an annualized basis, for the first quarter of 2011. This
cash distribution will be paid May 13, 2011 on all
outstanding common units to holders of record as of the close of
business on April 21, 2011.
On April 11, 2011, we announced that our board of directors
declared a quarterly cash dividend of $0.2725 per share of
common stock, or $1.09 per share on an annualized basis, for the
first quarter of 2011. This cash dividend will be paid on
May 17, 2011 on all outstanding shares of common stock to
holders of record as of the close of business on April 21,
2011. If we close this offering on or prior to the record date
on April 21, 2011, the shares of common stock sold in this
offering will receive the declared dividend of $0.2725 per share
of common stock for the first quarter of 2011. If we do not
close this offering on or prior to the record date on
April 21, 2011, then the shares of common stock sold in
this offering will not receive the declared dividend.
We intend to pay to our stockholders, on a quarterly basis,
dividends equal to the cash the Partnership distributes to us
based on our ownership of Partnership securities, less the
expenses of being a public company, other general and
administrative expenses, federal income taxes, capital
contributions to the Partnership and reserves established by our
board of directors. See “Our Dividend Policy.”
2
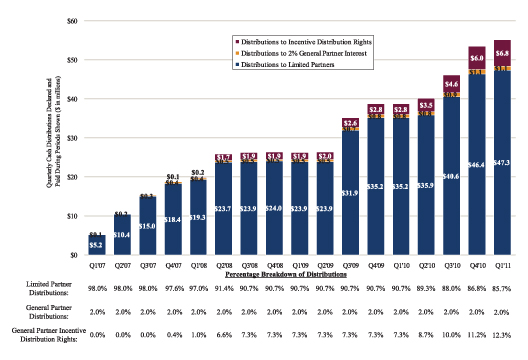
The following graph shows the historical cash distributions
declared by the Partnership for the periods shown to its limited
partners (including us), to us based on our 2% general partner
interest in the Partnership and to us based on the IDRs. The
increases in historical cash distributions to both the limited
partners and the general partner since the second quarter ended
June 30, 2007, as reflected in the graph set forth below,
generally resulted from increases in the Partnership’s per
unit quarterly distribution over time and the issuance of
approximately 53.9 million additional common units by the
Partnership over time to finance acquisitions and capital
improvements. Over the same period, the quarterly distributions
declared by the Partnership in respect of our 2% general partner
interest and IDRs increased approximately 3,600% from
$0.2 million to $7.9 million.
Quarterly Cash
Distributions by the Partnership
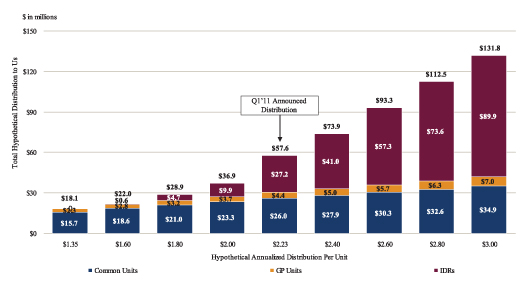
The graph set forth below shows hypothetical cash distributions
payable to us in respect of our interests in the Partnership
across an illustrative range of annualized distributions per
common unit. This information is based upon the following:
(i) the Partnership has a total of 84,756,009 common units
outstanding; and
(ii) we own (i) a 2% general partner interest in the
Partnership, (ii) the IDRs and (iii) 11,645,659 common
units of the Partnership.
The graph below also illustrates the impact on us of the
Partnership raising or lowering its per common unit distribution
from the 2011 first quarter quarterly distribution of $0.5575
per common unit, or $2.23 per common unit on an annualized
basis. This information is presented for illustrative purposes
only; it is not intended to be a prediction of future
performance and does not attempt to illustrate the impact that
changes in our or the Partnership’s business, including
changes that may result from changes in interest rates, energy
prices or general economic conditions, or the impact that any
future acquisitions or expansion
3
projects, divestitures or issuances of additional debt or equity
securities will have on our or the Partnership’s results of
operations.
Hypothetical
Annualized Pre-Tax Partnership Distributions to Us
The impact on us of changes in the Partnership’s
distribution levels will vary depending on several factors,
including the Partnership’s total outstanding partnership
interests on the record date for the distribution, the aggregate
cash distributions made by the Partnership and the interests in
the Partnership owned by us. If the Partnership increases
distributions to its unitholders, including us, we would expect
to increase dividends to our stockholders, although the timing
and amount of such increased dividends, if any, will not
necessarily be comparable to the timing and amount of the
increase in distributions made by the Partnership. In addition,
the level of distributions we receive and of dividends we pay to
our stockholders may be affected by the various risks associated
with an investment in us and the underlying business of the
Partnership.
Targa Resources
Partners LP
The Partnership is a leading provider of midstream natural gas
and NGL services in the United States and is engaged in the
business of gathering, compressing, treating, processing and
selling natural gas, storing, fractionating, treating,
transporting and selling NGLs and NGL products and storing and
terminaling refined petroleum products and crude oil. The
Partnership operates in two primary divisions: (i) Natural
Gas Gathering and Processing, consisting of two
segments—(a) Field Gathering and Processing and
(b) Coastal Gathering and Processing; and
(ii) Logistics and Marketing, consisting of two
segments—(a) Logistics Assets and (b) Marketing and
Distribution.
The Partnership currently owns interests in or operates
approximately 11,372 miles of natural gas pipelines and
approximately 800 miles of NGL pipelines, with natural gas
gathering systems covering approximately 13,500 square
miles and 22 natural gas processing plants with access to
natural gas supplies in the Permian Basin, the Fort Worth
Basin, the onshore region of the Louisiana Gulf Coast and the
Gulf of Mexico.
Additionally, the Partnership’s integrated Logistics and
Marketing division, or “Downstream Business,” has net
fractionation and treating capacity of approximately
385 MBbl/d, 39 owned and operated storage wells that are in
service with a net storage capacity of approximately
65 MMBbl, and 16 storage, marine and transport terminals
with above ground storage capacity of approximately
1.4 MMBbl.
4
Since the beginning of 2007, the Partnership has completed six
acquisitions from us with an aggregate purchase price of
approximately $3.1 billion. In addition, the Partnership
has successfully completed both large and small organic growth
projects associated with its existing assets and expects to
continue to do so in the future. These projects, some of which
occurred before the Partnership acquired its various businesses
from us, have involved growth capital expenditures of
approximately $313 million since 2005. We believe that the
Partnership is well positioned to continue the successful
execution of its business strategies, including accretive
acquisitions and expansion projects, and that the
Partnership’s inventory of growth projects should help to
sustain continued growth in cash distributions paid by the
Partnership.
Based on the Partnership’s closing common unit price on
April 12, 2011, the Partnership has an equity market
capitalization of $2.9 billion. As of December 31,
2010, the Partnership had total assets of $3.2 billion.
Recent
Transactions
In March 2011, the Partnership acquired a refined petroleum
products and crude oil storage and terminaling facility in
Channelview, TX. Located on Carpenter’s Bayou along the
Houston Ship Channel, the terminal can handle multiple grades of
blend stocks, products and crude. The Partnership expects that
the transaction will be immediately accretive to its unitholders
and is complementary to its existing terminal asset base and
business along the Gulf Coast. The Partnership expects to invest
incremental growth capital in the near future to expand the
capacity of the terminal.
On January 24, 2011, the Partnership completed a public
offering of 8,000,000 common units at a price of $33.67 per
common unit ($32.41 per common unit, net of underwriting
discounts), providing net proceeds of $259.3 million.
Pursuant to the exercise of the underwriters’ overallotment
option, on February 3, 2011 the Partnership sold an
additional 1,200,000 common units, providing net proceeds of
$38.9 million. In addition, we contributed
$6.3 million for 187,755 general partner units to maintain
our 2% general partner interest in the Partnership. The
Partnership used the net proceeds from the offering to reduce
borrowings under its senior secured credit facility.
Partnership
Growth Drivers
We believe the Partnership’s near-term growth will be
driven both by significant recently completed or pending
projects as well as strong supply and demand fundamentals for
its existing businesses. Over the longer-term, we expect the
Partnership’s growth will be driven by natural gas shale
opportunities, which could lead to growth in both the
Partnership’s Gathering and Processing division and
Downstream Business, organic growth projects and potential
strategic and other acquisitions related to its existing
businesses.
Organic growth projects. We expect the
Partnership’s near-term growth to be driven by a number of
significant projects scheduled for completion in 2011or early
2012 that are supported by long-term, fee-based contracts. These
projects include:
|
|
|
| |
•
|
Cedar Bayou Fractionator expansion
project: The Partnership is currently starting up
the approximately 78 MBbl/d of additional fractionation
capacity at the Partnership’s 88% owned Cedar Bayou
Fractionator (“CBF”) in Mont Belvieu. The capital cost
is expected to be less than the original estimated gross cost of
$78 million.
|
| |
| |
•
|
Benzene treating project: A new treater is
under construction which will operate in conjunction with the
Partnership’s existing low sulfur natural gasoline
(“LSNG”) facility at Mont Belvieu and is designed to
reduce benzene content of natural gasoline to meet new, more
stringent environmental standards. The treater has an estimated
gross cost of approximately $33 million and is expected to
be completed and operating by the end of the year.
|
| |
| |
•
|
Gulf Coast Fractionators expansion
project: The Partnership has announced plans by
Gulf Coast Fractionators (“GCF”), a partnership with
ConocoPhillips and Devon Energy Corporation in
|
5
|
|
|
| |
|
which the Partnership owns a 38.8% interest, to expand the
capacity of its NGL fractionation facility in Mont Belvieu by
43 MBbl/d for an estimated gross cost of $75 million.
|
|
|
|
| |
•
|
SAOU Expansion Program: The Partnership has
announced a $30 million capital expenditure program
including new compression facilities and pipelines as well as
expenditures to restart the
25 MMcf/d
Conger processing plant in response to strong volume growth and
new well connects. The Partnership expects the Conger plant to
restart in April 2011. Additionally, two 15 MMcf/d
processing trains from the Garden City plant are being
refurbished for future use at another SAOU location.
|
| |
| |
•
|
North Texas Expansion Program: The board of
directors of the General Partner has approved approximately
$40 million of capital expenditures to expand the gathering
and processing capability of the Partnership’s North Texas
System with certain provisions of the approved expenditures
subject to finalization of ongoing customer commercial
agreements. The expansion program is a response to strong volume
growth and new well connects associated with producer activity
in “oilier” portions of the Barnett Shale natural gas
play. Management expects that additional investment will be
required to keep pace with producer activity.
|
Additionally, the Partnership is actively pursuing other
gathering and processing expansion opportunities, especially for
the North Texas System, SAOU and the Sand Hills facilities. In
the Downstream Business, the Partnership submitted a standard
air permit application for a second CBF expansion of
approximately 100 MBbl/d. Having recently passed the
45 day waiting period without regulator objection, the
Partnership expects the permit registration to be received in
April. With the passage of the waiting period, the Partnership
has regulatory authority to proceed with the project, which it
expects to do pending execution of precedent anchor commercial
commitments. Furthermore, international interest in additional
propane
and/or
butane exports has increased utilization of the
Partnership’s existing export facilities and offers
prospects for a longer term potential expansion of the
Partnership’s Galena Park export facilities backed by
precedent contracts. Finally, the Partnership’s recently
added petroleum products and crude storage and terminaling team
closed its first acquisition in March, is pursuing organic
expansion for that acquisition and is actively pursuing other
refined products and crude storage and terminaling acquisition
opportunities.
Strong supply and demand fundamentals for the
Partnership’s existing businesses. We
believe that the current strength of oil, condensate and NGL
prices and of forecast prices for these energy commodities has
caused producers in and around the Partnership’s natural
gas gathering and processing areas of operation to focus their
drilling programs on regions rich in these forms of
hydrocarbons. Liquids rich gas is prevalent from the Wolfberry
Trend and Canyon Sands plays, which are accessible by the SAOU
processing business in the Permian Basin (known as
“SAOU”), the Wolfberry and Bone Springs plays, which
are accessible by the Sand Hills system, and from
“oilier” portions of the Barnett Shale natural gas
play, especially portions of Montague, Cooke, Clay and Wise
counties, which are accessible by the North Texas System.
Producer activity in areas rich in oil, condensate and NGLs is
currently generating high demand for the Partnership’s
fractionation services at the Mont Belvieu market hub. As a
result, fractionation volumes have recently increased to near
existing capacity. Until additional fractionation capacity comes
on-line in 2011, there will be limited incremental supply of
fractionation services in the area. These strong supply and
demand fundamentals have resulted in long-term,
“frac-or-pay”
contracts for existing capacity and support the construction of
new fractionation capacity, such as the Partnership’s CBF
and GCF expansion projects. The Partnership is continuing to see
rates for fractionation services increase. The higher volumes of
fractionated NGLs should also result in increased demand for
other related fee-based services provided by the
Partnership’s Downstream Business.
Active drilling and production activity from liquids- rich
shale gas plays and similar crude oil resource
plays. The Partnership is actively pursuing
natural gas gathering and processing and NGL fractionation
opportunities associated with liquids-rich shale gas plays such
as portions of the Barnett Shale
6
and the Eagle Ford Shale, and with even richer casinghead gas
opportunities from active crude oil resource plays such as the
Wolfberry (and other named variants of
Wolfcamp/Spraberry/Dean/other geologic cross-section
combinations) and the Bone Springs/Avalon Shale plays. We
believe that the Partnership’s leadership position in the
Downstream Business, which includes fractionation services,
provides the Partnership with a competitive advantage relative
to other gathering and processing companies without these
capabilities.
Potential third party acquisitions related to the
Partnership’s existing businesses. While the
Partnership’s recent growth has been partially driven by
the implementation of a focused drop drown strategy, our
management team also has a record of successful third party
acquisitions. Since our formation, our strategy has included
approximately $3 billion in acquisitions and growth capital
expenditures. We expect that third-party acquisitions will
continue to be a significant focus of the Partnership’s
growth strategy.
The
Partnership’s Competitive Strengths and
Strategies
We believe the Partnership is well positioned to execute its
business strategy due to the following competitive strengths:
|
|
|
| |
•
|
The Partnership is one of the largest and best
positioned/interconnected fractionators of NGLs in the Gulf
Coast.
|
| |
| |
•
|
The Partnership’s gathering and processing businesses are
predominantly located in active and growth oriented oil and gas
producing basins.
|
| |
| |
•
|
The Partnership provides a comprehensive package of services to
natural gas producers.
|
| |
| |
•
|
The Partnership maintains gathering and processing positions in
strategic oil and gas producing areas across multiple basins and
provides services under attractive contract terms to a diverse
mix of customers.
|
| |
| |
•
|
The Partnership’s gathering and processing systems and
logistics assets consist of high-quality, well maintained
facilities, resulting in low cost, efficient operations.
|
| |
| |
•
|
Maintaining appropriate leverage and distribution coverage
levels and mitigating commodity price volatility allow the
Partnership to be flexible in its growth strategy and enable it
to pursue strategic acquisitions and large growth projects.
|
| |
| |
•
|
The executive management team which formed TRI in 2004 and
continues to manage Targa today possesses over 200 years of
combined experience working in the midstream natural gas and
energy business.
|
The
Partnership’s Challenges
The Partnership faces a number of challenges in implementing its
business strategy. For example:
|
|
|
| |
•
|
The Partnership has a substantial amount of indebtedness which
may adversely affect its financial position.
|
| |
| |
•
|
The Partnership’s cash flow is affected by supply and
demand for oil, natural gas and NGL products and by natural gas
and NGL prices, and decreases in these prices could adversely
affect its results of operations and financial condition.
|
|
|
|
| |
•
|
The Partnership’s long-term success depends on its ability
to obtain new sources of supplies of natural gas and NGLs, which
depends on certain factors beyond its control. Any decrease in
supplies of natural gas or NGLs could adversely affect the
Partnership’s business and operating results.
|
|
|
|
| |
•
|
If the Partnership does not make investments in new assets or
acquisitions on economically acceptable terms or efficiently and
effectively integrate new assets, its results of operations and
financial condition could be adversely affected.
|
7
|
|
|
| |
•
|
The Partnership is subject to regulatory, environmental,
political, legal, credit and economic risks, which could
adversely affect its results of operations and financial
condition.
|
| |
| |
•
|
The Partnership’s growth strategy requires access to new
capital. Tightened capital markets or increased competition for
investment opportunities could impair its ability to grow.
|
| |
| |
•
|
The Partnership’s hedging activities may not be effective
in reducing the variability of its cash flows and may, in
certain circumstances, increase the variability of its cash
flows.
|
| |
| |
•
|
The Partnership’s industry is highly competitive, and
increased competitive pressure could adversely affect the
Partnership’s business and operating results.
|
For a further discussion of these and other challenges we and
the Partnership face, please read “Risk Factors.”
8
|
|
|
|
(1) |
|
Please see “Security Ownership
of Management and Selling Stockholders” for information
regarding the beneficial ownership of our common stock for our
executive officers and directors.
|
9
The
Offering
|
|
|
|
Common stock offered by the selling stockholders |
|
5,650,000 shares (6,497,500 shares if the
underwriters’
over-allotment
is exercised in full) |
|
|
|
|
Common stock outstanding as of April 12, 2011 |
|
42,349,738 shares |
|
|
|
|
Over-allotment option |
|
Certain of the selling stockholders have granted the
underwriters a 30-day option to purchase up to an aggregate of
847,500 additional shares of our common stock to cover
over-allotments. |
|
|
|
|
Use of proceeds |
|
We will not receive any proceeds from the sale of shares by the
selling stockholders. See “Use of Proceeds.” |
| |
|
Dividend Policy |
|
We intend to pay to our stockholders, on a quarterly basis,
dividends equal to the cash we receive from our Partnership
distributions, less reserves for expenses, future dividends and
other uses of cash, including: |
| |
|
|
|
• federal income taxes, which we are required to pay
because we are taxed as a corporation;
|
| |
|
|
|
• the expenses of being a public company;
|
| |
|
|
|
• other general and administrative expenses;
|
| |
|
|
|
• reserves our board of directors believes prudent to
maintain; and
|
| |
|
|
|
• capital contributions to the Partnership upon the
issuance by it of additional partnership securities if we choose
to maintain the General Partner’s 2% interest.
|
|
|
|
|
Dividends |
|
We announced a dividend of $0.2725 per share of common
stock for the first quarter of 2011 on April 11, 2011 to be
paid on May 17, 2011 to stockholders of record on
April 21, 2011. The dividend corresponds to $1.09 per share
on an annualized basis. If we close this offering on or prior to
the record date on April 21, 2011, the shares of common
stock sold in this offering will receive the declared dividend
of $0.2725 per share of common stock for the first quarter of
2011. If we do not close this offering on or prior to the record
date on April 21, 2011, then the shares of common stock
sold in this offering will not receive the declared dividend. We
cannot assure you that any dividends will be declared or paid by
us. Please read “Our Dividend Policy.” |
|
|
|
|
Tax |
|
For a discussion of the material tax consequences that may be
relevant to prospective stockholders who are non-U.S. holders
(as defined below), please read “Material U.S. Federal
Income Tax Consequences to Non-U.S. Holders.” |
10
|
|
|
|
Risk factors |
|
You should carefully read and consider the information beginning
on page 20 of this prospectus set forth under the heading
“Risk Factors” and all other information set forth in
this prospectus before deciding to invest in our common stock. |
| |
|
New York Stock Exchange symbol |
|
TRGP |
|
|
|
|
Conflicts of interest |
|
An affiliate of Merrill Lynch, Pierce, Fenner & Smith
Incorporated, an underwriter in this offering, will receive more
than 5% of the net proceeds of the offering as a selling
stockholder. Because an affiliate of Merrill Lynch, Pierce,
Fenner & Smith Incorporated will receive more than 5% of
the net proceeds, this offering is being conducted in accordance
with FINRA Rule 5121. This rule requires, among other things,
that a qualified independent underwriter has participated in the
preparation of, and has exercised the usual standards of due
diligence with respect to, this prospectus and the registration
statement of which this prospectus is a part. Barclays Capital
Inc. is acting as the qualified independent underwriter. See
“Underwriting (Conflicts of Interest)—Conflicts of
Interest.” |
11
Comparison of
Rights of Our Common Stock and the Partnership’s Common
Units
Our shares of common stock and the Partnership’s common
units are unlikely to trade, either by volume or price, in
correlation or proportion to one another. Instead, while the
trading prices of our shares and the common units may follow
generally similar broad trends, the trading prices may diverge
because, among other things:
|
|
|
| |
•
|
common unitholders of the Partnership have a priority over the
IDRs with respect to the Partnership distributions;
|
| |
| |
•
|
we participate in the General Partner’s distributions and
IDRs and the common unitholders do not;
|
| |
| |
•
|
we and our stockholders are taxed differently from the
Partnership and its common unitholders; and
|
| |
| |
•
|
we may enter into other businesses separate and apart from the
Partnership or any of its affiliates.
|
An investment in common units of a partnership is inherently
different from an investment in common stock of a corporation.
| |
|
|
|
|
|
|
|
Partnership’s Common Units
|
|
Our Shares
|
|
|
|
Distributions and Dividends
|
|
The Partnership pays its limited partners and the General Partner quarterly distributions equal to all of the available cash from operating surplus. The General Partner has a 2% general partner interest.
Common unitholders do not participate in the distributions to the General Partner or in the IDRs.
|
|
We intend to pay our stockholders, on a quarterly basis,
dividends equal to the cash the Partnership distributes to us
based on our ownership of Partnership interests, less federal
income taxes, which we are required to pay because we are taxed
as a corporation, the expenses of being a public company, other
general and administrative expenses, capital contributions to
the Partnership upon the issuance by it of additional
Partnership securities if we choose to maintain the General
Partner’s 2% interest and reserves established by our board
of directors.
|
|
|
|
|
|
|
|
|
|
|
|
We receive distributions from the Partnership with respect to
our 11,645,659 common units.
|
12
| |
|
|
|
|
|
|
|
Partnership’s Common Units
|
|
Our Shares
|
|
|
|
|
|
|
|
In addition, through our ownership of the Partnership’s
general partner, we participate in the distributions to the
General Partner pursuant to the 2% general partner interest and
the IDRs. If the Partnership is successful in implementing its
strategy to increase distributable cash flow, our income from
these rights may increase in the future. However, no
distributions may be made on the IDRs until the minimum
quarterly distribution has been paid on all outstanding common
units. Therefore, distributions with respect to the IDRs are
even more uncertain than distributions on the common units.
|
|
Taxation of Entity and Equity Owners
|
|
The Partnership is a flow-through entity that is not subject to an entity level federal income tax.
The Partnership expects that holders of units in the Partnership other than us will benefit for a period of time from tax basis adjustments and remedial allocations of deductions so that they will be allocated a relatively small amount of federal taxable income compared to the cash distributed to them.
|
|
Our taxable income is subject to U.S. federal income tax at the
corporate tax rate, which is currently a maximum of 35%. In
addition, we will be allocated more taxable income relative to
our Partnership distributions than the other common unitholders
and the relative amount thereof may increase if the Partnership
issues additional units or distributes a higher percentage of
cash to the holder of the IDRs.
|
13
| |
|
|
|
|
|
|
|
Partnership’s Common Units
|
|
Our Shares
|
|
|
|
|
|
Common unitholders will receive Forms K-1 from the Partnership reflecting the unitholders’ share of the Partnership’s items of income, gain, loss, and deduction.
Tax-exempt organizations, including employee benefit plans, will have unrelated business taxable income as a result of the allocation of the Partnership’s items of income, gain, loss, and deduction to them.
Regulated investment companies or mutual funds will be allocated items of income, which may not constitute qualifying income, as a result of the ownership of common units.
|
|
Because we are not a flow-through entity, our stockholders do not report our items of income, gain, loss and deduction on their federal income tax returns. Distributions to our stockholders will constitute dividends for U.S. tax purposes to the extent of our current or accumulated earnings and profits. To the extent those distributions are not treated as dividends, they will be treated as gain from the sale of the common stock to the extent the distribution exceeds a stockholder’s adjusted basis in the common stock sold.
Our stockholders will generally recognize capital gain or loss on the sale of our common stock equal to the difference between a stockholder’s adjusted tax basis in the shares of common stock sold and the proceeds received by such holder. This gain or loss will generally be long-term gain or loss if a holder sells shares of common stock held for more than one year. Under current law, long-term capital gains of individuals generally are subject to a reduced rate of U.S. federal income tax.
Tax-exempt organizations, including employee benefit plans, will not have unrelated business taxable income upon the receipt of dividends from us.
Regulated investment companies or mutual funds will have qualifying income as a result of dividends received from us.
|
14
| |
|
|
|
|
|
|
|
Partnership’s Common Units
|
|
Our Shares
|
|
|
|
Voting
|
|
Certain significant decisions require approval by a “unit majority” of the common units. These significant decisions include, among other things:
• merger of the Partnership or the sale of all or substantially all of its assets in certain circumstances; and
• certain amendments to the Partnership’s partnership agreement. For more information, please read “Material Provisions of the Partnership’s Partnership Agreement—Voting Rights.”
|
|
Under our amended and restated bylaws, each stockholder is
entitled to cast one vote, either in person or by proxy, for
each share standing in his or her name on the books of the
corporation as of the record date. Our amended and restated
certificate of incorporation and amended and restated bylaws
contain supermajority voting requirements for certain matters.
See “Description of Our Capital Stock—Anti-Takeover
Effects of Provisions of Our Amended and Restated Certificate of
Incorporation, Our Amended and Restated Bylaws and Delaware
Law—Certificate of Incorporation and Bylaws.”
|
|
Election, Appointment and Removal of General Partner and
Directors
|
|
Common unitholders do not elect the directors of Targa Resources GP LLC. Instead, these directors are elected annually by us, as the sole equity owner of Targa Resources GP LLC.
The Partnership’s general partner may not be removed unless that removal is approved by the vote of the holders of not less than 662/3% of the outstanding units, voting together as a single class, including units held by the general partner and its affiliates, and the Partnership receives an opinion of counsel regarding limited liability and tax matters.
|
|
We have a staggered board of three classes with each class being elected every three years and only one class elected each year. Also, each director shall hold office until the director’s successor shall have been duly elected and shall qualify or until the director shall resign or shall have been removed.
Directors serving on our board may only be removed from office for cause and only by the affirmative vote of a supermajority of our stockholders. See “Description of Our Capital Stock—Anti-Takeover Effects of Provisions of our Amended and Restated Certificate of Incorporation, our Amended and Restated Bylaws and Delaware Law—Certificate of Incorporation and Bylaws.”
|
|
Preemptive Rights to Acquire Securities
|
|
Common unitholders do not have preemptive rights.
Whenever the Partnership issues equity securities to any person other than the General Partner and its affiliates, the General Partner has a preemptive right to purchase additional limited partnership interests on the same terms in order to maintain its percentage interest.
|
|
Our stockholders do not have preemptive rights.
|
15
| |
|
|
|
|
|
|
|
Partnership’s Common Units
|
|
Our Shares
|
|
|
|
Liquidation
|
|
The Partnership will dissolve upon any of the following
• the election of the general partner to dissolve the Partnership, if approved by the holders of units representing a unit majority;
• there being no limited partners, unless the Partnership is continued without dissolution in accordance with applicable Delaware law;
|
|
We will dissolve upon any of the upon any of the following:
• the entry of a decree of judicial dissolution of us; or
• the approval of at least 67% of our outstanding common stock.
|
|
|
|
• the entry of a decree of judicial
dissolution of the Partnership pursuant to applicable Delaware
law; or
|
|
|
|
|
|
• the withdrawal or removal of the General
Partner or any other event that results in its ceasing to be the
general partner other than by reason of a transfer of its
general partner interest in accordance with the
Partnership’s partnership agreement or withdrawal or
removal following approval and admission of a successor.
|
|
|
16
Principal
Executive Offices and Internet Address
Our principal executive offices are located at 1000 Louisiana,
Suite 4300, Houston, Texas 77002 and our telephone number
is
(713) 584-1000.
Our website is located at www.targaresources.com. We make
our periodic reports and other information filed with or
furnished to the Securities and Exchange Commission, or the SEC,
available, free of charge, through our website, as soon as
reasonably practicable after those reports and other information
are electronically filed with or furnished to the SEC.
Information on our website or any other website is not
incorporated by reference into this prospectus and does not
constitute a part of this prospectus.
17
Summary
Consolidated Financial and Operating Data
Because we control Targa Resources GP LLC, our consolidated
financial information incorporates the consolidated financial
information of Targa Resources Partners LP.
The following table presents summary historical consolidated
financial and operating data of Targa Resources Corp. for the
periods and as of the dates indicated. The summary historical
consolidated statement of operations and cash flow data for the
years ended December 31, 2008, 2009 and 2010 and summary
historical consolidated balance sheet data as of
December 31, 2009 and 2010 have been derived from our
audited financial statements, and that information should be
read together with and is qualified in its entirety by reference
to, the historical consolidated financial statements and
accompanying notes included elsewhere in this prospectus. The
summary historical consolidated balance sheet data as of
December 31, 2008 has been derived from audited financial
statements that are not included in this prospectus.
| |
|
|
|
|
|
|
|
|
|
|
|
|
|
|
|
|
|
|
|
For the Years Ended December 31,
|
|
|
|
|
|
|
|
2008
|
|
|
2009
|
|
|
2010
|
|
|
|
|
|
|
|
(In millions, except operating, per common share and price
data)
|
|
|
|
|
|
|
|
Revenues(1)
|
|
$
|
7,998.9
|
|
|
$
|
4,536.0
|
|
|
$
|
5,469.2
|
|
|
|
|
|
|
Product purchases
|
|
|
7,218.5
|
|
|
|
3,791.1
|
|
|
|
4,687.7
|
|
|
|
|
|
|
|
|
|
|
|
|
|
|
|
|
|
|
|
|
|
|
|
|
Gross
margin(2)
|
|
|
780.4
|
|
|
|
744.9
|
|
|
|
781.5
|
|
|
|
|
|
|
Operating expenses
|
|
|
275.2
|
|
|
|
235.0
|
|
|
|
260.2
|
|
|
|
|
|
|
|
|
|
|
|
|
|
|
|
|
|
|
|
|
|
|
|
|
Operating
margin(3)
|
|
|
505.2
|
|
|
|
509.9
|
|
|
|
521.3
|
|
|
|
|
|
|
Depreciation and amortization expenses
|
|
|
160.9
|
|
|
|
170.3
|
|
|
|
185.5
|
|
|
|
|
|
|
General and administrative expenses
|
|
|
96.4
|
|
|
|
120.4
|
|
|
|
144.4
|
|
|
|
|
|
|
Other
|
|
|
13.4
|
|
|
|
2.0
|
|
|
|
(4.7
|
)
|
|
|
|
|
|
|
|
|
|
|
|
|
|
|
|
|
|
|
|
|
|
|
|
Income from operations
|
|
|
234.5
|
|
|
|
217.2
|
|
|
|
196.1
|
|
|
|
|
|
|
Interest expense, net
|
|
|
(141.2
|
)
|
|
|
(132.1
|
)
|
|
|
(110.9
|
)
|
|
|
|
|
|
Gain on insurance claims
|
|
|
18.5
|
|
|
|
—
|
|
|
|
—
|
|
|
|
|
|
|
Equity in earnings of unconsolidated investments
|
|
|
14.0
|
|
|
|
5.0
|
|
|
|
5.4
|
|
|
|
|
|
|
Gain (loss) on debt repurchases
|
|
|
25.6
|
|
|
|
(1.5
|
)
|
|
|
(17.4
|
)
|
|
|
|
|
|
Gain on early debt extinguishment
|
|
|
3.6
|
|
|
|
9.7
|
|
|
|
12.5
|
|
|
|
|
|
|
Gain (loss) on
mark-to-market
derivative instruments
|
|
|
(1.3
|
)
|
|
|
0.3
|
|
|
|
(0.4
|
)
|
|
|
|
|
|
Other
|
|
|
—
|
|
|
|
1.2
|
|
|
|
0.5
|
|
|
|
|
|
|
Income tax expense:
|
|
|
(19.3
|
)
|
|
|
(20.7
|
)
|
|
|
(22.5
|
)
|
|
|
|
|
|
|
|
|
|
|
|
|
|
|
|
|
|
|
|
|
|
|
|
Net income
|
|
|
134.4
|
|
|
|
79.1
|
|
|
|
63.3
|
|
|
|
|
|
|
Less: Net income attributable to non controlling interest
|
|
|
97.1
|
|
|
|
49.8
|
|
|
|
78.3
|
|
|
|
|
|
|
|
|
|
|
|
|
|
|
|
|
|
|
|
|
|
|
|
|
Net income (loss) attributable to Targa Resources Corp.
|
|
|
37.3
|
|
|
|
29.3
|
|
|
|
(15.0
|
)
|
|
|
|
|
|
Dividends on Series B preferred stock
|
|
|
(16.8
|
)
|
|
|
(17.8
|
)
|
|
|
(9.5
|
)
|
|
|
|
|
|
Less:
|
|
|
|
|
|
|
|
|
|
|
|
|
|
|
|
|
|
Undistributed earnings attributable to preferred shareholders
|
|
|
(20.5
|
)
|
|
|
(11.5
|
)
|
|
|
—
|
|
|
|
|
|
|
Dividends to common equivalents
|
|
|
—
|
|
|
|
—
|
|
|
|
(177.8
|
)
|
|
|
|
|
|
|
|
|
|
|
|
|
|
|
|
|
|
|
|
|
|
|
|
Net income (loss) available to common shareholders
|
|
$
|
—
|
|
|
$
|
—
|
|
|
$
|
(202.3
|
)
|
|
|
|
|
|
|
|
|
|
|
|
|
|
|
|
|
|
|
|
|
|
|
|
Net income (loss) available per common share—basic and
diluted
|
|
$
|
—
|
|
|
$
|
—
|
|
|
$
|
(30.94
|
)
|
|
|
|
|
|
|
|
|
|
|
|
|
|
|
|
|
|
|
|
|
|
|
|
Operating data:
|
|
|
|
|
|
|
|
|
|
|
|
|
|
|
|
|
|
Plant natural gas inlet,
MMcf/d(4),(5)
|
|
|
1,846.4
|
|
|
|
2,139.8
|
|
|
|
2,268.0
|
|
|
|
|
|
|
Gross NGL production, MBbl/d
|
|
|
101.9
|
|
|
|
118.3
|
|
|
|
121.2
|
|
|
|
|
|
|
Natural gas sales, BBtu/d(5)
|
|
|
532.1
|
|
|
|
598.4
|
|
|
|
685.1
|
|
|
|
|
|
|
NGL sales, MBbl/d
|
|
|
286.9
|
|
|
|
279.7
|
|
|
|
251.5
|
|
|
|
|
|
|
Condensate sales, MBbl/d
|
|
|
3.8
|
|
|
|
4.7
|
|
|
|
3.5
|
|
|
|
|
|
|
Average realized prices(6):
|
|
|
|
|
|
|
|
|
|
|
|
|
|
|
|
|
|
Natural gas, $/MMBtu
|
|
$
|
8.20
|
|
|
$
|
3.96
|
|
|
$
|
4.43
|
|
|
|
|
|
|
NGL, $/gal
|
|
|
1.38
|
|
|
|
0.79
|
|
|
|
1.06
|
|
|
|
|
|
|
Condensate, $/Bbl
|
|
|
91.28
|
|
|
|
56.32
|
|
|
|
73.68
|
|
|
|
|
|
18
| |
|
|
|
|
|
|
|
|
|
|
|
|
|
|
|
|
|
|
|
For the Years Ended December 31,
|
|
|
|
|
|
|
|
2008
|
|
|
2009
|
|
|
2010
|
|
|
|
|
|
|
|
(In millions, except operating, per common share and price
data)
|
|
|
|
|
|
|
|
Balance Sheet Data (at period end):
|
|
|
|
|
|
|
|
|
|
|
|
|
|
|
|
|
|
Property plant and equipment, net
|
|
$
|
2,617.4
|
|
|
$
|
2,548.1
|
|
|
$
|
2,509.0
|
|
|
|
|
|
|
Total assets
|
|
|
3,641.8
|
|
|
|
3,367.5
|
|
|
|
3,393.8
|
|
|
|
|
|
|
Long-term debt, less current maturities
|
|
|
1,976.5
|
|
|
|
1,593.5
|
|
|
|
1,534.7
|
|
|
|
|
|
|
Convertible cumulative participating Series B preferred
stock
|
|
|
290.6
|
|
|
|
308.4
|
|
|
|
—
|
|
|
|
|
|
|
Total owners’ equity
|
|
|
822.0
|
|
|
|
754.9
|
|
|
|
1,036.1
|
|
|
|
|
|
|
Cash Flow Data:
|
|
|
|
|
|
|
|
|
|
|
|
|
|
|
|
|
|
Net cash provided by (used in):
|
|
|
|
|
|
|
|
|
|
|
|
|
|
|
|
|
|
Operating activities
|
|
$
|
390.7
|
|
|
$
|
335.8
|
|
|
$
|
208.5
|
|
|
|
|
|
|
Investing activities
|
|
|
(206.7
|
)
|
|
|
(59.3
|
)
|
|
|
(134.6
|
)
|
|
|
|
|
|
Financing activities
|
|
|
0.9
|
|
|
|
(386.9
|
)
|
|
|
(137.9
|
)
|
|
|
|
|
|
|
|
|
(1) |
|
Includes business interruption
insurance revenues of $32.9 million, $21.5 million and
$6.0 million for the years ended December 31, 2008,
2009 and 2010.
|
| |
|
(2) |
|
Gross margin is a non-GAAP
financial measure and is discussed under “Management’s
Discussion and Analysis of Financial Condition and Results of
Operations—How We Evaluate Our Operations” and
“—How We Evaluate the Partnership’s
Operations.”
|
| |
|
(3) |
|
Operating margin is a non-GAAP
financial measure and is discussed under “Management’s
Discussion and Analysis of Financial Condition and Results of
Operations—How We Evaluate Our Operations” and
“—How We Evaluate the Partnership’s
Operations.”
|
| |
|
(4) |
|
Plant natural gas inlet represents
the volume of natural gas passing through the meter located at
the inlet of a natural gas processing plant.
|
| |
|
(5) |
|
Plant natural gas inlet volumes
include producer
take-in-kind
volumes, while natural gas sales exclude producer
take-in-kind
volumes.
|
| |
|
(6) |
|
Average realized prices include the
impact of hedging activities.
|
19
RISK
FACTORS
The nature of our business activities subjects us to certain
hazards and risks. You should carefully consider the risks
described below, in addition to the other information contained
in this prospectus, before making an investment decision.
Realization of any of these risks or events could have a
material adverse effect on our business, financial condition,
cash flows and results of operations, which could result in a
decline in the trading price of our common stock, and you may
lose all or part of your investment.
Risks Inherent in
an Investment in Us
Our cash flow
is dependent upon the ability of the Partnership to make cash
distributions to us.
Our cash flow consists of cash distributions from the
Partnership. The amount of cash that the Partnership will be
able to distribute to its partners, including us, each quarter
principally depends upon the amount of cash it generates from
its business. For a description of certain factors that can
cause fluctuations in the amount of cash that the Partnership
generates from its business, please read “—Risks
Inherent in the Partnership’s Business” and
“Management’s Discussion and Analysis of Financial
Condition and Results of Operations—Factors That
Significantly Affect Our Results.” The Partnership may not
have sufficient available cash each quarter to continue paying
distributions at their current level or at all. If the
Partnership reduces its per unit distribution, because of
reduced operating cash flow, higher expenses, capital
requirements or otherwise, we will have less cash available to
pay dividends to our stockholders and would probably be required
to reduce the dividend per share of common stock. The amount of
cash the Partnership has available for distribution depends
primarily upon the Partnership’s cash flow, including cash
flow from the release of reserves as well as borrowings, and is
not solely a function of profitability, which will be affected
by non-cash items. As a result, the Partnership may make cash
distributions during periods when it records losses and may not
make cash distributions during periods when it records profits.
Once we receive cash from the Partnership and the General
Partner, our ability to distribute the cash received to our
stockholders is limited by a number of factors, including:
|
|
|
| |
•
|
our obligation to (i) satisfy tax obligations associated
with previous sales of assets to the Partnership,
(ii) reimburse the Partnership for certain capital
expenditures related to Versado Gas Processors, L.L.C.
(“Versado”) and (iii) provide the Partnership
with limited quarterly distribution support through 2011, all as
described in more detail in “Management’s Discussion
and Analysis of Financial Condition and Results of
Operations—Liquidity and Capital Resources;”
|
| |
| |
•
|
interest expense and principal payments on any indebtedness we
incur;
|
| |
| |
•
|
restrictions on distributions contained in any existing or
future debt agreements;
|
| |
| |
•
|
our general and administrative expenses, including expenses we
incur as a result of being a public company as well as other
operating expenses;
|
| |
| |
•
|
expenses of the General Partner;
|
| |
| |
•
|
income taxes;
|
| |
| |
•
|
reserves we establish in order for us to maintain our 2% general
partner interest in the Partnership upon the issuance of
additional partnership securities by the Partnership; and
|
| |
| |
•
|
reserves our board of directors establishes for the proper
conduct of our business, to comply with applicable law or any
agreement binding on us or our subsidiaries or to provide for
future dividends by us.
|
The actual amount of cash that is available for dividends to our
stockholders will depend on numerous factors, many of which are
beyond our control. For additional information, please read
“Our Dividend Policy.”
20
A reduction in
the Partnership’s distributions will disproportionately
affect the amount of cash distributions to which we are
entitled.
Our ownership of the IDRs in the Partnership entitles us to
receive specified percentages of the amount of cash
distributions made by the Partnership to its limited partners
only in the event that the Partnership distributes more than
$0.3881 per unit for such quarter. As a result, the holders of
the Partnership’s common units have a priority over our
IDRs to the extent of cash distributions by the Partnership up
to and including $0.3881 per unit for any quarter.
Our IDRs entitle us to receive increasing percentages, up to
48%, of all cash distributed by the Partnership. Because the
Partnership’s distribution rate is currently above the
maximum target cash distribution level on the IDRs, future
growth in distributions we receive from the Partnership will not
result from an increase in the target cash distribution level
associated with the IDRs. Furthermore, a decrease in the amount
of distributions by the Partnership to less than $0.50625 per
unit per quarter would reduce the General Partner’s
percentage of the incremental cash distributions above $0.3881
per common unit per quarter from 48% to 23%. As a result, any
such reduction in quarterly cash distributions from the
Partnership would have the effect of disproportionately reducing
the distributions that we receive from the Partnership based on
our IDRs as compared to distributions we receive from the
Partnership with respect to our 2% general partner interest and
our common units.
If the
Partnership’s unitholders remove the General Partner, we
would lose our general partner interest and IDRs in the
Partnership and the ability to manage the
Partnership.
We currently manage our investment in the Partnership through
our ownership interest in the General Partner. The
Partnership’s partnership agreement, however, gives
unitholders of the Partnership the right to remove the General
Partner upon the affirmative vote of holders of
662/3%
of the Partnership’s outstanding units. If the General
Partner were removed as general partner of the Partnership, it
would receive cash or common units in exchange for its 2%
general partner interest and the IDRs and would also lose its
ability to manage the Partnership. While the cash or common
units the General Partner would receive are intended under the
terms of the Partnership’s partnership agreement to fully
compensate us in the event such an exchange is required, the
value of the investments we make with the cash or the common
units may not over time be equivalent to the value of the
general partner interest and the IDRs had the General Partner
retained them. Please read “Material Provisions of the
Partnership’s Partnership Agreement—Withdrawal or
Removal of the General Partner.”
In addition, if the General Partner is removed as general
partner of the Partnership, we would face an increased risk of
being deemed an investment company. Please read “—If
in the future we cease to manage and control the Partnership, we
may be deemed to be an investment company under the Investment
Company Act of 1940.”
The
Partnership, without our stockholders’ consent, may issue
additional common units or other equity securities, which may
increase the risk that the Partnership will not have sufficient
available cash to maintain or increase its cash distribution
level per common unit.
Because the Partnership distributes to its partners most of the
cash generated by its operations, it relies primarily upon
external financing sources, including debt and equity issuances,
to fund its acquisitions and expansion capital expenditures.
Accordingly, the Partnership has wide latitude to issue
additional common units on the terms and conditions established
by its general partner. We receive cash distributions from the
Partnership on the general partner interest, IDRs and common
units that we own. Because a significant portion of the cash we
receive from the Partnership is attributable to our ownership of
the IDRs, payment of distributions on additional Partnership
common units may increase the risk that the Partnership will be
unable to maintain or increase its quarterly cash distribution
per unit, which in turn may reduce the amount of distributions
we receive attributable to our common units, general partner
interest and IDRs and the available cash that we have to pay as
dividends to our stockholders.
21
The General
Partner, with our consent but without the consent of our
stockholders, may limit or modify the incentive distributions we
are entitled to receive, which may reduce cash dividends to
you.
We own the General Partner, which owns the IDRs in the
Partnership that entitle us to receive increasing percentages,
up to a maximum of 48% of any cash distributed by the
Partnership as certain target distribution levels are reached in
excess of $0.3881 per common unit in any quarter. A substantial
portion of the cash flow we receive from the Partnership is
provided by these IDRs. Because of the high percentage of the
Partnership’s incremental cash flow that is distributed to
the IDRs, certain potential acquisitions might not increase cash
available for distribution per Partnership unit. In order to
facilitate acquisitions by the Partnership or for other reasons,
the board of directors of the General Partner may elect to
reduce the IDRs payable to us with our consent. These reductions
may be permanent reductions in the IDRs or may be reductions
with respect to cash flows from the potential acquisition. If
distributions on the IDRs were reduced for the benefit of the
Partnership units, the total amount of cash distributions we
would receive from the Partnership, and therefore the amount of
cash dividends we could pay to our stockholders, would be
reduced.
In the future,
we may not have sufficient cash to pay estimated
dividends.
Because our only source of operating cash flow consists of cash
distributions from the Partnership, the amount of dividends we
are able to pay to our stockholders may fluctuate based on the
level of distributions the Partnership makes to its partners,
including us. The Partnership may not continue to make quarterly
distributions at the 2010 fourth quarter distribution level of
$0.5475 per common unit, or may not distribute any other amount,
or increase its quarterly distributions in the future. In
addition, while we would expect to increase or decrease
dividends to our stockholders if the Partnership increases or
decreases distributions to us, the timing and amount of such
changes in distributions, if any, will not necessarily be
comparable to the timing and amount of any changes in dividends
made by us. Factors such as reserves established by our board of
directors for our estimated general and administrative expenses
of being a public company as well as other operating expenses,
reserves to satisfy our debt service requirements, if any, and
reserves for future dividends by us may affect the dividends we
make to our stockholders. The actual amount of cash that is
available for dividends to our stockholders will depend on
numerous factors, many of which are beyond our control.
Our cash
dividend policy limits our ability to grow.
Because we plan on distributing a substantial amount of our cash
flow, our growth may not be as fast as the growth of businesses
that reinvest their available cash to expand ongoing operations.
In fact, because our only cash-generating assets are direct and
indirect partnership interests in the Partnership, our growth
will be substantially dependent upon the Partnership. If we
issue additional shares of common stock or we were to incur
debt, the payment of dividends on those additional shares or
interest on that debt could increase the risk that we will be
unable to maintain or increase our cash dividend levels.
Our rate of
growth may be reduced to the extent we purchase additional units
from the Partnership, which will reduce the relative percentage
of the cash we receive from the IDRs.
Our business strategy includes, where appropriate, supporting
the growth of the Partnership by purchasing the
Partnership’s units or lending funds or providing other
forms of financial support to the Partnership to provide funding
for the acquisition of a business or asset or for a growth
project. To the extent we purchase common units or securities
not entitled to a current distribution from the Partnership, the
rate of our distribution growth may be reduced, at least in the
short term, as less of our cash distributions will come from our
ownership of IDRs, whose distributions increase at a faster rate
than those of our other securities.
22
We have a
credit facility that contains various restrictions on our
ability to pay dividends to our stockholders, borrow additional
funds or capitalize on business opportunities.
We have a credit facility that contains various operating and
financial restrictions and covenants. Our ability to comply with
these restrictions and covenants may be affected by events
beyond our control, including prevailing economic, financial and
industry conditions. If we are unable to comply with these
restrictions and covenants, any future indebtedness under this
credit facility may become immediately due and payable and our
lenders’ commitment to make further loans to us may
terminate. We might not have, or be able to obtain, sufficient
funds to make these accelerated payments.
Our credit facility limits our ability to pay dividends to our
stockholders during an event of default or if an event of
default would result from such dividend.
In addition, any future borrowings may:
|
|
|
| |
•
|
adversely affect our ability to obtain additional financing for
future operations or capital needs;
|
| |
| |
•
|
limit our ability to pursue acquisitions and other business
opportunities;
|
| |
| |
•
|
make our results of operations more susceptible to adverse
economic or operating conditions; or
|
| |
| |
•
|
limit our ability to pay dividends.
|
Our payment of any principal and interest will reduce our cash
available for dividends to holders of common stock. In addition,
we are able to incur substantial additional indebtedness in the
future. If we incur additional debt, the risks associated with
our leverage would increase. For more information regarding our
credit facility, please read “Management’s Discussion
and Analysis of Financial Condition and Results of
Operations—Liquidity and Capital Resources.”
If dividends
on our shares of common stock are not paid with respect to any
fiscal quarter, our stockholders will not be entitled to receive
that quarter’s payments in the future.
Dividends to our stockholders will not be cumulative.
Consequently, if dividends on our shares of common stock are not
paid with respect to any fiscal quarter, our stockholders will
not be entitled to receive that quarter’s payments in the
future.
The
Partnership’s practice of distributing all of its available
cash may limit its ability to grow, which could impact
distributions to us and the available cash that we have to
dividend to our stockholders.
Because our only cash-generating assets are common units and
general partner interests in the Partnership, including the
IDRs, our growth will be dependent upon the Partnership’s
ability to increase its quarterly cash distributions. The
Partnership has historically distributed to its partners most of
the cash generated by its operations. As a result, it relies
primarily upon external financing sources, including debt and
equity issuances, to fund its acquisitions and expansion capital
expenditures. Accordingly, to the extent the Partnership is
unable to finance growth externally, its ability to grow will be
impaired because it distributes substantially all of its
available cash. Also, if the Partnership incurs additional
indebtedness to finance its growth, the increased interest
expense associated with such indebtedness may reduce the amount
of available cash that we can distribute to you. In addition, to
the extent the Partnership issues additional units in connection
with any acquisitions or growth capital expenditures, the
payment of distributions on those additional units may increase
the risk that the Partnership will be unable to maintain or
increase its per unit distribution level, which in turn may
impact the cash available for dividends to our stockholders.
23
Restrictions
in the Partnership’s senior secured credit facility and
indentures could limit its ability to make distributions to
us.
The Partnership’s senior secured credit facility and
indentures contain covenants limiting its ability to incur
indebtedness, grant liens, engage in transactions with
affiliates and make distributions. The Partnership’s senior
secured credit facility also contains covenants requiring the
Partnership to maintain certain financial ratios. The
Partnership is prohibited from making any distribution to
unitholders if such distribution would cause an event of default
or otherwise violate a covenant under its senior secured credit
facility or the indentures.
If in the
future we cease to manage and control the Partnership, we may be
deemed to be an investment company under the Investment Company
Act of 1940.
If we cease to manage and control the Partnership and are deemed
to be an investment company under the Investment Company Act of
1940, we would either have to register as an investment company
under the Investment Company Act of 1940, obtain exemptive
relief from the SEC or modify our organizational structure or
our contractual rights to fall outside the definition of an
investment company. Registering as an investment company could,
among other things, materially limit our ability to engage in
transactions with affiliates, including the purchase and sale of
certain securities or other property to or from our affiliates,
restrict our ability to borrow funds or engage in other
transactions involving leverage and require us to add additional
directors who are independent of us and our affiliates, and
adversely affect the price of our common stock.
Our historical
financial information may not be representative of our future
performance.
The historical financial information included in this prospectus
is derived from our historical financial statements, including
for periods prior to our initial public offering in December
2010. Our audited historical financial statements were prepared
in accordance with GAAP. Accordingly, the historical financial
information included in this prospectus does not reflect what
our results of operations and financial condition would have
been had we been a public entity during the periods presented,
or what our results of operations and financial condition will
be in the future.
If we lose any
of our named executive officers, our business may be adversely
affected.
Our success is dependent upon the efforts of the named executive
officers. Our named executive officers are responsible for
executing the Partnership’s business strategy and, when
appropriate to our primary business objective, facilitating the
Partnership’s growth through various forms of financial
support provided by us, including, but not limited to, modifying
the Partnership’s IDRs, exercising the Partnership’s
IDR reset provision contained in its partnership agreement,
making loans, making capital contributions in exchange for
yielding or non-yielding equity interests or providing other
financial support to the Partnership. There is substantial
competition for qualified personnel in the midstream natural gas
industry. We may not be able to retain our existing named
executive officers or fill new positions or vacancies created by
expansion or turnover. We have not entered into employment
agreements with any of our named executive officers. In
addition, we do not maintain “key man” life insurance
on the lives of any of our named executive officers. A loss of
one or more of our named executive officers could harm our and
the Partnership’s business and prevent us from implementing
our and the Partnership’s business strategy.
If we fail to
maintain an effective system of internal controls, we may not be
able to accurately report our financial results or prevent
fraud. In addition, potential changes in accounting standards
might cause us to revise our financial results and disclosure in
the future.
Effective internal controls are necessary for us to provide
timely and reliable financial reports and effectively prevent
fraud. If we cannot provide timely and reliable financial
reports or prevent fraud, our reputation and operating results
would be harmed. We continue to enhance our internal controls
and
24
financial reporting capabilities. These enhancements require a
significant commitment of resources, personnel and the
maintenance of formalized internal reporting procedures to
ensure the reliability of our financial reporting. Our efforts
to update and maintain our internal controls may not be
successful, and we may be unable to maintain adequate controls
over our financial processes and reporting in the future,
including future compliance with the obligations under
Section 404 of the Sarbanes-Oxley Act of 2002. Any failure
to maintain effective controls, or difficulties encountered in
the effective improvement of our internal controls could prevent
us from timely and reliably reporting our financial results and
may harm our operating results. Ineffective internal controls
could also cause investors to lose confidence in our reported
financial information. In addition, the Financial Accounting
Standards Board or the SEC could enact new accounting standards
that might impact how we or the Partnership are required to
record revenues, expenses, assets and liabilities. Any
significant change in accounting standards or disclosure
requirements could have a material effect on our business,
results of operations, financial condition and ability to
service our and our subsidiaries’ debt obligations.
Our shares of
common stock and the Partnership’s common units may not
trade in relation or proportion to one another.
The shares of our common stock and the Partnership’s common
units may not trade, either by volume or price, in correlation
or proportion to one another. Instead, while the trading prices
of our common stock and the Partnership’s common units may
follow generally similar broad trends, the trading prices may
diverge because, among other things:
|
|
|
| |
•
|
the Partnership’s cash distributions to its common
unitholders have a priority over distributions on its IDRs;
|
| |
| |
•
|
we participate in the distributions on the General
Partner’s general partner interest and IDRs in the
Partnership while the Partnership’s common unitholders do
not;
|
| |
| |
•
|
we and our stockholders are taxed differently from the
Partnership and its common unitholders; and
|
| |
| |
•
|
we may enter into other businesses separate and apart from the
Partnership or any of its affiliates.
|
An increase in
interest rates may cause the market price of our common stock to
decline.
Like all equity investments, an investment in our common stock
is subject to certain risks. In exchange for accepting these
risks, investors may expect to receive a higher rate of return
than would otherwise be obtainable from lower-risk investments.
Accordingly, as interest rates rise, the ability of investors to
obtain higher risk-adjusted rates of return by purchasing
government-backed debt securities may cause a corresponding
decline in demand for riskier investments generally, including
yield-based equity investments. Reduced demand for our common
stock resulting from investors seeking other more favorable
investment opportunities may cause the trading price of our
common stock to decline.
The
requirements of being a public company, including compliance
with the reporting requirements of the Exchange Act and the
requirements of the Sarbanes-Oxley Act, may strain our
resources, increase our costs and distract management; and we
may be unable to comply with these requirements in a timely or
cost-effective manner.
As a public company with listed equity securities, we must
comply with new laws, regulations and requirements, certain
corporate governance provisions of the Sarbanes-Oxley Act of
2002, related regulations of the SEC and the requirements of the
New York Stock Exchange, or NYSE, with which we were not
required to comply as a private company. Complying with these
statutes, regulations and requirements occupies a significant
amount of time of our board of directors and management and has
significantly increased our costs and expenses. These laws and
regulations require us to:
|
|
|
| |
•
|
maintain a comprehensive compliance function;
|
25
|
|
|
| |
•
|
evaluate and maintain an additional system of internal controls
over financial reporting in compliance with the requirements of
Section 404 of the Sarbanes-Oxley Act of 2002 and the
related rules and regulations of the SEC and the Public Company
Accounting Oversight Board;
|
| |
| |
•
|
comply with rules promulgated by the NYSE;
|
| |
| |
•
|
prepare and distribute periodic public reports in compliance
with our obligations under the federal securities laws;
|
| |
| |
•
|
evaluate and maintain internal policies, such as those relating
to disclosure controls and procedures and insider trading;
|
| |
| |
•
|
involve and retain to a greater degree outside counsel and
accountants in the above activities; and
|
| |
| |
•
|
augment our investor relations function.
|
In addition, being a public company requires us to either accept
less director and officer liability insurance coverage than we
desire or to incur additional costs to maintain coverage. These
factors could make it more difficult for us to attract and
retain qualified members of our board of directors, particularly
to serve on our Audit Committee, and qualified executive
officers.
Future sales
of our common stock in the public market could lower our stock
price, and any additional capital raised by us through the sale
of equity or convertible securities may dilute your ownership in
us.
We or our stockholders may sell shares of common stock in
subsequent public offerings. We may also issue additional shares
of common stock or convertible securities. After the completion
of this offering, we will have 42,349,738 outstanding shares of
common stock, 14,691,076 of which will be owned by our directors
and executive officers and affiliates of Warburg Pincus LLC
(“Warburg Pincus”). A substantial portion of these
shares may be sold into the market in the future. Certain of our
existing stockholders, including our executive officers, certain
of our directors and affiliates of Warburg Pincus, are party to
a registration rights agreement with us which requires us to
effect the registration of their shares in certain circumstances.
We cannot predict the size of future issuances of our common
stock or the effect, if any, that future issuances and sales of
shares of our common stock will have on the market price of our
common stock. Sales of substantial amounts of our common stock
(including shares issued in connection with an acquisition), or
the perception that such sales could occur, may adversely affect
prevailing market prices of our common stock.
Our amended
and restated certificate of incorporation and amended and
restated bylaws, as well as Delaware law, contain provisions
that could discourage acquisition bids or merger proposals,
which may adversely affect the market price of our common
stock.
Our amended and restated certificate of incorporation authorizes
our board of directors to issue preferred stock without
stockholder approval. If our board of directors elects to issue
preferred stock, it could be more difficult for a third party to
acquire us. In addition, some provisions of our amended and
restated certificate of incorporation and amended and restated
bylaws could make it more difficult for a third party to acquire
control of us, even if the change of control would be beneficial
to our stockholders, including:
|
|
|
| |
•
|
a classified board of directors, so that only approximately
one-third of our directors are elected each year;
|
| |
| |
•
|
limitations on the removal of directors; and
|
26
|
|
|
| |
•
|
limitations on the ability of our stockholders to call special
meetings and establish advance notice provisions for stockholder
proposals and nominations for elections to the board of
directors to be acted upon at meetings of stockholders.
|
Delaware law prohibits us from engaging in any business
combination with any “interested stockholder,” meaning
generally that a stockholder who beneficially owns more than 15%
of our stock cannot acquire us for a period of three years from
the date this person became an interested stockholder, unless
various conditions are met, such as approval of the transaction
by our board of directors. We have opted out of this provision
of Delaware law until such time as Warburg Pincus and certain
transferees do not beneficially own at least 15% of our common
stock. Please read “Description of Our Capital
Stock—Anti-Takeover Effects of Provisions of Our Amended
and Restated Certificate of Incorporation, Our Amended and
Restated Bylaws and Delaware Law.”
Merrill Lynch,
Pierce, Fenner & Smith Incorporated may have a
conflict of interest with respect to this
offering.
Merrill Lynch Ventures L.P. 2001 (“ML Ventures”), an
affiliate of Merrill Lynch, Pierce, Fenner & Smith
Incorporated (“BofA Merrill Lynch”), an underwriter in
this offering, will receive more than 5% of the net proceeds of
the offering as a selling stockholder. Accordingly, BofA Merrill
Lynch’s interest may go beyond receiving customary
underwriting discounts and commissions. In particular, there may
be a conflict of interest between BofA Merrill Lynch’s own
interests as underwriter and the interests of its affiliate, ML
Ventures, as a selling stockholder. Because an affiliate of BofA
Merrill Lynch will receive more than 5% of the net proceeds,
this offering is being conducted in accordance with FINRA
Rule 5121. This rule requires, among other things, that a
qualified independent underwriter has participated in the
preparation of, and has exercised the usual standards of due
diligence with respect to, this prospectus and the registration
statement of which this prospectus is a part. Accordingly,
Barclays Capital Inc. (“Barclays Capital”) is assuming
the responsibilities of acting as the qualified independent
underwriter in this offering. Although the qualified independent
underwriter has participated in the preparation of the
registration statement and prospectus and conducted due
diligence, we cannot assure you that this will adequately
address any potential conflicts of interest related to BofA
Merrill Lynch and ML Ventures. We have agreed to indemnify
Barclays Capital for acting as qualified independent underwriter
against certain liabilities, including liabilities under the
Securities Act of 1933 (the “Securities Act”) and to
contribute to payments that Barclays Capital may be required to
make for these liabilities.
We have a
significant stockholder, which will limit your ability to
influence corporate matters and may give rise to conflicts of
interest.
Upon completion of this offering, affiliates of Warburg Pincus
will beneficially own
approximately % of our outstanding
common stock. See “Security Ownership of Management and
Selling Stockholders.” Accordingly, Warburg Pincus exerts
influence over us and any action requiring the approval of the
holders of our stock, including the election of directors and
approval of significant corporate transactions. Warburg’s
concentrated ownership makes it less likely that any other
holder or group of holders of common stock will be able to
affect the way we are managed or the direction of our business.
These factors also may delay or prevent a change in our
management or voting control.
Furthermore, conflicts of interest could arise in the future
between us, on the one hand, and Warburg Pincus and its
affiliates, on the other hand, concerning among other things,
potential competitive business activities, business
opportunities, the issuance of additional securities, the
payment of dividends by us and other matters. Warburg Pincus is
a private equity firm that has invested, among other things, in
companies in the energy industry. As a result, Warburg
Pincus’ existing and future portfolio companies which it
controls may compete with us for investment or business
opportunities. These conflicts of interest may not be resolved
in our favor.
27
In our amended
and restated certificate of incorporation, we have renounced
business opportunities that may be pursued by the Partnership or
by affiliated stockholders that currently hold a significant
amount of our common stock.
In our restated charter and in accordance with Delaware law, we
have renounced any interest or expectancy we may have in, or
being offered an opportunity to participate in, any business
opportunities, including any opportunities within those classes
of opportunity currently pursued by the Partnership, presented
to Warburg Pincus or any private fund that it manages or
advises, their affiliates (other than us and our subsidiaries),
their officers, directors, partners, employees or other agents
who serve as one of our directors, Merrill Lynch Ventures L.P.
2001, its affiliates (other than us and our subsidiaries), and
any portfolio company in which such entities or persons has an
equity investment (other than us and our subsidiaries)
participates or desires or seeks to participate in and that
involves any aspect of the energy business or industry. Please
read “Description of Our Capital Stock—Corporate
Opportunity.”
The duties of
our officers and directors may conflict with those owed to the
Partnership and these officers and directors may face conflicts
of interest in the allocation of administrative time among our
business and the Partnership’s business.
Substantially all of our officers and certain members of our
board of directors are officers or directors of the General
Partner and, as a result, have separate duties that govern their
management of the Partnership’s business. These officers
and directors may encounter situations in which their
obligations to us, on the one hand, and the Partnership, on the
other hand, are in conflict. For a description of how these
conflicts will be resolved, please read “Certain
Relationships and Related Transactions—Conflicts of
Interest.” The resolution of these conflicts may not always
be in our best interest or that of our stockholders.
In addition, our officers who also serve as officers of the
General Partner may face conflicts in allocating their time
spent on our behalf and on behalf of the Partnership. These time
allocations may adversely affect our or the Partnership’s
results of operations, cash flows, and financial condition. For
a discussion of our officers and directors that will serve in
the same capacity for the General Partner and the amount of time
we expect them to devote to our business, please read
“Management.”
The U.S.
federal income tax rate on dividend income is scheduled to
increase in 2013.
Our distributions to our stockholders will constitute dividends
for U.S. federal income tax purposes to the extent such
distributions are paid from our current or accumulated earnings
and profits, as determined under U.S. federal income tax
principles. Dividends received by certain non-corporate
U.S. stockholders, including individuals, are subject to a
reduced maximum federal tax rate of 15% for taxable years
beginning on or before December 31, 2012. However, for
taxable years beginning after December 31, 2012, dividends
received by such non-corporate U.S. stockholders will be taxed
at the rate applicable to ordinary income of individuals, which
is scheduled to increase to a maximum of 39.6%.
Risks Inherent in
the Partnership’s Business
Because we are directly dependent on the distributions we
receive from the Partnership, risks to the Partnership’s
operations are also risks to us. We have set forth below risks
to the Partnership’s business and operations, the
occurrence of which could negatively impact the
Partnership’s financial performance and decrease the amount
of cash it is able to distribute to us.
The
Partnership has a substantial amount of indebtedness which may
adversely affect its financial position.
The Partnership has a substantial amount of indebtedness. As of
December 31, 2010, the Partnership had approximately
$765.3 million of borrowings outstanding under its senior
secured credit facility, approximately $101.3 million of
letters of credit outstanding and approximately
$233.4 million of additional borrowing capacity under its
senior secured credit facility. The Partnership’s
$1.1 billion senior secured revolving credit facility
allows it to request increases in commitments up to an
additional
28
$300 million. For the years ended December 31, 2008,
2009 and 2010, the Partnership’s consolidated interest
expense was $156.1 million, $159.8 million and
$110.8 million.
This substantial level of indebtedness increases the possibility
that the Partnership may be unable to generate cash sufficient
to pay, when due, the principal of, interest on or other amounts
due in respect of indebtedness. This substantial indebtedness,
combined with the Partnership’s lease and other financial
obligations and contractual commitments, could have other
important consequences to us, including the following:
|
|
|
| |
•
|
the Partnership’s ability to obtain additional financing,
if necessary, for working capital, capital expenditures,
acquisitions or other purposes may be impaired or such financing
may not be available on favorable terms;
|
| |
| |
•
|
satisfying the Partnership’s obligations with respect to
indebtedness may be more difficult and any failure to comply
with the obligations of any debt instruments could result in an
event of default under the agreements governing such
indebtedness;
|
| |
| |
•
|
the Partnership will need a portion of cash flow to make
interest payments on debt, reducing the funds that would
otherwise be available for operations and future business
opportunities;
|
| |
| |
•
|
the Partnership’s debt level will make it more vulnerable
to competitive pressures or a downturn in its business or the
economy generally; and
|
| |
| |
•
|
the Partnership’s debt level may limit flexibility in
planning for, or responding to, changing business and economic
conditions.
|
The Partnership’s ability to service its debt will depend
upon, among other things, its future financial and operating
performance, which will be affected by prevailing economic
conditions and financial, business, regulatory and other
factors, some of which are beyond its control. If the
Partnership’s operating results are not sufficient to
service its current or future indebtedness, it will be forced to
take actions such as reducing or delaying business activities,
acquisitions, investments or capital expenditures, selling
assets, restructuring or refinancing debt, or seeking additional
equity capital and may adversely affect the Partnership’s
ability to make cash distributions. The Partnership may not be
able to effect any of these actions on satisfactory terms, or at
all.
Increases in
interest rates could adversely affect the Partnership’s
business.
The Partnership has significant exposure to increases in
interest rates. As of December 31, 2010, its total
indebtedness was $1,445.4 million, of which
$680.1 million was at fixed interest rates and
$765.3 million was at variable interest rates. After giving
effect to interest rate swaps with a notional amount of
$300 million, a one percentage point increase in the
interest rate on the Partnership’s variable interest rate
debt would have increased its consolidated annual interest
expense by approximately $4.7 million. As a result of this
significant amount of variable interest rate debt, the
Partnership’s financial condition could be adversely
affected by significant increases in interest rates.
Despite
current indebtedness levels, the Partnership may still be able
to incur substantially more debt. This could increase the risks
associated with its substantial leverage.
The Partnership may be able to incur substantial additional
indebtedness in the future. As of December 31, 2010, the
Partnership had approximately $765.3 million of borrowings
outstanding under its senior secured credit facility,
approximately, $101.3 million of letters of credit
outstanding and approximately $233.4 million of additional
borrowing capacity under its senior secured credit facility. The
Partnership may be able to incur an additional $300 million
of debt under its senior secured credit facility if it requests
and is able to obtain commitments for the additional
$300 million available under its senior secured credit
facility. Although the Partnership’s senior secured credit
facility contains restrictions on the incurrence of additional
indebtedness, these restrictions are subject to a number of
significant qualifications and exceptions, and any indebtedness
incurred in compliance with these restrictions could be
29
substantial. If the Partnership incurs additional debt, the
risks associated with its substantial leverage would increase.
The terms of
the Partnership’s senior secured credit facility and
indentures may restrict its current and future operations,
particularly its ability to respond to changes in business or to
take certain actions.
The credit agreement governing the Partnership’s senior
secured credit facility and the indentures governing the
Partnership’s senior notes (other than its
111/4% senior
notes due 2017) contain, and any future indebtedness the
Partnership incurs will likely contain, a number of restrictive
covenants that impose significant operating and financial
restrictions, including restrictions on its ability to engage in
acts that may be in its best long-term interests. These
agreements include covenants that, among other things, restrict
the Partnership’s ability to:
|
|
|
| |
•
|
incur or guarantee additional indebtedness or issue preferred
stock;
|
| |
| |
•
|
pay distributions on its equity securities or redeem, repurchase
or retire its equity securities or subordinated indebtedness;
|
| |
| |
•
|
make investments;
|
| |
| |
•
|
create restrictions on the payment of distributions to its
equity holders;
|
| |
| |
•
|
sell assets, including equity securities of its subsidiaries;
|
| |
| |
•
|
engage in affiliate transactions;
|
| |
| |
•
|
consolidate or merge;
|
| |
| |
•
|
incur liens;
|
| |
| |
•
|
prepay, redeem and repurchase certain debt, other than loans
under the senior secured credit facility;
|
| |
| |
•
|
make certain acquisitions;
|
| |
| |
•
|
transfer assets;
|
| |
| |
•
|
enter into sale and lease back transactions;
|
| |
| |
•
|
make capital expenditures;
|
| |
| |
•
|
amend debt and other material agreements; and
|
| |
| |
•
|
change business activities conducted by it.
|
In addition, the Partnership’s senior secured credit
facility requires it to satisfy and maintain specified financial
ratios and other financial condition tests. The
Partnership’s ability to meet those financial ratios and
tests can be affected by events beyond its control, and we
cannot assure you that the Partnership will meet those ratios
and tests.
A breach of any of these covenants could result in an event of
default under the Partnership’s senior secured credit
facility and indentures, as applicable. Upon the occurrence of
such an event of default, all amounts outstanding under the
applicable debt agreements could be declared to be immediately
due and payable and all applicable commitments to extend further
credit could be terminated. If the Partnership is unable to
repay the accelerated debt under its senior secured credit
facility, the lenders under senior secured credit facility could
proceed against the collateral granted to them to secure that
indebtedness. The Partnership has pledged substantially all of
its assets as collateral under its senior secured credit
facility. If the Partnership indebtedness under its senior
secured credit facility or indentures is accelerated, we cannot
assure you that the Partnership will have sufficient assets to
repay the indebtedness. The operating and financial restrictions
and covenants in these debt agreements and any future financing
agreements may
30
adversely affect the Partnership’s ability to finance
future operations or capital needs or to engage in other
business activities.
The
Partnership’s cash flow is affected by supply and demand
for natural gas and NGL products and by natural gas and NGL
prices, and decreases in these prices could adversely affect its
results of operations and financial condition.
The Partnership’s operations can be affected by the level
of natural gas and NGL prices and the relationship between these
prices. The prices of oil, natural gas and NGLs have been
volatile and we expect this volatility to continue. The
Partnership’s future cash flow may be materially adversely
affected if it experiences significant, prolonged pricing
deterioration. The markets and prices for natural gas and NGLs
depend upon factors beyond the Partnership’s control. These
factors include demand for these commodities, which fluctuate
with changes in market and economic conditions and other
factors, including:
|
|
|
| |
•
|
the impact of seasonality and weather;
|
| |
| |
•
|
general economic conditions and economic conditions impacting
the Partnership’s primary markets;
|
| |
| |
•
|
the economic conditions of the Partnership’s customers;
|
| |
| |
•
|
the level of domestic crude oil and natural gas production and
consumption;
|
| |
| |
•
|
the availability of imported natural gas, liquefied natural gas,
NGLs and crude oil;
|
| |
| |
•
|
actions taken by foreign oil and gas producing nations;
|
| |
| |
•
|
the availability of local, intrastate and interstate
transportation systems and storage for residue natural gas and
NGLs;
|
| |
| |
•
|
the availability and marketing of competitive fuels
and/or
feedstocks;
|
| |
| |
•
|
the impact of energy conservation efforts; and
|
| |
| |
•
|
the extent of governmental regulation and taxation.
|
The Partnership’s primary natural gas gathering and
processing arrangements that expose it to commodity price risk
are its
percent-of-proceeds
arrangements. For the year ended December 31, 2010 and
2009, its
percent-of-proceeds
arrangements accounted for approximately 38% and 48% of its
gathered natural gas volume. Under these arrangements, the
Partnership generally processes natural gas from producers and
remits to the producers an agreed percentage of the proceeds
from the sale of residue gas and NGL products at market prices
or a percentage of residue gas and NGL products at the tailgate
of its processing facilities. In some
percent-of-proceeds
arrangements, the Partnership remits to the producer a
percentage of an index-based price for residue gas and NGL
products, less agreed adjustments, rather than remitting a
portion of the actual sales proceeds. Under these types of
arrangements, the Partnership’s revenues and its cash flows
increase or decrease, whichever is applicable, as the price of
natural gas, NGLs and crude oil fluctuates. Please see
“Management’s Discussion and Analysis of Financial
Condition and Results of Operations—Quantitative and
Qualitative Disclosures about Market Risk.”
Because of the
natural decline in production in the Partnership’s
operating regions and in other regions from which it sources NGL
supplies, the Partnership’s long-term success depends on
its ability to obtain new sources of supplies of natural gas and
NGLs, which depends on certain factors beyond its control. Any
decrease in supplies of natural gas or NGLs could adversely
affect the Partnership’s business and operating
results.
The Partnership’s gathering systems are connected to oil
and natural gas wells from which production will naturally
decline over time, which means that its cash flows associated
with these sources of natural gas will likely also decline over
time. The Partnership’s logistics assets are similarly
31
impacted by declines in NGL supplies in the regions in which the
Partnership operates as well as other regions from which it
sources NGLs. To maintain or increase throughput levels on its
gathering systems and the utilization rate at its processing
plants and its treating and fractionation facilities, the
Partnership must continually obtain new natural gas and NGL
supplies. A material decrease in natural gas production from
producing areas on which the Partnership relies, as a result of
depressed commodity prices or otherwise, could result in a
decline in the volume of natural gas that it processes and NGL
products delivered to its fractionation facilities. The
Partnership’s ability to obtain additional sources of
natural gas and NGLs depends, in part, on the level of
successful drilling and production activity near its gathering
systems and, in part, on the level of successful drilling and
production in other areas from which it sources NGL supplies.
The Partnership has no control over the level of such activity
in the areas of its operations, the amount of reserves
associated with the wells or the rate at which production from a
well will decline. In addition, the Partnership has no control
over producers or their drilling or production decisions, which
are affected by, among other things, prevailing and projected
energy prices, demand for hydrocarbons, the level of reserves,
geological considerations, governmental regulations,
availability of drilling rigs, other production and development
costs and the availability and cost of capital.
Fluctuations in energy prices can greatly affect production
rates and investments by third parties in the development of new
oil and natural gas reserves. Drilling and production activity
generally decreases as oil and natural gas prices decrease.
Prices of oil and natural gas have been historically volatile,
and the Partnership expects this volatility to continue.
Consequently, even if new natural gas reserves are discovered in
areas served by the Partnership’s assets, producers may
choose not to develop those reserves. Reductions in exploration
and production activity, competitor actions or shut-ins by
producers in the areas in which the Partnership operates may
prevent it from obtaining supplies of natural gas to replace the
natural decline in volumes from existing wells, which could
result in reduced volumes through its facilities, and reduced
utilization of its gathering, treating, processing and
fractionation assets.
If the
Partnership does not make acquisitions on economically
acceptable terms or efficiently and effectively integrate the
acquired assets with its asset base, its future growth will be
limited.
The Partnership’s ability to grow depends, in part, on its
ability to make acquisitions that result in an increase in cash
generated from operations per unit. The Partnership is unable to
acquire businesses from us in order to grow because our only
assets are the interests in the Partnership that we own. As a
result, it will need to focus on third-party acquisitions and
organic growth. If the Partnership is unable to make these
accretive acquisitions either because the Partnership is
(1) unable to identify attractive acquisition candidates or
negotiate acceptable purchase contracts with them,
(2) unable to obtain financing for these acquisitions on
economically acceptable terms or (3) outbid by competitors,
then its future growth and ability to increase distributions
will be limited.
Any acquisition involves potential risks, including, among other
things:
|
|
|
| |
•
|
operating a significantly larger combined organization and
adding operations;
|
| |
| |
•
|
difficulties in the assimilation of the assets and operations of
the acquired businesses, especially if the assets acquired are
in a new business segment or geographic area;
|
| |
| |
•
|
the risk that natural gas reserves expected to support the
acquired assets may not be of the anticipated magnitude or may
not be developed as anticipated;
|
| |
| |
•
|
the failure to realize expected volumes, revenues, profitability
or growth;
|
| |
| |
•
|
the failure to realize any expected synergies and cost savings;
|
| |
| |
•
|
coordinating geographically disparate organizations, systems and
facilities.
|
| |
| |
•
|
the assumption of unknown liabilities;
|
| |
| |
•
|
limitations on rights to indemnity from the seller;
|
32
|
|
|
| |
•
|
inaccurate assumptions about the overall costs of equity or debt;
|
| |
| |
•
|
the diversion of management’s and employees’ attention
from other business concerns; and
|
| |
| |
•
|
customer or key employee losses at the acquired businesses.
|
If these risks materialize, the acquired assets may inhibit the
Partnership’s growth, fail to deliver expected benefits and
add further unexpected costs. Challenges may arise whenever
businesses with different operations or management are combined
and the Partnership may experience unanticipated delays in
realizing the benefits of an acquisition. If the Partnership
consummates any future acquisition, its capitalization and
results of operations may change significantly and you may not
have the opportunity to evaluate the economic, financial and
other relevant information that the Partnership will consider in
evaluating future acquisitions.
The Partnership’s acquisition strategy is based, in part,
on its expectation of ongoing divestitures of energy assets by
industry participants. A material decrease in such divestitures
would limit its opportunities for future acquisitions and could
adversely affect its operations and cash flows available for
distribution to its unitholders.
Acquisitions may significantly increase the Partnership’s
size and diversify the geographic areas in which it operates.
The Partnership may not achieve the desired affect from any
future acquisitions.
The
Partnership’s construction of new assets may not result in
revenue increases and is subject to regulatory, environmental,
political, legal and economic risks, which could adversely
affect its results of operations and financial
condition.
One of the ways the Partnership intends to grow its business is
through the construction of new midstream assets. The
construction of additions or modifications to the
Partnership’s existing systems and the construction of new
midstream assets involves numerous regulatory, environmental,
political and legal uncertainties beyond the Partnership’s
control and may require the expenditure of significant amounts
of capital. If the Partnership undertakes these projects, they
may not be completed on schedule or at the budgeted cost or at
all. Moreover, the Partnership’s revenues may not increase
immediately upon the expenditure of funds on a particular
project. For instance, if the Partnership builds a new pipeline,
the construction may occur over an extended period of time and
it will not receive any material increases in revenues until the
project is completed. Moreover, it may construct facilities to
capture anticipated future growth in production in a region in
which such growth does not materialize. Since the Partnership is
not engaged in the exploration for and development of natural
gas and oil reserves, it does not possess reserve expertise and
it often does not have access to third party estimates of
potential reserves in an area prior to constructing facilities
in such area. To the extent the Partnership relies on estimates
of future production in its decision to construct additions to
its systems, such estimates may prove to be inaccurate because
there are numerous uncertainties inherent in estimating
quantities of future production. As a result, new facilities may
not be able to attract enough throughput to achieve the
Partnership’s expected investment return, which could
adversely affect its results of operations and financial
condition. In addition, the construction of additions to the
Partnership’s existing gathering and transportation assets
may require it to obtain new
rights-of-way
prior to constructing new pipelines. The Partnership may be
unable to obtain such
rights-of-way
to connect new natural gas supplies to its existing gathering
lines or capitalize on other attractive expansion opportunities.
Additionally, it may become more expensive for the Partnership
to obtain new
rights-of-way
or to renew existing
rights-of-way.
If the cost of renewing or obtaining new
rights-of-way
increases, the Partnership’s cash flows could be adversely
affected.
The
Partnership’s acquisition strategy requires access to new
capital. Tightened capital markets or increased competition for
investment opportunities could impair its ability to grow
through acquisitions.
The Partnership continuously considers and enters into
discussions regarding potential acquisitions. Any limitations on
its access to capital will impair its ability to execute this
strategy. If the
33
cost of such capital becomes too expensive, its ability to
develop or acquire strategic and accretive assets will be
limited. The Partnership may not be able to raise the necessary
funds on satisfactory terms, if at all. The primary factors that
influence the Partnership’s initial cost of equity include
market conditions, fees it pays to underwriters and other
offering costs, which include amounts it pays for legal and
accounting services. The primary factors influencing the
Partnership’s cost of borrowing include interest rates,
credit spreads, covenants, underwriting or loan origination fees
and similar charges it pays to lenders.
Weak economic conditions and the volatility and disruption in
the financial markets could increase the cost of raising money
in the debt and equity capital markets substantially while
diminishing the availability of funds from those markets. Also,
as a result of concerns about the stability of financial markets
generally and the solvency of counterparties specifically, the
cost of obtaining money from the credit markets generally has
increased as many lenders and institutional investors have
increased interest rates, enacted tighter lending standards,
refused to refinance existing debt at maturity at all or on
terms similar to our current debt and reduced and, in some
cases, ceased to provide funding to borrowers. These factors may
impair the Partnership’s ability to execute its acquisition
strategy.
In addition, the Partnership is experiencing increased
competition for the types of assets it contemplates purchasing.
Weak economic conditions and competition for asset purchases
could limit the Partnership’s ability to fully execute its
growth strategy.
Demand for
propane is seasonal and requires increases in the
Partnership’s inventory to meet seasonal
demand.
Weather conditions have a significant impact on the demand for
propane because end-users depend on propane principally for
heating purposes.
Warmer-than-normal
temperatures in one or more regions in which the Partnership
operates can significantly decrease the total volume of propane
it sells. Lack of consumer demand for propane may also adversely
affect the retailers with which the Partnership transacts in its
wholesale propane marketing operations, exposing it to their
inability to satisfy their contractual obligations to the
Partnership.
If the
Partnership fails to balance its purchases of natural gas and
its sales of residue gas and NGLs, its exposure to commodity
price risk will increase.
The Partnership may not be successful in balancing its purchases
of natural gas and its sales of residue gas and NGLs. In
addition, a producer could fail to deliver promised volumes to
the Partnership or deliver in excess of contracted volumes, or a
purchaser could purchase less than contracted volumes. Any of
these actions could cause an imbalance between the
Partnership’s purchases and sales. If the
Partnership’s purchases and sales are not balanced, it will
face increased exposure to commodity price risks and could have
increased volatility in its operating income.
The
Partnership’s hedging activities may not be effective in
reducing the variability of its cash flows and may, in certain
circumstances, increase the variability of its cash flows.
Moreover, the Partnership’s hedges may not fully protect it
against volatility in basis differentials. Finally, the
percentage of the Partnership’s expected equity commodity
volumes that are hedged decreases substantially over
time.
The Partnership has entered into derivative transactions related
to only a portion of its equity volumes. As a result, it will
continue to have direct commodity price risk to the unhedged
portion. The Partnership’s actual future volumes may be
significantly higher or lower than it estimated at the time it
entered into the derivative transactions for that period. If the
actual amount is higher than it estimated, it will have greater
commodity price risk than it intended. If the actual amount is
lower than the amount that is subject to its derivative
financial instruments, it might be forced to satisfy all or a
portion of its derivative transactions without the benefit of
the cash flow from its sale of the underlying physical
commodity. The percentages of the Partnership’s expected
equity volumes that are covered by its hedges decrease over
time. To the extent the Partnership hedges its commodity price
risk, it may forego the benefits it would
34
otherwise experience if commodity prices were to change in its
favor. The derivative instruments the Partnership utilizes for
these hedges are based on posted market prices, which may be
higher or lower than the actual natural gas, NGLs and condensate
prices that it realizes in its operations. These pricing
differentials may be substantial and could materially impact the
prices the Partnership ultimately realizes. In addition, current
market and economic conditions may adversely affect the
Partnership’s hedge counterparties’ ability to meet
their obligations. Given the current volatility in the financial
and commodity markets, the Partnership may experience defaults
by its hedge counterparties in the future. As a result of these
and other factors, the Partnership’s hedging activities may
not be as effective as it intends in reducing the variability of
its cash flows, and in certain circumstances may actually
increase the variability of its cash flows. Please see
“Management’s Discussion and Analysis of Financial
Condition and Results of Operations—Quantitative and
Qualitative Disclosures about Market Risk.”
If third-party
pipelines and other facilities interconnected to the
Partnership’s natural gas pipelines and processing
facilities become partially or fully unavailable to transport
natural gas and NGLs, the Partnership’s revenues could be
adversely affected.
The Partnership depends upon third-party pipelines, storage and
other facilities that provide delivery options to and from its
pipelines and processing facilities. Since it does not own or
operate these pipelines or other facilities, their continuing
operation in their current manner is not within the
Partnership’s control. If any of these third-party
facilities become partially or fully unavailable, or if the
quality specifications for their facilities change so as to
restrict the Partnership’s ability to utilize them, its
revenues could be adversely affected.
The
Partnership’s industry is highly competitive, and increased
competitive pressure could adversely affect the
Partnership’s business and operating results.
The Partnership competes with similar enterprises in its
respective areas of operation. Some of its competitors are large
oil, natural gas and natural gas liquid companies that have
greater financial resources and access to supplies of natural
gas and NGLs than it does. Some of these competitors may expand
or construct gathering, processing and transportation systems
that would create additional competition for the services the
Partnership provides to its customers. In addition, its
customers who are significant producers of natural gas may
develop their own gathering, processing and transportation
systems in lieu of using the Partnership’s. The
Partnership’s ability to renew or replace existing
contracts with its customers at rates sufficient to maintain
current revenues and cash flows could be adversely affected by
the activities of its competitors and its customers. All of
these competitive pressures could have a material adverse effect
on the Partnership’s business, results of operations, and
financial condition.
The
Partnership typically does not obtain independent evaluations of
natural gas reserves dedicated to its gathering pipeline
systems; therefore, volumes of natural gas on the
Partnership’s systems in the future could be less than it
anticipates.
The Partnership typically does not obtain independent
evaluations of natural gas reserves connected to its gathering
systems due to the unwillingness of producers to provide reserve
information as well as the cost of such evaluations.
Accordingly, the Partnership does not have independent estimates
of total reserves dedicated to its gathering systems or the
anticipated life of such reserves. If the total reserves or
estimated life of the reserves connected to its gathering
systems is less than it anticipates and the Partnership is
unable to secure additional sources of natural gas, then the
volumes of natural gas transported on its gathering systems in
the future could be less than it anticipates. A decline in the
volumes of natural gas on the Partnership’s systems could
have a material adverse effect on its business, results of
operations, and financial condition.
35
A reduction in
demand for NGL products by the petrochemical, refining or other
industries or by the fuel markets, or a significant increase in
NGL product supply relative to this demand, could materially
adversely affect the Partnership’s business, results of
operations and financial condition.
The NGL products the Partnership produces have a variety of
applications, including as heating fuels, petrochemical
feedstocks and refining blend stocks. A reduction in demand for
NGL products, whether because of general or industry specific
economic conditions, new government regulations, global
competition, reduced demand by consumers for products made with
NGL products (for example, reduced petrochemical demand observed
due to lower activity in the automobile and construction
industries), increased competition from petroleum-based
feedstocks due to pricing differences, mild winter weather for
some NGL applications or other reasons, could result in a
decline in the volume of NGL products the Partnership handles or
reduce the fees it charges for its services. Also, increased
supply of NGL products could reduce the value of NGLs handled by
the Partnership and reduce the margins realized. The
Partnership’s NGL products and their demand are affected as
follows:
Ethane. Ethane is typically supplied as purity
ethane and as part of ethane-propane mix. Ethane is primarily
used in the petrochemical industry as feedstock for ethylene,
one of the basic building blocks for a wide range of plastics
and other chemical products. Although ethane is typically
extracted as part of the mixed NGL stream at gas processing
plants, if natural gas prices increase significantly in relation
to NGL product prices or if the demand for ethylene falls, it
may be more profitable for natural gas processors to leave the
ethane in the natural gas stream thereby reducing the volume of
NGLs delivered for fractionation and marketing.
Propane. Propane is used as a petrochemical
feedstock in the production of ethylene and propylene, as a
heating, engine and industrial fuel, and in agricultural
applications such as crop drying. Changes in demand for ethylene
and propylene could adversely affect demand for propane. The
demand for propane as a heating fuel is significantly affected
by weather conditions. The volume of propane sold is at its
highest during the six-month peak heating season of October
through March. Demand for the Partnership’s propane may be
reduced during periods of
warmer-than-normal
weather.
Normal Butane. Normal butane is used in the
production of isobutane, as a refined product blending
component, as a fuel gas, either alone or in a mixture with
propane, and in the production of ethylene and propylene.
Changes in the composition of refined products resulting from
governmental regulation, changes in feedstocks, products and
economics, demand for heating fuel and for ethylene and
propylene could adversely affect demand for normal butane.
Isobutane. Isobutane is predominantly used in
refineries to produce alkylates to enhance octane levels.
Accordingly, any action that reduces demand for motor gasoline
or demand for isobutane to produce alkylates for octane
enhancement might reduce demand for isobutane.
Natural Gasoline. Natural gasoline is used as
a blending component for certain refined products and as a
feedstock used in the production of ethylene and propylene.
Changes in the mandated composition of motor gasoline resulting
from governmental regulation and in demand for ethylene and
propylene could adversely affect demand for natural gasoline.
NGLs and products produced from NGLs also compete with products
from global markets. Any reduced demand or increased supply for
ethane, propane, normal butane, isobutane or natural gasoline in
the markets the Partnership’s accesses for any of the
reasons stated above could adversely affect demand for the
services it provides as well as NGL prices, which would
negatively impact the Partnership’s results of operations
and financial condition.
36
The
Partnership has significant relationships with Chevron Phillips
Chemical Company LLC as a customer for its marketing and
refinery services. In some cases, these agreements are subject
to renegotiation and termination rights.
For the years ended December 31, 2010 and 2009,
approximately 10% and 15% of the Partnership’s consolidated
revenues were derived from transactions with Chevron Phillips
Chemical Company LLC (“CPC”). Under many of the
Partnership’s CPC contracts where it purchases or markets
NGLs on CPC’s behalf, CPC may elect to terminate the
contracts or renegotiate the price terms. To the extent CPC
reduces the volumes of NGLs that it purchases from the
Partnership or reduces the volumes of NGLs that the Partnership
markets on its behalf, or to the extent the economic terms of
such contracts are changed, the Partnership’s revenues and
cash available for debt service could decline.
The tax
treatment of the Partnership depends on its status as a
partnership for federal income tax purposes as well as its not
being subject to a material amount of entity-level taxation by
individual states. If the Internal Revenue Service
(“IRS”) were to treat the Partnership as a corporation
for federal income tax purposes or the Partnership becomes
subject to a material amount of entity-level taxation for state
tax purposes, then its cash available for distribution to its
unitholders, including us, would be substantially
reduced.
We currently own an approximate 13.5% limited partner interest,
a 2% general partner interest and the IDRs in the Partnership.
The anticipated after-tax economic benefit of our investment in
the Partnership depends largely on its being treated as a
partnership for federal income tax purposes. In order to
maintain its status as a partnership for United States federal
income tax purposes, 90 percent or more of the gross income
of the Partnership for every taxable year must be
“qualifying income” under section 7704 of the
Internal Revenue Code of 1986, as amended. The Partnership has
not requested and does not plan to request a ruling from the IRS
with respect to its treatment as a partnership for federal
income tax purposes.
Despite the fact that the Partnership is a limited partnership
under Delaware law, it is possible, under certain circumstances
for an entity such as the Partnership to be treated as a
corporation for federal income tax purposes. Although the
Partnership does not believe based upon its current operations
that it is so treated, a change in the Partnership’s
business could cause it to be treated as a corporation for
federal income tax purposes or otherwise subject it to federal
income taxation as an entity.
If the Partnership were treated as a corporation for federal
income tax purposes, it would pay federal income tax on its
taxable income at the corporate tax rate, which is currently a
maximum of 35%, and would likely pay state income tax at varying
rates. Distributions to the Partnership’s unitholders,
including us, would generally be taxed again as corporate
distributions and no income, gains, losses or deductions would
flow through to the Partnership’s unitholders, including
us. If such tax was imposed upon the Partnership as a
corporation, its cash available for distribution would be
substantially reduced. Therefore, treatment of the Partnership
as a corporation would result in a material reduction in the
anticipated cash flow and after-tax return to the
Partnership’s unitholders, including us, and would likely
cause a substantial reduction in the value of our investment in
the Partnership.
In addition, current law may change so as to cause the
Partnership to be treated as a corporation for federal income
tax purposes or otherwise subject the Partnership to
entity-level taxation for state or local income tax purposes. At
the federal level, members of Congress have recently considered
legislative changes that would affect the tax treatment of
certain publicly traded partnerships. Although the considered
legislation would not appear to have affected the
Partnership’s treatment as a partnership, we are unable to
predict whether any of these changes, or other proposals will be
reintroduced or will ultimately be enacted. Moreover, any
modification to the federal income tax laws and interpretations
thereof may or may not be applied retroactively. Any such
changes could negatively impact the value of an investment in
the Partnership’s common units. At the state level, because
of widespread state budget deficits and other reasons, several
states are evaluating ways to subject partnerships to
entity-level taxation through the imposition of state income,
franchise and other forms of taxation. For example, the
Partnership is required to pay Texas franchise tax at a maximum
effective rate of 0.7% of its gross income apportioned
37
to Texas in the prior year. Imposition of any similar tax on the
Partnership by additional states would reduce the cash available
for distribution to Partnership unitholders, including us.
The Partnership’s partnership agreement provides that if a
law is enacted or existing law is modified or interpreted in a
manner that subjects it to taxation as a corporation or
otherwise subjects it to entity-level taxation for federal,
state or local income tax purposes, the minimum quarterly
distribution and the target distribution amounts may be adjusted
to reflect the impact of that law on the Partnership.
The
Partnership does not own most of the land on which its pipelines
and compression facilities are located, which could disrupt its
operations.
The Partnership does not own most of the land on which its
pipelines and compression facilities are located, and the
Partnership is therefore subject to the possibility of more
onerous terms
and/or
increased costs to retain necessary land use if it does not have
valid
rights-of-way
or leases or if such
rights-of-way
or leases lapse or terminate. The Partnership sometimes obtains
the rights to land owned by third parties and governmental
agencies for a specific period of time. The Partnership’s
loss of these rights, through its inability to renew
right-of-way
contracts, leases or otherwise, could cause it to cease
operations on the affected land, increase costs related to
continuing operations elsewhere, and reduce its revenue.
The
Partnership may be unable to cause its majority-owned joint
ventures to take or not to take certain actions unless some or
all of its joint venture participants agree.
The Partnership participates in several majority-owned joint
ventures whose corporate governance structures require at least
a majority in interest vote to authorize many basic activities
and require a greater voting interest (sometimes up to 100%) to
authorize more significant activities. Examples of these more
significant activities are large expenditures or contractual
commitments, the construction or acquisition of assets,
borrowing money or otherwise raising capital, making
distributions, transactions with affiliates of a joint venture
participant, litigation and transactions not in the ordinary
course of business, among others. Without the concurrence of
joint venture participants with enough voting interests, the
Partnership may be unable to cause any of its joint ventures to
take or not take certain actions, even though taking or
preventing those actions may be in the best interest of the
Partnership or the particular joint venture.
In addition, subject to certain conditions, any joint venture
owner may sell, transfer or otherwise modify its ownership
interest in a joint venture, whether in a transaction involving
third parties or the other joint owners. Any such transaction
could result in the Partnership partnering with different or
additional parties.
Weather may
limit the Partnership’s ability to operate its business and
could adversely affect its operating results.
The weather in the areas in which the Partnership operates can
cause disruptions and in some cases suspension of its
operations. For example, unseasonably wet weather, extended
periods of below-freezing weather and hurricanes may cause
disruptions or suspensions of the Partnership’s operations,
which could adversely affect its operating results.
38
The
Partnership’s business involves many hazards and
operational risks, some of which may not be insured or fully
covered by insurance. If a significant accident or event occurs
that is not fully insured, if the Partnership fails to recover
all anticipated insurance proceeds for significant accidents or
events for which it is insured, or if it fails to rebuild
facilities damaged by such accidents or events, its operations
and financial results could be adversely affected.
The Partnership’s operations are subject to many hazards
inherent in gathering, compressing, treating, processing and
selling natural gas and storing, fractionating, treating,
transporting and selling NGLs, including:
|
|
|
| |
•
|
damage to pipelines and plants, related equipment and
surrounding properties caused by hurricanes, tornadoes, floods,
fires and other natural disasters, explosions and acts of
terrorism;
|
| |
| |
•
|
inadvertent damage from third parties, including from
construction, farm and utility equipment;
|
| |
| |
•
|
leaks of natural gas, NGLs and other hydrocarbons or losses of
natural gas or NGLs as a result of the malfunction of equipment
or facilities; and
|
| |
| |
•
|
other hazards that could also result in personal injury and loss
of life, pollution and suspension of operations.
|
These risks could result in substantial losses due to personal
injury, loss of life, severe damage to and destruction of
property and equipment and pollution or other environmental
damage and may result in curtailment or suspension of the
Partnership’s related operations. A natural disaster or
other hazard affecting the areas in which the Partnership
operates could have a material adverse effect on its operations.
For example, Hurricanes Katrina and Rita damaged gathering
systems, processing facilities, NGL fractionators and pipelines
along the Gulf Coast, including certain of the
Partnership’s facilities. These hurricanes disrupted the
operations of the Partnership’s customers in August and
September 2005, which curtailed or suspended the operations of
various energy companies with assets in the region. The
Louisiana and Texas Gulf Coast was similarly impacted in
September 2008 as a result of Hurricanes Gustav and Ike. The
Partnership is not fully insured against all risks inherent to
its business. The Partnership is not insured against all
environmental accidents that might occur which may include toxic
tort claims, other than incidents considered to be sudden and
accidental. If a significant accident or event occurs that is
not fully insured, if the Partnership fails to recover all
anticipated insurance proceeds for significant accidents or
events for which it is insured, or if it fails to rebuild
facilities damaged by such accidents or events, its operations
and financial condition could be adversely affected. In
addition, the Partnership may not be able to maintain or obtain
insurance of the type and amount it desires at reasonable rates.
As a result of market conditions, premiums and deductibles for
certain of the Partnership’s insurance policies have
increased substantially, and could escalate further. For
example, following Hurricanes Katrina and Rita, insurance
premiums, deductibles and co-insurance requirements increased
substantially, and terms were generally less favorable than
terms that could be obtained prior to such hurricanes. Insurance
market conditions worsened as a result of the losses sustained
from Hurricanes Gustav and Ike in September 2008. As a result,
the Partnership experienced further increases in deductibles and
premiums, and further reductions in coverage and limits, with
some coverages unavailable at any cost.
The
Partnership may incur significant costs and liabilities
resulting from pipeline integrity programs and related
repairs.
Pursuant to the Pipeline Safety Improvement Act of 2002, as
reauthorized and amended by the Pipeline Inspection, Protection,
Enforcement and Safety Act of 2006, the DOT, through the PHMSA,
has adopted regulations requiring pipeline operators to develop
integrity management programs for transmission pipelines located
where a leak or rupture could do the most harm in “high
consequence areas,” including high population areas, areas
that are sources of drinking water, ecological resource areas
that are unusually sensitive to environmental damage from a
pipeline release and commercially navigable
39
waterways, unless the operator effectively demonstrates by risk
assessment that the pipeline could not affect the area. The
regulations require operators of covered pipelines to:
|
|
|
| |
•
|
perform ongoing assessments of pipeline integrity;
|
| |
| |
•
|
identify and characterize applicable threats to pipeline
segments that could impact a high consequence area;
|
| |
| |
•
|
improve data collection, integration and analysis;
|
| |
| |
•
|
repair and remediate the pipeline as necessary; and
|
| |
| |
•
|
implement preventive and mitigating actions.
|
In addition, states have adopted regulations similar to existing
DOT regulations for intrastate gathering and transmission lines.
The Partnership currently estimates that it will incur an
aggregate cost of approximately $6.6 million between 2011
and 2013 to implement pipeline integrity management program
testing along certain segments of its natural gas and NGL
pipelines. This estimate does not include the costs, if any, of
any repair, remediation, preventative or mitigating actions that
may be determined to be necessary as a result of the testing
program, which costs could be substantial. At this time, the
Partnership cannot predict the ultimate cost of compliance with
applicable pipeline integrity management regulations, as the
cost will vary significantly depending on the number and extent
of any repairs found to be necessary as a result of the pipeline
integrity testing. The Partnership will continue its pipeline
integrity testing programs to assess and maintain the integrity
of its pipelines. The results of these tests could cause the
Partnership to incur significant and unanticipated capital and
operating expenditures for repairs or upgrades deemed necessary
to ensure the continued safe and reliable operations of its
pipelines.
Unexpected
volume changes due to production variability or to gathering,
plant or pipeline system disruptions may increase the
Partnership’s exposure to commodity price
movements.
The Partnership sells processed natural gas to third parties at
plant tailgates or at pipeline pooling points. Sales made to
natural gas marketers and end-users may be interrupted by
disruptions to volumes anywhere along the system. The
Partnership attempts to balance sales with volumes supplied from
processing operations, but unexpected volume variations due to
production variability or to gathering, plant or pipeline system
disruptions may expose the Partnership to volume imbalances
which, in conjunction with movements in commodity prices, could
materially impact the Partnership’s income from operations
and cash flow.
The
Partnership requires a significant amount of cash to service its
indebtedness. The Partnership’s ability to generate cash
depends on many factors beyond its control.
The Partnership’s ability to make payments on and to
refinance its indebtedness and to fund planned capital
expenditures depends on its ability to generate cash in the
future. This, to a certain extent, is subject to general
economic, financial, competitive, legislative, regulatory and
other factors that are beyond its control. We cannot assure you
that the Partnership will generate sufficient cash flow from
operations or that future borrowings will be available to it
under its credit agreement or otherwise in an amount sufficient
to enable it to pay its indebtedness or to fund its other
liquidity needs. The Partnership may need to refinance all or a
portion of its indebtedness at or before maturity. The
Partnership cannot assure you that it will be able to refinance
any of its indebtedness on commercially reasonable terms or at
all.
Failure to
comply with existing or new environmental laws or regulations or
an accidental release of hazardous substances, hydrocarbons or
wastes into the environment may cause the Partnership to incur
significant costs and liabilities.
The Partnership’s operations are subject to stringent and
complex federal, state and local environmental laws and
regulations governing the discharge of materials into the
environment or
40
otherwise relating to environmental protection. These laws
include, for example, (1) the federal Clean Air Act and
comparable state laws that impose obligations related to air
emissions, (2) the Federal Resource Conservation and
Recovery Act, as amended, (“RCRA”) and comparable
state laws that impose requirements for the handling, storage,
treatment or disposal of solid and hazardous waste from the
Partnership’s facilities, (3) the Federal
Comprehensive Environmental Response, Compensation and Liability
Act of 1980, as amended, (“CERCLA” or the
“Superfund” law) and comparable state laws that
regulate the cleanup of hazardous substances that may have been
released at properties currently or previously owned or operated
by us or at locations to which the Partnership’s hazardous
substances have been transported for recycling or disposal and
(4) the Clean Water Act and comparable state laws that
regulate discharges of wastewater from the Partnership’s
facilities to state and federal waters. Failure to comply with
these laws and regulations or newly adopted laws or regulations
may trigger a variety of administrative, civil and criminal
enforcement measures, including the assessment of monetary
penalties or other sanctions, the imposition of remedial
obligations and the issuance of orders enjoining future
operations or imposing additional compliance requirements on
such operations. Certain environmental laws, including CERCLA
and analogous state laws, impose strict, joint and several
liability for costs required to clean up and restore sites where
hazardous substances, hydrocarbons or waste products have been
disposed or otherwise released. Moreover, it is not uncommon for
neighboring landowners and other third parties to file claims
for personal injury and property damage allegedly caused by
noise, odor or the release of hazardous substances, hydrocarbons
or waste products into the environment.
There is inherent risk of incurring environmental costs and
liabilities in connection with the Partnership’s operations
due to its handling of natural gas, NGLs and other petroleum
products, because of air emissions and water discharges related
to its operations, and as a result of historical industry
operations and waste disposal practices. For example, an
accidental release from one of the Partnership’s facilities
could subject it to substantial liabilities arising from
environmental cleanup and restoration costs, claims made by
neighboring landowners and other third parties for personal
injury, natural resource and property damages and fines or
penalties for related violations of environmental laws or
regulations.
Moreover, stricter laws, regulations or enforcement policies
could significantly increase the Partnership’s operational
or compliance costs and the cost of any remediation that may
become necessary. For instance, since August 2009, the Texas
Commission on Environmental Quality (“TCEQ”) has
conducted a comprehensive analysis of air emissions in the
Barnett Shale area in response to reported concerns about high
concentrations of benzene in the air near drilling sites and
natural gas processing facilities. Partially in response to its
investigation, on January 26, 2011, the TCEQ adopted new
air permitting requirements for oil and gas facilities in the
state, which first became applicable to facilities located in
the Barnett Shale area as of February 1, 2011. These new
requirements may require the Partnership to incur increased
capital or operating costs. Moreover, the agency’s
investigations could lead to additional, more stringent air
permitting requirements, increased regulation, and possible
enforcement actions against producers and midstream operators in
the Barnett Shale area. The Partnership is also conducting its
own evaluation of air emissions at certain of its facilities in
the Barnett Shale area and, as necessary, plans to conduct
corrective actions at such facilities. Additionally,
environmental groups have advocated increased regulation and a
moratorium on the issuance of drilling permits for new natural
gas wells in the Barnett Shale area. The adoption of any laws,
regulations or other legally enforceable mandates that result in
more stringent air emission limitations or that restrict or
prohibit the drilling of new natural gas wells for any extended
period of time could increase the Partnership’s operating
and compliance costs as well as reduce the rate of production of
natural gas operators with whom the Partnership has a business
relationship, which could have a material adverse effect on the
Partnership’s results of operations and cash flows.
41
Increased
regulation of hydraulic fracturing could result in reductions or
delays in drilling and completing new oil and natural gas wells,
which could adversely impact the Partnership’s revenues by
decreasing the volumes of natural gas that the Partnership
gathers, processes and fractionates.
Hydraulic fracturing is a process used by oil and gas
exploration and production operators in the completion of
certain oil and gas wells whereby water, sand and chemicals are
injected under pressure into subsurface formations to stimulate
gas and, to a lesser extent, oil production. The process is
typically regulated by state oil and gas commissions. However,
the U.S. Environmental Protection Agency (“EPA”)
recently asserted federal regulatory authority over hydraulic
fracturing involving diesel additives under the Safe Drinking
Water Act’s (“SDWA”) Underground Injection
Control Program. While the EPA has yet to take any action to
enforce or implement this newly asserted regulatory authority,
industry groups have filed suit challenging the EPA’s
recent decision. At the same time, the EPA has commenced a study
of the potential adverse impact of hydraulic fracturing
activities, with the initial results of the study expected to be
available in late 2012 with completion of this study in 2014.
Also, legislation that was introduced in the
111th
session of Congress has been re-introduced in the
112th
Congress that would amend the SDWA to subject hydraulic
fracturing operations to regulation under the SDWA and require
both pre-fracturing and post-fracturing disclosure of chemicals
used by the oil and natural gas industry in the hydraulic
fracturing process. Moreover, some states have adopted, and
other states, including Texas, are considering adopting,
regulations that could restrict hydraulic fracturing in certain
circumstances. Adoption of legislation or of any implementing
regulations placing restrictions on hydraulic fracturing
activities could impose operational delays, increased operating
costs and additional regulatory burdens on exploration and
production operators, which could reduce their production of
natural gas and, in turn, adversely affect the
Partnership’s revenues and results of operations by
decreasing the volumes of natural gas that it gathers, processes
and fractionates. Moreover, required disclosure without
protection for trade secret or proprietary products could
discourage service companies from using such products and as a
result impact the degree to which some oil and natural gas wells
may be efficiently and economically completed or brought into
production.
A change in
the jurisdictional characterization of some of the
Partnership’s assets by federal, state or local regulatory
agencies or a change in policy by those agencies may result in
increased regulation of the Partnership’s assets, which may
cause its revenues to decline and operating expenses to
increase.
Venice Gathering System, L.L.C. (“VGS”) is a wholly
owned subsidiary of Venice Energy Services Company, L.L.C.
(“VESCO”) engaged in the business of transporting
natural gas in interstate commerce, under authorization granted
by and subject to the jurisdiction of the Federal Energy
Regulatory Commission (“FERC”) under the Natural Gas
Act of 1938 (“NGA”). VGS owns and operates a natural
gas gathering system extending from South Timbalier
Block 135 to an onshore interconnection to a natural gas
processing plant owned by VESCO. With the exception of our
interest in VGS, our operations are generally exempt from FERC
regulation under the NGA, but FERC regulation still affects our
non-FERC jurisdictional businesses and the markets for products
derived from these businesses. The NGA exempts natural gas
gathering facilities from regulation by FERC as a natural gas
company under the NGA. The Partnership believes that the natural
gas pipelines in its gathering systems meet the traditional
tests FERC has used to establish a pipeline’s status as a
gatherer not subject to regulation as a natural gas company.
However, the distinction between FERC-regulated transmission
services and federally unregulated gathering services is the
subject of substantial, on-going litigation, so the
classification and regulation of the Partnership’s
gathering facilities are subject to change based on future
determinations by FERC, the courts or Congress. In addition, the
courts have determined that certain pipelines that would
otherwise be subject to the Interstate Commerce Act
(“ICA”) are exempt from such regulation by FERC under
the ICA as proprietary lines. The classification of a line as a
proprietary line is a fact-based determination subject to FERC
and court review. At this time, the Partnership does not have
any such proprietary lines. The classification and regulation of
some of the Partnership’s gathering facilities and
transportation pipelines may be subject to change based on
future determinations by FERC, the courts, or Congress.
42
While the Partnerships’ natural gas gathering operations
are generally exempt from FERC regulation under the NGA, its gas
gathering operations may be subject to certain FERC reporting
and posting requirements in a given year. FERC has issued a
final rule (as amended by orders on rehearing and
clarification), Order 704, requiring certain participants in the
natural gas market, including intrastate pipelines, natural gas
gatherers, natural gas marketers and natural gas processors,
that engage in a minimum level of natural gas sales or purchases
to submit annual reports regarding those transactions to FERC.
It is the responsibility of the reporting entity to determine
which individual transactions should be reported based on the
guidance of Order No. 704. Order No. 704 also requires
market participants to indicate whether they report prices to
any index publishers and, if so, whether their reporting
complies with FERC’s policy statement on price reporting.
In addition, FERC has issued a final rule, (as amended by orders
on rehearing and clarification), Order 720, requiring major
non-interstate pipelines, defined as certain non-interstate
pipelines delivering, on an annual basis, more than an average
of 50 million MMBtus of gas over the previous three
calendar years, to post daily certain information regarding the
pipeline’s capacity and scheduled flows for each receipt
and delivery point that has design capacity equal to or greater
than 15,000 MMBtu/d and requiring interstate pipelines to
post information regarding the provision of no-notice service.
The Partnership takes the position that at this time it and its
subsidiaries are exempt from this rule as currently written. A
petition for review of Order 720 is currently pending before the
Court of Appeals for the Fifth Circuit, and the Partnership has
no way to predict with certainty whether and to what extent
Order 720 will be modified in response to the petition for
review.
In addition, FERC recently issued an order extending certain of
the open-access requirements including the prohibition on
buy/sell arrangements and shipper-must-have-title provisions to
include Hinshaw pipelines to the extent such pipelines provide
interstate service. However, FERC issued a Notice of Inquiry on
October 21, 2010, effectively suspending the recent ruling
and requesting comments on whether and how holders of firm
capacity on Section 311 and Hinshaw pipelines should be
permitted to allow others to make use of their firm interstate
capacity, including to what extent buy/sell transactions should
be permitted.
Other FERC regulations may indirectly impact the
Partnership’s businesses and the markets for products
derived from these businesses. FERC’s policies and
practices across the range of its natural gas regulatory
activities, including, for example, its policies on open access
transportation, gas quality, ratemaking, capacity release and
market center promotion, may indirectly affect the intrastate
natural gas market. In recent years, FERC has pursued
pro-competitive policies in its regulation of interstate natural
gas pipelines. However, we cannot assure you that FERC will
continue this approach as it considers matters such as pipeline
rates and rules and policies that may affect rights of access to
transportation capacity. For more information regarding the
regulation of our and the Partnership’s operations, see
“Business of Targa Resources Partners LP—Regulation of
Operations.”
Should the
Partnership fail to comply with all applicable FERC administered
statutes, rules, regulations and orders, it could be subject to
substantial penalties and fines.
Under the Domenici-Barton Energy Policy Act of 2005 (“EP
Act 2005”), which is applicable to VGS, FERC has civil
penalty authority under the NGA to impose penalties for current
violations of up to $1 million per day for each violation
and disgorgement of profits associated with any violation. While
the Partnership’s systems have not been regulated by FERC
as a natural gas companies under the NGA, FERC has adopted
regulations that may subject certain of its otherwise non-FERC
jurisdictional facilities to FERC annual reporting and daily
scheduled flow and capacity posting requirements. Additional
rules and legislation pertaining to those and other matters may
be considered or adopted by FERC from time to time. Failure to
comply with those regulations in the future could subject the
Partnership to civil penalty liability. For more information
regarding the regulation of our and the Partnership’s
operations, see “Business of Targa Resources Partners
LP—Regulation of Operations.”
43
The adoption
of climate change legislation or regulations restricting
emissions of GHGs could result in increased operating costs and
reduced demand for the products and services we
provide.
In December 2009, the EPA determined that emissions of carbon
dioxide, methane and other greenhouse gases (“GHGs”)
present an endangerment to public health and the environment
because emissions of such gases are, according to the EPA,
contributing to warming of the earth’s atmosphere and other
climatic changes. Based on these findings the EPA has begun
adopting and implementing regulations to restrict emissions of
GHGs under existing provisions of the federal Clean Air Act. The
EPA has already adopted two sets of rules regulating GHG
emissions under the Clean Air Act, one of which requires a
reduction in emissions of GHGs from motor vehicles and the other
of which regulates emissions of GHGs from certain large
stationary sources effective January 2, 2011. The
EPA’s rules relating to emissions of GHGs from large
stationary sources of emissions are currently subject to a
number of legal challenges, but the federal courts have thus far
declined to issue any injunctions to prevent EPA from
implementing or requiring state environmental agencies to
implement the rules. The EPA has also adopted rules requiring
the annual reporting of GHG emissions from specified large GHG
emission sources in the United States beginning in 2011 for
emissions occurring after January 1, 2010, as well as
emissions from certain onshore and offshore oil and natural gas
production facilities and onshore oil and natural gas
processing, transmission, storage and distribution facilities on
an annual basis, beginning in 2012 for emissions occurring in
2011.
In addition, the United States Congress has from time to time
considered adopting legislation to reduce emissions of GHGs and
almost half of the states have already taken legal measures to
reduce emissions of GHGs, primarily through the planned
development of GHG emission inventories
and/or
regional GHG cap and trade programs. Most of these cap and trade
programs work by requiring major sources of emissions, such as
electric power plants, or major producers of fuels, such as
refineries and gas processing plants, to acquire and surrender
emission allowances. The number of allowances available for
purchase is reduced each year in an effort to achieve the
overall GHG emission reduction goal. The adoption of legislation
or regulatory programs to reduce emissions of GHGs could require
the Partnership to incur increased operating costs, such as
costs to purchase and operate emissions control systems, to
acquire emissions allowances or comply with new regulatory or
reporting requirements. Any such legislation or regulatory
programs could also increase the cost of consuming, and thereby
reduce demand for, the natural gas and NGLs the Partnership
processes or fractionates. Consequently, legislation and
regulatory programs to reduce emissions of GHGs could have an
adverse effect on the Partnership’s business, financial
condition and results of operations. Finally, it should be noted
that some scientists have concluded that increasing
concentrations of GHGs in the Earth’s atmosphere may
produce climate changes that have significant physical effects,
such as increased frequency and severity of storms, droughts,
and floods and other climatic events. If any such effects were
to occur, they could have an adverse effect on the
Partnership’s financial condition and results of operations.
The recent
adoption of derivatives legislation by the United States
Congress could have an adverse effect on the Partnership’s
ability to use derivative instruments to reduce the effect of
commodity price, interest rate and other risks associated with
its business.
The United States Congress recently adopted comprehensive
financial reform legislation that establishes federal oversight
and regulation of the
over-the-counter
derivatives market and entities, such as the Partnership, that
participate in that market. The new legislation, known as the
Dodd-Frank Wall Street Reform and Consumer Protection Act (the
“Act”), was signed into law by the President on
July 21, 2010, and requires the CFTC and the SEC to
promulgate rules and regulations implementing the new
legislation within 360 days from the date of enactment. In
its rulemaking under the Act, the CFTC has proposed regulations
to set position limits for certain futures and option contracts
in the major energy markets, and for swaps that are their
economic equivalents. Certain bona fide hedging transactions or
positions would be exempt from these position limits. It is not
possible at this time to predict when the CFTC will finalize
these regulations. The financial reform legislation may also
require the Partnership to comply with margin requirements and
with certain clearing and trade-execution requirements in
connection with its derivative activities, although
44
the application of those provisions to the Partnership is
uncertain at this time. The financial reform legislation may
also require counterparties to the Partnership’s derivative
instruments to spin off some of their derivatives activities to
a separate entity, which may not be as creditworthy as the
current counterparty. The new legislation and any new
regulations could significantly increase the cost of derivative
contracts (including through requirements to post collateral
which could adversely affect the Partnership’s available
liquidity), materially alter the terms of derivative contracts,
reduce the availability of derivatives to protect against risks
the Partnership encounters, reduce the Partnership’s
ability to monetize or restructure its existing derivative
contracts, and increase the Partnership’s exposure to less
creditworthy counterparties. If the Partnership reduces its use
of derivatives as a result of the legislation and regulations,
its results of operations may become more volatile and its cash
flows may be less predictable, which could adversely affect its
ability to plan for and fund capital expenditures. Finally, the
legislation was intended, in part, to reduce the volatility of
oil and natural gas prices, which some legislators attributed to
speculative trading in derivatives and commodity instruments
related to oil and natural gas. The Partnership’s revenues
could therefore be adversely affected if a consequence of the
legislation and regulations is to lower commodity prices. Any of
these consequences could have a material adverse effect on the
Partnership, its financial condition, and its results of
operations.
The
Partnership’s interstate common carrier liquids pipeline is
regulated by the Federal Energy Regulatory
Commission.
Targa NGL Pipeline Company LLC (“Targa NGL”), one of
the Partnership’s subsidiaries, is an interstate NGL common
carrier subject to regulation by FERC under the ICA. Targa NGL
owns a twelve inch diameter pipeline that runs between Lake
Charles, Louisiana and Mont Belvieu, Texas. This pipeline can
move mixed NGL and purity NGL products. Targa NGL also owns an
eight inch diameter pipeline and a 20 inch diameter
pipeline each of which run between Mont Belvieu, Texas and
Galena Park, Texas. The eight inch and the 20 inch
pipelines are part of an extensive mixed NGL and purity NGL
pipeline receipt and delivery system that provides services to
domestic and foreign import and export customers. The ICA
requires that the Partnership maintain tariffs on file with FERC
for each of these pipelines. Those tariffs set forth the rates
the Partnership charges for providing transportation services as
well as the rules and regulations governing these services. The
ICA requires, among other things, that rates on interstate
common carrier pipelines be “just and reasonable” and
non-discriminatory. All shippers on these pipelines are the
Partnership’s subsidiaries.
Recent events
in the Gulf of Mexico may adversely affect the operations of the
Partnership.
In April 2010, the Transocean Deepwater Horizon drilling rig
exploded and subsequently sank 130 miles south of New
Orleans, Louisiana, in the ultra deep water of the Gulf of
Mexico, and the resulting release of crude oil into the Gulf of
Mexico was declared a Spill of National Significance by the
United States Department of Homeland Security. Response actions
to the release are continuing in the Gulf of Mexico. Moreover,
the federal Bureau of Ocean Energy Management, Regulation and
Enforcement (“BOEMRE”) has developed and adopted a
series of changes to its regulations to impose a variety of new
safety and operating measures intended to help prevent a similar
disaster in the future. Consequently, before being allowed to
resume drilling in deepwater, outer continental shelf operators
must now comply with strict new safety and operating
requirements and also must demonstrate the availability of
adequate spill response and blowout preventer containment
resources. The Partnership cannot predict with any certainty the
impact of this oil spill, the extent of cleanup activities
associated with this spill, or the affects of changes in
regulations adopted by BOEMRE or possible changes in laws or
regulations that still may be enacted in response to this spill,
but this event and its aftermath could adversely affect the
Partnership’s operations. It is possible that the direct
results of the spill and
clean-up
efforts could interrupt certain offshore production processed by
our facilities as offshore exploration and productions operators
work to comply with new legal requirements. Furthermore,
additional governmental regulation of, or delays in issuance of
permits for, the offshore exploration and production industry
may negatively impact current or future volumes being gathered
or processed by the Partnership’s facilities, and may
potentially reduce volumes in its Downstream logistics and
marketing business.
45
Terrorist
attacks and the threat of terrorist attacks have resulted in
increased costs to the Partnership’s business. Continued
hostilities in the Middle East or other sustained military
campaigns may adversely impact the Partnership’s results of
operations.
The long-term impact of terrorist attacks, such as the attacks
that occurred on September 11, 2001, and the threat of
future terrorist attacks on the Partnership’s industry in
general and on it in particular is not known at this time.
However, resulting regulatory requirements
and/or
related business decisions associated with security are likely
to increase the Partnership’s costs.
Increased security measures taken by the Partnership as a
precaution against possible terrorist attacks have resulted in
increased costs to its business. Uncertainty surrounding
continued hostilities in the Middle East or other sustained
military campaigns may affect the Partnership’s operations
in unpredictable ways, including disruptions of crude oil
supplies and markets for its products, and the possibility that
infrastructure facilities could be direct targets, or indirect
casualties, of an act of terror.
Changes in the insurance markets attributable to terrorist
attacks may make certain types of insurance more difficult for
the Partnership to obtain. Moreover, the insurance that may be
available to the Partnership may be significantly more expensive
than its existing insurance coverage. Instability in the
financial markets as a result of terrorism or war could also
affect the Partnership’s ability to raise capital.
46
USE OF
PROCEEDS
We will not receive any of the net proceeds from any sale of
shares of common stock by any selling stockholder. We expect to
incur approximately $0.75 million of expenses in connection
with this offering, including all expenses of the selling
stockholders which we have agreed to pay.
47
PRICE RANGE OF
COMMON STOCK
Our common stock has been listed on the New York Stock Exchange
since December 7, 2010 under the symbol “TRGP.”
The following table sets forth the high and low sales prices of
the common stock, as reported by the NYSE through April 12,
2011.
| |
|
|
|
|
|
|
|
|
|
|
|
|
|
|
|
Stock Prices
|
|
|
|
Quarter Ended
|
|
High
|
|
Low
|
|
Dividends Declared
|
|
|
|
June 30,
2011(1)
|
|
$
|
36.73
|
|
|
$
|
31.68
|
|
|
|
|
(2)
|
|
March 31, 2011
|
|
$
|
36.70
|
|
|
$
|
26.51
|
|
|
$
|
0.27
|
(3)
|
|
December 31, 2010
|
|
$
|
28.40
|
|
|
$
|
23.50
|
|
|
$
|
0.06
|
|
|
|
|
|
(1) |
|
The high and low sales prices per
share of common stock are reported through April 12, 2011.
|
|
|
|
|
(2) |
|
The dividend attributable to the
quarter ending June 30, 2011 has not yet been declared or
paid.
|
|
|
|
|
(3) |
|
On April 11, 2011, we
announced that our board of directors declared a quarterly cash
dividend of $0.2725 per share of common stock, or $1.09 per
share on an annualized basis for the first quarter of 2011. This
cash dividend will be paid on May 17, 2011 on all
outstanding shares of common stock to holders of record as of
the close of business on April 21, 2011. If we close this
offering on or prior to the record date on April 21, 2011,
the shares of common stock sold in this offering will receive
the declared dividend of $0.2725 per share of common stock for
the first quarter of 2011. If we do not close this offering on
or prior to the record date on April 21, 2011, then the
shares of common stock sold in this offering will not receive
the declared dividend.
|
The last reported sales price of our common stock on the NYSE on
April 12, 2011 was $32.78. As of April 12, 2011, there
were approximately 219 stockholders of record of our common
stock. This number does not include stockholders whose shares
are held in trust by other entities. The actual number of
stockholders is greater than the number of holders of record.
48
OUR DIVIDEND
POLICY
General
We intend to pay to our stockholders, on a quarterly basis,
dividends equal to the cash we receive from our Partnership
distributions, less reserves for expenses, future dividends and
other uses of cash, including:
|
|
|
| |
•
|
Federal income taxes, which we are required to pay because we
are taxed as a corporation;
|
| |
| |
•
|
the expenses of being a public company;
|
| |
| |
•
|
other general and administrative expenses;
|
| |
| |
•
|
general and administrative reimbursements to the Partnership;
|
| |
| |
•
|
capital contributions to the Partnership upon the issuance by it
of additional partnership securities if we choose to maintain
the General Partner’s 2.0% interest;
|
| |
| |
•
|
reserves our board of directors believes prudent to maintain;
|
| |
| |
•
|
our obligation to (i) satisfy tax obligations associated
with previous sales of assets to the Partnership,
(ii) reimburse the Partnership for certain capital
expenditures related to Versado and (iii) provide the
Partnership with limited quarterly distribution support through
2011, all as described in more detail in “Management’s
Discussion and Analysis of Financial Condition and Results of
Operations—Liquidity and Capital Resources;” and
|
| |
| |
•
|
interest expense or principal payments on any indebtedness we
incur.
|
On April 11, 2011, we announced that our board of directors
declared a quarterly cash dividend of $0.2725 per share of
common stock, or $1.09 per share on an annualized basis for the
first quarter of 2011. This cash dividend will be paid on
May 17, 2011 on all outstanding shares of common stock to
holders of record as of the close of business on April 21,
2011. If we close this offering on or prior to the record date
on April 21, 2011, the shares of common stock sold in this
offering will receive the declared dividend of $0.2725 per share
of common stock for the first quarter of 2011. If we do not
close this offering on or prior to the record date on
April 21, 2011, then the shares of common stock sold in
this offering will not receive the declared dividend. If the
Partnership is successful in implementing its business strategy
and increasing distributions to its partners, we would generally
expect to increase dividends to our stockholders, although the
timing and amount of any such increased dividends will not
necessarily be comparable to the increased Partnership
distributions. We cannot assure you that any dividends will be
declared or paid in the future.
The determination of the amount of cash dividends, if any, to be
declared and paid will depend upon our financial condition,
results of operations, cash flow, the level of our capital
expenditures, future business prospects and any other matters
that our board of directors deems relevant. The
Partnership’s debt agreements contain restrictions on the
payment of distributions and prohibit the payment of
distributions if the Partnership is in default. If the
Partnership cannot make incentive distributions to the general
partner or limited partner distributions to us, we will be
unable to pay dividends on our common stock.
Overview of
Dividends
During the past three fiscal years, our stockholders have
received dividends from us on a pro rata basis. Holders of our
previously outstanding preferred stock received their pro rata
share of (i) an $18 million dividend paid on
November 22, 2010; (ii) a $220 million
extraordinary dividend paid in April 2010; (iii) a
$200 million extraordinary dividend paid on the common
stock (treating the preferred stock on a common stock equivalent
basis) in April 2010; and (iv) a $445 million dividend
paid in 2007. Holders of our common stock received their pro
rata share of the $200 million extraordinary dividend paid
in April 2010 (treating the preferred stock on a common stock
equivalent basis).
49
The
Partnership’s Cash Distribution Policy
Under the Partnership’s partnership agreement, available
cash is defined to generally mean, for each fiscal quarter, all
cash on hand at the date of determination of available cash for
that quarter less the amount of cash reserves established by the
General Partner to provide for the proper conduct of the
Partnership’s business, to comply with applicable law or
any agreement binding on the Partnership and its subsidiaries
and to provide for future distributions to the
Partnership’s unitholders for any one or more of the
upcoming four quarters. The determination of available cash
takes into account the possibility of establishing cash reserves
in some quarterly periods that the Partnership may use to pay
cash distributions in other quarterly periods, thereby enabling
it to maintain relatively consistent cash distribution levels
even if the Partnership’s business experiences fluctuations
in its cash from operations due to seasonal and cyclical
factors. The General Partner’s determination of available
cash also allows the Partnership to maintain reserves to provide
funding for its growth opportunities. The Partnership makes its
quarterly distributions from cash generated from its operations,
and those distributions have grown over time as its business has
grown, primarily as a result of numerous acquisitions and
organic expansion projects that have been funded through
external financing sources and cash from operations.
The actual cash distributions paid by the Partnership to its
partners occur within 45 days after the end of each
quarter. Since second quarter 2007, the Partnership has
increased its quarterly cash distribution 8 times. During
that time period, the Partnership has increased its quarterly
distribution by 65% from $0.3375 per common unit, or $1.35 on an
annualized basis, to $0.5575 per common unit, or $2.23 on an
annualized basis. Please see “The Partnership’s Cash
Distribution Policy.”
50
SELECTED
HISTORICAL FINANCIAL AND OPERATING DATA
The following table presents selected historical consolidated
financial and operating data of Targa Resources Corp. for the
periods and as of the dates indicated. The selected historical
consolidated statement of operations and cash flow data for the
years ended December 31, 2008, 2009 and 2010 and selected
historical consolidated balance sheet data as of
December 31, 2009 and 2010 have been derived from our
audited financial statements, and that information should be
read together with and is qualified in its entirety by reference
to, the historical consolidated financial statements and the
accompanying notes beginning on
page F-1
of this prospectus.
The selected historical consolidated statement of operations and
cash flow data for the years ended December 31, 2006 and
2007 and the selected historical consolidated balance sheet data
as of December 31, 2006, 2007 and 2008 have been derived
from audited financial statements that are not included in this
prospectus.
| |
|
|
|
|
|
|
|
|
|
|
|
|
|
|
|
|
|
|
|
|
|
|
|
For the Years Ended December 31,
|
|
|
|
|
2006
|
|
|
2007
|
|
|
2008
|
|
|
2009
|
|
|
2010
|
|
|
|
|
(In millions, except operating, per common share and price
data)
|
|
|
|
|
Revenues(1)
|
|
$
|
6,132.9
|
|
|
$
|
7,297.2
|
|
|
$
|
7,998.9
|
|
|
$
|
4,536.0
|
|
|
$
|
5,469.2
|
|
|
Product purchases
|
|
|
5,440.8
|
|
|
|
6,525.5
|
|
|
|
7,218.5
|
|
|
|
3,791.1
|
|
|
|
4,687.7
|
|
|
|
|
|
|
|
|
|
|
|
|
|
|
|
|
|
|
|
|
|
|
|
|
Gross
margin(2)
|
|
|
692.1
|
|
|
|
771.7
|
|
|
|
780.4
|
|
|
|
744.9
|
|
|
|
781.5
|
|
|
Operating expenses
|
|
|
222.8
|
|
|
|
247.1
|
|
|
|
275.2
|
|
|
|
235.0
|
|
|
|
260.2
|
|
|
|
|
|
|
|
|
|
|
|
|
|
|
|
|
|
|
|
|
|
|
|
|
Operating
margin(3)
|
|
|
469.3
|
|
|
|
524.6
|
|
|
|
505.2
|
|
|
|
509.9
|
|
|
|
521.3
|
|
|
Depreciation and amortization expenses
|
|
|
149.7
|
|
|
|
148.1
|
|
|
|
160.9
|
|
|
|
170.3
|
|
|
|
185.5
|
|
|
General and administrative expenses
|
|
|
82.5
|
|
|
|
96.3
|
|
|
|
96.4
|
|
|
|
120.4
|
|
|
|
144.4
|
|
|
Other
|
|
|
—
|
|
|
|
(0.1
|
)
|
|
|
13.4
|
|
|
|
2.0
|
|
|
|
(4.7
|
)
|
|
|
|
|
|
|
|
|
|
|
|
|
|
|
|
|
|
|
|
|
|
|
|
Income from operations
|
|
|
237.1
|
|
|
|
280.3
|
|
|
|
234.5
|
|
|
|
217.2
|
|
|
|
196.1
|
|
|
Interest expense, net
|
|
|
(180.2
|
)
|
|
|
(162.3
|
)
|
|
|
(141.2
|
)
|
|
|
(132.1
|
)
|
|
|
(110.9
|
)
|
|
Gain on insurance claims
|
|
|
—
|
|
|
|
—
|
|
|
|
18.5
|
|
|
|
—
|
|
|
|
—
|
|
|
Equity in earnings of unconsolidated investments
|
|
|
10.0
|
|
|
|
10.1
|
|
|
|
14.0
|
|
|
|
5.0
|
|
|
|
5.4
|
|
|
Gain (loss) on debt repurchases
|
|
|
—
|
|
|
|
—
|
|
|
|
25.6
|
|
|
|
(1.5
|
)
|
|
|
(17.4
|
)
|
|
Gain on early debt extinguishment
|
|
|
—
|
|
|
|
—
|
|
|
|
3.6
|
|
|
|
9.7
|
|
|
|
12.5
|
|
|
Gain (loss) on
mark-to-market
derivative instruments
|
|
|
—
|
|
|
|
—
|
|
|
|
(1.3
|
)
|
|
|
0.3
|
|
|
|
(0.4
|
)
|
|
Other
|
|
|
—
|
|
|
|
—
|
|
|
|
—
|
|
|
|
1.2
|
|
|
|
0.5
|
|
|
Income tax expense:
|
|
|
(16.7
|
)
|
|
|
(23.9
|
)
|
|
|
(19.3
|
)
|
|
|
(20.7
|
)
|
|
|
(22.5
|
)
|
|
|
|
|
|
|
|
|
|
|
|
|
|
|
|
|
|
|
|
|
|
|
|
Net income
|
|
|
50.2
|
|
|
|
104.2
|
|
|
|
134.4
|
|
|
|
79.1
|
|
|
|
63.3
|
|
|
Less: Net Income attributable to non controlling interest
|
|
|
26.0
|
|
|
|
48.1
|
|
|
|
97.1
|
|
|
|
49.8
|
|
|
|
78.3
|
|
|
|
|
|
|
|
|
|
|
|
|
|
|
|
|
|
|
|
|
|
|
|
|
Net income (loss) attributable to Targa Resources Corp.
|
|
|
24.2
|
|
|
|
56.1
|
|
|
|
37.3
|
|
|
|
29.3
|
|
|
|
(15.0
|
)
|
|
Dividends on Series B preferred stock
|
|
|
(39.7
|
)
|
|
|
(31.6
|
)
|
|
|
(16.8
|
)
|
|
|
(17.8
|
)
|
|
|
(9.5
|
)
|
|
Less:
|
|
|
|
|
|
|
|
|
|
|
|
|
|
|
|
|
|
|
|
|
|
Undistributed earnings attributable to preferred shareholders
|
|
|
—
|
|
|
|
(24.5
|
)
|
|
|
(20.5
|
)
|
|
|
(11.5
|
)
|
|
|
—
|
|
|
Dividends to common equivalents
|
|
|
—
|
|
|
|
—
|
|
|
|
—
|
|
|
|
—
|
|
|
|
(177.8
|
)
|
|
|
|
|
|
|
|
|
|
|
|
|
|
|
|
|
|
|
|
|
|
|
|
Net income (loss) available to common shareholders
|
|
$
|
(15.5
|
)
|
|
$
|
—
|
|
|
$
|
—
|
|
|
$
|
—
|
|
|
$
|
(202.3
|
)
|
|
|
|
|
|
|
|
|
|
|
|
|
|
|
|
|
|
|
|
|
|
|
|
Net income (loss) available per common share—basic and
diluted
|
|
$
|
(2.53
|
)
|
|
$
|
—
|
|
|
$
|
—
|
|
|
$
|
—
|
|
|
$
|
(30.94
|
)
|
|
|
|
|
|
|
|
|
|
|
|
|
|
|
|
|
|
|
|
|
|
|
|
Operating data:
|
|
|
|
|
|
|
|
|
|
|
|
|
|
|
|
|
|
|
|
|
|
Plant natural gas inlet,
MMcf/d(4)(5)
|
|
|
1,863.3
|
|
|
|
1,982.8
|
|
|
|
1,846.4
|
|
|
|
2,139.8
|
|
|
|
2,268.0
|
|
|
Gross NGL production, MBbl/d
|
|
|
106.8
|
|
|
|
106.6
|
|
|
|
101.9
|
|
|
|
118.3
|
|
|
|
121.2
|
|
|
Natural gas sales,
BBtu/d(5)
|
|
|
501.2
|
|
|
|
526.5
|
|
|
|
532.1
|
|
|
|
598.4
|
|
|
|
685.1
|
|
|
NGL sales, MBbl/d
|
|
|
300.2
|
|
|
|
320.8
|
|
|
|
286.9
|
|
|
|
279.7
|
|
|
|
251.5
|
|
|
Condensate sales, MBbl/d
|
|
|
3.8
|
|
|
|
3.9
|
|
|
|
3.8
|
|
|
|
4.7
|
|
|
|
3.5
|
|
51
| |
|
|
|
|
|
|
|
|
|
|
|
|
|
|
|
|
|
|
|
|
|
|
|
For the Years Ended December 31,
|
|
|
|
|
2006
|
|
|
2007
|
|
|
2008
|
|
|
2009
|
|
|
2010
|
|
|
|
|
(In millions, except operating, per common share and price
data)
|
|
|
|
|
Average realized
prices(6):
|
|
|
|
|
|
|
|
|
|
|
|
|
|
|
|
|
|
|
|
|
|
Natural gas, $/MMBtu
|
|
$
|
6.79
|
|
|
$
|
6.56
|
|
|
$
|
8.20
|
|
|
$
|
3.96
|
|
|
|
4.43
|
|
|
NGL, $/gal
|
|
|
1.02
|
|
|
|
1.18
|
|
|
|
1.38
|
|
|
|
0.79
|
|
|
|
1.06
|
|
|
Condensate, $/Bbl
|
|
|
63.67
|
|
|
|
70.01
|
|
|
|
91.28
|
|
|
|
56.32
|
|
|
|
73.68
|
|
|
Balance Sheet Data (at period end):
|
|
|
|
|
|
|
|
|
|
|
|
|
|
|
|
|
|
|
|
|
|
Property plant and equipment, net
|
|
$
|
2,464.5
|
|
|
$
|
2,430.1
|
|
|
$
|
2,617.4
|
|
|
$
|
2,548.1
|
|
|
|
2,509.0
|
|
|
Total assets
|
|
|
3,458.0
|
|
|
|
3,795.1
|
|
|
|
3,641.8
|
|
|
|
3,367.5
|
|
|
|
3,393.8
|
|
|
Long-term debt less current maturities
|
|
|
1,471.9
|
|
|
|
1,867.8
|
|
|
|
1,976.5
|
|
|
|
1,593.5
|
|
|
|
1,534.7
|
|
|
Convertible cumulative participating Series B preferred
stock
|
|
|
687.2
|
|
|
|
273.8
|
|
|
|
290.6
|
|
|
|
308.4
|
|
|
|
—
|
|
|
Total owners’ equity
|
|
|
(71.5
|
)
|
|
|
574.1
|
|
|
|
822.0
|
|
|
|
754.9
|
|
|
|
1,036.1
|
|
|
Cash Flow Data:
|
|
|
|
|
|
|
|
|
|
|
|
|
|
|
|
|
|
|
|
|
|
Net cash provided by (used in):
|
|
|
|
|
|
|
|
|
|
|
|
|
|
|
|
|
|
|
|
|
|
Operating activities
|
|
$
|
269.5
|
|
|
$
|
190.6
|
|
|
$
|
390.7
|
|
|
$
|
335.8
|
|
|
$
|
208.5
|
|
|
Investing activities
|
|
|
(117.8
|
)
|
|
|
(95.9
|
)
|
|
|
(206.7
|
)
|
|
|
(59.3
|
)
|
|
|
(134.6
|
)
|
|
Financing activities
|
|
|
(50.4
|
)
|
|
|
(59.5
|
)
|
|
|
0.9
|
|
|
|
(386.9
|
)
|
|
|
(137.9
|
)
|
|
|
|
|
(1) |
|
Includes business interruption
insurance proceeds of $10.7 million, $7.3 million,
$32.9 million, $21.5 million and $6 million for
the years ended December 31, 2006, 2007, 2008, 2009 and
2010.
|
| |
|
(2) |
|
Gross margin is a non-GAAP
financial measure and is discussed under “Management’s
Discussion and Analysis of Financial Condition and Results of
Operations—How We Evaluate Our Operations” and
“—How We Evaluate the Partnership’s
Operations.”
|
| |
|
(3) |
|
Operating margin is a non-GAAP
financial measure and is discussed under “Management’s
Discussion and Analysis of Financial Condition and Results of
Operations—How We Evaluate Our Operations” and
“—How We Evaluate the Partnership’s
Operations.”
|
| |
|
(4) |
|
Plant natural gas inlet represents
the volume of natural gas passing through the meter located at
the inlet of a natural gas processing plant.
|
| |
|
(5) |
|
Plant natural gas inlet volumes
include producer
take-in-kind
volumes, while natural gas sales exclude producer
take-in-kind
volumes.
|
| |
|
(6) |
|
Average realized prices include the
impact of hedging activities.
|
52
MANAGEMENT’S
DISCUSSION AND ANALYSIS
OF FINANCIAL CONDITION AND RESULTS OF OPERATIONS
You should read the following discussion of our financial
condition and results of operations in conjunction with the
historical consolidated financial statements and notes thereto
included elsewhere in this prospectus. For more detailed
information regarding the basis of presentation for the
following information, you should read the notes to the
historical financial statements included elsewhere in this
prospectus. In addition, you should read “Forward-Looking
Statements” and “Risk Factors” for information
regarding certain risks inherent in our and the
Partnership’s business.
Overview
Financial
Presentation
An indirect subsidiary of ours is the sole member of the General
Partner. Because we control the General Partner, under generally
accepted accounting principles we must reflect our ownership
interest in the Partnership on a consolidated basis.
Accordingly, our financial results are combined with the
Partnership’s financial results in our consolidated
financial statements even though the distribution or transfer of
Partnership assets are limited by the terms of the partnership
agreement, as well as restrictive covenants in the
Partnership’s lending agreements. The limited partner
interests in the Partnership not owned by us are reflected in
our results of operations as net income attributable to
non-controlling interests. Therefore, throughout this
discussion, we make a distinction where relevant between
financial results of the Partnership versus those of us as a
standalone parent including our non-Partnership subsidiaries.
General
The Partnership is a leading provider of midstream natural gas
and NGL services in the United States. The Partnership is
engaged in the business of gathering, compressing, treating,
processing and selling natural gas, storing, fractionating,
treating, transporting and selling NGLs and NGL products and
storing and terminaling refined petroleum products and crude
oil. It operates through two divisions: the Natural Gas
Gathering and Processing division and the Logistics and
Marketing division.
As a result of the conveyance of all of our remaining operating
assets to the Partnership in September 2010, we currently have
no separate, direct operating activities apart from those
conducted by the Partnership. As such, our cash inflows will
primarily consist of cash distributions from our interests in
the Partnership. The Partnership is required to distribute all
available cash at the end of each quarter after establishing
reserves to provide for the proper conduct of its business or to
provide for future distributions.
The results of operations included in our consolidated financial
statements will differ from the results of operations of the
Partnership primarily due to the financial effects of:
non-controlling interests in the Partnership, our separate debt
obligations, certain general and administrative costs applicable
to us as a separate public company, and certain non-operating
assets and liabilities that we retained and were not included in
the asset conveyances to the Partnership.
Factors That
Significantly Affect Our Results
Our cash flow and resulting ability to pay dividends depends
upon the Partnership’s ability to make distributions to its
partners, including us. The actual amount of cash that the
Partnership has available for distributions depends primarily on
the amount of cash that it generates from its operations.
As of April 12, 2011, our interests in the Partnership
consist of the following:
|
|
|
| |
•
|
a 2% general partner interest, which we hold through our 100%
ownership interest in the general partner of the Partnership;
|
| |
| |
•
|
all IDRs; and
|
53
|
|
|
| |
•
|
11,645,659 of the 84,756,009 outstanding common units of the
Partnership, representing 13.7% of the limited partnership
interest.
|
Cash
Distributions
The following table sets forth the historical distributions that
the Partnership has paid in respect of our 2% general partner
interest, the associated IDRs and actual common units that we
held during the periods indicated. The amount of these
Partnership distributions available for distribution to us and
the Partnership’s shareholders will be after reserves are
established for the Partnership’s capital contributions,
debt service requirements, general, administrative and other
expenses, future distributions and other miscellaneous uses of
cash. We will not distribute all of the cash that we receive
from the Partnership to our shareholders, as we will establish
reserves for capital contributions, debt service requirements,
general, administrative and other expenses, future distributions
and other miscellaneous uses of cash.
| |
|
|
|
|
|
|
|
|
|
|
|
|
|
|
|
|
|
|
|
|
|
|
|
|
|
|
|
|
|
|
|
Cash
|
|
Actual Cash Distributions
|
|
|
|
Distribution
|
|
Limited
|
|
|
|
|
|
|
|
|
|
Distributions
|
|
|
|
Declared
|
|
Partner
|
|
|
|
|
|
|
|
|
|
to Targa
|
|
|
|
Per Limited
|
|
Units
|
|
|
|
Limited Partner
|
|
General Partner
|
|
|
|
Resources
|
|
|
|
Partner Unit
|
|
Outstanding
|
|
Total
|
|
Units
|
|
Interest
|
|
IDRs
|
|
Corp..(1)
|
|
|
|
(In millions except Cash Distributions Per Limited Partner
Unit)
|
|
|
|
2007
|
|
|
|
|
|
|
|
|
|
|
|
|
|
|
|
|
|
|
|
|
|
|
|
|
|
|
|
|
|
First Quarter
|
|
$
|
0.16875
|
|
|
|
30.9
|
|
|
$
|
5.3
|
|
|
$
|
5.2
|
|
|
$
|
0.1
|
|
|
$
|
—
|
|
|
$
|
2.1
|
|
|
Second Quarter
|
|
|
0.33750
|
|
|
|
30.9
|
|
|
|
10.6
|
|
|
|
10.4
|
|
|
|
0.2
|
|
|
|
—
|
|
|
|
4.1
|
|
|
Third Quarter
|
|
|
0.33750
|
|
|
|
44.4
|
|
|
|
15.3
|
|
|
|
15.0
|
|
|
|
0.3
|
|
|
|
—
|
|
|
|
4.2
|
|
|
Fourth Quarter
|
|
|
0.39750
|
|
|
|
46.2
|
|
|
|
18.9
|
|
|
|
18.4
|
|
|
|
0.4
|
|
|
|
0.1
|
|
|
|
5.1
|
|
|
2008
|
|
|
|
|
|
|
|
|
|
|
|
|
|
|
|
|
|
|
|
|
|
|
|
|
|
|
|
|
|
First Quarter
|
|
$
|
0.41750
|
|
|
|
46.2
|
|
|
$
|
19.9
|
|
|
$
|
19.3
|
|
|
$
|
0.4
|
|
|
$
|
0.2
|
|
|
$
|
5.5
|
|
|
Second Quarter
|
|
|
0.51250
|
|
|
|
46.2
|
|
|
|
25.9
|
|
|
|
23.7
|
|
|
|
0.5
|
|
|
|
1.7
|
|
|
|
8.2
|
|
|
Third Quarter
|
|
|
0.51750
|
|
|
|
46.2
|
|
|
|
26.3
|
|
|
|
23.9
|
|
|
|
0.5
|
|
|
|
1.9
|
|
|
|
8.4
|
|
|
Fourth Quarter
|
|
|
0.51750
|
|
|
|
46.2
|
|
|
|
26.4
|
|
|
|
24.0
|
|
|
|
0.5
|
|
|
|
1.9
|
|
|
|
8.4
|
|
|
2009
|
|
|
|
|
|
|
|
|
|
|
|
|
|
|
|
|
|
|
|
|
|
|
|
|
|
|
|
|
|
First Quarter
|
|
$
|
0.51750
|
|
|
|
46.2
|
|
|
$
|
26.3
|
|
|
$
|
23.9
|
|
|
$
|
0.5
|
|
|
$
|
1.9
|
|
|
$
|
8.4
|
|
|
Second Quarter
|
|
|
0.51750
|
|
|
|
46.2
|
|
|
|
26.4
|
|
|
|
23.9
|
|
|
|
0.5
|
|
|
|
2.0
|
|
|
|
8.5
|
|
|
Third Quarter
|
|
|
0.51750
|
|
|
|
61.6
|
|
|
|
35.2
|
|
|
|
31.9
|
|
|
|
0.7
|
|
|
|
2.6
|
|
|
|
13.7
|
|
|
Fourth Quarter
|
|
|
0.51750
|
|
|
|
68.0
|
|
|
|
38.8
|
|
|
|
35.2
|
|
|
|
0.8
|
|
|
|
2.8
|
|
|
|
14.0
|
|
|
2010
|
|
|
|
|
|
|
|
|
|
|
|
|
|
|
|
|
|
|
|
|
|
|
|
|
|
|
|
|
|
First Quarter
|
|
$
|
0.51750
|
|
|
|
68.0
|
|
|
$
|
38.8
|
|
|
$
|
35.2
|
|
|
$
|
0.8
|
|
|
$
|
2.8
|
|
|
$
|
9.6
|
|
|
Second Quarter
|
|
|
0.52750
|
|
|
|
68.0
|
|
|
|
40.2
|
|
|
|
35.9
|
|
|
|
0.8
|
|
|
|
3.5
|
|
|
|
10.4
|
|
|
Third Quarter
|
|
|
0.53750
|
|
|
|
75.5
|
|
|
|
46.1
|
|
|
|
40.6
|
|
|
|
0.9
|
|
|
|
4.6
|
|
|
|
11.8
|
|
|
Fourth Quarter
|
|
|
0.54750
|
|
|
|
84.7
|
|
|
|
53.5
|
|
|
|
46.4
|
|
|
|
1.1
|
|
|
|
6.0
|
|
|
|
13.5
|
|
|
|
|
|
(1) |
|
Distributions to Targa are
comprised of amounts attributable to Targa’s
(i) limited partner units, (ii) general partner units,
and (iii) IDRs.
|
Factors That
Significantly Affect the Partnership’s Results
The Partnership’s results of operations are substantially
impacted by the volumes that move through its gathering and
processing and logistics assets, its contract terms and changes
in commodity prices.
Volumes. In the Partnership’s gathering
and processing operations, plant inlet volumes and capacity
utilization rates generally are driven by wellhead production,
its competitive and contractual position on a regional basis and
more broadly by the impact of prices for oil, natural gas and
NGLs on exploration and production activity in the areas of its
operations. The factors that impact the gathering and processing
volumes also impact the total volumes that flow to the
Partnership’s Downstream Business. In addition,
fractionation volumes are also affected by the location of the
resulting mixed NGLs, available
54
pipeline capacity to transport NGLs to the Partnership’s
fractionators, and the Partnership’s competitive and
contractual position relative to other fractionators.
Contract Terms and Contract Mix and the Impact of Commodity
Prices. Because of the significant volatility of
natural gas and NGL prices, the contract mix of the
Partnership’s natural gas gathering and processing segment
can also have a significant impact on its profitability,
especially those that create exposure to changes in energy
prices.
Set forth below is a table summarizing the contract mix of the
Partnership’s natural gas gathering and processing division
for 2010 and the potential impacts of commodity prices on
operating margins:
| |
|
|
|
|
|
|
|
|
|
Percent of
|
|
|
|
Contract Type
|
|
Throughput
|
|
Impact of Commodity Prices
|
|
|
|
Percent-of-Proceeds
/
Percent-of-Liquids
|
|
|
38
|
%
|
|
Decreases in natural gas and or NGL prices generate decreases in
operating margins.
|
|
Fee-Based
|
|
|
7
|
%
|
|
No direct impact from commodity price movements.
|
|
Wellhead Purchases / Keep- Whole
|
|
|
17
|
%
|
|
Increases in natural gas prices relative to NGL prices generate
decreases in operating margin.
|
|
Hybrid
|
|
|
38
|
%
|
|
In periods of favorable processing economics(1), similar to
percent-of-liquids or to wellhead purchases/keep-whole in some
circumstances, if economically advantageous to the processor. In
periods of unfavorable processing economics, similar to
fee-based.
|
|
|
|
|
(1) |
|
Favorable processing economics
typically occur when processed NGLs can be sold, after allowing
for processing costs, at a higher value than natural gas on a
Btu equivalent basis.
|
The Partnership generally prefers to enter into contracts with
less commodity price sensitivity including fee-based and
percent-of-proceeds
arrangements. However, negotiated contract terms are based upon
a variety of factors, including natural gas quality, geographic
location, the competitive commodity and pricing environment at
the time the contract is executed, and customer requirements.
The gathering and processing contract mix and, accordingly, the
exposure to natural gas and NGL prices, may change as a result
of producer preferences, competition, and changes in production
as wells decline at different rates or are added, the
Partnership’s expansion into regions where different types
of contracts are more common as well as other market factors.
The contract terms and contract mix of the Downstream Business
can also have a significant impact on its results of operations.
During periods of low relative demand for available
fractionation capacity, rates were low and take -or -pay
contracts were not readily available. Currently, demand for
fractionation services is relatively high, rates have increased,
contract terms or lengths have increased and reservation fees
are required. These fractionation contracts in the logistics
assets segment are primarily fee-based arrangements while the
marketing and distribution segment includes both fee-based and
margin-based contracts.
Impact of the Partnership’s Commodity Price Hedging
Activities. In an effort to reduce the
variability of its cash flows, the Partnership has hedged the
commodity price associated with a portion of its expected
natural gas, NGL and condensate equity volumes through 2014 by
entering into derivative financial instruments including swaps
and purchased puts (or floors). With these arrangements, the
Partnership has attempted to mitigate its exposure to commodity
price movements with respect to its forecasted volumes for these
periods. The Partnership actively manages the Downstream
Business product inventory and other working capital levels to
reduce exposure to changing NGL prices. For additional
information regarding the Partnership’s hedging activities,
see “Quantitative and Qualitative Disclosures About Market
Risk—Commodity Price Risk.”
55
General Trends
and Outlook
We expect the midstream energy business environment to continue
to be affected by the following key trends: demand for our
services, significant relationships, commodity prices, volatile
capital markets and increased regulation. These expectations are
based on assumptions made by us and information currently
available to us. To the extent our underlying assumptions about
or interpretations of available information prove to be
incorrect, our actual results may vary materially from our
expected results.
Demand for Services. Fluctuations in energy
prices can affect production rates and investments by third
parties in the development of oil and natural gas reserves.
Generally, drilling and production activity will increase as
energy prices increase. We believe that the current strength of
oil, condensate and NGL prices compared to natural gas prices
has caused producers in and around the Partnership’s
natural gas gathering and processing areas of operation to focus
their drilling programs on regions rich in liquid forms of
hydrocarbons. This focus is reflected in increased drilling
permits and higher rig counts in these areas, and we expect
these activities to lead to higher inlet volumes in the Field
Gathering and Processing segment over the next several years.
Producer activity in areas rich in oil, condensate and NGLs is
currently generating increased demand for the Partnership’s
fractionation services and for related fee-based services
provided by its Downstream Business. While we expect development
activity to remain robust with respect to oil and liquids rich
gas development and production, currently depressed natural gas
prices have resulted in reduced activity levels surrounding
comparatively dry natural gas reserves, whether conventional or
unconventional.
Significant Relationships. The following table
lists the counterparties that account for more than 10% of the
Partnership’s consolidated sales and consolidated product
purchases.
| |
|
|
|
|
|
|
|
|
|
|
|
|
|
|
|
Year Ended December 31,
|
|
|
|
2008
|
|
2009
|
|
2010
|
|
|
|
% of consolidated revenues—CPC
|
|
|
19
|
%
|
|
|
15
|
%
|
|
|
10
|
%
|
|
% of consolidated product purchases—Louis Dreyfus Energy
Services L.P
|
|
|
9
|
%
|
|
|
11
|
%
|
|
|
10
|
%
|
No other third party customer accounted for more than 10% of our
consolidated revenues or consolidated product purchases during
these periods.
Commodity Prices. Current forward commodity
prices for the January 2011 through December 2011 period show
natural gas and crude oil prices strengthening while NGL prices
weaken on an absolute price basis and as a percentage of crude
oil. Various industry commodity price forecasts based on
fundamental analysis may differ significantly from forward
market prices. Both are subject to change due to multiple
factors. There has been and we believe there will continue to be
significant volatility in commodity prices and in the
relationships among NGL, crude oil and natural gas prices. In
addition, the volatility and uncertainty of natural gas, crude
oil and NGL prices impact drilling, completion and other
investment decisions by producers and ultimately supply to the
Partnership’s systems.
The Partnership’s operating income generally improves in an
environment of higher natural gas, NGL and condensate prices,
primarily as a result of its
percent-of-proceeds
contracts. The Partnership’s processing profitability is
largely dependent upon pricing, the supply of and market demand
for natural gas, NGLs and condensate, which are beyond its
control and have been volatile. Recent weak economic conditions
have negatively affected the pricing and market demand for
natural gas, NGLs and condensate, which caused a reduction in
profitability of the Partnership’s processing operations.
In a declining commodity price environment, without taking into
account the Partnership’s hedges, it will realize a
reduction in cash flows under its
percent-of-proceeds
contracts proportionate to average price declines. The
Partnership has attempted to mitigate its exposure to commodity
price movements by entering into hedging arrangements. For
additional information regarding hedging activities, see
“Quantitative and Qualitative Disclosures about Market
Risk—Commodity Price Risk.”
Volatile Capital Markets. We and the
Partnership are dependent on our abilities to access equity and
debt capital markets in order to fund acquisitions and expansion
expenditures. Global financial markets
56
have been, and are expected to continue to be, volatile and
disrupted and weak economic conditions may cause a significant
decline in commodity prices. As a result, we and the Partnership
may be unable to raise equity or debt capital on satisfactory
terms, or at all, which may negatively impact the timing and
extent to which we and the Partnership execute growth plans.
Prolonged periods of low commodity prices or volatile capital
markets may impact our and the Partnership’s ability or
willingness to enter into new hedges, fund organic growth,
connect to new supplies of natural gas, execute acquisitions or
implement expansion capital expenditures.
Increased Regulation. Additional regulation in
various areas has the potential to materially impact the
Partnership’s operations and financial condition. For
example, increased regulation of hydraulic fracturing used by
producers may cause reductions in supplies of natural gas and of
NGLs from producers. Please read “Risk
Factors—Increased regulation of hydraulic fracturing could
result in reductions or delays in drilling and completing new
oil and natural gas wells, which could adversely impact the
Partnership’s revenues by decreasing the volumes of natural
gas that the Partnership gathers, processes and
fractionates.” Similarly, the forthcoming rules and
regulations of the CFTC may limit the Partnership’s ability
or increase the cost to use derivatives, which could create more
volatility and less predictability in its results of operations.
Please read “Risk Factors—The recent adoption of
derivatives legislation by the United States Congress could have
an adverse effect on the Partnership’s ability to use
derivative instruments to reduce the effect of commodity price,
interest rate and other risks associated with its business.”
How We Evaluate
Our Operations
Our consolidated operations include the operations of the
Partnership due to our ownership and control of the General
Partner. As a result of our conveyances of all of our remaining
operating assets to the Partnership we have no separate, direct
operating activities from those conducted by the Partnership.
Our financial results differ from the Partnership’s due to
the financial effects of non-controlling interests in the
Partnership, our separate debt obligations, certain
non-operating costs associated with assets and liabilities that
we retained and were not included in the asset conveyances to
the Partnership, and certain general and administrative costs
applicable to us as a separate public company.
How We Evaluate
the Partnership’s Operations
The Partnership’s profitability is a function of the
difference between the revenues it receives from our operations,
including revenues from the natural gas, NGLs and condensate it
sells, and the costs associated with conducting its operations,
including the costs of wellhead natural gas and mixed NGLs that
it purchases as well as operating and general and administrative
costs, and the impact of the Partnership’s commodity
hedging activities. Because commodity price movements tend to
impact both revenues and costs, increases or decreases in the
Partnership’s revenues alone are not necessarily indicative
of increases or decreases in its profitability. The
Partnership’s contract portfolio, the prevailing pricing
environment for natural gas and NGLs, and the volume of natural
gas and NGL throughput on its systems are important factors in
determining its profitability. The Partnership’s
profitability is also affected by the NGL content in gathered
wellhead natural gas, supply and demand for its products and
services and changes in its customer mix.
Management uses a variety of financial and operational
measurements to analyze the Partnership’s performance.
These measurements include: (1) throughput volumes,
facility efficiencies and fuel consumption, (2) operating
expenses and (3) the following non-GAAP measures—gross
margin, operating margin and adjusted EBITDA.
Throughput Volumes, Facility Efficiencies and Fuel
Consumption. The Partnership’s profitability
is impacted by its ability to add new sources of natural gas
supply to offset the natural decline of existing volumes from
natural gas wells that are connected to its gathering and
processing systems. This is achieved by connecting new wells and
adding new volumes in existing areas of production as well as by
capturing natural gas supplies currently gathered by third
parties. Similarly, the Partnership’s profitability is
impacted
57
by its ability to add new sources of mixed NGL supply, typically
connected by third -party transportation, to its Downstream
Business’ fractionation facilities. The Partnership
fractionates NGLs generated by its gathering and processing
plants as well as by contracting for mixed NGL supply from third
-party gathering or fractionation facilities.
In addition, the Partnership seeks to increase operating margins
by limiting volume losses and reducing fuel consumption by
increasing compression efficiency. With its gathering
systems’ extensive use of remote monitoring capabilities,
the Partnership monitors the volumes of natural gas received at
the wellhead or central delivery points along its gathering
systems, the volume of natural gas received at its processing
plant inlets and the volumes of NGLs and residue natural gas
recovered by its processing plants. The Partnership also
monitors the volumes of NGLs received, stored, fractionated, and
delivered across its logistics assets. This information is
tracked through its processing plants and Downstream Business
facilities to determine customer settlements for sales and
volume -related fees for service, which helps the Partnership
increase efficiency and reduce fuel consumption.
As part of monitoring the efficiency of its operations, the
Partnership measures the difference between the volume of
natural gas received at the wellhead or central delivery points
on its gathering systems and the volume received at the inlet of
its processing plants as an indicator of fuel consumption and
line loss. The Partnership also tracks the difference between
the volume of natural gas received at the inlet of the
processing plant and the NGLs and residue gas produced at the
outlet of such plant to monitor the fuel consumption and
recoveries of the facilities. Similar tracking is performed for
its logistics assets. These volume, recovery and fuel
consumption measurements are an important part of the
Partnership’s operational efficiency analysis.
Operating Expenses. Operating expenses are
costs associated with the operation of a specific asset. Labor,
ad valorem taxes, repair and maintenance, utilities and contract
services comprise the most significant portion of the
Partnership’s operating expenses. These expenses generally
remain relatively stable and independent of the volumes through
its systems but fluctuate depending on the scope of the
activities performed during a specific period.
Gross Margin. Gross margin is defined as
revenue less purchases. It is impacted by volumes and commodity
prices as well as the Partnership’s contract mix and
hedging programs. We define Natural Gas Gathering and Processing
division gross margin as total operating revenues from the sales
of natural gas and NGLs plus service fee revenues, less product
purchases, which consist primarily of producer payments and
other natural gas purchases. Logistics Assets gross margin
consists primarily of service fee revenue. Marketing and
Distribution gross margin equals total revenue from service fees
and NGL sales, less cost of sales, which consists primarily of
NGL purchases, transportation costs and changes in inventory
valuation. The gross margin impacts of cash flow hedge
settlements are reported in Other.
Operating Margin. Operating margin is an
important performance measure of the core profitability of the
Partnership’s operations. We define operating margin as
gross margin less operating expenses. Natural gas and NGL sales
revenue includes settlement gains and losses on commodity hedges.
Gross margin and operating margin are non-GAAP measures. The
GAAP measure most directly comparable to gross margin and
operating margin is net income. Gross margin and operating
margin are not alternatives to GAAP net income and have
important limitations as analytical tools. You should not
consider gross margin and operating margin in isolation or as a
substitute for analysis of our results as reported under GAAP.
Because gross margin and operating margin exclude some, but not
all, items that affect net income and are defined differently by
different companies in our industry, our definition of gross
margin and operating margin may not be comparable to similarly
titled measures of other companies, thereby diminishing their
utility.
Targa senior management reviews business segment gross margin
and operating margin monthly as a core internal management
process. We believe that investors benefit from having access to
the same financial measures that our management uses in
evaluating our operating results. Gross Margin and Operating
Margin provide useful information to investors because they are
used as supplemental financial
58
measures by us and by external users of our financial
statements, including such investors, commercial banks and
others, to assess:
|
|
|
| |
•
|
the financial performance of the Partnership’s assets
without regard to financing methods, capital structure or
historical cost basis;
|
| |
| |
•
|
the Partnership’s operating performance and return on
capital as compared to other companies in the midstream energy
sector, without regard to financing or capital
structure; and
|
| |
| |
•
|
the viability of acquisitions and capital expenditure projects
and the overall rates of return on alternative investment
opportunities.
|
The Partnership’s management compensates for the
limitations of gross margin and operating margin as analytical
tools by reviewing the comparable GAAP measure, understanding
the differences between the measures and incorporating these
insights into its decision-making processes.
| |
|
|
|
|
|
|
|
|
|
|
|
|
|
|
|
Year Ended December 31,
|
|
|
|
|
2008
|
|
|
2009
|
|
|
2010
|
|
|
|
|
(In millions)
|
|
|
|
|
Reconciliation of Targa Resources Partners LP’s gross
margin and operating margin to net income (loss):
|
|
|
|
|
|
|
|
|
|
|
|
|
|
Gross margin
|
|
$
|
812.9
|
|
|
$
|
710.9
|
|
|
$
|
772.2
|
|
|
Operating expenses
|
|
|
(274.3
|
)
|
|
|
(234.4
|
)
|
|
|
(259.5
|
)
|
|
|
|
|
|
|
|
|
|
|
|
|
|
|
|
Operating margin
|
|
|
538.6
|
|
|
|
476.5
|
|
|
|
512.7
|
|
|
Depreciation and amortization expenses
|
|
|
(156.8
|
)
|
|
|
(166.7
|
)
|
|
|
(176.2
|
)
|
|
General and administrative expenses
|
|
|
(97.3
|
)
|
|
|
(118.5
|
)
|
|
|
(122.4
|
)
|
|
Other operating income (loss)
|
|
|
(19.3
|
)
|
|
|
3.7
|
|
|
|
3.3
|
|
|
Interest expense, net
|
|
|
(156.1
|
)
|
|
|
(159.8
|
)
|
|
|
(110.8
|
)
|
|
Income tax expense
|
|
|
(2.9
|
)
|
|
|
(1.2
|
)
|
|
|
(4.0
|
)
|
|
Gain (loss) on sale of assets
|
|
|
5.9
|
|
|
|
(0.1
|
)
|
|
|
—
|
|
|
Gain (loss) on debt repurchases
|
|
|
13.1
|
|
|
|
(1.5
|
)
|
|
|
—
|
|
|
Risk management activities
|
|
|
76.4
|
|
|
|
(30.9
|
)
|
|
|
26.0
|
|
|
Equity in earnings of unconsolidated investments
|
|
|
14.0
|
|
|
|
5.0
|
|
|
|
5.4
|
|
|
Gain on insurance claims
|
|
|
18.5
|
|
|
|
—
|
|
|
|
—
|
|
|
Other, net
|
|
|
1.1
|
|
|
|
0.7
|
|
|
|
—
|
|
|
|
|
|
|
|
|
|
|
|
|
|
|
|
|
Partnership net income (loss)
|
|
$
|
235.2
|
|
|
$
|
7.2
|
|
|
$
|
134.0
|
|
|
|
|
|
|
|
|
|
|
|
|
|
|
|
Adjusted EBITDA. The Partnership defines
Adjusted EBITDA as net income before interest, income taxes,
depreciation and amortization, gains or losses on debt
repurchases and non-cash income or loss related to derivative
instruments. Adjusted EBITDA is used as a supplemental financial
measure by the Partnership and by external users of our
financial statements such as investors, commercial banks and
others.
The economic substance behind the Partnership’s use of
Adjusted EBITDA is to measure the ability of its assets to
generate cash sufficient to pay interest costs, support its
indebtedness and make distributions to its investors.
The GAAP measures most directly comparable to Adjusted EBITDA
are net cash provided by operating activities and net income.
Adjusted EBITDA should not be considered as an alternative to
GAAP net cash provided by operating activities and GAAP net
income. Adjusted EBITDA is not a presentation made in accordance
with GAAP and has important limitations as an analytical tool.
You should not consider Adjusted EBITDA in isolation or as a
substitute for analysis of our results as reported under GAAP.
Because Adjusted EBITDA excludes some, but not all, items that
affect net income and net cash provided by
59
operating activities and is defined differently by different
companies in our industry, our definition of Adjusted EBITDA may
not be comparable to similarly titled measures of other
companies.
The Partnership compensates for the limitations of Adjusted
EBITDA as an analytical tool by reviewing the comparable GAAP
measures, understanding the differences between the measures and
incorporating these insights into its decision-making processes.
| |
|
|
|
|
|
|
|
|
|
|
|
|
|
|
|
Year Ended December 31,
|
|
|
|
|
2008
|
|
|
2009
|
|
|
2010
|
|
|
|
|
(In millions)
|
|
|
|
|
Reconciliation of Targa Resources Partners LP net cash
provided by operating activities to Adjusted EBITDA:
|
|
|
|
|
|
|
|
|
|
|
|
|
|
Net cash provided by operating activities
|
|
$
|
550.2
|
|
|
$
|
422.9
|
|
|
$
|
371.2
|
|
|
Net income attributable to noncontrolling interest
|
|
|
(33.1
|
)
|
|
|
(19.3
|
)
|
|
|
(24.9
|
)
|
|
Interest expense,
net(1)
|
|
|
34.7
|
|
|
|
44.8
|
|
|
|
74.8
|
|
|
Gain (loss) on debt repurchases
|
|
|
13.1
|
|
|
|
(1.5
|
)
|
|
|
—
|
|
|
Termination of commodity derivatives
|
|
|
87.4
|
|
|
|
—
|
|
|
|
—
|
|
|
Current income tax expense
|
|
|
0.8
|
|
|
|
0.3
|
|
|
|
2.8
|
|
|
Other(2)
|
|
|
3.4
|
|
|
|
(10.6
|
)
|
|
|
(14.7
|
)
|
|
Changes in operating assets and liabilities which used
(provided) cash:
|
|
|
|
|
|
|
|
|
|
|
|
|
|
Accounts receivable and other assets
|
|
|
(890.8
|
)
|
|
|
57.0
|
|
|
|
71.2
|
|
|
Accounts payable and other liabilities
|
|
|
655.3
|
|
|
|
(93.0
|
)
|
|
|
(84.3
|
)
|
|
|
|
|
|
|
|
|
|
|
|
|
|
|
|
Partnership adjusted EBITDA
|
|
$
|
421.0
|
|
|
$
|
400.6
|
|
|
$
|
396.1
|
|
|
|
|
|
|
|
|
|
|
|
|
|
|
|
|
|
|
|
(1) |
|
Net of amortization of debt
issuance costs of $2.1 million, $3.9 million and
$6.6 million and amortization of discount and premium
included in interest expense of $2.1 million,
$3.4 million and $0.1 million for 2008, 2009 and 2010.
Excludes affiliate and allocated interest expense.
|
| |
|
(2) |
|
Includes non-controlling interest
percentage of our consolidated investment’s depreciation,
interest expense and maintenance capital expenditures , equity
earnings from unconsolidated investments—net of
distributions, accretion expense associated with asset
retirement obligations, amortization of stock based compensation
and gain (loss) on sale of assets.
|
| |
|
|
|
|
|
|
|
|
|
|
|
|
|
|
|
Year Ended December 31,
|
|
|
|
|
2008
|
|
|
2009
|
|
|
2010
|
|
|
|
|
(In millions)
|
|
|
|
|
Reconciliation of net income (loss) attributable to Targa
Resources Partners LP to Adjusted EBITDA:
|
|
|
|
|
|
|
|
|
|
|
|
|
|
Net income attributable to Targa Resources Partners LP
|
|
$
|
202.1
|
|
|
$
|
(12.1
|
)
|
|
$
|
109.1
|
|
|
Add:
|
|
|
|
|
|
|
|
|
|
|
|
|
|
Interest expense,
net(1)
|
|
|
156.1
|
|
|
|
159.8
|
|
|
|
110.8
|
|
|
Income tax expense
|
|
|
2.9
|
|
|
|
1.2
|
|
|
|
4.0
|
|
|
Depreciation and amortization expenses
|
|
|
156.8
|
|
|
|
166.7
|
|
|
|
176.2
|
|
|
Risk management activities
|
|
|
(85.4
|
)
|
|
|
95.5
|
|
|
|
6.4
|
|
|
Noncontrolling interest adjustment
|
|
|
(11.5
|
)
|
|
|
(10.5
|
)
|
|
|
(10.4
|
)
|
|
|
|
|
|
|
|
|
|
|
|
|
|
|
|
Partnership adjusted EBITDA
|
|
$
|
421.0
|
|
|
$
|
400.6
|
|
|
$
|
396.1
|
|
|
|
|
|
|
|
|
|
|
|
|
|
|
|
|
|
|
|
(1) |
|
Includes affiliate and allocated
interest expense.
|
Consolidated
Results of Operations
Our management uses a variety of financial and operational
measurements to analyze our performance. These measurements
include both measures for the Partnership activities and
measures for the Parent. Partnership measures include gross
margin, operating margin, operating expenses, plant
60
inlet, gross NGL production, adjusted EBITDA and distributable
cash flow, among others. For a discussion of these measures, see
“Management’s Discussion and Analysis of Financial
Condition and Results of Operations—How We Evaluate the
Partnership’s Operations.” The following table and
discussion is a summary of our consolidated results of
operations for the three years ended December 31, 2010.
| |
|
|
|
|
|
|
|
|
|
|
|
|
|
|
|
|
|
|
|
|
|
|
|
|
|
|
|
|
|
|
|
|
|
|
|
|
|
|
|
|
Variance
|
|
|
|
|
Year Ended December 31,
|
|
|
2009 vs. 2008
|
|
|
2010 vs. 2009
|
|
|
|
|
|
|
|
|
|
|
|
|
|
$
|
|
|
%
|
|
|
$
|
|
|
%
|
|
|
|
|
2008
|
|
|
2009
|
|
|
2010
|
|
|
Change
|
|
|
Change
|
|
|
Change
|
|
|
Change
|
|
|
|
|
(In millions, except operating and price amounts)
|
|
|
|
|
Revenues(1)
|
|
$
|
7,998.9
|
|
|
$
|
4,536.0
|
|
|
$
|
5,469.2
|
|
|
$
|
(3,462.9
|
)
|
|
|
(43.3
|
)%
|
|
$
|
933.2
|
|
|
|
20.57
|
%
|
|
Product purchases
|
|
|
7,218.5
|
|
|
|
3,791.1
|
|
|
|
4,687.7
|
|
|
|
(3,427.4
|
)
|
|
|
(47.5
|
)%
|
|
|
896.6
|
|
|
|
23.65
|
%
|
|
|
|
|
|
|
|
|
|
|
|
|
|
|
|
|
|
|
|
|
|
|
|
|
|
|
|
|
|
|
|
Gross margin
|
|
|
780.4
|
|
|
|
744.9
|
|
|
|
781.5
|
|
|
|
(35.5
|
)
|
|
|
(4.5
|
)%
|
|
|
36.6
|
|
|
|
4.91
|
%
|
|
Operating expenses
|
|
|
275.2
|
|
|
|
235.0
|
|
|
|
260.2
|
|
|
|
(40.2
|
)
|
|
|
(14.6
|
)%
|
|
|
25.2
|
|
|
|
10.72
|
%
|
|
|
|
|
|
|
|
|
|
|
|
|
|
|
|
|
|
|
|
|
|
|
|
|
|
|
|
|
|
|
|
Operating margin
|
|
|
505.2
|
|
|
|
509.9
|
|
|
|
521.3
|
|
|
|
4.7
|
|
|
|
0.93
|
%
|
|
|
11.4
|
|
|
|
2.24
|
%
|
|
Depreciation and amortization expenses
|
|
|
160.9
|
|
|
|
170.3
|
|
|
|
185.5
|
|
|
|
9.4
|
|
|
|
5.84
|
%
|
|
|
15.2
|
|
|
|
8.93
|
%
|
|
General and administrative expenses
|
|
|
96.4
|
|
|
|
120.4
|
|
|
|
144.4
|
|
|
|
24.0
|
|
|
|
24.9
|
%
|
|
|
24.0
|
|
|
|
19.93
|
%
|
|
Other
|
|
|
13.4
|
|
|
|
2.0
|
|
|
|
(4.7
|
)
|
|
|
(11.4
|
)
|
|
|
(85.1
|
)%
|
|
|
(6.7
|
)
|
|
|
(335.0
|
)%
|
|
|
|
|
|
|
|
|
|
|
|
|
|
|
|
|
|
|
|
|
|
|
|
|
|
|
|
|
|
|
|
Income from operations
|
|
|
234.5
|
|
|
|
217.2
|
|
|
|
196.1
|
|
|
|
(17.3
|
)
|
|
|
(7.4
|
)%
|
|
|
(21.1
|
)
|
|
|
(9.7
|
)%
|
|
Interest expense, net
|
|
|
(141.2
|
)
|
|
|
(132.1
|
)
|
|
|
(110.9
|
)
|
|
|
9.1
|
|
|
|
(6.4
|
)%
|
|
|
21.2
|
|
|
|
(16.0
|
)%
|
|
Gain on insurance claims
|
|
|
18.5
|
|
|
|
—
|
|
|
|
—
|
|
|
|
(18.5
|
)
|
|
|
(100.0
|
)%
|
|
|
—
|
|
|
|
|
*
|
|
Equity in earnings of unconsolidated investments
|
|
|
14.0
|
|
|
|
5.0
|
|
|
|
5.4
|
|
|
|
(9.0
|
)
|
|
|
(64.3
|
)%
|
|
|
0.4
|
|
|
|
8
|
%
|
|
Gain (loss) on debt repurchases
|
|
|
25.6
|
|
|
|
(1.5
|
)
|
|
|
(17.4
|
)
|
|
|
(27.1
|
)
|
|
|
(105.9
|
)%
|
|
|
(15.9
|
)
|
|
|
1,060
|
%
|
|
Gain on early debt extinguishment
|
|
|
3.6
|
|
|
|
9.7
|
|
|
|
12.5
|
|
|
|
6.1
|
|
|
|
169.44
|
%
|
|
|
2.8
|
|
|
|
28.87
|
%
|
|
Gain (loss) on
mark-to-market
derivative instruments
|
|
|
(1.3
|
)
|
|
|
0.3
|
|
|
|
(0.4
|
)
|
|
|
1.6
|
|
|
|
(123.1
|
)%
|
|
|
(0.7
|
)
|
|
|
(233.3
|
)%
|
|
Other
|
|
|
—
|
|
|
|
1.2
|
|
|
|
0.5
|
|
|
|
1.2
|
|
|
|
|
*
|
|
|
(0.7
|
)
|
|
|
(58.3
|
)%
|
|
Income tax expense
|
|
|
(19.3
|
)
|
|
|
(20.7
|
)
|
|
|
(22.5
|
)
|
|
|
(1.4
|
)
|
|
|
7.25
|
%
|
|
|
(1.8
|
)
|
|
|
8.7
|
%
|
|
|
|
|
|
|
|
|
|
|
|
|
|
|
|
|
|
|
|
|
|
|
|
|
|
|
|
|
|
|
|
Net income
|
|
|
134.4
|
|
|
|
79.1
|
|
|
|
63.3
|
|
|
|
(55.3
|
)
|
|
|
(41.1
|
)%
|
|
|
(15.8
|
)
|
|
|
(20.0
|
)%
|
|
Less: Net income attributable to noncontrolling interest
|
|
|
97.1
|
|
|
|
49.8
|
|
|
|
78.3
|
|
|
|
(47.3
|
)
|
|
|
(48.7
|
)%
|
|
|
28.5
|
|
|
|
57.23
|
%
|
|
|
|
|
|
|
|
|
|
|
|
|
|
|
|
|
|
|
|
|
|
|
|
|
|
|
|
|
|
|
|
Net income (loss) attributable to Targa Resources Corp.
|
|
|
37.3
|
|
|
|
29.3
|
|
|
|
(15.0
|
)
|
|
|
(8.0
|
)
|
|
|
(21.4
|
)%
|
|
|
(44.3
|
)
|
|
|
(151.2
|
)%
|
|
Dividends on Series B preferred stock
|
|
|
(16.8
|
)
|
|
|
(17.8
|
)
|
|
|
(9.5
|
)
|
|
|
(1.0
|
)
|
|
|
5.95
|
%
|
|
|
8.3
|
|
|
|
(46.6
|
)%
|
|
Less:
|
|
|
|
|
|
|
|
|
|
|
|
|
|
|
|
|
|
|
|
|
|
|
|
|
|
|
|
|
|
Undistributed earnings attributable to preferred shareholders
|
|
|
(20.5
|
)
|
|
|
(11.5
|
)
|
|
|
—
|
|
|
|
9.0
|
|
|
|
(43.9
|
)%
|
|
|
11.5
|
|
|
|
(100
|
)%
|
|
Dividends to common equivalents
|
|
|
—
|
|
|
|
—
|
|
|
|
(177.8
|
)
|
|
|
—
|
|
|
|
—
|
|
|
|
(177.8
|
)
|
|
|
—
|
|
|
|
|
|
|
|
|
|
|
|
|
|
|
|
|
|
|
|
|
|
|
|
|
|
|
|
|
|
|
|
|
Net income (loss) available to common shareholders
|
|
$
|
—
|
|
|
$
|
—
|
|
|
|
(202.3
|
)
|
|
$
|
—
|
|
|
$
|
—
|
|
|
$
|
(202.3
|
)
|
|
|
—
|
|
|
|
|
|
|
|
|
|
|
|
|
|
|
|
|
|
|
|
|
|
|
|
|
|
|
|
|
|
|
|
|
Operating statistics:
|
|
|
|
|
|
|
|
|
|
|
|
|
|
|
|
|
|
|
|
|
|
|
|
|
|
|
|
|
|
Plant natural gas inlet,
MMcf/d(2)(3)
|
|
|
1,846.4
|
|
|
|
2,139.8
|
|
|
|
2,268.0
|
|
|
|
293.4
|
|
|
|
15.9
|
%
|
|
|
128.2
|
|
|
|
5.99
|
%
|
|
Gross NGL production, MBbl/d
|
|
|
101.9
|
|
|
|
118.3
|
|
|
|
121.2
|
|
|
|
16.4
|
|
|
|
16.1
|
%
|
|
|
2.9
|
|
|
|
2.45
|
%
|
|
Natural gas sales,
BBtu/d(3)
|
|
|
532.1
|
|
|
|
598.4
|
|
|
|
685.1
|
|
|
|
66.3
|
|
|
|
12.5
|
%
|
|
|
86.7
|
|
|
|
14.49
|
%
|
|
NGL sales, MBbl/d
|
|
|
286.9
|
|
|
|
279.7
|
|
|
|
251.5
|
|
|
|
(7.2
|
)
|
|
|
(3
|
)%
|
|
|
(28.2
|
)
|
|
|
(10.1
|
)%
|
|
Condensate sales, MBbl/d
|
|
|
3.8
|
|
|
|
4.7
|
|
|
|
3.5
|
|
|
|
0.9
|
|
|
|
23.7
|
%
|
|
|
(1.2
|
)
|
|
|
(25.5
|
)%
|
|
Average realized
prices:(4)
|
|
|
|
|
|
|
|
|
|
|
|
|
|
|
|
|
|
|
|
|
|
|
|
|
|
|
|
|
|
Natural gas, $/MMBtu
|
|
$
|
8.20
|
|
|
$
|
3.96
|
|
|
|
4.43
|
|
|
$
|
(4.24
|
)
|
|
|
(51.8
|
)%
|
|
$
|
0.48
|
|
|
|
12
|
%
|
|
NGL, $/gal
|
|
|
1.38
|
|
|
|
0.79
|
|
|
|
1.06
|
|
|
|
(0.59
|
)
|
|
|
(43
|
)%
|
|
|
0.27
|
|
|
|
34.7
|
%
|
|
Condensate, $/Bbl
|
|
|
91.28
|
|
|
|
56.32
|
|
|
|
73.68
|
|
|
|
(34.96
|
)
|
|
|
(38
|
)%
|
|
|
17.37
|
|
|
|
30.8
|
%
|
|
Balance Sheet Data (at end of period):
|
|
|
|
|
|
|
|
|
|
|
|
|
|
|
|
|
|
|
|
|
|
|
|
|
|
|
|
|
|
Property, plant and equipment, net
|
|
$
|
2,617.4
|
|
|
$
|
2,548.1
|
|
|
$
|
2,509.0
|
|
|
$
|
(69.3
|
)
|
|
|
(3
|
)%
|
|
$
|
(39.1
|
)
|
|
|
(2
|
)%
|
|
Total assets
|
|
|
3,641.8
|
|
|
|
3,367.5
|
|
|
|
3,393.8
|
|
|
|
(274.3
|
)
|
|
|
(8
|
)%
|
|
|
22.7
|
|
|
|
0.7
|
%
|
|
Long-term debt less current maturities
|
|
|
1,976.5
|
|
|
|
1,593.5
|
|
|
|
1,534.7
|
|
|
|
(383.0
|
)
|
|
|
(19
|
)%
|
|
|
(58.8
|
)
|
|
|
(4
|
)%
|
|
Convertible cumulative participating Series B preferred
stock
|
|
|
290.6
|
|
|
|
308.4
|
|
|
|
—
|
|
|
|
17.8
|
|
|
|
6.1
|
%
|
|
|
(308.4
|
)
|
|
|
(100
|
)%
|
|
Total owners’ equity
|
|
|
822.0
|
|
|
|
754.9
|
|
|
|
1,036.1
|
|
|
|
(67.1
|
)
|
|
|
(8
|
)%
|
|
|
288.1
|
|
|
|
38.2
|
%
|
|
Cash Flow Data:
|
|
|
|
|
|
|
|
|
|
|
|
|
|
|
|
|
|
|
|
|
|
|
|
|
|
|
|
|
|
Net cash provided by (used in):
|
|
|
|
|
|
|
|
|
|
|
|
|
|
|
|
|
|
|
|
|
|
|
|
|
|
|
|
|
|
Operating activities
|
|
$
|
390.7
|
|
|
$
|
335.8
|
|
|
$
|
208.5
|
|
|
$
|
(54.9
|
)
|
|
|
(14.1
|
)%
|
|
$
|
(127.3
|
)
|
|
|
(37.9
|
)%
|
|
Investing activities
|
|
|
(206.7
|
)
|
|
|
(59.3
|
)
|
|
|
(134.6
|
)
|
|
|
147.4
|
|
|
|
(71.3
|
)%
|
|
|
(75.3
|
)
|
|
|
127.0
|
%
|
|
Financing activities
|
|
|
0.9
|
|
|
|
(386.9
|
)
|
|
|
(137.9
|
)
|
|
|
(387.8
|
)
|
|
|
(43,089
|
)%
|
|
|
249.0
|
|
|
|
(64.4
|
)%
|
|
|
|
|
(1) |
|
Includes business interruption
insurance proceeds of $32.9 million, $21.5 million and
$6.0 million for the years ended December 31, 2008,
2009 and 2010.
|
| |
|
(2) |
|
Plant natural gas inlet represents
the volume of natural gas passing through the meter located at
the inlet of a natural gas processing plant.
|
61
|
|
|
|
(3) |
|
Plant natural gas inlet volumes
include producer
take-in-kind
volumes, while natural gas sales exclude producer
take-in-kind
volumes.
|
| |
|
(4) |
|
Average realized prices include the
impact of hedging activities.
|
| |
|
* |
|
Not meaningful
|
Year Ended
December 31, 2009 Compared to Year Ended December 31,
2008
Revenue decreased $3,462.9 million due to lower commodity
prices ($3,516.5 million), lower NGL sales volumes
($169.4 million) and lower business interruption insurance
proceeds ($11.4 million) offset by higher natural gas and
condensate sales volumes ($222.1 million) and higher
fee-based and other revenues ($12.3 million).
The $35.5 million decrease in gross margin reflects lower
revenue ($3,462.9 million) offset by a reduction in product
purchase costs ($3,427.4 million). For additional
information regarding the period to period changes in our gross
margins, see “—Results of Operations—By
Segment.”
The decrease in operating expenses was primarily due to lower
fuel, utilities and catalyst expenses ($20.6 million),
lower maintenance and supplies expenses ($20.6 million),
and lower contract labor costs ($7.8 million), partially
offset by a lower level of cost recovery billings to others
($6.5 million). Year over year comparisons of operating
expenses are affected by the consolidation of VESCO starting
August 1, 2008, following our acquisition of majority
ownership in this operation. Had VESCO been consolidated for all
of 2008, operating expenses would have been $17.1 million
higher for 2008. See “—Results of Operations—By
Segment” for additional discussion regarding changes in
operating expenses.
The increase in depreciation and amortization expenses is
primarily attributable to assets acquired in 2008 that had a
full period of depreciation and capital expenditures in 2009 of
$170.3 million.
The increase in general and administrative expenses was
primarily due to higher compensation related expenses
($17.0 million) and increased insurance expenses
($6.0 million), reflecting higher property casualty
premiums following significant 2008 Gulf Coast hurricane
activity.
Other operating items were an overall loss of $2.0 million
during 2009 versus a loss of $13.4 million during 2008,
when we recorded a $19.3 million loss provision for
property damage from Hurricanes Gustav and Ike net of expected
insurance recoveries. During 2009 the loss provision was reduced
by $3.7 million. A $5.9 million gain from a like-kind
exchange of pipeline assets was also realized during 2008.
The decrease in interest expense is due to reduction of debt
levels due to our sale of certain of our assets to the
Partnership coupled with sales of Partnership equity and
increased debt at the Partnership. See “—Liquidity and
Capital Resources” for information regarding our
outstanding debt obligations.
The decrease in equity in earnings of unconsolidated investments
is due to our acquisition of majority ownership in and
consolidation of VESCO beginning August 1, 2008.
The net decrease in gains from debt transactions includes a
$27.1 million decrease in gain on debt repurchases
partially offset by a $6.1 million increase in gain on debt
extinguishment. See ‘‘—Liquidity and Capital
Resources” for information regarding our outstanding debt
obligations.
The increase in gain on
mark-to-market
derivative instruments was due to favorable changes in commodity
prices and our adjusting $1.6 million in fair value of
certain contracts with Lehman Brothers Commodity Services Inc.
to zero as a result of the Lehman Brothers bankruptcy filing.
Net income attributable to noncontrolling interests decreased
from $97.1 million for the twelve months ended
December 31, 2008 to $49.8 million for the twelve
months ended December 31, 2009. $20.0 million of the
decrease was due to decreased net income subject to
noncontrolling interest for CBF and Versado, partially offset by
an increase of $6.2 million for VESCO due to the purchase
of Chevron’s interest in August 2008. In addition, net
income subject to noncontrolling interest for the Partnership
decreased in 2009, partially offset by the September 2009
dropdown of the Downstream Business into the Partnership. In
addition, our ownership in the Partnership increased in 2009 to
33.9% versus 26.5% at the prior year-end due to the impact of
the Downstream dropdown, partially offset by the Partnership
sales of
62
common units in August 2009. After adjusting for the impact of
the IDRs, our weighted average percentages of net income were
40.5% in 2009 and 30.1% in 2008.
Year Ended
December 31, 2010 Compared to Year Ended December 31,
2009
Revenue increased $933.2 million due to higher realized
commodity prices ($1,200.9 million) offset by lower sales
volumes ($247.6 million), lower fee-based and other
revenues ($5.5 million) and lower business interruption
insurance proceeds ($15.5 million).
The $36.6 million increase in gross margin reflects higher
revenues ($933.2 million) offset by higher product purchase
costs ($896.7 million). For additional information
regarding the period to period changes in our gross margins, see
“—Results of Operations—By Segment.”
The $25.2 million increase in operating expenses was
primarily attributable to increased compensation and benefits
expense ($14.6 million), increased maintenance costs and
utility costs of ($14.5 million), partially offset by lower
contract services and professional fees of $6.1 million.
See “—Results of Operations—By Segment” for
additional discussion regarding changes in operating expenses.
The increase in depreciation and amortization expenses of
$15.2 million is attributable to a $10.8 million
impairment charge related to idled terminal and processing
assets as well as assets acquired in 2009 that have a full
period of depreciation in 2010 and capital expenditures in 2010
of $147.2 million.
General and administrative expenses increased $24.0 million
reflecting increased professional services and special
compensation expense related to our December IPO.
Other operating items were an overall gain of $4.7 million
during 2010 versus an overall loss of $2.0 million during
2009. This improvement primarily reflects lower project
abandonment costs during 2010. Both years included income
related to favorable outcomes on hurricane repair outlays and
insurance recoveries.
The decrease in interest expense of $21.2 million is due to
reductions in our total outstanding indebtedness primarily
funded by equity issuances by the Partnership. See
“—Liquidity and Capital Resources” for
information regarding our outstanding debt obligations.
The effects of an overall net loss on debt retirements lowered
pre-tax earnings by $13.1 million.
Net income attributable to noncontrolling interests increased
from $49.8 million for the twelve months ended
December 31, 2009 to $78.3 million for the twelve
months ended December 31, 2010. $5.5 million of the
increase was due to increased net income subject to
noncontrolling interest for CBF, Versado and VESCO. In addition,
net income subject to noncontrolling interest for the
Partnership increased in 2010, primarily due to the impact of
the full year ownership of the Downstream Business by the
Partnership, as well as the partial year impact of the 2010
dropdowns of assets into the Partnership. In addition, our
ownership interest in the Partnership decreased in 2010 due to
the impact of the secondary sales of our units to the public in
April 2010, as well as the Partnership’s sales of common
units in January and August 2010. At December 31, 2010 our
ownership in the Partnership was 17.1% versus 33.9% at year-end
2009. After adjusting for the impact of the incentive
distribution rights, our weighted average percentages of net
income were 35.5% in 2010 and 40.5% in 2009.
Dividends were paid to our Series B Preferred shareholders
in April 2010 and November 2010, which reduced the accretive
value of these shares. At our IPO, the outstanding Series B
Preferred shares converted to common shares.
Consolidated
Results of Operations—Partnership versus
Non-Partnership
The following table breaks down the consolidated results of
operations for the three years ended December 31, 2010 into
Partnership and our standalone (“TRC Non-Partnership”)
financial results.
63
Partnership results are presented on a common control accounting
basis. A discussion of the TRC Non-Partnership financial results
follows this table.
| |
|
|
|
|
|
|
|
|
|
|
|
|
|
|
|
|
|
|
|
|
|
|
|
|
|
|
|
|
|
|
|
|
|
|
|
|
|
|
|
2008
|
|
|
2009
|
|
|
2010
|
|
|
|
|
|
|
|
|
|
|
|
|
|
Targa
|
|
|
|
|
|
|
|
|
Targa
|
|
|
|
|
|
|
|
|
|
|
Targa
|
|
|
Targa
|
|
|
|
|
|
Resources
|
|
|
Targa
|
|
|
|
|
|
Resources
|
|
|
Targa
|
|
|
|
|
|
|
|
Resources
|
|
|
Resources
|
|
|
TRC-Non-
|
|
|
Corp.
|
|
|
Resources
|
|
|
TRC-Non-
|
|
|
Corp.
|
|
|
Resources
|
|
|
TRC-Non-
|
|
|
|
|
Corp. Consolidated
|
|
|
Partners, LP
|
|
|
partnership
|
|
|
Consolidated
|
|
|
Partners, LP
|
|
|
partnership
|
|
|
Consolidated
|
|
|
Partners, LP
|
|
|
partnership
|
|
|
|
|
(In millions)
|
|
|
|
|
|
|
|
|
|
|
|
|
|
|
|
|
|
|
|
|
|
|
|
|
|
|
|
|
|
|
|
|
|
|
|
|
|
|
|
|
|
|
Revenues
|
|
$
|
7,998.9
|
|
|
$
|
8,030.1
|
|
|
$
|
(31.2
|
)
|
|
$
|
4,536.0
|
|
|
$
|
4,503.8
|
|
|
$
|
32.2
|
|
|
$
|
5,469.2
|
|
|
$
|
5,460.2
|
|
|
$
|
9.0
|
|
|
|
|
|
|
|
|
|
|
|
|
|
|
|
|
|
|
|
|
|
|
|
|
|
|
|
|
|
|
|
|
|
|
|
|
|
|
|
|
Costs and Expenses:
|
|
|
|
|
|
|
|
|
|
|
|
|
|
|
|
|
|
|
|
|
|
|
|
|
|
|
|
|
|
|
|
|
|
|
|
|
|
|
|
|
|
|
|
|
|
|
|
|
|
|
|
|
|
|
|
|
|
|
|
|
|
|
|
|
|
|
|
|
|
|
|
|
|
|
|
Product purchases
|
|
|
7,218.5
|
|
|
|
7,217.2
|
|
|
|
1.3
|
|
|
|
3,791.1
|
|
|
|
3,792.9
|
|
|
|
(1.8
|
)
|
|
|
4,687.7
|
|
|
|
4,688.0
|
|
|
|
(0.3
|
)
|
|
|
|
|
|
|
|
|
|
|
|
|
|
|
|
|
|
|
|
|
|
|
|
|
|
|
|
|
|
|
|
|
|
|
|
|
|
|
|
Operating expenses
|
|
|
275.2
|
|
|
|
274.3
|
|
|
|
0.9
|
|
|
|
235.0
|
|
|
|
234.4
|
|
|
|
0.6
|
|
|
|
260.2
|
|
|
|
259.5
|
|
|
|
0.7
|
|
|
|
|
|
|
|
|
|
|
|
|
|
|
|
|
|
|
|
|
|
|
|
|
|
|
|
|
|
|
|
|
|
|
|
|
|
|
|
|
Depreciation and amortization
|
|
|
160.9
|
|
|
|
156.8
|
|
|
|
4.1
|
|
|
|
170.3
|
|
|
|
166.7
|
|
|
|
3.6
|
|
|
|
185.5
|
|
|
|
176.2
|
|
|
|
9.3
|
|
|
|
|
|
|
|
|
|
|
|
|
|
|
|
|
|
|
|
|
|
|
|
|
|
|
|
|
|
|
|
|
|
|
|
|
|
|
|
|
General and administrative
|
|
|
96.4
|
|
|
|
97.3
|
|
|
|
(0.9
|
)
|
|
|
120.4
|
|
|
|
118.5
|
|
|
|
1.9
|
|
|
|
144.4
|
|
|
|
122.4
|
|
|
|
22.0
|
|
|
|
|
|
|
|
|
|
|
|
|
|
|
|
|
|
|
|
|
|
|
|
|
|
|
|
|
|
|
|
|
|
|
|
|
|
|
|
|
Other
|
|
|
13.4
|
|
|
|
13.4
|
|
|
|
—
|
|
|
|
2.0
|
|
|
|
(3.6
|
)
|
|
|
5.6
|
|
|
|
(4.7
|
)
|
|
|
(3.3
|
)
|
|
|
(1.4
|
)
|
|
|
|
|
|
|
|
|
|
|
|
|
|
|
|
|
|
|
|
|
|
|
|
|
|
|
|
|
|
|
|
|
|
|
|
|
|
|
|
|
|
|
|
|
|
|
|
|
|
|
|
|
|
|
|
|
|
|
|
|
|
|
|
|
|
|
|
|
|
|
|
|
|
|
|
|
|
|
|
|
7,764.4
|
|
|
|
7,759.0
|
|
|
|
5.4
|
|
|
|
4,318.8
|
|
|
|
4,308.9
|
|
|
|
9.9
|
|
|
|
5,273.1
|
|
|
|
5,242.8
|
|
|
|
30.3
|
|
|
|
|
|
|
|
|
|
|
|
|
|
|
|
|
|
|
|
|
|
|
|
|
|
|
|
|
|
|
|
|
|
|
|
|
|
|
|
|
|
|
|
|
|
|
|
|
|
|
|
|
|
|
|
|
|
|
|
|
|
|
|
|
|
|
|
|
|
|
|
|
|
|
|
|
|
|
Income from operations
|
|
|
234.5
|
|
|
|
271.1
|
|
|
|
(36.6
|
)
|
|
|
217.2
|
|
|
|
194.9
|
|
|
|
22.3
|
|
|
|
196.1
|
|
|
|
217.4
|
|
|
|
(21.3
|
)
|
|
|
|
|
|
|
|
|
|
|
|
|
|
|
|
|
|
|
|
|
|
|
|
|
|
|
|
|
|
|
|
|
|
|
|
|
|
|
|
Other income (expense):
|
|
|
|
|
|
|
|
|
|
|
|
|
|
|
|
|
|
|
|
|
|
|
|
|
|
|
|
|
|
|
|
|
|
|
|
|
|
|
|
|
|
|
|
|
|
|
|
|
|
|
|
|
|
|
|
|
|
|
|
|
|
|
|
|
|
|
|
|
|
|
|
|
|
|
|
Interest expense, net—Third Party
|
|
|
(141.2
|
)
|
|
|
(38.9
|
)
|
|
|
(102.3
|
)
|
|
|
(132.1
|
)
|
|
|
(52.1
|
)
|
|
|
(80.0
|
)
|
|
|
(110.9
|
)
|
|
|
(81.4
|
)
|
|
|
(29.5
|
)
|
|
|
|
|
|
|
|
|
|
|
|
|
|
|
|
|
|
|
|
|
|
|
|
|
|
|
|
|
|
|
|
|
|
|
|
|
|
|
|
Interest expense—Intercompany
|
|
|
—
|
|
|
|
(117.2
|
)
|
|
|
117.2
|
|
|
|
—
|
|
|
|
(107.7
|
)
|
|
|
107.7
|
|
|
|
—
|
|
|
|
(29.4
|
)
|
|
|
29.4
|
|
|
|
|
|
|
|
|
|
|
|
|
|
|
|
|
|
|
|
|
|
|
|
|
|
|
|
|
|
|
|
|
|
|
|
|
|
|
|
|
Equity in earnings of unconsolidated investments
|
|
|
14.0
|
|
|
|
14.0
|
|
|
|
—
|
|
|
|
5.0
|
|
|
|
5.0
|
|
|
|
—
|
|
|
|
5.4
|
|
|
|
5.4
|
|
|
|
—
|
|
|
|
|
|
|
|
|
|
|
|
|
|
|
|
|
|
|
|
|
|
|
|
|
|
|
|
|
|
|
|
|
|
|
|
|
|
|
|
|
Gain (loss) on debt repurchases
|
|
|
|
|
|
|
—
|
|
|
|
—
|
|
|
|
(1.5
|
)
|
|
|
(1.5
|
)
|
|
|
—
|
|
|
|
(17.4
|
)
|
|
|
—
|
|
|
|
(17.4
|
)
|
|
|
|
|
|
|
|
|
|
|
|
|
|
|
|
|
|
|
|
|
|
|
|
|
|
|
|
|
|
|
|
|
|
|
|
|
|
|
|
Gain (loss) on debt extinguishment
|
|
|
29.2
|
|
|
|
13.1
|
|
|
|
16.1
|
|
|
|
9.7
|
|
|
|
—
|
|
|
|
9.7
|
|
|
|
12.5
|
|
|
|
—
|
|
|
|
12.5
|
|
|
|
|
|
|
|
|
|
|
|
|
|
|
|
|
|
|
|
|
|
|
|
|
|
|
|
|
|
|
|
|
|
|
|
|
|
|
|
|
Gain on insurance claims
|
|
|
18.5
|
|
|
|
18.5
|
|
|
|
—
|
|
|
|
—
|
|
|
|
—
|
|
|
|
—
|
|
|
|
—
|
|
|
|
—
|
|
|
|
—
|
|
|
|
|
|
|
|
|
|
|
|
|
|
|
|
|
|
|
|
|
|
|
|
|
|
|
|
|
|
|
|
|
|
|
|
|
|
|
|
|
Gain (loss) on
mark-to-market
derivative instruments
|
|
|
(1.3
|
)
|
|
|
76.4
|
|
|
|
(77.7
|
)
|
|
|
0.3
|
|
|
|
(30.9
|
)
|
|
|
31.2
|
|
|
|
(0.4
|
)
|
|
|
26.0
|
|
|
|
(26.4
|
)
|
|
|
|
|
|
|
|
|
|
|
|
|
|
|
|
|
|
|
|
|
|
|
|
|
|
|
|
|
|
|
|
|
|
|
|
|
|
|
|
Other income (expense)
|
|
|
—
|
|
|
|
1.1
|
|
|
|
(1.1
|
)
|
|
|
1.2
|
|
|
|
0.7
|
|
|
|
0.5
|
|
|
|
0.5
|
|
|
|
—
|
|
|
|
0.5
|
|
|
|
|
|
|
|
|
|
|
|
|
|
|
|
|
|
|
|
|
|
|
|
|
|
|
|
|
|
|
|
|
|
|
|
|
|
|
|
|
|
|
|
|
|
|
|
|
|
|
|
|
|
|
|
|
|
|
|
|
|
|
|
|
|
|
|
|
|
|
|
|
|
|
|
|
|
|
Income before income taxes
|
|
|
153.7
|
|
|
|
238.1
|
|
|
|
(84.4
|
)
|
|
|
99.8
|
|
|
|
8.4
|
|
|
|
91.4
|
|
|
|
85.8
|
|
|
|
138.0
|
|
|
|
(52.2
|
)
|
|
|
|
|
|
|
|
|
|
|
|
|
|
|
|
|
|
|
|
|
|
|
|
|
|
|
|
|
|
|
|
|
|
|
|
|
|
|
|
Income tax (expense) benefit
|
|
|
|
|
|
|
|
|
|
|
|
|
|
|
|
|
|
|
|
|
|
|
|
|
|
|
|
|
|
|
|
|
|
|
|
|
|
|
|
|
|
|
|
|
|
|
|
|
|
|
|
|
|
|
|
|
|
|
|
|
|
|
|
|
|
|
|
|
|
|
|
|
|
|
|
Current
|
|
|
(1.3
|
)
|
|
|
(0.8
|
)
|
|
|
(0.5
|
)
|
|
|
(1.6
|
)
|
|
|
(0.3
|
)
|
|
|
(1.3
|
)
|
|
|
10.6
|
|
|
|
(2.8
|
)
|
|
|
13.4
|
|
|
|
|
|
|
|
|
|
|
|
|
|
|
|
|
|
|
|
|
|
|
|
|
|
|
|
|
|
|
|
|
|
|
|
|
|
|
|
|
Deferred
|
|
|
(18.0
|
)
|
|
|
(2.1
|
)
|
|
|
(15.9
|
)
|
|
|
(19.1
|
)
|
|
|
(0.9
|
)
|
|
|
(18.2
|
)
|
|
|
(33.1
|
)
|
|
|
(1.2
|
)
|
|
|
(31.9
|
)
|
|
|
|
|
|
|
|
|
|
|
|
|
|
|
|
|
|
|
|
|
|
|
|
|
|
|
|
|
|
|
|
|
|
|
|
|
|
|
|
|
|
|
|
|
|
|
|
|
|
|
|
|
|
|
|
|
|
|
|
|
|
|
|
|
|
|
|
|
|
|
|
|
|
|
|
|
|
|
|
|
(19.3
|
)
|
|
|
(2.9
|
)
|
|
|
(16.4
|
)
|
|
|
(20.7
|
)
|
|
|
(1.2
|
)
|
|
|
(19.5
|
)
|
|
|
(22.5
|
)
|
|
|
(4.0
|
)
|
|
|
(18.5
|
)
|
|
|
|
|
|
|
|
|
|
|
|
|
|
|
|
|
|
|
|
|
|
|
|
|
|
|
|
|
|
|
|
|
|
|
|
|
|
|
|
|
|
|
|
|
|
|
|
|
|
|
|
|
|
|
|
|
|
|
|
|
|
|
|
|
|
|
|
|
|
|
|
|
|
|
|
|
|
Net income (loss)
|
|
|
134.4
|
|
|
|
235.2
|
|
|
|
(100.8
|
)
|
|
|
79.1
|
|
|
|
7.2
|
|
|
|
71.9
|
|
|
|
63.3
|
|
|
|
134.0
|
|
|
|
(70.7
|
)
|
|
|
|
|
|
|
|
|
|
|
|
|
|
|
|
|
|
|
|
|
|
|
|
|
|
|
|
|
|
|
|
|
|
|
|
|
|
|
|
Less: Net income attributable to noncontrolling interest
|
|
|
97.1
|
|
|
|
33.1
|
|
|
|
64.0
|
|
|
|
49.8
|
|
|
|
19.3
|
|
|
|
30.5
|
|
|
|
78.3
|
|
|
|
24.9
|
|
|
|
53.4
|
|
|
|
|
|
|
|
|
|
|
|
|
|
|
|
|
|
|
|
|
|
|
|
|
|
|
|
|
|
|
|
|
|
|
|
|
|
|
|
|
|
|
|
|
|
|
|
|
|
|
|
|
|
|
|
|
|
|
|
|
|
|
|
|
|
|
|
|
|
|
|
|
|
|
|
|
|
|
Net income (loss) attributable to TRC
|
|
$
|
37.3
|
|
|
$
|
202.1
|
|
|
$
|
(164.8
|
)
|
|
$
|
29.3
|
|
|
$
|
(12.1
|
)
|
|
$
|
41.4
|
|
|
$
|
(15.0
|
)
|
|
$
|
109.1
|
|
|
$
|
(124.1
|
)
|
|
|
|
|
|
|
|
|
|
|
|
|
|
|
|
|
|
|
|
|
|
|
|
|
|
|
|
|
|
|
|
|
|
|
|
|
|
|
64
The following table provides details of the TRC Non-Partnership
results displayed in the table above:
| |
|
|
|
|
|
|
|
|
|
|
|
|
|
|
|
2008
|
|
2009
|
|
2010
|
|
|
|
(In millions)
|
|
|
|
Revenues
|
|
|
|
|
|
|
|
|
|
|
|
|
|
Business interruption revenues (post dropdown) retained by TRC
Non-Partnership
|
|
$
|
—
|
|
|
$
|
8.2
|
|
|
$
|
6.0
|
|
|
Settlements on pre-dropdown derivatives not qualifying for hedge
treatment in separate Partnership financial statements
|
|
|
(31.2
|
)
|
|
|
24.0
|
|
|
|
3.0
|
|
|
Costs & Expenses
|
|
|
|
|
|
|
|
|
|
|
|
|
|
Product purchases for assets excluded from dropdown transactions
|
|
|
1.3
|
|
|
|
(1.8
|
)
|
|
|
(0.3
|
)
|
|
Operating expenses for assets excluded from dropdown transactions
|
|
|
0.9
|
|
|
|
0.6
|
|
|
|
0.7
|
|
|
Depreciation on excluded and corporate assets
|
|
|
4.1
|
|
|
|
3.6
|
|
|
|
9.3
|
|
|
G&A expenses retained by TRC Non-Partnership
|
|
|
(0.9
|
)
|
|
|
1.9
|
|
|
|
22.0
|
|
|
Project abandonments and loss (gain) on property retirements and
sales related to excluded assets
|
|
|
—
|
|
|
|
5.6
|
|
|
|
(1.4
|
)
|
|
Other income (expense)
|
|
|
|
|
|
|
|
|
|
|
|
|
|
Interest expense on TRC Non-Partnership debt
|
|
|
(102.3
|
)
|
|
|
(80.0
|
)
|
|
|
(29.5
|
)
|
|
Interest income on intercompany debt
|
|
|
117.2
|
|
|
|
107.7
|
|
|
|
29.4
|
|
|
Gain (loss) on purchases and extinguishments of TRC
Non-Partnership debt obligations
|
|
|
16.1
|
|
|
|
9.7
|
|
|
|
(4.9
|
)
|
|
Reversal of Partnership
mark-to-market
derivatives gain (losses) qualifying for hedge accounting by
Parent
|
|
|
(77.7
|
)
|
|
|
31.2
|
|
|
|
(26.4
|
)
|
|
Other
|
|
|
(1.1
|
)
|
|
|
0.5
|
|
|
|
0.5
|
|
|
Income tax expense (benefit) related to profits and losses taxed
at the TRC Non-Partnership level and impact of dropdown
transactions
|
|
|
(16.4
|
)
|
|
|
(19.5
|
)
|
|
|
(18.5
|
)
|
|
Net income attributable to noncontrolling interest in the
Partnership
|
|
|
64.0
|
|
|
|
30.5
|
|
|
|
53.4
|
|
Results of
Operations—By Segment
We have segregated the following segment operating margin
between Partnership and TRC Non-Partnership activities.
Partnership activities have been presented on a common control
accounting basis which reflects the dropdown transactions as if
they occurred in prior periods. TRC Non-Partnership results
include certain assets and liabilities contractually excluded
from the dropdown transactions and certain historical hedge
activities that could not be reflected as such under GAAP in the
Partnership common control results.
| |
|
|
|
|
|
|
|
|
|
|
|
|
|
|
|
|
|
|
|
|
|
|
|
|
|
|
|
|
|
|
|
Partnership
|
|
|
|
|
|
|
|
|
|
|
Field
|
|
|
Coastal
|
|
|
|
|
|
|
|
|
|
|
|
|
|
|
|
|
|
|
|
Gathering
|
|
|
Gathering
|
|
|
|
|
|
Marketing
|
|
|
|
|
|
|
|
|
Consolidated
|
|
|
|
|
and
|
|
|
and
|
|
|
Logistics
|
|
|
and
|
|
|
|
|
|
TRC Non-
|
|
|
Operating
|
|
|
Year Ended
|
|
Processing
|
|
|
Processing
|
|
|
Assets
|
|
|
Distribution
|
|
|
Other
|
|
|
Partnership
|
|
|
Margin
|
|
|
|
|
(In millions)
|
|
|
|
|
December 31, 2008
|
|
$
|
385.4
|
|
|
$
|
105.4
|
|
|
$
|
40.1
|
|
|
$
|
41.3
|
|
|
$
|
(33.6
|
)
|
|
$
|
(33.4
|
)
|
|
$
|
505.2
|
|
|
December 31, 2009
|
|
|
183.2
|
|
|
|
89.7
|
|
|
|
74.3
|
|
|
|
83.0
|
|
|
|
46.3
|
|
|
|
33.4
|
|
|
|
509.9
|
|
|
December 31, 2010
|
|
|
236.6
|
|
|
|
107.8
|
|
|
|
83.8
|
|
|
|
80.5
|
|
|
|
4.0
|
|
|
|
8.6
|
|
|
|
521.3
|
|
A discussion of the Partnership segment results follows.
65
Results of
Operations of the Partnership—By Segment
Natural Gas
Gathering and Processing Division
Field Gathering
and Processing
| |
|
|
|
|
|
|
|
|
|
|
|
|
|
|
|
|
|
|
|
|
|
|
|
|
|
|
|
|
|
|
|
|
|
|
|
|
|
Variance
|
|
|
|
|
|
|
|
|
|
2009 vs. 2008
|
|
2010 vs. 2009
|
|
|
|
Year Ended December 31,
|
|
$
|
|
%
|
|
$
|
|
%
|
|
|
|
2008
|
|
2009
|
|
2010
|
|
Change
|
|
Change
|
|
Change
|
|
Change
|
|
|
|
($ in millions except average realized prices)
|
|
|
|
Gross margin
|
|
$
|
489.5
|
|
|
$
|
268.3
|
|
|
$
|
338.8
|
|
|
$
|
(221.2
|
)
|
|
|
(45
|
)%
|
|
$
|
70.5
|
|
|
|
26
|
%
|
|
Operating expenses
|
|
|
104.1
|
|
|
|
85.1
|
|
|
|
102.2
|
|
|
|
(19.0
|
)
|
|
|
(18
|
)%
|
|
|
17.1
|
|
|
|
20
|
%
|
|
|
|
|
|
|
|
|
|
|
|
|
|
|
|
|
|
|
|
|
|
|
|
|
|
|
|
|
|
|
|
Operating margin
|
|
$
|
385.4
|
|
|
$
|
183.2
|
|
|
$
|
236.6
|
|
|
$
|
(202.2
|
)
|
|
|
(52
|
)%
|
|
$
|
53.4
|
|
|
|
29
|
%
|
|
|
|
|
|
|
|
|
|
|
|
|
|
|
|
|
|
|
|
|
|
|
|
|
|
|
|
|
|
|
|
Operating statistics:
|
|
|
|
|
|
|
|
|
|
|
|
|
|
|
|
|
|
|
|
|
|
|
|
|
|
|
|
|
|
Plant natural gas inlet,
MMcf/d
|
|
|
584.1
|
|
|
|
581.9
|
|
|
|
587.7
|
|
|
|
(2.2
|
)
|
|
|
(0
|
)%
|
|
|
5.8
|
|
|
|
1
|
%
|
|
Gross NGL production, MBbl/d
|
|
|
68.0
|
|
|
|
69.8
|
|
|
|
71.2
|
|
|
|
(1.8
|
)
|
|
|
3
|
%
|
|
|
1.4
|
|
|
|
2
|
%
|
|
Natural gas sales,
BBtu/d(1)
|
|
|
296.2
|
|
|
|
219.6
|
|
|
|
258.6
|
|
|
|
(76.6
|
)
|
|
|
(26
|
)%
|
|
|
39.0
|
|
|
|
18
|
%
|
|
NGL sales, MBbl/d(1)
|
|
|
54.1
|
|
|
|
56.2
|
|
|
|
56.6
|
|
|
|
2.1
|
|
|
|
4
|
%
|
|
|
0.4
|
|
|
|
1
|
%
|
|
Condensate sales,
MBbl/d(1)
|
|
|
3.5
|
|
|
|
3.2
|
|
|
|
2.9
|
|
|
|
(0.3
|
)
|
|
|
9
|
%
|
|
|
(0.3
|
)
|
|
|
(9
|
)%
|
|
Average realized prices:
|
|
|
|
|
|
|
|
|
|
|
|
|
|
|
|
|
|
|
|
|
|
|
|
|
|
|
|
|
|
Natural gas, $/MMBtu
|
|
$
|
7.55
|
|
|
$
|
3.69
|
|
|
$
|
4.11
|
|
|
$
|
(3.86
|
)
|
|
|
(51
|
)%
|
|
$
|
0.42
|
|
|
|
11
|
%
|
|
NGL, $/gal
|
|
|
1.21
|
|
|
|
0.69
|
|
|
|
0.93
|
|
|
|
(0.52
|
)
|
|
|
(43
|
)%
|
|
|
0.24
|
|
|
|
35
|
%
|
|
Condensate, $/Bbl
|
|
|
86.51
|
|
|
|
55.84
|
|
|
|
75.48
|
|
|
|
(30.67
|
)
|
|
|
(35
|
)%
|
|
|
19.64
|
|
|
|
35
|
%
|
|
|
|
|
(1) |
|
Segment operating statistics
include the effect of intersegment sales, which have been
eliminated from the consolidated presentation. For all volume
statistics presented, the numerator is the total volume sold
during the year and the denominator is the number of calendar
days during the year.
|
Year Ended
December 31, 2009 Compared to Year Ended December 31,
2008
The $221.2 million decrease in gross margin for 2009 was
due to lower commodity sales prices ($853.9 million) and
lower natural gas and condensate sales volumes
($157.2 million) offset by higher NGL sales volumes
($36.1 million), higher fee based and other revenue
($0.1 million) and lower product purchases
($753.8 million). The increased NGL sales volumes were due
primarily to higher NGL production.
The decrease in operating expenses was primarily due to lower
maintenance and supplies expenses ($8.4 million), lower
contract services and professional fees ($4.4 million), and
lower fuel, utilities and catalysts expenses ($3.2 million).
Year Ended
December 31, 2010 Compared to Year Ended December 31,
2009
The $70.5 million increase in gross margin for 2010 was
primarily due to higher commodity sales prices
($303.9 million) and higher natural gas and NGL sales
volumes ($22.6 million) offset by lower condensate sales
volumes ($6.8 million), higher fee based and other revenue
($4.5 million) and higher product purchases
($253.6 million). The increased natural gas and NGL sales
volumes were due primarily to higher natural gas and NGL
production.
The increase in operating expenses was primarily due to higher
system maintenance expenses ($8.2 million), higher
compensation and benefit costs ($4.7 million) and higher
contract and professional service expenses ($2.0 million).
66
Coastal Gathering
and Processing
| |
|
|
|
|
|
|
|
|
|
|
|
|
|
|
|
|
|
|
|
|
|
|
|
|
|
|
|
|
|
|
|
|
|
|
|
|
|
|
|
|
Variance
|
|
|
|
|
|
|
|
|
|
|
|
|
|
2009 vs. 2008
|
|
|
2010 vs. 2009
|
|
|
|
|
Year Ended December 31,
|
|
|
$
|
|
|
%
|
|
|
$
|
|
|
%
|
|
|
|
|
2008
|
|
|
2009
|
|
|
2010
|
|
|
Change
|
|
|
Change
|
|
|
Change
|
|
|
Change
|
|
|
|
|
($ in millions except average realized prices)
|
|
|
|
|
Gross margin
|
|
$
|
136.5
|
|
|
$
|
132.7
|
|
|
$
|
151.2
|
|
|
$
|
(3.8
|
)
|
|
|
(3
|
)%
|
|
$
|
18.5
|
|
|
|
14
|
%
|
|
Operating expenses
|
|
|
31.1
|
|
|
|
43.0
|
|
|
|
43.4
|
|
|
|
11.9
|
|
|
|
38
|
%
|
|
|
0.4
|
|
|
|
1
|
%
|
|
|
|
|
|
|
|
|
|
|
|
|
|
|
|
|
|
|
|
|
|
|
|
|
|
|
|
|
|
|
|
Operating margin
|
|
$
|
105.4
|
|
|
$
|
89.7
|
|
|
$
|
107.8
|
|
|
|
(15.7
|
)
|
|
|
(15
|
)%
|
|
|
18.1
|
|
|
|
20
|
%
|
|
|
|
|
|
|
|
|
|
|
|
|
|
|
|
|
|
|
|
|
|
|
|
|
|
|
|
|
|
|
|
Operating statistics:
|
|
|
|
|
|
|
|
|
|
|
|
|
|
|
|
|
|
|
|
|
|
|
|
|
|
|
|
|
|
Plant natural gas inlet,
MMcf/d(2)
|
|
|
1,262.4
|
|
|
|
1,557.8
|
|
|
|
1,680.3
|
|
|
|
295.4
|
|
|
|
23
|
%
|
|
|
122.5
|
|
|
|
8
|
%
|
|
Gross NGL production, MBbl/d
|
|
|
33.9
|
|
|
|
48.5
|
|
|
|
50.1
|
|
|
|
14.6
|
|
|
|
43
|
%
|
|
|
1.6
|
|
|
|
3
|
%
|
|
Natural gas sales,
BBtu/d(1)
|
|
|
239.4
|
|
|
|
258.4
|
|
|
|
293.6
|
|
|
|
19.0
|
|
|
|
8
|
%
|
|
|
35.2
|
|
|
|
14
|
%
|
|
NGL sales, MBbl/d(1)
|
|
|
31.7
|
|
|
|
40.6
|
|
|
|
43.7
|
|
|
|
8.9
|
|
|
|
28
|
%
|
|
|
3.1
|
|
|
|
8
|
%
|
|
Condensate sales,
MBbl/d(1)
|
|
|
1.5
|
|
|
|
1.6
|
|
|
|
0.5
|
|
|
|
0.1
|
|
|
|
7
|
%
|
|
|
(1.1
|
)
|
|
|
(69
|
)%
|
|
Average realized prices:
|
|
|
|
|
|
|
|
|
|
|
|
|
|
|
|
|
|
|
|
|
|
|
|
|
|
|
|
|
|
Natural gas, $/MMBtu
|
|
$
|
9.00
|
|
|
$
|
4.00
|
|
|
$
|
4.48
|
|
|
$
|
(5.00
|
)
|
|
|
(56
|
)%
|
|
$
|
0.48
|
|
|
|
12
|
%
|
|
NGL, $/gal
|
|
|
1.34
|
|
|
|
0.77
|
|
|
|
1.03
|
|
|
|
(0.57
|
)
|
|
|
(43
|
)%
|
|
|
0.26
|
|
|
|
34
|
%
|
|
Condensate, $/Bbl
|
|
|
90.10
|
|
|
|
53.31
|
|
|
|
78.82
|
|
|
|
(36.79
|
)
|
|
|
(41
|
)%
|
|
|
25.51
|
|
|
|
48
|
%
|
|
|
|
|
(1) |
|
Segment operating statistics
include the effect of intersegment sales, which have been
eliminated from the consolidated presentation. For all volume
statistics presented, the numerator is the total volume sold
during the year and the denominator is the number of calendar
days during the year.
|
| |
|
(2)
|
|
The majority of the
Partnership’s straddle plant volumes are gathered on third
party offshore pipeline systems and delivered to the plant
inlets.
|
Year Ended
December 31, 2009 Compared to Year Ended December 31,
2008
The $3.8 million decrease in gross margin for 2009 is
primarily due to lower commodity realization prices
($847.7 million) and lower business interruption proceeds
($3.4 million) offset by higher commodity sales volumes
($246.0 million) as a result of the recovery of operations
after Hurricanes Gustav and Ike, reduced product purchase costs
($596.7 million) and higher fee-based and other income
($4.6 million). VESCO has been consolidated in our
financials since we purchased Chevron’s interest in August
2008, giving us a controlling interest from that date forward.
Had VESCO been consolidated for the entire period, gross margin
for 2008 would have been $43.6 million.
The increase in operating expenses was primarily due to a full
year of operating expenses from VESCO in 2009, as compared with
five months of operating expenses from VESCO in 2008 due to the
Partnership’s acquisition of majority ownership in and
consolidation of VESCO on August 1, 2008. Had VESCO been
consolidated for the entire period, operating expenses for 2008
would have been $17.8 million higher and our Coastal
Gathering and Processing segment would have reported reductions
in aggregate operating expense levels during 2009 as was the
case with the Partnership’s other segments.
Year Ended
December 31, 2010 Compared to Year Ended December 31,
2009
The $18.5 million increase in gross margin for 2010 is
primarily due to an increase in commodity sales prices
($230.3 million) and an increase in natural gas and NGL
sales volumes ($88.3 million) offset by decreases in
condensate sales volumes ($21.8 million) and fee-based and
other revenues ($11.3 million) and an increase in commodity
sales purchases ($266.8 million). Natural gas sales volumes
increased due to increased sales to other segments for resale
partially offset by a small decrease in demand from the
Partnership’s industrial customers. NGL, natural gas and
inlet sales volumes increased primarily because the straddle
plants were recovering operations in the first two quarters of
2009 after Hurricanes Gustav and Ike disrupted operations in
2008.
67
Logistics and
Marketing Division
Logistics
Assets
| |
|
|
|
|
|
|
|
|
|
|
|
|
|
|
|
|
|
|
|
|
|
|
|
|
|
|
|
|
|
|
|
|
|
|
|
|
|
|
|
|
Variance
|
|
|
|
|
|
|
|
|
|
|
|
|
|
2009 vs. 2008
|
|
|
2010 vs. 2009
|
|
|
|
|
Year Ended December 31,
|
|
|
$
|
|
|
%
|
|
|
$
|
|
|
%
|
|
|
|
|
2008
|
|
|
2009
|
|
|
2010
|
|
|
Change
|
|
|
Change
|
|
|
Change
|
|
|
Change
|
|
|
|
|
($ in millions except average realized prices)
|
|
|
|
|
Gross margin
|
|
$
|
172.5
|
|
|
$
|
156.2
|
|
|
$
|
172.3
|
|
|
$
|
(16.3
|
)
|
|
|
(9
|
)%
|
|
$
|
16.1
|
|
|
|
10
|
%
|
|
Operating expenses
|
|
|
132.4
|
|
|
|
81.9
|
|
|
|
88.5
|
|
|
|
(50.5
|
)
|
|
|
(38
|
)%
|
|
|
6.6
|
|
|
|
8
|
%
|
|
|
|
|
|
|
|
|
|
|
|
|
|
|
|
|
|
|
|
|
|
|
|
|
|
|
|
|
|
|
|
Operating margin
|
|
$
|
40.1
|
|
|
$
|
74.3
|
|
|
$
|
83.8
|
|
|
$
|
34.2
|
|
|
|
85
|
%
|
|
$
|
9.5
|
|
|
|
13
|
%
|
|
|
|
|
|
|
|
|
|
|
|
|
|
|
|
|
|
|
|
|
|
|
|
|
|
|
|
|
|
|
|
Operating statistics:
|
|
|
|
|
|
|
|
|
|
|
|
|
|
|
|
|
|
|
|
|
|
|
|
|
|
|
|
|
|
Fractionation volumes, MBbl/d
|
|
|
212.2
|
|
|
|
217.2
|
|
|
|
230.8
|
|
|
|
5.0
|
|
|
|
2
|
%
|
|
|
13.6
|
|
|
|
6
|
%
|
|
LSNG treating volumes, MBbl/d
|
|
|
20.7
|
|
|
|
21.9
|
|
|
|
18.0
|
|
|
|
1.2
|
|
|
|
6
|
%
|
|
|
(3.9
|
)
|
|
|
(18
|
)%
|
Year Ended
December 31, 2009 Compared to Year Ended December 31,
2008
The $16.3 million decrease in gross margin for 2009 was due
to lower fractionation and treating revenue ($20.9 million)
due to lower fees offset by higher other fee-based and other
revenue ($4.6 million).
The decrease in operating expenses was primarily due to lower
fuel and utilities expenses ($43.2 million), lower
maintenance and supplies expenses ($4.7 million) and lower
outside services ($9.4 million), offset by higher
compensation expense ($1.1 million) and system product
losses ($2.5 million).
Year Ended
December 31, 2010 Compared to Year Ended December 31,
2009
The $16.1 million increase in gross margin reflects higher
fractionation and treating fees ($20.4 million) and higher
terminaling and storage revenue ($2.6 million), offset by
lower fee-based and other revenues ($6.9 million). The
increase in fractionation volumes is as result of the
Partnership’s capacity in its fractionating facilities
being at or near capacity. The Partnership is expanding its
fractionation capacity at the Cedar Bayou and Gulf Coast
Fractionating plants to meet increased market demand.
The $6.6 million increase in operating expenses was
primarily due to higher compensation costs ($5.0 million)
and higher general maintenance supplies ($3.0 million).
Marketing and
Distribution
| |
|
|
|
|
|
|
|
|
|
|
|
|
|
|
|
|
|
|
|
|
|
|
|
|
|
|
|
|
|
|
|
|
|
|
|
|
|
|
|
|
Variance
|
|
|
|
|
|
|
|
|
|
|
|
|
|
2009 vs. 2008
|
|
|
2010 vs. 2009
|
|
|
|
|
Year Ended December 31,
|
|
|
$
|
|
|
%
|
|
|
$
|
|
|
%
|
|
|
|
|
2008
|
|
|
2009
|
|
|
2010
|
|
|
Change
|
|
|
Change
|
|
|
Change
|
|
|
Change
|
|
|
|
|
($ in millions except average realized prices)
|
|
|
|
|
Gross margin
|
|
$
|
98.8
|
|
|
$
|
128.9
|
|
|
$
|
125.4
|
|
|
$
|
30.1
|
|
|
|
30
|
%
|
|
$
|
(3.5
|
)
|
|
|
(3
|
)%
|
|
Operating expenses
|
|
|
57.5
|
|
|
|
45.9
|
|
|
|
44.9
|
|
|
|
(11.6
|
)
|
|
|
(20
|
)%
|
|
|
(1.0
|
)
|
|
|
(2
|
)%
|
|
|
|
|
|
|
|
|
|
|
|
|
|
|
|
|
|
|
|
|
|
|
|
|
|
|
|
|
|
|
|
Operating margin
|
|
$
|
41.3
|
|
|
$
|
83.0
|
|
|
$
|
80.5
|
|
|
$
|
41.7
|
|
|
|
101
|
%
|
|
$
|
(2.5
|
)
|
|
|
(3
|
)%
|
|
|
|
|
|
|
|
|
|
|
|
|
|
|
|
|
|
|
|
|
|
|
|
|
|
|
|
|
|
|
|
Operating statistics:
|
|
|
|
|
|
|
|
|
|
|
|
|
|
|
|
|
|
|
|
|
|
|
|
|
|
|
|
|
|
Natural gas sales, BBtu/d)
|
|
|
417.4
|
|
|
|
510.3
|
|
|
|
634.9
|
|
|
|
92.9
|
|
|
|
22
|
%
|
|
|
124.6
|
|
|
|
24
|
%
|
|
NGL sales, MBbl/d
|
|
|
284.0
|
|
|
|
276.1
|
|
|
|
246.7
|
|
|
|
(7.9
|
)
|
|
|
(3
|
)%
|
|
|
(29.4
|
)
|
|
|
(11
|
)%
|
|
Average realized prices:
|
|
|
|
|
|
|
|
|
|
|
|
|
|
|
|
|
|
|
|
|
|
|
|
|
|
|
|
|
|
Natural gas, $/MMBtu
|
|
$
|
7.81
|
|
|
$
|
3.65
|
|
|
$
|
4.31
|
|
|
$
|
(4.16
|
)
|
|
|
(53
|
)%
|
|
$
|
0.66
|
|
|
|
18
|
%
|
|
NGL, $/gal
|
|
|
1.40
|
|
|
|
0.80
|
|
|
|
1.10
|
|
|
|
(0.60
|
)
|
|
|
(43
|
)%
|
|
|
0.30
|
|
|
|
38
|
%
|
68
Year Ended
December 31, 2009 Compared to Year Ended December 31,
2008
The $30.1 million increase in gross margin for 2009 was due
to higher natural gas sales volumes of $261.8 million,
lower product purchase costs of $3,312.4 million and a
$33.0 million decrease in lower of cost or market
adjustment, offset by lower realized commodity prices of
$3,334.9 million, and lower NGL sales volumes of
$188.2 million, lower fee-based and other revenues of
$37.6 million and lower business interruption proceeds of
$16.3 million.
Natural gas sales volumes are higher due to increased purchases
for resale. NGL sales volumes are lower beginning in the third
quarter of 2009 due to a change in contract terms with a
petrochemical supplier that had a minimal impact to gross margin.
The $11.6 million decrease in operating expenses was
primarily due to a decrease in fuel and utilities expense of
$5.8 million, a decrease in maintenance and supplies
expenses of $4.2 million and a decrease in outside services
of $1.0 million. Factors contributing to the decrease
included the expiration of a barge contract, partially offset by
increased truck utilization.
Year Ended
December 31, 2010 Compared to Year Ended December 31,
2009
The $3.5 million decrease in gross margin was due to
increased commodity prices of $1,287.9 million and higher
natural gas volumes of $166.2 million offset by lower NGL
volumes of $359.8 million, lower fee-based and other
revenues of $20.4 million, and increased product purchases
of $1,077.2 million. Lower 2010 margins at inventory
locations were primarily due to the 2009 impact of higher
margins on forward sales agreements that were fixed at
relatively high 2008 prices, along with spot fractionation
volumes and associated fees. These items were partially offset
by higher marketing fees on contract purchase volumes due to
overall higher 2010 market prices. Margin on transportation
activity decreased due to expiration of a barge contract
partially offset by increased truck activity.
Natural gas sales volumes are higher due to increased purchases
for resale. NGL sales volumes are lower due to a change in
contract terms with a petrochemical supplier that had a minimal
impact to gross margin.
Operating expenses were essentially flat.
Other
| |
|
|
|
|
|
|
|
|
|
|
|
|
|
|
|
|
|
|
|
|
|
|
|
|
|
|
|
|
|
|
|
Years Ended December 31,
|
|
|
2009 vs. 2008
|
|
|
2010 vs. 2009
|
|
|
|
|
2008
|
|
|
2009
|
|
|
2010
|
|
|
Change
|
|
|
% Change
|
|
|
Change
|
|
|
% Change
|
|
|
|
|
($ in millions)
|
|
|
|
|
Gross margin
|
|
$
|
(33.6
|
)
|
|
$
|
46.3
|
|
|
$
|
4.0
|
|
|
$
|
79.9
|
|
|
|
238
|
%
|
|
$
|
(42.3
|
)
|
|
|
(91
|
)%
|
|
|
|
|
|
|
|
|
|
|
|
|
|
|
|
|
|
|
|
|
|
|
|
|
|
|
|
|
|
|
|
Operating margin
|
|
$
|
(33.6
|
)
|
|
$
|
46.3
|
|
|
$
|
4.0
|
|
|
$
|
79.9
|
|
|
|
238
|
%
|
|
$
|
(42.3
|
)
|
|
|
(91
|
)%
|
|
|
|
|
|
|
|
|
|
|
|
|
|
|
|
|
|
|
|
|
|
|
|
|
|
|
|
|
|
|
Other contains the financial effects of the cash flow hedging
program on profitability. The primary purpose of the
Partnership’s commodity risk management activities is to
hedge its exposure to commodity price risk and reduce
fluctuations in our operating cash flow despite fluctuations in
commodity prices. The Partnership has hedged the commodity price
associated with a portion of its expected natural gas, NGL and
condensate equity volumes by entering into derivative financial
instruments. The Partnership’s hedging strategy is in
effect to forward sell its equity gas and NGL volumes generated
by our gas plants. As such, these hedge positions will enhance
the Partnership’s margins in periods of falling prices and
decrease its margins in periods of rising prices.
Year Ended
December 31, 2009 Compared to Year Ended December 31,
2008
Our cash flow hedges increased gross margin by
$79.9 million during 2009 versus 2008, as lower commodity
prices yielded higher settlement revenues on derivative
contracts.
69
Year Ended
December 31, 2010 Compared to Year Ended December 31,
2009
Our cash flow hedging program decreased gross margin by
$42.3 million during 2010 versus 2009, due to higher
commodity prices which resulted in lower revenues from
settlements on derivative contracts, as well as the impact of
lower volumes hedged.
Insurance
Update
Hurricanes Katrina and Rita affected certain of our Gulf Coast
facilities in 2005. The final purchase price allocation for our
acquisition from Dynegy in October 2005 included an
$81.1 million receivable for insurance claims related to
property damage caused by Hurricanes Katrina and Rita. During
2008, our cumulative receipts exceeded such amount, and we
recognized a gain of $18.5 million. During 2009,
expenditures related to these hurricanes included
$0.3 million capitalized as improvements. The insurance
claim process is now complete with respect to Hurricanes Katrina
and Rita for property damage and business interruption insurance.
Certain of our Louisiana and Texas facilities sustained damage
and had disruptions to their operations during the 2008
hurricane season from two Gulf Coast hurricanes—Gustav and
Ike. As of December 31, 2008, we recorded a
$19.3 million loss provision (net of estimated insurance
reimbursements) related to the hurricanes. During 2010 and 2009,
the estimate was reduced by $3.3 million and
$3.7 million. During 2009, expenditures related to the
hurricanes included $33.7 million for previously accrued
repair costs and $7.5 million capitalized as improvements.
Liquidity and
Capital Resources
As a result of our conveyances of all of our remaining operating
assets to the Partnership, we have no separate, direct operating
activities apart from those conducted by the Partnership. As
such, our ability to finance our operations, including payment
of dividends to our common shareholders, funding capital
expenditures and acquisitions, or to meet our indebtedness
obligations, will depend on cash inflows from future cash
distributions to us from our interests in the Partnership. The
Partnership is required to distribute all available cash at the
end of each quarter after establishing reserves to provide for
the proper conduct of its business or to provide for future
distributions. See “Risk Factors.” As of
April 12, 2011, our interests in the Partnership consist of
the following:
|
|
|
| |
•
|
a 2% general partner interest, which we hold through our 100%
ownership interest in the general partner of the Partnership;
|
| |
| |
•
|
all of the outstanding IDRs; and
|
| |
| |
•
|
11,645,659 of the 84,756,009 outstanding common units of the
Partnership, representing 13.7% of the limited partnership
interest.
|
Our ownership of the general partner interest entitles us to
receive:
|
|
|
| |
•
|
2% of all cash distributed in a quarter.
|
Our ownership in respect to the IDR’s of the Partnership
that we hold entitles us to receive:
|
|
|
| |
•
|
13% of all cash distributed in a quarter after $0.3881 has been
distributed in respect of each common unit of the Partnership
for that quarter;
|
| |
| |
•
|
23% of all cash distributed in a quarter after $0.4219 has been
distributed in respect of each common unit of the Partnership
for that quarter; and
|
| |
| |
•
|
48% of all cash distributed in a quarter after $0.50625 has been
distributed in respect of each common unit of the Partnership
for that quarter.
|
The General Partner’s Board of Directors increased the
first quarter 2011 distribution by $0.01 per common unit, or
$0.04 on an annualized basis. Based on the $2.23 annualized
rate, a quarterly distribution by the Partnership of $0.5575 per
common unit will result in quarterly distributions to us of
$6.5 million, or
70
$26.0 million on an annualized basis, in respect of our
common units in the Partnership. Such distribution would also
result in quarterly distributions to us in respect of our 2%
general partner interest and the IDRs of $7.9 million, or
$31.6 million on an annualized basis.
We intend to pay to our stockholders, on a quarterly basis,
dividends equal to the cash the Partnership distributes to us
based on our ownership of Partnership securities, less the
expenses of being a public company, other general and
administrative expenses, federal income taxes, capital
contributions to the Partnership and reserves established by our
board of directors. On April 11, 2011, we announced that
our board of directors declared a quarterly cash dividend of
$0.2725 per share of common stock (or $11.5 million in
total), or $1.09 per share on an annualized basis (or
$46.2 million in total) for the first quarter of 2011. This
cash dividend will be paid on May 17, 2011 on all
outstanding shares of common stock to holders of record as of
the close of business on April 21, 2011. If we close this
offering on or prior to the record date on April 21, 2011,
the shares of common stock sold in this offering will receive
the declared dividend of $0.2725 per share of common stock for
the first quarter of 2011. If we do not close this offering on
or prior to the record date on April 21, 2011, then the
shares of common stock sold in this offering will not receive
the declared dividend.
As of December 31, 2010, we had $188.4 million of cash
on hand, including $76.3 million of cash belonging to the
Partnership. We do not have access to the Partnership’s
cash as it is restricted for the use of the Partnership. We have
the ability to use $112.1 million of the cash on hand and
available to us to satisfy our aggregate tax liability of
approximately $88.0 million over the next fourteen years
associated with our sales of assets to the Partnership and
related financings as well as to fund the reimbursement of
certain capital expenditures to the Partnership associated with
its acquisition of Versado. In addition, we have a contingent
obligation to contribute to the Partnership limited distribution
support in any quarter through 2011 if and to the extent the
Partnership has insufficient available cash to fund a
distribution of $0.5175 per unit, limited to $8.0 million
per quarter. We have yet and do not currently expect to make any
payments pursuant to this distribution support obligation.
Our and the Partnership’s cash generated from operations
has been sufficient to finance operating expenditures and
non-acquisition related capital expenditures. Based on our
anticipated levels of operations and absent any disruptive
events, we believe that internally generated cash flow,
primarily from distributions received from the Partnership and
borrowings available under our senior secured credit facility
should provide sufficient resources to finance our operations,
non-acquisition related capital expenditures, long-term
indebtedness obligations and collateral requirements.
Our future cash flows will consist of distributions to us from
our interests in the Partnership, from which we intend to make
quarterly cash dividends to our shareholders from available
cash. On February 14, 2011, the Partnership paid its
quarterly distribution of $0.5475 per common unit per quarter
(or $2.19 per common unit on an annualized basis) for the
quarter ended December 31, 2010. Based on the
Partnership’s current capital structure, the distribution
of $0.5475 per common unit resulted in a quarterly distribution
to us of $13.5 million in respect of our Partnership
interests.
The impact on us of changes in the Partnership’s
distribution levels will vary depending on several factors,
including the Partnership’s total outstanding partnership
interests on the record date for the distribution, the aggregate
cash distributions made by the Partnership and the interests in
the Partnership owned by us. If the Partnership increases
distributions to its unitholders, including us, we would expect
to increase dividends to our stockholders, although the timing
and amount of such increased dividends, if any, will not
necessarily be comparable to the timing and amount of the
increase in distributions made by the Partnership. In addition,
the level of distributions we receive and of dividends we pay to
our stockholders may be affected by the various risks associated
with an investment in us and the underlying business of the
Partnership. Please read “Risk Factors” for more
information about the risks that may impact your investment
in us.
A significant portion of the Partnership’s capital
resources are utilized in the form of cash and letters of credit
to satisfy counterparty collateral demands. These counterparty
collateral demands reflect our non-
71
investment grade status, as assigned to us and the Partnership
by Moody’s Investors Service, Inc. and Standard &
Poor’s Ratings Service, and counterparties’ views of
our financial condition and ability to satisfy our performance
obligations, as well as commodity prices and other factors. At
February 14, 2011, we had no total outstanding letter of
credit postings and the Partnership had $111.8 million.
Working Capital. Working capital is the amount
by which current assets exceed current liabilities. The
Partnership’s working capital requirements are primarily
driven by changes in accounts receivable and accounts payable.
These changes are impacted by changes in the prices of
commodities that the Partnership buys and sells. In general, the
Partnership’s working capital requirements increase in
periods of rising commodity prices and decrease in periods of
declining commodity prices. However, the Partnership’s
working capital needs do not necessarily change at the same rate
as commodity prices because both accounts receivable and
accounts payable are impacted by the same commodity prices. In
addition, the timing of payments received by the
Partnership’s customers or paid to their suppliers can also
cause fluctuations in working capital because the Partnership
settles with most of their larger suppliers and customers on a
monthly basis and often near the end of the month. The
Partnership expects that their future working capital
requirements will be impacted by these same factors. The
Partnership’s cash flows provided by operating activities
will be sufficient to meet their operating requirements for the
next twelve months.
Subsequent Events. On January 24, 2011,
the Partnership completed a public offering of 8,000,000 common
units under an existing shelf registration statement on
Form S-3
at a price of $33.67 per common unit ($32.41 per common unit,
net of underwriting discounts), providing net proceeds of
$259.3 million. Pursuant to the exercise of the
underwriters’ overallotment option, on February 3,
2011 the Partnership sold an additional 1,200,000 common units,
providing net proceeds of $38.9 million. In addition, we
contributed $6.3 million for 187,755 general partner units
to maintain our 2% general partner interest in the Partnership.
The Partnership used the net proceeds from the offering to
reduce borrowings under its senior secured credit facility.
On February 2, 2011, the Partnership privately placed
$325.0 million in aggregate principal amount of
67/8% Senior
Notes due 2021 (“the
67/8% Notes”)
resulting in net proceeds of $319.3 million.
On February 4, 2011 the Partnership exchanged
$158.6 million principal amount of its
67/8% Notes
for $158.6 million aggregate principal amount of its
111/4% Senior
Notes due 2017 (the
“111/4% Notes”).
In conjunction with the exchange the Partnership paid a premium
in cash of $28.6 million. The debt covenants related to the
remaining $72.7 million of face value of the
111/4% Notes
were removed as the Partnership received sufficient consents in
connection with the exchange offer to amend the indenture.
Net cash from the completion of the unit offerings, the note
offering and the exchange offer was used to reduce outstanding
borrowings under the Partnership’s senior secured credit
facility by $595.2 million. Taking into account these
payments, as of December 31, 2010, the Partnership’s
available borrowings under its senior secured credit facility
would have been $828.6 million.
Cash
Flow
The following table and discussion of the Operating Activities,
Investing Activities, and Financing Activities summarizes the
consolidated cash flows of us and the Partnership provided by or
used in operating activities, investing activities and financing
activities for the periods indicated:
| |
|
|
|
|
|
|
|
|
|
|
|
|
|
|
|
Year Ended December 31,
|
|
|
|
|
2008
|
|
|
2009
|
|
|
2010
|
|
|
|
|
(In millions)
|
|
|
|
|
Net cash provided by (used in):
|
|
|
|
|
|
|
|
|
|
|
|
|
|
Operating activities
|
|
$
|
390.7
|
|
|
$
|
335.8
|
|
|
$
|
208.5
|
|
|
Investing activities
|
|
|
(206.7
|
)
|
|
|
(59.3
|
)
|
|
|
(134.6
|
)
|
|
Financing activities
|
|
|
0.9
|
|
|
|
(386.9
|
)
|
|
|
(137.9
|
)
|
72
Operating
Activities
The changes in net cash provided by operating activities are
attributable to our consolidated net income adjusted for
non-cash charges as presented in the Consolidated Statements of
Cash Flows included in our historical consolidated financial
statements and related notes thereto appearing elsewhere in this
prospectus and changes in working capital as discussed above
under “—Liquidity and Capital Resources—Working
Capital.” We expect our cash flows provided by operating
activities will be sufficient to meet our operating requirements
for the next twelve months.
For the year ended December 31, 2010 compared to 2009, net
cash provided by operating activities decreased by
$127.3 million primarily due to the following:
|
|
|
| |
•
|
a decrease in net income of $15.9 million;
|
| |
| |
•
|
a decrease in non-cash risk management activities of
$10.3 million due to higher average future prices on
commodity valuations;
|
| |
| |
•
|
a decrease in the change in operating assets and liabilities of
$147.6 million, primarily driven by higher payable and
receivable balances in 2010; and
|
| |
| |
•
|
offset by changes in net losses related to debt repurchases and
extinguishments of $13.1 million.
|
The $54.9 million decrease in net cash provided by
operating activities in 2009 compared to 2008 was primarily due
to the following:
|
|
|
| |
•
|
net cash flow from consolidated operations (excluding cash
payments for interest, cash payments for income taxes and
distributions received from unconsolidated affiliates) decreased
$48.3 million
period-to-period.
The decrease in operating cash flow is generally due to a
decrease in net income of $55.3 million. Please see
“—Results of Operations—Year Ended
December 31, 2009 Compared to Year Ended December 31,
2008” for a discussion of material items that impacted our
operating cash flow; and
|
| |
| |
•
|
cash payments for interest expense decreased $11.8 million
period-to-period
primarily due to a reduction in and change in the mix of debt
due to debt retirements and refinancing activities and lower
effective interest rates.
|
Investing
Activities
Net cash used in investing activities increased by
$75.3 million for the year ended December 31, 2010
compared to the year ended 2009, primarily due to increased
capital spending of $39.9 million offset by a decrease in
proceeds from property insurance claims of $35.3 million
received in 2009.
Net cash used in investing activities decreased by
$147.4 million to $59.3 million for 2009 compared to
$206.7 million for 2008. The decrease is attributable to
lower capital expenditures in 2009 and the VESCO acquisition in
2008.
The following table lists gross additions to property, plant and
equipment, cash flows used in property, plant and equipment
additions and the difference, which is primarily settled
accruals and non-cash additions:
| |
|
|
|
|
|
|
|
|
|
|
|
|
|
|
|
Year Ended December 31,
|
|
|
|
|
2008
|
|
|
2009
|
|
|
2010
|
|
|
|
|
(In millions)
|
|
|
|
|
Gross additions to property, plant and equipment
|
|
$
|
147.1
|
|
|
$
|
101.9
|
|
|
$
|
147.2
|
|
|
Inventory line-fill transferred to property, plant and equipment
|
|
|
(5.8
|
)
|
|
|
(9.8
|
)
|
|
|
(0.4
|
)
|
|
Change in accruals and other
|
|
|
(9.0
|
)
|
|
|
6.6
|
|
|
|
(7.5
|
)
|
|
Purchase price adjustment related to consolidation of VESCO
|
|
|
—
|
|
|
|
0.7
|
|
|
|
—
|
|
|
|
|
|
|
|
|
|
|
|
|
|
|
|
|
Cash expenditures
|
|
$
|
132.3
|
|
|
$
|
99.4
|
|
|
$
|
139.3
|
|
|
|
|
|
|
|
|
|
|
|
|
|
|
|
73
Financing
Activities
Net cash used in financing activities for the year ended 2010
compared to 2009 decreased by $249 million. The decrease
was primarily due to a $457.6 million dividend to our
Series B Preferred, common stockholders and common
equivalents, partially offset by a net decrease in repayments on
indebtedness of $322.9 million and proceeds from the sale
of limited partner interests in the Partnership of
$542.5 million.
Net cash used in financing activities in 2009 was primarily due
to net repayments on indebtedness and distributions by the
Partnership, partially offset by equity issuances.
Net cash provided by financing activities during 2008 was
primarily due to net borrowings, net of repayments on
indebtedness and repurchases, partially offset by increased
dividends paid to stockholders in 2008.
Capital
Requirements
The midstream energy business can be capital intensive,
requiring significant investment to maintain and upgrade
existing operations. A significant portion of the cost of
constructing new gathering lines to connect to the
Partnership’s gathering system is generally paid for by the
natural gas producer. However, the Partnership expects to make
significant expenditures during the next year for the
construction of additional natural gas gathering and processing
infrastructure and to enhance the value of its logistics and
marketing assets.
The Partnership categorizes its capital expenditures as either:
(i) maintenance expenditures or (ii) expansion
expenditures. Maintenance expenditures are those expenditures
that are necessary to maintain the service capability of its
existing assets including the replacement of system components
and equipment which is worn, obsolete or completing its useful
life, the addition of new sources of natural gas supply to its
systems to replace natural gas production declines and
expenditures to remain in compliance with environmental laws and
regulations. Expansion expenditures improve the service
capability of the existing assets, extend asset useful lives,
increase capacities from existing levels, add capabilities,
reduce costs or enhance revenues.
| |
|
|
|
|
|
|
|
|
|
|
|
|
|
|
|
Year Ended December 31,
|
|
|
|
|
2008
|
|
|
2009
|
|
|
2010
|
|
|
|
|
(In millions)
|
|
|
|
|
Capital expenditures
|
|
|
|
|
|
|
|
|
|
|
|
|
|
Expansion
|
|
$
|
74.5
|
|
|
$
|
55.4
|
|
|
$
|
93.9
|
|
|
Maintenance
|
|
|
72.6
|
|
|
|
46.5
|
|
|
|
53.3
|
|
|
|
|
|
|
|
|
|
|
|
|
|
|
|
|
|
|
$
|
147.1
|
|
|
$
|
101.9
|
|
|
$
|
147.2
|
|
|
|
|
|
|
|
|
|
|
|
|
|
|
|
The Partnership estimates that its capital expenditures for 2011
will be approximately $230 million, which does not include
acquisitions, and of which approximately 25% will be spent on
maintenance. Management is considering a number of expansion
projects which could significantly increase this amount.
74
Credit Facilities
and Long-Term Debt
The following table summarizes our and the Partnership’s
debt as of December 31, 2010 (in millions):
| |
|
|
|
|
|
Our Obligations:
|
|
|
|
|
|
Holdco Loan, due February 2015
|
|
$
|
89.3
|
|
|
TRI Senior secured revolving credit facility due July 2014
|
|
|
—
|
|
|
Obligations of the Partnership:
|
|
|
|
|
|
Senior secured revolving credit facility, due July 2015
|
|
|
765.3
|
|
|
Senior unsecured notes,
81/4%
fixed rate, due July 2016
|
|
|
209.1
|
|
|
Senior unsecured notes,
111/4%
fixed rate, due July 2017
|
|
|
231.3
|
|
|
Unamortized discounts, net of premiums
|
|
|
(10.3
|
)
|
|
Senior unsecured notes,
77/8%
fixed rate, due July 2018
|
|
|
250.0
|
|
|
|
|
|
|
|
|
Total debt
|
|
|
1,534.7
|
|
|
Current maturities of debt
|
|
|
—
|
|
|
|
|
|
|
|
|
Total long-term debt
|
|
$
|
1,534.7
|
|
|
|
|
|
|
|
We consolidate the debt of the Partnership with that of our own;
however, we do not have the contractual obligation to make
interest or principal payments with respect to the debt of the
Partnership. We have retired all amounts outstanding under our
senior secured term loan facility due July 2016 as of December
2010. Our debt obligations, including those of TRI, do not
restrict the ability of the Partnership to make distributions to
us. TRI’s senior secured credit facility has restrictions
and covenants that may limit our ability to pay dividends to our
stockholders. Please read “—TRI Senior Secured Credit
Facility” for a discussion of the restrictions and
covenants in TRI’s senior secured credit facility.
As of December 31, 2010, both we and the Partnership were
in compliance with the covenants contained in our various debt
agreements.
Holdco
Loan
On August 9, 2007, we borrowed $450 million under this
facility. Interest on borrowings under the facility are payable,
at our option, either (i) entirely in cash,
(ii) entirely by increasing the principal amount of the
outstanding borrowings or (iii) 50% in cash and 50% by
increasing the principal amount of the outstanding borrowings.
We are the borrower under this facility. We have pledged TRI
stock as collateral under this loan agreement.
On November 3, 2010, we amended our Holdco Loan to name our
wholly-owned subsidiary, TRI, as guarantor to our obligations
under the credit agreement. The operations and assets of the
Partnership continue to be excluded as guarantors of the Holdco
Loan. In conjunction with the guaranty agreement, the applicable
margin for borrowings under the facility was reduced from 5.0%
to 3.75%. At our option, should we choose to pay the interest on
this loan in cash versus increasing the principal amount of the
outstanding borrowings, the applicable margin for borrowings
would be further reduced to 3.0%.
TRI Senior
Secured Credit Facility
On January 5, 2010, we entered into a senior secured credit
facility providing senior secured financing of
$600 million, consisting of:
|
|
|
| |
•
|
$500 million senior secured term loan facility (fully
repaid as of December 2010); and
|
| |
| |
•
|
$100 million senior secured revolving credit facility
(reduced to $75 million and undrawn as of December 2010).
|
75
The entire amount of our credit facility is available for
letters of credit and includes a limited borrowing capacity for
borrowings on
same-day
notice referred to as swing line loans. Our available capacity
under this facility is currently $75 million. TRI is the
borrower under this facility.
Borrowings under the credit agreement bear interest at a rate
equal to an applicable margin, plus at our option, either
(a) a base rate determined by reference to the higher of
(1) the prime rate of Deutsche Bank, (2) the federal
funds rate plus 0.5%, and (3) solely in the case of term
loans, 3%, or (b) LIBOR as determined by reference to the
higher of (1) the British Bankers Association LIBOR Rate
and (2) solely in the case of term loans, 2%.
Principal amounts outstanding under our senior secured revolving
credit facility are due and payable in full on July 5,
2014. During 2010, we used the proceeds from our sales of the
Permian Business and Straddle Assets, Versado and VESCO, as well
as the secondary public offering of 8,500,000 common units of
the Partnership that we owned to fully repay the outstanding
balance on the senior secured term loan.
The credit agreement is secured by a pledge of our ownership in
our restricted subsidiaries and contains a number of covenants
that, among other things, restrict, subject to certain
exceptions, our ability to incur additional indebtedness
(including guarantees and hedging obligations); create liens on
assets; enter into sale and leaseback transactions; engage in
mergers or consolidations; sell assets; pay dividends and make
distributions or repurchase capital stock and other equity
interests; make investments, loans or advances; make capital
expenditures; repay, redeem or repurchase certain indebtedness;
make certain acquisitions; engage in certain transactions with
affiliates; amend certain debt and other material agreements;
and change our lines of business.
Senior Secured
Revolving Credit Facility of the Partnership due 2015
On July 19, 2010, the Partnership entered into an amended
and restated five-year $1.1 billion senior secured credit
facility, which allows it to request increases in commitments up
to an additional $300 million.
The amended and restated senior secured credit facility replaces
the Partnership’s former $977.5 million senior secured
revolving credit facility due February 2012.
For the year ended December 31, 2010, the Partnership had
gross borrowings under its senior secured revolving credit
facilities of $1,343.1 million, and repayments totaling
$1,057.0 million, for a net increase for the year ended
December 31, 2010 of $286.1 million.
The amended and restated credit facility bears interest at LIBOR
plus an applicable margin ranging from 2.25% to 3.5% (or base
rate at the borrower’s option) dependent on the
Partnership’s consolidated funded indebtedness to
consolidated adjusted EBITDA ratio. The Partnership’s
amended and restated senior secured credit facility is secured
by a majority of the Partnership’s assets.
The Partnership’s senior secured credit facility restricts
its ability to make distributions of available cash to
unitholders if a default or an event of default (as defined in
our senior secured credit agreement) has occurred and is
continuing. The senior secured credit facility requires the
Partnership to maintain a consolidated funded indebtedness to
consolidated adjusted EBITDA of less than or equal to 5.50 to
1.00. The senior secured credit facility also requires the
Partnership to maintain an interest coverage ratio (the ratio of
our consolidated EBITDA to our consolidated interest expense, as
defined in the senior secured credit agreement) of greater than
or equal to 2.25 to 1.00 determined as of the last day of each
quarter for the four-fiscal quarter period ending on the date of
determination, as well as upon the occurrence of certain events,
including the incurrence of additional permitted indebtedness.
The
Partnership’s Outstanding Notes
On June 18, 2008, the Partnership privately placed
$250 million in aggregate principal amount at par value of
81/4% senior
notes due 2016 (the
“81/4% Notes”).
On July 6, 2009, the Partnership privately placed
$250 million in aggregate principal amount of the
111/4% Notes.
The
111/4% Notes
were issued at 94.973% of
76
the face amount, resulting in gross proceeds of
$237.4 million. See “Liquidity and Capital
Resources—Subsequent Events” for a discussion of the
Partnership’s exchange of its
67/8% Notes
for
111/4% Notes.
On August 13, 2010, the Partnership privately placed
$250 million in aggregate principal amount of its
77/8% senior
notes due 2018. These notes are unsecured senior obligations
that rank pari passu in right of payment with existing
and future senior indebtedness of the Partnership, including
indebtedness under its credit facility. They are senior in right
of payment to any of the Partnership’s future subordinated
indebtedness.
The Partnership’s senior unsecured notes and associated
indenture agreements (other than the indenture for the
111/4
Notes) restrict the Partnership’s ability to make
distributions to unitholders in the event of default (as defined
in the indentures). The indentures also restrict the
Partnership’s ability and the ability of certain of its
subsidiaries to: (i) incur additional debt or enter into
sale and leaseback transactions; (ii) pay certain
distributions on or repurchase, equity interests (only if such
distributions do not meet specified conditions); (iii) make
certain investments; (iv) incur liens; (v) enter into
transactions with affiliates; (vi) merge or consolidate
with another company; and (vii) transfer and sell assets.
These covenants are subject to a number of important exceptions
and qualifications. If at any time when the notes are rated
investment grade by both Moody’s Investors Service, Inc.
and Standard & Poor’s Ratings Services and no
Default (as defined in the indentures) has occurred and is
continuing, many of such covenants will terminate and the
Partnership and its subsidiaries will cease to be subject to
such covenants.
Off-Balance Sheet
Arrangements
We currently have no off-balance sheet arrangements as defined
by the SEC. See “Contractual Obligations” below and
“Commitments and Contingencies” included under
Note 16 to our “Audited Consolidated Financial
Statements” beginning on
page F-1
of this Prospectus for a discussion of our commitments and
contingencies, some of which are not recognized in the
consolidated balance sheets under GAAP.
Contractual
Obligations
Following is a summary of our contractual cash obligations over
the next several fiscal years, as of December 31, 2010:
| |
|
|
|
|
|
|
|
|
|
|
|
|
|
|
|
|
|
|
|
|
|
|
|
Payments Due By Period
|
|
|
|
|
|
|
|
Less Than
|
|
|
|
|
|
|
|
|
More Than
|
|
|
Contractual Obligations
|
|
Total
|
|
|
1 Year
|
|
|
1-3 Years
|
|
|
4-5 Years
|
|
|
5 Years
|
|
|
|
|
(In millions)
|
|
|
|
|
Debt
obligations(1)
|
|
$
|
1,534.7
|
|
|
$
|
—
|
|
|
$
|
—
|
|
|
$
|
854.6
|
|
|
$
|
680.1
|
|
|
Interest on debt
obligations(2)
|
|
|
427.8
|
|
|
|
67.7
|
|
|
|
189.7
|
|
|
|
118.8
|
|
|
|
51.6
|
|
|
Operating lease and service contract
obligations(3)
|
|
|
52.0
|
|
|
|
13.1
|
|
|
|
16.5
|
|
|
|
9.7
|
|
|
|
12.7
|
|
|
Capacity and terminaling
payments(4)
|
|
|
12.9
|
|
|
|
6.6
|
|
|
|
6.3
|
|
|
|
—
|
|
|
|
—
|
|
|
Land site lease and
right-of-way(5)
|
|
|
20.4
|
|
|
|
1.3
|
|
|
|
2.4
|
|
|
|
2.1
|
|
|
|
14.6
|
|
|
Asset retirement obligation
|
|
|
37.5
|
|
|
|
—
|
|
|
|
—
|
|
|
|
—
|
|
|
|
37.5
|
|
|
Commodities(6)
|
|
|
98.1
|
|
|
|
98.1
|
|
|
|
—
|
|
|
|
—
|
|
|
|
—
|
|
|
Purchase order
commitments(7)
|
|
|
63.5
|
|
|
|
63.0
|
|
|
|
0.5
|
|
|
|
—
|
|
|
|
—
|
|
|
|
|
|
|
|
|
|
|
|
|
|
|
|
|
|
|
|
|
|
|
|
|
|
|
$
|
2,246.9
|
|
|
$
|
249.8
|
|
|
$
|
215.4
|
|
|
$
|
985.2
|
|
|
$
|
796.5
|
|
|
|
|
|
|
|
|
|
|
|
|
|
|
|
|
|
|
|
|
|
|
|
|
Commodities Purchase Commitments
|
|
|
|
|
|
|
|
|
|
|
|
|
|
|
|
|
|
|
|
|
|
Natural Gas (millions MMBtu)
|
|
|
9.3
|
|
|
|
9.3
|
|
|
|
—
|
|
|
|
—
|
|
|
|
—
|
|
|
NGL (millions of gallons)
|
|
|
56.3
|
|
|
|
56.3
|
|
|
|
—
|
|
|
|
—
|
|
|
|
—
|
|
77
|
|
|
|
(1) |
|
Represents our scheduled future
maturities of consolidated debt obligations for the periods
indicated. See “Debt Obligations” included under
Note 9 to our “Consolidated Financial Statements”
beginning on
page F-1
of this prospectus for information regarding our debt
obligations.
|
| |
|
(2) |
|
Represents interest expense on our
debt obligations based on interest rates as of December 31,
2010 and the scheduled future maturities of those debt
obligations.
|
| |
|
(3) |
|
Includes minimum payments on lease
obligations, service contracts,
right-of-way
agreement, with site leases and railcar leases.
|
| |
|
(4) |
|
Consists of capacity payments for
firm transportation contracts.
|
| |
|
(5) |
|
Lease site and
right-of-way
expenses provide for surface and underground access for
gathering, processing and distribution assets that are located
on property not owned by us; these agreements expire at various
dates through 2099.
|
| |
|
(6) |
|
Includes natural gas and NGL
purchase commitments.
|
| |
|
(7) |
|
Consists of open purchase orders
and Versado remediation projects.
|
Critical
Accounting Policies and Estimates
The preparation of financial statements in accordance with GAAP
requires our management to make estimates and assumptions that
affect the reported amounts of assets and liabilities and
disclosure of contingent assets and liabilities at the date of
the financial statements and the reported amounts of revenues
and expenses during the period. Actual results could differ from
these estimates. The policies and estimates discussed below are
considered by management to be critical to an understanding of
our financial statements because their application requires the
most significant judgments from management in estimating matters
for financial reporting that are inherently uncertain. See the
description of our accounting policies in the notes to the
financial statements for additional information about our
critical accounting policies and estimates.
Property, Plant and Equipment. In general,
depreciation is the systematic and rational allocation of an
asset’s cost, less its residual value (if any), to the
period it benefits. Our property, plant and equipment are
depreciated using the straight-line method over the estimated
useful lives of the assets. Our estimate of depreciation
incorporates assumptions regarding the useful economic lives and
residual values of our assets. At the time we place our assets
in-service, we believe such assumptions are reasonable; however,
circumstances may develop that would cause us to change these
assumptions, which would change our depreciation amounts
prospectively. Examples of such circumstances include:
|
|
|
| |
•
|
changes in energy prices;
|
| |
| |
•
|
changes in competition;
|
| |
| |
•
|
changes in laws and regulations that limit the estimated
economic life of an asset
|
| |
| |
•
|
changes in technology that render an asset obsolete;
|
| |
| |
•
|
changes in expected salvage values; and
|
| |
| |
•
|
changes in the forecast life of applicable resources basins.
|
As of December 31, 2010, the net book value of our
property, plant and equipment was $2.5 billion and we
recorded $185.5 million in depreciation expense for the
year ended December 31, 2010. The weighted average life of
our long-lived assets is approximately 20 years. If the
useful lives of these assets were found to be shorter than
originally estimated, depreciation expense may increase,
liabilities for future asset retirement obligations may be
insufficient and impairments in carrying values of tangible and
intangible assets may result. For example, if the depreciable
lives of our assets were reduced by 10%, we estimate that
depreciation expense would increase by $20.6 million per
year, which would result in a corresponding reduction in our
operating income. In addition, if an assessment of impairment
resulted in a reduction of 1% of our long-lived assets, our
operating income would decrease by $25.1 million in the
year of the impairment. There have been no material changes
impacting estimated useful lives of the assets
78
Revenue Recognition. As of December 31,
2010, our balance sheet reflects total accounts receivable from
third parties of $466.6 million. We have recorded an
allowance for doubtful accounts as of December 31, 2010 of
$7.9 million.
Our exposure to uncollectible accounts receivable relates to the
financial health of its counterparties. We have an active credit
management process which is focused on controlling loss exposure
to bankruptcies or other liquidity issues of counterparties. If
an assessment of uncollectible accounts resulted in a 1%
reduction of our third -party accounts receivable, our annual
operating income would decrease by $4.7 million in the year
of the assessment.
Price Risk Management (Hedging). Our net
income and cash flows are subject to volatility stemming from
changes in commodity prices and interest rates. To reduce the
volatility of our cash flows, the Partnership has entered into
(i) derivative financial instruments related to a portion
of its equity volumes to manage the purchase and sales prices of
commodities and (ii) interest rate financial instruments to
fix the interest rate on the Partnership’s variable debt.
We are exposed to the credit risk of the Partnership’s
counterparties in these derivative financial instruments. We
also monitor NGL inventory levels with a view to mitigating
losses related to downward price exposure.
The Partnership’s cash flow is affected by the derivative
financial instruments it enters into to the extent these
instruments are settled by (i) making or receiving a
payment to/from the counterparty or (ii) making or
receiving a payment for entering into a contract that exactly
offsets the original derivative financial instrument. Typically
a derivative financial instrument is settled when the physical
transaction that underlies the derivative financial instrument
occurs.
One of the primary factors that can affect our operating results
each period is the price assumptions used to value the
Partnership’s derivative financial instruments, which are
reflected at their fair values in the balance sheet. The
relationship between the derivative financial instruments and
the hedged item must be highly effective in achieving the offset
of changes in cash flows attributable to the hedged risk both at
the inception of the derivative financial instrument and on an
ongoing basis. Hedge accounting is discontinued prospectively
when a derivative financial instrument becomes ineffective.
Gains and losses deferred in other comprehensive income related
to cash flow hedges for which hedge accounting has been
discontinued remain deferred until the forecasted transaction
occurs. If it is probable that a hedged forecasted transaction
will not occur, deferred gains or losses on the derivative
financial instrument are reclassified to earnings immediately.
Recent Accounting
Pronouncements
For a discussion of recent accounting pronouncements that will
affect us, see “Significant Accounting Policies”
included under Note 4 to our “Audited Consolidated
Financial Statements” beginning on
page F-1
of this Prospectus.
Quantitative and
Qualitative Disclosures about Market Risk
The Partnership’s principal market risks are its exposure
to changes in commodity prices, particularly to the prices of
natural gas and NGLs, changes in interest rates, as well as
nonperformance by our customers. The Partnership does not use
risk sensitive instruments for trading purposes.
Commodity Price Risk. A majority of the
Partnership’s revenues are derived from
percent-of-proceeds
contracts under which it receives a portion of the natural gas
and/or NGLs
or equity volumes, as payment for services. The prices of
natural gas and NGLs are subject to fluctuations in response to
changes in supply, demand, market uncertainty and a variety of
additional factors beyond our control. We monitor these risks
and enter into hedging transactions designed to mitigate the
impact of commodity price fluctuations on our business. Cash
flows from a derivative instrument designated as a hedge are
classified in the same category as the cash flows from the item
being hedged.
The primary purpose of the commodity risk management activities
is to hedge the exposure to commodity price risk and reduce
fluctuations in the Partnership’s operating cash flow
despite fluctuations
79
in commodity prices. In an effort to reduce the variability of
the Partnership’s cash flows, as of December 31, 2010,
the Partnership has hedged the commodity price associated with a
portion of its expected natural gas, NGL and condensate equity
volumes that result from its percent of proceeds processing
arrangements in Field Gathering and Processing, and the LOU
portion of the Coastal Gathering and Processing Operations
through 2014 by entering into derivative financial instruments
including swaps and purchased puts (or floors). The percentages
of expected equity volumes that are hedged decrease over time.
With swaps, the Partnership typically receive an agreed fixed
price for a specified notional quantity of natural gas or NGL
and it pays the hedge counterparty a floating price for that
same quantity based upon published index prices. Since the
Partnership receives from its customers substantially the same
floating index price from the sale of the underlying physical
commodity, these transactions are designed to effectively
lock-in the agreed fixed price in advance for the volumes
hedged. In order to avoid having a greater volume hedged than
our actual equity volumes, the Partnership typically limits its
use of swaps to hedge the prices of less than its expected
natural gas and NGL equity volumes. The Partnership utilizes
purchased puts (or floors) to hedge additional expected equity
commodity volumes without creating volumetric risk. The
Partnership intends to continue to manage its exposure to
commodity prices in the future by entering into similar hedge
transactions using swaps, collars, purchased puts (or floors) or
other hedge instruments as market conditions permit.
The Partnership has tailored its hedges to generally match the
NGL product composition and the NGL and natural gas delivery
points to those of its physical equity volumes. The NGL hedges
cover specific NGL products based upon our expected equity NGL
composition. We believe this strategy avoids uncorrelated risks
resulting from employing hedges on crude oil or other petroleum
products as “proxy” hedges of NGL prices. The NGL
hedges fair values are based on published index prices for
delivery at Mont Belvieu through 2013, except for the price of
isobutane in 2012, which is based on the ending 2011 pricing.
The natural gas hedges fair values are based on published index
prices for delivery at WAHA, Permian Basin and Mid-Continent,
which closely approximate the actual NGL and natural gas
delivery points. A portion of the Partnership’s condensate
sales are hedged using crude oil hedges that are based on the
NYMEX futures contracts for West Texas Intermediate light, sweet
crude.
These commodity price hedging transactions are typically
documented pursuant to a standard International Swap Dealers
Association form with customized credit and legal terms. The
principal counterparties (or, if applicable, their guarantors)
have investment grade credit ratings. The Partnership’s
payment obligations in connection with substantially all of
these hedging transactions and any additional credit exposure
due to a rise in natural gas and NGL prices relative to the
fixed prices set forth in the hedges, are secured by a first
priority lien in the collateral securing its senior secured
indebtedness that ranks equal in right of payment with liens
granted in favor of its senior secured lenders. As long as this
first priority lien is in effect, the partnership expects to
have no obligation to post cash, letters of credit or other
additional collateral to secure these hedges at any time, even
if the counterparty’s exposure to the Partnership’s
credit increases over the term of the hedge as a result of
higher commodity prices or because there has been a change in
the Partnership’s creditworthiness.
For all periods presented we entered into hedging arrangements
for a portion of our forecasted equity volumes. Floor volumes
and floor pricing are based solely on purchased puts (or
floors). During 2008, 2009 and 2010, our operating revenues were
increased (decreased) by net hedge adjustments of
$(65.1) million, $69.7 million and $8.4 million.
80
As of December 31, 2010, our commodity derivative
arrangements were as follows:
Natural
Gas
| |
|
|
|
|
|
|
|
|
|
|
|
|
|
|
|
|
|
|
|
|
|
|
|
|
|
|
|
Price
|
|
|
MMBtu per day
|
|
|
|
|
|
Instrument Type
|
|
Index
|
|
$/MMBtu
|
|
|
2011
|
|
|
2012
|
|
|
2013
|
|
|
Fair Value
|
|
|
|
|
|
|
|
|
|
|
|
|
|
|
|
|
|
|
(In millions)
|
|
|
|
|
Swap
|
|
IF-WAHA
|
|
|
6.29
|
|
|
|
23,750
|
|
|
|
—
|
|
|
|
—
|
|
|
$
|
16.9
|
|
|
Swap
|
|
IF- WAHA
|
|
|
6.61
|
|
|
|
—
|
|
|
|
14,850
|
|
|
|
—
|
|
|
|
9.6
|
|
|
Swap
|
|
IF- WAHA
|
|
|
5.59
|
|
|
|
—
|
|
|
|
—
|
|
|
|
4,000
|
|
|
|
0.8
|
|
|
|
|
|
|
|
|
|
|
|
|
|
|
|
|
|
|
|
|
|
|
|
|
|
|
Total Swaps
|
|
|
|
|
|
|
|
|
23,750
|
|
|
|
14,850
|
|
|
|
4,000
|
|
|
|
|
|
|
|
|
|
|
|
|
|
|
|
|
|
|
|
|
|
|
|
|
|
|
|
|
|
|
Swap
|
|
IF-PB
|
|
|
5.42
|
|
|
|
2,000
|
|
|
|
—
|
|
|
|
—
|
|
|
|
0.8
|
|
|
Swap
|
|
IF-PB
|
|
|
5.54
|
|
|
|
—
|
|
|
|
4,000
|
|
|
|
—
|
|
|
|
1.1
|
|
|
Swap
|
|
IF-PB
|
|
|
5.54
|
|
|
|
—
|
|
|
|
—
|
|
|
|
4,000
|
|
|
|
0.8
|
|
|
|
|
|
|
|
|
|
|
|
|
|
|
|
|
|
|
|
|
|
|
|
|
|
|
Total Swaps
|
|
|
|
|
|
|
|
|
2,000
|
|
|
|
4,000
|
|
|
|
4,000
|
|
|
|
|
|
|
|
|
|
|
|
|
|
|
|
|
|
|
|
|
|
|
|
|
|
|
|
|
|
|
Swap
|
|
IF-NGPL MC
|
|
|
6.87
|
|
|
|
4,350
|
|
|
|
—
|
|
|
|
—
|
|
|
|
4.1
|
|
|
Swap
|
|
IF-NGPL MC
|
|
|
6.82
|
|
|
|
—
|
|
|
|
4,250
|
|
|
|
—
|
|
|
|
3.1
|
|
|
|
|
|
|
|
|
|
|
|
|
|
|
|
|
|
|
|
|
|
|
|
|
|
|
Total Swaps
|
|
|
|
|
|
|
|
|
4,350
|
|
|
|
4,250
|
|
|
|
—
|
|
|
|
|
|
|
|
|
|
|
|
|
|
|
|
|
|
|
|
|
|
|
|
|
|
|
|
|
|
|
|
|
|
|
|
|
|
|
|
30,100
|
|
|
|
23,100
|
|
|
|
8,000
|
|
|
|
|
|
|
|
|
|
|
|
|
|
|
|
|
|
|
|
|
|
|
|
|
|
|
|
|
|
|
Natural Gas Basis Swaps
|
|
Basis Swaps
|
|
Various Indexes, Maturities January 2011—May 2011
|
|
|
(0.4
|
)
|
|
|
|
|
|
|
|
|
|
|
|
|
|
|
|
|
|
|
|
|
|
|
|
|
|
|
|
|
|
$
|
36.8
|
|
|
|
|
|
|
|
|
|
|
|
|
|
|
|
|
|
|
|
|
|
|
|
|
|
NGLs
| |
|
|
|
|
|
|
|
|
|
|
|
|
|
|
|
|
|
|
|
|
|
|
|
|
|
|
|
Price
|
|
|
Barrels per day
|
|
|
|
|
|
Instrument Type
|
|
Index
|
|
$/gal
|
|
|
2011
|
|
|
2012
|
|
|
2013
|
|
|
Fair Value
|
|
|
|
|
|
|
|
|
|
|
|
|
|
|
|
|
|
|
(In millions)
|
|
|
|
|
Swap
|
|
OPIS-MB
|
|
|
0.85
|
|
|
|
8,550
|
|
|
|
—
|
|
|
|
—
|
|
|
$
|
(18.0
|
)
|
|
Swap
|
|
OPIS-MB
|
|
|
0.85
|
|
|
|
—
|
|
|
|
6,700
|
|
|
|
—
|
|
|
|
(6.6
|
)
|
|
Swap
|
|
OPIS-MB
|
|
|
0.92
|
|
|
|
—
|
|
|
|
—
|
|
|
|
3,400
|
|
|
|
(4.0
|
)
|
|
|
|
|
|
|
|
|
|
|
|
|
|
|
|
|
|
|
|
|
|
|
|
|
|
Total Swaps
|
|
|
|
|
|
|
|
|
8,550
|
|
|
|
6,700
|
|
|
|
3,400
|
|
|
|
|
|
|
|
|
|
|
|
|
|
|
|
|
|
|
|
|
|
|
|
|
|
|
|
|
|
|
Floor
|
|
OPIS-MB
|
|
|
1.44
|
|
|
|
253
|
|
|
|
—
|
|
|
|
—
|
|
|
|
0.8
|
|
|
Floor
|
|
OPIS-MB
|
|
|
1.43
|
|
|
|
—
|
|
|
|
294
|
|
|
|
—
|
|
|
|
1.3
|
|
|
|
|
|
|
|
|
|
|
|
|
|
|
|
|
|
|
|
|
|
|
|
|
|
|
Total Floors
|
|
|
|
|
|
|
|
|
253
|
|
|
|
294
|
|
|
|
—
|
|
|
|
|
|
|
|
|
|
|
|
|
|
|
|
|
|
|
|
|
|
|
|
|
|
|
|
|
|
|
Total Sales
|
|
|
|
|
|
|
|
|
8,803
|
|
|
|
6,994
|
|
|
|
3,400
|
|
|
|
|
|
|
|
|
|
|
|
|
|
|
|
|
|
|
|
|
|
|
|
|
|
|
|
|
|
|
|
|
|
|
|
|
|
|
|
|
|
|
|
|
|
|
|
|
|
|
$
|
(26.5
|
)
|
|
|
|
|
|
|
|
|
|
|
|
|
|
|
|
|
|
|
|
|
|
|
|
|
81
Condensate
| |
|
|
|
|
|
|
|
|
|
|
|
|
|
|
|
|
|
|
|
|
|
|
|
|
|
|
|
|
|
|
|
Price
|
|
|
Barrels per day
|
|
|
|
|
|
Instrument Type
|
|
Index
|
|
$/Bbl
|
|
|
2011
|
|
|
2012
|
|
|
2013
|
|
|
2014
|
|
|
Fair Value
|
|
|
|
|
|
|
|
|
|
|
|
|
|
|
|
|
|
|
|
|
|
(In millions)
|
|
|
|
|
Swap
|
|
NY-WTI
|
|
|
80.37
|
|
|
|
1,100
|
|
|
|
—
|
|
|
|
—
|
|
|
|
—
|
|
|
$
|
(5.4
|
)
|
|
Swap
|
|
NY-WTI
|
|
|
82.25
|
|
|
|
—
|
|
|
|
950
|
|
|
|
—
|
|
|
|
—
|
|
|
|
(4.0
|
)
|
|
Swap
|
|
NY-WTI
|
|
|
81.82
|
|
|
|
—
|
|
|
|
—
|
|
|
|
800
|
|
|
|
—
|
|
|
|
(3.1
|
)
|
|
Swap
|
|
NY-WTI
|
|
|
90.03
|
|
|
|
—
|
|
|
|
—
|
|
|
|
—
|
|
|
|
700
|
|
|
|
(0.6
|
)
|
|
|
|
|
|
|
|
|
|
|
|
|
|
|
|
|
|
|
|
|
|
|
|
|
|
|
|
|
|
Total Sales
|
|
|
|
|
|
|
|
|
1,100
|
|
|
|
950
|
|
|
|
800
|
|
|
|
700
|
|
|
|
|
|
|
|
|
|
|
|
|
|
|
|
|
|
|
|
|
|
|
|
|
|
|
|
|
|
|
|
|
|
|
|
|
|
|
|
|
|
|
|
|
|
|
|
|
|
|
|
|
|
|
|
|
|
|
$
|
(13.1
|
)
|
|
|
|
|
|
|
|
|
|
|
|
|
|
|
|
|
|
|
|
|
|
|
|
|
|
|
|
|
These contracts may expose the Partnership to the risk of
financial loss in certain circumstances. Its hedging
arrangements provide protection on the hedged volumes if prices
decline below the prices at which these hedges are set. If
prices rise above the prices at which they have been hedged, the
Partnership will receive less revenue on the hedged volumes than
it would receive in the absence of hedges.
The Partnership accounts for the fair value of our financial
assets and liabilities using a three-tier fair value hierarchy,
which prioritizes the significant inputs used in measuring fair
value. These tiers include: Level 1, defined as observable
inputs such as quoted prices in active markets; Level 2,
defined as inputs other than quoted prices in active markets
that are either directly or indirectly observable; and
Level 3, defined as unobservable inputs in which little or
no market data exists, therefore required an entity to develop
its own assumptions. The value of the NGL derivative contracts
is determined utilizing a discounted cash flow model for swaps
and a standard option pricing model for options, based on inputs
that are either readily available in public markets or are
quoted by counterparties to these contracts. Prior to 2009, all
of the NGL contracts were classified as Level 3 within the
hierarchy. In 2009, we were able to obtain inputs from quoted
prices related to certain of these commodity derivatives for
similar assets and liabilities in active markets. These inputs
are observable for the asset or liability, either directly or
indirectly, for the full term of the commodity swaps and
options. For the NGL contracts that have inputs from quoted
prices, the classification of these instruments changed from
Level 3 to Level 2 within the fair value hierarchy.
For those NGL contracts where we were unable to obtain quoted
prices for the full term of the commodity swap and options, the
NGL valuations are still classified as Level 3 within the
fair value hierarchy.
Interest Rate Risk. We are exposed to changes
in interest rates, primarily as a result of variable rate
borrowings under Targa and the Partnership’s senior secured
revolving credit facilities. To the extent that interest rates
increase, interest expense for our revolving debt will also
increase. As of December 31, 2010, we have variable rate
borrowings of $89.3 million and the Partnership has
variable interest rate borrowings of $765.3 million. In an
effort to reduce the variability of our cash flows, the
Partnership has entered into several interest rate swap and
interest rate basis swap agreements. Under these agreements,
which are accounted for as cash flow hedges, the base interest
rate on the specified notional amount of the Partnership’s
variable rate debt is effectively fixed for the term of each
agreement and ineffectiveness is required to be measured each
reporting period. The fair values of the interest rate swap
agreements, which are adjusted regularly, have been aggregated
by counterparty for classification in our consolidated balance
sheets. Accordingly, unrealized gains and losses relating to the
interest rate swaps are recorded in accumulated other
comprehensive income (“OCI”) until the interest
expense on the related debt is recognized in earnings.
A hypothetical increase of 100 basis points in the
underlying interest rate, after taking into account our interest
rate swaps, would increase our consolidated interest expense by
$5.5 million.
82
As of December 31, 2010, the Partnership had the following
open interest rate swaps:
| |
|
|
|
|
|
|
|
|
|
|
|
|
|
Period
|
|
Fixed Rate
|
|
|
Notional Amount
|
|
|
Fair Value
|
|
|
|
|
|
|
|
|
|
|
(In millions)
|
|
|
|
|
2011
|
|
|
3.52
|
%
|
|
$
|
300 million
|
|
|
$
|
(7.8
|
)
|
|
2012
|
|
|
3.40
|
%
|
|
|
300 million
|
|
|
|
(7.5
|
)
|
|
2013
|
|
|
3.39
|
%
|
|
|
300 million
|
|
|
|
(4.0
|
)
|
|
2014
|
|
|
3.39
|
%
|
|
|
300 million
|
|
|
|
(0.8
|
)
|
|
|
|
|
|
|
|
|
|
|
|
|
|
|
|
|
|
|
|
|
|
|
|
|
|
$
|
(20.1
|
)
|
|
|
|
|
|
|
|
|
|
|
|
|
|
|
Credit Risk. The Partnership is subject to
risk of losses resulting from nonpayment or nonperformance by
its counterparties. The credit exposure related to commodity
derivative instruments is represented by the fair value of
contracts with these derivative instruments being in a net asset
position at the reporting date. At such times, these outstanding
instruments expose us to credit loss in the event of
nonperformance by the counterparties to the agreements. Should
the creditworthiness of one or more of the counterparties
decline, the Partnership’s ability to mitigate
nonperformance risk is limited to a counterparty agreeing to
either a voluntary termination and subsequent cash settlement or
a novation of the derivative contract to a third party. In the
event of a counterparty default, the Partnership may sustain a
loss and its cash receipts could be negatively impacted.
As of December 31, 2010, the Partnership had counterparty
credit exposure related to commodity derivatives with affiliates
of Barclays, Credit Suisse, and BP which accounted for 62%, 13%
and 12%, respectively, of the Partnership’s counterparty
credit exposure related to commodity derivative instruments.
Barclays, and Credit Suisse are major financial institutions and
BP is a major oil and gas company. These entities possess
investment grade credit ratings based upon minimum credit
ratings assigned by Standard & Poor’s Ratings
Services.
83
OUR
INDUSTRY
Introduction
Natural gas gathering and processing and logistics and marketing
are a critical part of the natural gas value chain. Natural gas
gathering and processing systems create value by collecting raw
natural gas from the wellhead and separating dry gas (primarily
methane) from mixed NGLs which include ethane, propane, normal
butane, isobutane and natural gasoline. Most natural gas
produced at the wellhead contains NGLs. Natural gas produced in
association with crude oil typically contains higher
concentrations of NGLs than natural gas produced from gas wells.
This unprocessed natural gas is generally not acceptable for
transportation in the nation’s interstate pipeline
transmission system or for commercial use. Processing plants
extract the NGLs, leaving residual dry gas that meets interstate
pipeline transmission and commercial quality specifications.
Furthermore, processing plants produce NGLs which, on an energy
equivalent basis, usually have a greater economic value as a raw
material for petrochemicals, motor gasolines or commercial use
than as a residual component of the natural gas stream. In order
for the mixed NGLs to become marketable to end users, they are
first fractionated into NGL products, perhaps put into storage
and ultimately distributed to end users. The table below
illustrates the position and function of natural gas gathering
and processing and logistics and marketing within the natural
gas market chain.
We believe that current industry dynamics are resulting in
increases in domestic drilling within the basins in which we
operate and creating the need for additional natural gas and
natural gas liquids infrastructure and services. Factors
contributing to this include (i) a strong crude oil and NGL
price environment; (ii) the continuation of oil and gas
exploration and production innovation including geophysical
interpretation, horizontal drilling and well completion
techniques; (iii) a trend toward increased drilling in oil,
condensate and NGL rich, or “liquids rich” reservoirs,
especially resource plays;
84
and (iv) increasing levels of supply of mixed NGLs to our
fractionation facilities coupled with strong demand from
petrochemical complexes and exports which are leading to higher
capacity utilization.
The following overview provides additional information relating
to the operations of our assets as well an overview of the
potential demand for our services and other related information.
We believe our integrated midstream platform is well positioned
to benefit from these industry trends and to compete for
opportunities to provide new infrastructure and services.
Overview of
Natural Gas Gathering and Processing
Gathering. At the initial stages of the
midstream value chain, a network of typically small diameter
pipelines known as gathering systems directly connect to
wellheads, batteries or central delivery points
(“CDPs”) in the production area. These gathering
systems transport raw natural gas to a common location for
processing and treating. A large gathering system may involve
thousands of miles of gathering lines connected to thousands of
wells or indirectly to wells via CDPs. Gathering systems are
often designed to be flexible to allow gathering of natural gas
at different pressures, perhaps flow natural gas to multiple
plants, provide the ability to connect new producers quickly,
and most importantly are generally scalable to allow for
additional production without significant incremental capital
expenditures.
Field Compression. Since individual wells
produce at progressively lower field pressures as they deplete,
it becomes increasingly difficult to produce the remaining
production in the ground against the pressure that exists in the
connecting gathering system. Natural gas compression is a
mechanical process in which a volume of natural gas at a given
pressure is compressed to a desired higher pressure, which
allows the natural gas to flow into a higher pressure system.
Field compression is typically used to allow a gathering system
to operate at a lower pressure or provide sufficient discharge
pressure to deliver natural gas into a higher pressure system.
If field compression is not installed, then less of the
remaining natural gas in the ground will be produced because it
cannot overcome the gathering system pressure. In contrast, if
field compression is installed, then a well can continue
delivering natural gas that otherwise would not be produced.
Treating and Dehydration. After gathering, the
second process in the midstream value chain is treating and
dehydration. Natural gas contains various contaminants, such as
water vapor, carbon dioxide and hydrogen sulfide, that can cause
significant damage to intrastate and interstate pipelines and
therefore render the gas unacceptable for transmission on such
pipelines. In addition, end-users will not purchase natural gas
with a high level of these contaminants. To meet downstream
pipeline and end-user natural gas quality standards, the natural
gas is dehydrated to remove the saturated water and is
chemically treated to remove the carbon dioxide and hydrogen
sulfide from the gas stream.
Processing. Once the contaminants are removed,
the next step involves the separation of pipeline quality
residue gas from mixed NGLs, a method known as processing. Most
decontaminated natural gas is not suitable for long-haul
pipeline transportation or commercial use and must be processed
to remove the heavier hydrocarbon components. The removal and
separation of hydrocarbons during processing is possible because
of the differences in physical properties between the components
of the raw gas stream. There are four basic types of natural gas
processing methods: cryogenic expansion, lean oil absorption,
straight refrigeration and dry bed absorption. Cryogenic
expansion represents the latest generation and most prevalent
form of processing in the U.S, incorporating extremely low
temperatures and high pressures to provide the best processing
and most economical extraction.
Natural gas is processed not only to remove NGLs that may
interfere with pipeline transportation or the end use of the
natural gas, but also to separate from the natural gas those
hydrocarbon liquids that could have a higher value as NGLs than
as natural gas. The principal components of residue gas are
methane and to a much lower extent ethane, but processors
typically have the option to recover most of the ethane from the
residue gas stream for processing into NGLs or reject some of
the ethane and leave it in the residue gas stream, depending on
pipeline restrictions and whether the ethane is more valuable
being processed or left in the natural gas stream. The residue
gas is sold to industrial, commercial and residential customers
and electric utilities. The premium or discount in value between
natural gas and processed NGLs
85
is known as the “frac spread.” Because NGLs often
serve as substitutes for products derived from crude oil, NGL
prices tend to move in relation to crude prices.
Natural gas processing occurs under a contractual arrangement
between the producer or owner of the raw natural gas stream and
the processor. There are many forms of processing contracts
which vary in the amount of commodity price risk they carry. The
specific commodity exposure to natural gas or NGL prices is
highly dependent on the types of contracts. Processing contracts
can vary in length from one month to the “life of the
field.” Four typical processing contract types are
described below:
|
|
|
| |
•
|
Percent-of-Proceeds,
Percent-of-Value
or
Percent-of-Liquids.
In a
percent-of-proceeds
arrangement, the processor remits to the producers a percentage
of the proceeds from the sales of residue gas and NGL products
or a percentage of residue gas and NGL products at the tailgate
of the processing facilities. In some
percent-of-proceeds
arrangements, the producer is paid a percentage of an index
price for residue gas and NGL products, less agreed adjustments,
rather than remitting a portion of the actual sales proceeds.
The
percent-of-value
and
percent-of-liquids
are variations on this arrangement. These types of arrangements
expose the processor to some commodity price risk as the
revenues from the contracts are directly correlated with the
price of natural gas and NGLs.
|
| |
| |
•
|
Keep-Whole. A keep-whole arrangement allows
the processor to keep 100% of the NGLs produced and requires the
return of natural gas, or value of the gas, to the producer or
owner. A wellhead purchase contract is a variation of this
arrangement. Since some of the gas is used during processing,
the processor must compensate the producer or owner for the gas
shrink entailed in processing by supplying additional gas or by
paying an agreed value for the gas utilized. These arrangements
have the highest commodity price exposure for the processor
because the costs are dependent on the price of natural gas and
the revenues are based on the price of NGLs. As a result, a
processor with these types of contracts benefits when the value
of the NGLs is high relative to the cost of the natural gas and
is disadvantaged when the cost of the natural gas is high
relative to the value of the NGLs.
|
| |
| |
•
|
Fee-Based. Under a fee-based contract, the
processor receives a fee per gallon of NGLs produced or per Mcf
of natural gas processed. Under a pure fee-based arrangement, a
processor would have no direct commodity price risk exposure.
|
| |
| |
•
|
Hybrid. Hybrid contracts are a mix of the
typical processing contracts discussed above. In periods of
favorable processing economics, hybrid contracts are similar to
percent-of-liquids
contracts or to wellhead purchases/keep-whole contracts in some
circumstances, if economically advantageous to the processor. In
periods of unfavorable processing economics, hybrid contracts
are similar to fee-based contracts. Favorable processing
economics typically occur when processed NGLs can be sold, after
allowing for processing costs, at a higher value than natural
gas on a Btu equivalent basis,
|
Overview of
Logistics and Marketing
Fractionation. Fractionation is the
distillation of the heterogeneous mixture of extracted NGLs into
individual components for end-use sale. Fractionation is
accomplished by controlling the temperature and pressure of the
stream of mixed liquids in order to take advantage of the
difference in boiling points of separate products. As the
temperature of the stream is increased, the lightest component
boils off the top of the distillation tower as a gas where it
then condenses into a finished NGL product that is routed to
markets or to storage. The heavier components in the mixture are
routed to the next tower where the process is repeated until all
components have been separated. Described below are the five
basic NGL components (“NGL products”) and their
typical uses. A typical barrel of NGLs consists of ethane,
propane, normal butane, isobutane and natural gasoline.
|
|
|
| |
•
|
Ethane. Ethane is used primarily as feedstock
in the production of ethylene, one of the basic building blocks
for a wide range of plastics and other chemical products.
|
86
|
|
|
| |
•
|
Propane. Propane is used as heating fuel,
engine fuel and industrial fuel, for agricultural burning and
drying and as petrochemical feedstock for production of ethylene
and propylene.
|
| |
| |
•
|
Normal Butane. Normal butane is principally
used for motor gasoline blending and as fuel gas, either alone
or in a mixture with propane, and feedstock for the manufacture
of ethylene and butadiene, a key ingredient of synthetic rubber.
Normal butane is also used to derive isobutane.
|
| |
| |
•
|
Isobutane. Isobutane is principally used by
refiners to enhance the octane content of motor gasoline and in
the production of MTBE, an additive in cleaner burning motor
gasoline.
|
| |
| |
•
|
Natural Gasoline. Natural gasoline is
principally used as a motor gasoline blend stock or
petrochemical feedstock.
|
As of December 31, 2009 the United States and Ontario,
Canada had approximately 2.6 MMBbl/d of existing
fractionation capacity with several expansions announced and
underway. Mont Belvieu, TX accounted for 28% of total
U.S. fractionation capacity, making it the largest NGL
complex in the US. Another 18% of the fractionation capacity is
located in Louisiana. Both of these regions are located close to
the large petrochemical complex which is along the Gulf Coast in
Texas and Louisiana and which constitutes a major consumer of
NGL products.
Total U.S. and
Ontario Fractionation Capacity by Location
| |
|
|
|
|
|
|
|
|
|
|
|
|
|
|
|
Capacity
|
|
|
|
|
|
Region
|
|
(MBbl/d)
|
|
% of Total
|
|
|
|
|
Mont Belvieu, TX
|
|
|
737
|
|
|
|
28.4
|
%
|
|
|
Other Texas & New Mexico
|
|
|
606
|
|
|
|
23.4
|
%
|
|
|
Kansas/Oklahoma
|
|
|
513
|
|
|
|
19.8
|
%
|
|
|
Louisiana(1)
|
|
|
476
|
|
|
|
18.4
|
%
|
|
|
Ontario and Other US
|
|
|
260
|
|
|
|
10.0
|
%
|
|
|
|
|
|
|
|
|
|
|
|
|
|
Total
|
|
|
2,592
|
|
|
|
|
|
|
|
|
|
|
|
|
|
|
|
|
The Partnership’s fractionation assets are primarily
located at Mont Belvieu, TX and Lake Charles, LA with
approximately 79% of gross capacity located at Mont Belvieu.
Based on operatorship, the Partnership is the second largest
operator of fractionation in Mont Belvieu and Louisiana
combined. Additionally, the Partnership is currently starting up
the approximately 78 MBbl/d of additional fractionation
capacity.
Mont Belvieu and
Louisiana. Combined Fractionation Capacity by Operator
| |
|
|
|
|
|
|
|
|
|
|
|
|
|
|
|
Capacity
|
|
|
|
|
|
Company
|
|
(MBbl/d)
|
|
% of Total
|
|
|
|
|
Enterprise (including Promix LLC)
|
|
|
564
|
|
|
|
46.5
|
%
|
|
|
Targa
Resources(1)
|
|
|
283
|
|
|
|
23.3
|
%
|
|
|
ONEOK
|
|
|
160
|
|
|
|
13.2
|
%
|
|
|
Others
|
|
|
206
|
|
|
|
17.0
|
%
|
|
|
|
|
|
|
|
|
|
|
|
|
|
Total
|
|
|
1,213
|
|
|
|
|
|
|
|
|
|
|
|
|
|
|
|
|
|
|
|
|
(1) |
|
Total Louisiana capacity and Targa
Resources capacity reduced by 36 MBbl/d to reflect the
Partnership’s idle facility in Venice, Louisiana.
|
Source: Purvin and Gertz, Inc, “The North
American NGL Industry: Risks and Rewards in the Midstream
Sector: 2010 Edition” and company filings.
87
Transportation and Storage. Once the mixed
NGLs are fractionated into individual NGL products, the NGL
products are stored, transported and marketed to end-use
markets. The NGL industry has thousands of miles of intrastate
and interstate transmission pipelines and a network of barges,
rails, trucks, terminals and underground storage facilities to
deliver NGLs to market. The bulk of the NGL storage capacity is
located near the refining and petrochemical complexes of the
Texas and Louisiana Gulf Coasts, with a second major
concentration in central Kansas. Each NGL product system
typically has storage capacity located both throughout the
pipeline network and at major market centers to help temper
seasonal demand and daily supply-demand shifts.
Barriers to Entry. Although competition within
the logistics and marketing industry is robust, we believe there
are significant barriers to entry for these business lines.
These barriers include (i) significant costs and execution
risk to construct new facilities; (ii) a finite number of
sites such as ours that are connected to market hubs, pipeline
infrastructure, underground storage, import / export
facilities and end users and (iii) specialized expertise
required to operate logistics and marketing facilities.
Industry
Trends
Natural gas is a critical component of energy consumption in the
U.S., accounting for approximately 24% of all energy used in
2008, representing approximately 23.8 Tcf of natural gas,
according to the U.S. Energy Information Administration
(“EIA”). Over the next 27 years, the EIA
estimates that total domestic energy consumption will increase
by over 15%, with natural gas consumption directly benefiting
from population growth, growth in cleaner-burning natural
gas-fired electric generation and natural gas vehicles, and
indirectly through additions of electric vehicles. Additionally,
we believe that there are numerous other trends in the industry
relating to natural gas and NGLs that will continue to benefit
us. These trends include the following:
Commodity Price Environment. Current crude,
condensate and NGL pricing are relatively attractive compared to
historical levels while current natural gas pricing is
relatively less attractive. Furthermore, the existing
differential between NGL prices (often linked to crude oil
prices) and natural gas prices creates a premium value for the
mixed NGLs relative to the value of natural gas from which they
are removed. This environment incents producers to develop
hydrocarbon reserves that contain oil, condensate and NGLs and
incents producers or processors to remove the maximum amount of
NGLs from the raw natural gas through processing.
Advances in Exploration and Production
Techniques. Improvements in exploration and
production capabilities including geophysical interpretation,
horizontal drilling, and well completions have played a
significant role in the increase of domestic shale natural gas
production. The natural gas shale formations represent prolific
sources of domestic hydrocarbons. With the advances in
exploration and production capabilities driving finding and
development costs down, natural gas produced from the shale
formations is expected to represent an increasing portion of
total domestic supply. As drilling activity continues to
increase in these areas, gathering and pipeline systems will be
required to transport the natural gas, processing plants will be
needed to process such natural gas, fractionation will be
required to turn mixed NGLs into commercial NGL products, and
other logistics, marketing and distribution infrastructure will
be utilized to distribute NGL products to the ultimate end
users. We believe that improvements in geosciences, drilling
technology, and completion techniques are also being used to
develop and exploit other resource plays in conventional basins,
including the Wolfberry and other geographic strata in the
Permian Basin.
Shift to Oil and Liquids Rich Natural Gas
Production. Due to the current commodity price
environment, producer economics shift drilling activity toward
oil production and gas production with higher levels of
condensate and NGLs. As a result, the level of well permitting
in liquids rich plays has been significantly increasing.
Processing is generally required to strip out the mixed NGLs
prior to transportation of the natural gas to end users,
especially in oil and liquids rich natural gas production areas.
The increased production of natural gas rich in NGLs has
resulted in increased need for processing facilities and has
created a significant supply of mixed NGLs that ultimately must
be fractionated.
88
Increasing Levels of Mixed NGL Supplies and Demand for NGL
Products. Due to the producers’ economic
focus on oil, condensate and NGL rich production streams, the
supply of mixed NGLs to the Gulf Coast is quickly increasing.
This increase in supply has resulted in high utilization rates
for fractionation services. The increased demand for
fractionation has allowed many suppliers of fractionation
services to increase fees and enter into longer dated contracts.
Additionally, we believe that strong processing economics as a
result of recent historical and forecast commodity prices are
driving incremental improvements in processing recoveries which
along with lighter processable NGL barrels in certain shale
plays are resulting in the recovery of more ethane. In response
to recent ethane and propane pricing as a petrochemical
feedstock relative to competing crude-based feedstocks, Gulf
Coast flexi-crackers have been shifting to lighter feedstock and
are converting heavy crackers to be switchable to lighter
feedstock. This increases demand for NGL products.
89
OUR
BUSINESS
Overview
We own general and limited partner interests, including IDRs, in
Targa Resources Partners LP (NYSE: NGLS), a publicly traded
Delaware limited partnership that is a leading provider of
midstream natural gas and natural gas liquid services in the
United States. The Partnership is engaged in the business of
gathering, compressing, treating, processing and selling natural
gas, storing, fractionating, treating, transporting and selling
natural gas liquids, or NGLs, and NGL products and storing and
terminaling refined petroleum products and crude oil.
On December 20, 2010, we completed our initial public
offering, or IPO, of our common stock. We did not receive any
proceeds from the sale of shares by the selling stockholders.
Our primary business objective is to increase our cash available
for dividends to our stockholders by assisting the Partnership
in executing its business strategy. We may facilitate the
Partnership’s growth through various forms of financial
support, including, but not limited to, modifying the
Partnership’s IDRs, exercising the Partnership’s IDR
reset provision contained in its partnership agreement, making
loans, making capital contributions in exchange for yielding or
non-yielding equity interests or providing other financial
support to the Partnership, if needed, to support its ability to
make distributions. We also may enter into other economic
transactions intended to increase our ability to make cash
available for dividends over time. In addition, we may acquire
assets that could be candidates for acquisition by the
Partnership, potentially after operational or commercial
improvement or further development.
As of April 12, 2011, our interests in the Partnership
consist of the following:
|
|
|
| |
•
|
a 2% general partner interest, which we hold through our 100%
ownership interest in the general partner of the Partnership;
|
| |
| |
•
|
all of the outstanding IDRs; and
|
| |
| |
•
|
11,645,659 of the 84,756,009 outstanding common units of the
Partnership, representing 13.7% of the limited partnership
interest in the Partnership.
|
Our cash flows are generated from the cash distributions we
receive from the Partnership. The Partnership is required to
distribute all available cash at the end of each quarter after
establishing reserves to provide for the proper conduct of its
business or to provide for future distributions. Our ownership
of the Partnership’s general partner interest entitles us
to receive:
|
|
|
| |
•
|
2% of all cash distributed in respect for that quarter;
|
Our ownership in respect to the IDR’s of the Partnership
that we hold, entitles us to receive:
|
|
|
| |
•
|
13% of all cash distributed in a quarter after $0.3881 has been
distributed in respect of each common unit of the Partnership
for that quarter;
|
| |
| |
•
|
23% of all cash distributed in a quarter after $0.4219 has been
distributed in respect of each common unit of the Partnership
for that quarter; and
|
| |
| |
•
|
48% of all cash distributed in a quarter after $0.50625 has been
distributed in respect of each common unit of the Partnership
for that quarter.
|
On April 11, 2011, the Partnership announced that the board
of directors of the General Partner declared a quarterly cash
distribution of $0.5575 per common unit, or $2.23 per common
unit on an annualized basis, for the first quarter of 2011. This
cash distribution will be paid May 13, 2011 on all
outstanding common units to holders of record as of the close of
business on April 21, 2011.
On April 11, 2011, we announced that our board of directors
declared a quarterly cash dividend of $0.2725 per share of
common stock, or $1.09 per share on an annualized basis for the
first quarter of 2011. This cash dividend will be paid on
May 17, 2011 on all outstanding shares of common stock to
holders of
90
record as of the close of business on April 21, 2011. If
we close this offering on or prior to the record date on
April 21, 2011, the shares of common stock sold in this
offering will receive the declared dividend of $0.2725 per share
of common stock for the first quarter of 2011. If we do not
close this offering on or prior to the record date on
April 21, 2011, then the shares of common stock sold in
this offering will not receive the declared dividend.
We intend to pay to our stockholders, on a quarterly basis,
dividends equal to the cash the Partnership distributes to us
based on our ownership of Partnership securities, less the
expenses of being a public company, other general and
administrative expenses, federal income taxes, capital
contributions to the Partnership and reserves established by our
board of directors. See “Our Dividend Policy.”
The following graph shows the historical cash distributions
declared by the Partnership for the periods shown to its limited
partners (including us), to us based on our 2% general partner
interest in the Partnership and to us based on the IDRs. The
increases in historical cash distributions to both the limited
partners and the general partner since the second quarter ended
June 30, 2007, as reflected in the graph set forth below,
generally resulted from increases in the Partnership’s per
unit quarterly distribution over time and the issuance of
approximately 53.9 million additional common units by the
Partnership over time to finance acquisitions and capital
improvements. Over the same period, the quarterly distributions
declared by the Partnership in respect of our 2% general partner
interest and IDRs increased approximately 3,600% from
$0.2 million to $7.9 million.
Quarterly Cash
Distributions by the Partnership
The graph set forth below shows hypothetical cash distributions
payable to us in respect of our interests in the Partnership
across an illustrative range of annualized distributions per
common unit. This information is based upon the following:
(i) the Partnership has a total of 84,756,009 common units
outstanding; and
91
(ii) we own (i) a 2% general partner interest in the
Partnership, (ii) the IDRs and (iii) 11,645,659 common
units of the Partnership.
The graph below also illustrates the impact on us of the
Partnership raising or lowering its per common unit distribution
from the 2011 first quarter quarterly distribution of
$0.5575 per common unit, or $2.23 per common unit on
an annualized basis. This information is presented for
illustrative purposes only; it is not intended to be a
prediction of future performance and does not attempt to
illustrate the impact that changes in our or the
Partnership’s business, including changes that may result
from changes in interest rates, energy prices or general
economic conditions, or the impact that any future acquisitions
or expansion projects, divestitures or issuances of additional
debt or equity securities will have on our or the
Partnership’s results of operations.
Hypothetical
Annualized Pre-Tax Partnership Distributions to Us
The impact on us of changes in the Partnership’s
distribution levels will vary depending on several factors,
including the Partnership’s total outstanding partnership
interests on the record date for the distribution, the aggregate
cash distributions made by the Partnership and the interests in
the Partnership owned by us. If the Partnership increases
distributions to its unitholders, including us, we would expect
to increase dividends to our stockholders, although the timing
and amount of such increased dividends, if any, will not
necessarily be comparable to the timing and amount of the
increase in distributions made by the Partnership. In addition,
the level of distributions we receive and of dividends we pay to
our stockholders may be affected by the various risks associated
with an investment in us and the underlying business of the
Partnership.
Legal
Proceedings
We are involved in various legal proceedings arising in the
ordinary course of our business. See “—Business of
Targa Resources Partners LP—Legal Proceedings.”
92
BUSINESS OF TARGA
RESOURCES PARTNERS LP
Overview
The Partnership is a leading provider of midstream natural gas
and NGL services in the United States that we formed on
October 26, 2006 to own, operate, acquire and develop a
diversified portfolio of complementary midstream energy assets.
The Partnership is engaged in the business of gathering,
compressing, treating, processing and selling natural gas,
storing, fractionating, treating, transporting and selling NGLs
and NGL products and storing and terminaling refined petroleum
products and crude oil. The Partnership operates in two primary
divisions: (i) Natural Gas Gathering and Processing,
consisting of two segments—(a) Field Gathering and
Processing and (b) Coastal Gathering and Processing; and
(ii) Logistics and Marketing, consisting of two
segments—(a) Logistics Assets and (b) Marketing and
Distribution.
The Natural Gas Gathering and Processing division includes
assets used in the gathering of natural gas produced from oil
and gas wells and processing this gathered raw natural gas into
merchantable natural gas by removing impurities and extracting a
stream of combined NGLs or mixed NGLs (sometimes called Y-grade
or raw mix). The Field Gathering and Processing segment assets
are located in North Texas and in the Permian Basin of Texas and
New Mexico. The Coastal Gathering and Processing segment assets
are located in the onshore and near offshore regions of the
Louisiana Gulf Coast accessing onshore and offshore gas supplies.
The Logistics and Marketing division is also referred to as the
Downstream Business. It includes the activities necessary to
fractionate mixed NGLs into finished NGL products—ethane,
propane, normal butane, isobutane and natural gasoline—and
provides certain value added services, such as the storage,
terminaling, transportation, distribution and marketing of NGLs.
The assets in this segment are generally connected indirectly to
and supplied, in part, by the Partnership’s gathering and
processing segments and are predominantly located in Mont
Belvieu, Texas and Southwestern Louisiana. The Marketing and
Distribution segment covers all activities required to
distribute and market mixed NGLs and NGL products. It includes
(1) marketing and purchasing NGLs in selected United States
markets; (2) marketing and supplying NGLs for refinery
customers; and (3) transporting, storing and selling
propane and providing related propane logistics services to
multi-state retailers, independent retailers and other end users.
Since the beginning of 2007, the Partnership has completed six
acquisitions from us with an aggregate purchase price of
approximately $3.1 billion. The acquisitions from us are as
follows:
|
|
|
| |
•
|
In February 2007, in connection with its initial public
offering, the Partnership acquired approximately
3,950 miles of integrated gathering pipelines that gather
and compress natural gas received from receipt points in the
Fort Worth Basin/Bend Arch in North Texas, two natural gas
processing plants and a fractionator. These assets, together
with the business conducted thereby, are collectively referred
to as the “North Texas System.”
|
| |
| |
•
|
In October 2007, the Partnership acquired natural gas gathering,
processing and treating assets in the Permian Basin of West
Texas and in Southwest Louisiana. The West Texas assets,
together with the business conducted thereby, are collectively
referred to as “SAOU” and the Southwest Louisiana
assets, together with the business conducted thereby, are
collectively referred to as “LOU”.
|
| |
| |
•
|
In September 2009, the Partnership acquired our NGL business
consisting of fractionation facilities, storage and terminaling
facilities, low sulfur natural gasoline treating facilities,
pipeline transportation and distribution assets, propane
storage, truck terminals and NGL transport assets. These assets,
together with the businesses conducted thereby, are collectively
referred to as the Logistics and Marketing division or the
Downstream Business.
|
| |
| |
•
|
In April 2010, the Partnership acquired a natural gas straddle
business consisting of the business and operations involving the
Barracuda, Lowry and Stingray plants, including the Pelican,
|
93
|
|
|
| |
|
Seahawk and Cameron gas gathering pipeline systems, and the
interests in the business and operations of the Bluewater, Sea
Robin, Calumet, N. Terrebonne, Toca and Yscloskey plants. The
Partnership also acquired certain natural gas gathering and
processing systems, processing plants and related assets
including the Sand Hills processing plant and gathering system,
Monahans gathering system, Puckett gathering system, a 40%
ownership interest in the West Seminole gathering system and a
compressor overhaul facility. These assets, together with the
business conducted thereby, are collectively referred to as the
“Permian Business.”
|
|
|
|
| |
•
|
In August 2010, the Partnership acquired a 63% ownership
interest in Versado Gas Processors, L.L.C., which conducts a
natural gas gathering and processing business in New Mexico
consisting of the business and operations involving the Eunice,
Monument and Saunders gathering and processing systems,
processing plants and related assets. These assets, together
with the business conducted thereby, are collectively referred
to as “Versado.”
|
| |
| |
•
|
In September 2010, the Partnership acquired from us our 77%
ownership interest in VESCO, a joint venture in which Enterprise
Gas Processing, LLC and ONEOK VESCO Holdings, L.L.C. own the
remaining ownership interests. VESCO owns and operates a natural
gas gathering and processing business in Louisiana consisting of
a coastal straddle plant and the business and operations of
Venice Gathering System, L.L.C., a wholly owned subsidiary of
VESCO that owns and operates an offshore gathering system and
related assets (collectively, “VESCO”).
|
In March 2011, the Partnership acquired a refined petroleum
products and crude oil storage and terminaling facility in
Channelview, TX (the “Terminal”). Located on
Carpenter’s Bayou along the Houston Ship Channel, the
Terminal can handle multiple grades of blend stocks, products
and crude. The approximately $30 million purchase price was
paid entirely with cash funded through borrowings under the
Partnership’s senior secured revolving credit facility. The
Partnership expects that the transaction will be immediately
accretive to its unitholders and is complementary to its
existing terminal asset base and business along the Gulf Coast.
The Terminal has approximately 544,000 barrels of storage
capacity and contains blending and heating capabilities, tanker
truck and barge loading and unloading infrastructure. Currently,
the capacity is 100% leased to customers that include a
multi-national oil company and regional refineries. This
acquisition enables the Partnership to apply its current
terminaling expertise to an expanded product slate on a long
term fee basis and enhances the Partnership’s cash flow mix
and geographical footprint. The Partnership expects to invest
incremental growth capital in the near future to expand the
capacity of the Terminal.
In addition, the Partnership has successfully completed both
large and small organic growth projects associated with its
existing assets and expects to continue to do so in the future.
These projects, some of which occurred before the Partnership
acquired its various businesses from us, have involved growth
capital expenditures of approximately $313 million since
2005 and include:
|
|
|
| |
•
|
Low sulfur natural gasoline project: In July
2007, the Partnership completed construction of a natural
gasoline hydrotreater (the “LSNG Facility”) at Mont
Belvieu, Texas that removes sulfur from natural gasoline,
allowing customers to meet new, more stringent environmental
standards. The facility has a capacity of 30 MBbls/d and is
supported by fee-based contracts with Marathon Petroleum Company
LLC and Koch Supply and Trading LP that have certain guaranteed
volume commitments or provisions for deficiency payments. The
Partnership made capital expenditures of $39.5 million to
convert idle equipment at Mont Belvieu into the LSNG Facility.
|
| |
| |
•
|
Operations Improvement and Efficiency
Enhancement: The Partnership has historically
focused on ways to improve margins and reduce operating expenses
by improving its operations. Examples include energy saving
initiatives such as building cogeneration capacity to
self-generate electricity for the Partnership’s facilities
at Mont Belvieu, installing electric compression in North Texas
and Versado to reduce fuel costs, emissions and operating costs,
and bringing compression overhaul in-house to improve quality,
turnaround time and costs.
|
94
|
|
|
| |
•
|
Opportunistic Commercial Development
Activities: The Partnership has used the
extensive footprint of its asset base to identify and pursue
projects that generate strong returns on invested capital.
Examples include installing a new interconnect pipeline to the
Kinder Morgan Rancho line at SAOU, developing the Winona
wholesale propane terminal in Arizona, restarting the Easton
Storage Facility at LOU and installing additional equipment to
increase ethane recoveries at the Partnership’s Lowry
straddle plant.
|
| |
| |
•
|
Other Enhancements: The Partnership also has
completed a number of smaller acquisitions and projects that
have enhanced its existing asset base and that can provide
attractive investment returns. Examples include the purchase of
existing pipelines that expand beyond its existing asset base,
installation of pipeline interconnects to its gathering systems
and consolidation of interests in joint ventures.
|
The Partnership believes these projects have been successful in
terms of return on investment. Because the Partnership’s
assets are not easily duplicated and are located in active
producing areas and near key NGL markets and logistics centers,
we expect that the Partnership will continue to focus on
attractive investment opportunities associated with its existing
asset base.
Partnership
Growth Drivers
We believe the Partnership’s near-term growth will be
driven both by significant recently completed or pending
projects as well as strong supply and demand fundamentals for
its existing businesses. Over the longer-term, we expect the
Partnership’s growth will be driven by natural gas shale
opportunities, which could lead to growth in both the
Partnership’s Gathering and Processing division and
Downstream Business, organic growth projects and potential
strategic and other acquisitions related to its existing
businesses.
Organic growth projects. We expect the
Partnership’s near-term growth to be driven by a number of
significant projects scheduled for completion in 2011 that are
supported by long-term, fee-based contracts. We believe that
organic growth projects, such as the ones listed below, often
generate higher returns on investment than those available from
third party acquisitions. Organic projects in process include:
Expansion
Program at Mont Belvieu
|
|
|
| |
•
|
Cedar Bayou Fractionator expansion
project: The Partnership is currently starting up
the approximately 78 MBbl/d of additional fractionation
capacity at the Partnership’s 88% owned CBF in Mont
Belvieu. The capital cost is expected to be less than the
original estimated gross cost of $78 million. The
fractionation expansion is expected to be in service in the
second quarter of 2011. This expansion is supported with
10 year fee-based contracts with ONEOK Hydrocarbons, L.P.,
Questar Gas Management Company and Majestic Energy Services, LLC
that have certain guaranteed volume commitments or provisions
for deficiency payments.
|
| |
| |
•
|
Benzene treating project: A new treater is
under construction which will operate in conjunction with the
Partnership’s existing LSNG facility at Mont Belvieu and is
designed to reduce benzene content of natural gasoline to meet
new, more stringent environmental standards. The treater has an
estimated gross cost of approximately $33 million and is
expected to be completed and operating by the end of the year.
The treater is anticipated to be in service in the fourth
quarter of 2011 and is supported by a fee-based contract with
Marathon Petroleum Company LLC that has certain guaranteed
volume commitments or provisions for deficiency payments.
|
| |
| |
•
|
Gulf Coast Fractionators expansion
project: The Partnership has announced plans by
Gulf Coast Fractionators, a partnership with ConocoPhillips and
Devon Energy Corporation in which the Partnership owns a 38.8%
interest, to expand the capacity of its NGL fractionation
facility in Mont Belvieu by 43 MBbl/d for an estimated
gross cost of $75 million (our net cost is estimated to be
approximately $29 million). ConocoPhillips, as the
operator, will manage the expansion project.
|
95
|
|
|
| |
|
The expansion is expected to be operational during the second
quarter of 2012, subject to regulatory approvals.
|
SAOU Expansion
Program.
|
|
|
| |
•
|
The Partnership has announced a $30 million capital
expenditure program to expand gathering and processing
capability over the next 18 months in response to strong
volume growth and new well connects associated with producer
activity in the Wolfberry play as discussed below under
“—Strong supply and demand fundamentals for the
Partnership’s existing businesses.” This growth
investment program includes new compression facilities and
pipelines as well as expenditures to restart the
25 MMcf/d
Conger processing plant. The Partnership expects the Conger
plant to restart in April 2011. Additionally, two
15 MMcf/d processing trains from the Garden City plant are
being refurbished for future use at another SAOU location.
|
North Texas
Expansion Program.
|
|
|
| |
•
|
The board of directors of the General Partner has approved
approximately $40 million of capital expenditures to expand
the gathering and processing capability of the
Partnership’s North Texas System with certain provisions of
the approved expenditures subject to finalization of ongoing
customer commercial agreements. The expansion program is a
response to strong volume growth and new well connects
associated with producer activity in “oilier” portions
of the Barnett Shale natural gas play, especially in portions of
Southern Montague and Northern Wise County as discussed below
under “—Strong supply and demand fundamentals for the
Partnership’s existing businesses.” The scope of the
full expansion includes a major pipeline to increase residue
takeaway capacity, gathering system expansions, compression
equipment and other work. Certain pieces of the expansion are
underway. If commercial agreements were to be consummated in the
first half of 2011, we would expect most capital investment to
be completed by early 2012. Management expects that additional
investment will be required to keep pace with producer activity.
|
Additionally, the Partnership is actively pursuing other
gathering and processing expansion opportunities, especially for
the North Texas System, SAOU and the Sand Hills facilities. In
the Downstream Business, the Partnership submitted a standard
air permit application for a second CBF expansion of
approximately 100 MBbl/d. Having recently passed the
45 day waiting period without regulator objection, the
Partnership expects the permit registration to be received in
April. With the passage of the waiting period, the Partnership
has regulatory authority to proceed with the project, which it
expects to do pending execution of precedent anchor commercial
commitments. Furthermore, international interest in additional
propane
and/or
butane exports has increased utilization of the
Partnership’s existing export facilities and offers
prospects for a longer term potential expansion of our Galena
Park export facilities backed by precedent contracts. Finally,
the Partnership’s recently added petroleum products and
crude storage and terminaling team closed its first acquisition
in March, is pursuing organic expansion for that acquisition and
is actively pursuing other refined products and crude storage
and terminaling acquisition opportunities.
Strong supply and demand fundamentals for the
Partnership’s existing businesses. We
believe that the current strength of oil, condensate and NGL
prices and of forecast prices for these energy commodities has
caused producers in and around the Partnership’s natural
gas gathering and processing areas of operation to focus their
drilling programs on regions rich in these forms of
hydrocarbons. Liquids rich gas is prevalent from the Wolfberry
and Canyon Sands plays, which are accessible by SAOU, the
Wolfberry and Bone Springs plays, which are accessible by the
Sand Hills plant and gathering system, and from
“oilier” portions of the Barnett Shale natural gas
play, especially portions of Montague, Cooke, Clay and Wise
counties, which are accessible by the North Texas System. The
Wolfberry, Canyon Sands, and Bone Springs plays are oil plays
with associated gas containing high liquids content ranging from
approximately 7.0 to 9.5 gal/Mcf. By comparison, the liquids
content of the gas from the liquids rich portion of the Eagle
Ford Shale natural gas play is expected to average about 4
gal/Mcf. The Partnership has observed increased
96
drilling permits and higher rig counts in these areas and
expects these activities to result in higher inlet volumes over
the next several years.
Producer activity in areas rich in oil, condensate and NGLs is
currently generating high demand for the Partnership’s
fractionation services at the Mont Belvieu market hub. As a
result, fractionation volumes have recently increased to near
existing capacity. Until additional fractionation capacity comes
on-line in 2011, there will be limited incremental supply of
fractionation services in the area. These strong supply and
demand fundamentals have resulted in long-term,
“frac-or-pay”
contracts for existing capacity and support the construction of
new essentially fully committed fractionation capacity, such as
the Partnership’s CBF and GCF expansion projects. The
Partnership is continuing to see rates for fractionation
services increase. Existing fractionation customers are renewing
contracts at market rates that are, in most cases, substantially
higher than expiring rates for extended terms of up to ten years
and with reservation fees that are paid even if customer volumes
are not fractionated to ensure access to fractionation services.
A portion of the recent and future expected increases in cash
flow for the Partnership’s fractionation business is
related to high utilization and rollover of existing contracts
to higher rates. The higher volumes of fractionated NGLs should
also result in increased demand for other related fee-based
services provided by the Partnership’s Downstream Business.
Active drilling and production activity from liquids- rich
shale gas plays and similar crude oil resource
plays. The Partnership is actively pursuing
natural gas gathering and processing and NGL fractionation
opportunities associated with liquids-rich shale gas plays such
as portions of the Barnett Shale and the Eagle Ford Shale, and
with even richer casinghead gas opportunities from active crude
oil resource plays such as the Wolfberry (and other named
variants of Wolfcamp/Spraberry/Dean/other geologic cross-section
combinations) and the Bone Springs/Avalon Shale plays. These
shale gas and oil well resource plays all benefit from ongoing
advances in geophysical, drilling and completion technologies
first developed in shale gas plays. We believe that the
Partnership’s leadership position in the Downstream
Business, which includes fractionation services, provides the
Partnership with a competitive advantage relative to other
gathering and processing companies without these capabilities.
While we believe that the expected growth in the supply of
liquids-rich gas from these plays will likely require the
construction of (i) additional fractionation capacity,
(ii) additional pipelines to transport the NGLs to and from
major fractionation centers and (iii) additional natural
gas gathering and processing facilities, the Partnership’s
active involvement in multiple potential projects does not
guarantee that it will be involved with any such capacity
expansions.
Potential third party acquisitions related to the
Partnership’s existing businesses. While the
Partnership’s recent growth has been partially driven by
the implementation of a focused drop drown strategy, our
management team also has a record of successful third party
acquisitions. Since our formation, our strategy has included
approximately $3 billion in third-party acquisitions and
growth capital expenditures. This track record includes:
|
|
|
| |
•
|
The 2004 acquisition of SAOU and LOU from ConocoPhillips Company
for $248 million;
|
| |
| |
•
|
The 2004 acquisition of a 40% interest in Bridgeline Holdings,
LP for $101 million from the Enron Corporation bankruptcy
estate. Chevron Corporation, the other owner, exercised its
rights under the partnership agreement to purchase the 40% stake
from us for $117 million in 2005;
|
| |
| |
•
|
The 2005 acquisition of Dynegy Midstream Services, Limited
Partnership from Dynegy, Inc. for $2.4 billion;
|
| |
| |
•
|
The 2008 acquisition of Chevron Corporation’s 53.9%
interest in VESCO; and
|
| |
| |
•
|
The 2011 acquisition of the Channelview petroleum products and
crude oil storage and terminaling facility.
|
We expect that third-party acquisitions will continue to be a
significant focus of the Partnership’s growth strategy.
97
Competitive
Strengths and Strategies
We believe the Partnership is well positioned to execute its
business strategies due to the following competitive strengths:
|
|
|
| |
•
|
Leading Fractionation Position. The
Partnership is one of the largest fractionators of NGLs in the
Gulf Coast. Its primary fractionation assets are located in Mont
Belvieu, Texas and Lake Charles, Louisiana, which are key market
centers for NGLs and are located at the intersection of NGL
infrastructure including mixed NGL supply pipelines, storage,
takeaway pipelines and other transportation infrastructure. The
Partnership’s assets are also located near and connected to
key consumers of NGL products including the petrochemical and
industrial markets. The location and interconnectivity of the
assets are not easily replicated, and the Partnership has
sufficient additional capability to expand their capacity. Our
management has extensive experience in operating these assets
and in permitting and building new midstream assets.
|
| |
| |
•
|
Strategically located gathering and processing asset
base. The Partnership’s gathering and processing
businesses are predominantly located in active and growth
oriented oil and gas producing basins. Activity in the Canyon
Sands, Bone Springs, Wolfberry and Barnett Shale plays is driven
by the economics of current favorable oil, condensate and NGL
prices and the high condensate and NGL content of the natural
gas or associated natural gas streams. Increased drilling and
production activities in these areas would likely increase the
volumes of natural gas available to the Partnership’s
gathering and processing systems.
|
| |
| |
•
|
Comprehensive package of midstream
services. The Partnership provides a
comprehensive package of services to natural gas producers,
including gathering, compressing, treating, processing and
selling natural gas and storing, fractionating, treating,
transporting and selling NGLs and NGL products. These services
are essential to gather, process and treat wellhead gas to meet
pipeline standards and to extract NGLs for sale into
petrochemical, industrial and commercial markets. We believe the
Partnership’s ability to provide these integrated services
provides an advantage in competing for new supplies of natural
gas because the Partnership can provide substantially all of the
services producers, marketers and others require for moving
natural gas and NGLs from wellhead to market on a cost-effective
basis. Additionally, due to the high cost of replicating assets
in key strategic positions, the difficulty of permitting and
constructing new midstream assets and the difficulty of
developing the expertise necessary to operate them, the barriers
to enter the midstream natural gas sector on a scale similar to
the Partnership’s are reasonably high.
|
| |
| |
•
|
Large, diverse business mix with favorable
contracts. The Partnership maintains gathering
and processing positions in strategic oil and gas producing
areas across multiple oil and gas basins and provides services
under attractive contract terms to a diverse mix of customers
across its areas of operations. Consequently, the Partnership is
not dependent on any one oil and gas basin or customer. The
gathering and processing contract portfolio has attractive rate
and term characteristics. The Partnership’s Logistics and
Marketing assets are typically located near key market hubs and
near important NGL customers. They also serve must-run portions
of the natural gas value chain, are primarily fee-based, and
have a diverse mix of customers. The logistics contract
portfolio, largely fee-based, has attractive rate and term
characteristics. Given the higher rates for logistics assets
contracts that are being renewed (largely based on replacement
cost economics), the new projects underway, the long-term nature
of many of the renewed and new contracts, and continuing strong
supply and demand fundamentals for this business, we expect an
increasing percentage of the Partnership’s cash flows to be
fee-based.
|
| |
| |
•
|
High quality and efficient assets. The
Partnership’s gathering and processing systems and
logistics assets consist of high-quality, well maintained
facilities, resulting in low cost, efficient operations.
Advanced technologies have been implemented for processing
plants (primarily cryogenic units utilizing centralized control
systems), measurement (essentially all electronic and
electronically linked to a central data base) and operations and
maintenance to manage work
|
98
|
|
|
| |
|
orders and implement preventative maintenance schedules
(computerized maintenance management systems). These
applications have allowed proactive management of the
Partnership’s operations resulting in lower costs and
minimal downtime. The Partnership has established a reputation
in the midstream industry as a reliable and cost-effective
supplier of services to its customers and has a track record of
safe and efficient operation of its facilities. The Partnership
intends to continue to pursue new contracts, cost efficiencies
and operating improvements of its assets. Such improvements in
the past have included new production and acreage commitments,
reducing fuel gas and flare volumes and improving facility
capacity and NGL recoveries. The Partnership will also continue
to optimize existing plant assets to improve and maximize
capacity and throughput.
|
|
|
|
| |
•
|
Financial Flexibility. The Partnership has
historically maintained strong financial metrics relative to its
peer group, with leverage and distribution coverage ratios
consistently above the peer group median. The Partnership also
reduces the impact of commodity price volatility by hedging the
commodity price risk associated with a portion of its expected
natural gas, NGL and condensate equity volumes. Maintaining
appropriate leverage and distribution coverage levels and
mitigating commodity price volatility allow the Partnership to
be flexible in its growth strategy and enable it to pursue
strategic acquisitions and large growth projects.
|
| |
| |
•
|
Experienced and long-term focused management
team. The executive management team that formed
TRI in 2004 and continues to manage Targa today possesses over
200 years of combined experience working in the midstream
natural gas and energy business. Additionally, other officers
and key operational, commercial and financial employees provide
depth of experience in the industry and with our assets and
businesses.
|
Attractive
Partnership Cash Flow Characteristics
We believe that the Partnership’s strategy, combined with
its high-quality asset portfolio and strong industry
fundamentals, allows the Partnership to generate attractive cash
flows. Geographic, business and customer diversity enhances the
Partnership’s cash flow profile. The Partnership’s
Natural Gas Gathering and Processing division has a favorable
contract mix that is primarily
percent-of-proceeds
or hybrid which, along with its long-term commodity hedging
program, serves to mitigate the impact of commodity price
movements on cash flow. In the Partnership’s Logistics and
Marketing division, the majority of its revenues are derived
under fee-based contracts.
The Partnership has hedged the commodity price risk associated
with a portion of its expected natural gas, NGL and condensate
equity volumes through 2014 by entering into financially settled
derivative transactions including swaps and purchased puts (or
floors). The primary purpose of its commodity risk management
activities is to hedge the Partnership’s exposure to price
risk and to mitigate the impact of fluctuations in commodity
prices on cash flow. The Partnership has intentionally tailored
its hedges to approximate specific NGL products and to
approximate its actual NGL and residue natural gas delivery
points. The Partnership intends to continue to manage its
exposure to commodity prices in the future by entering into
similar hedge transactions as market conditions permit.
The Partnership also monitors its inventory levels with a view
of mitigating losses related to downward price exposure.
The Partnership’s annual maintenance capital expenditures
have averaged approximately $54.0 million per year over the
last three years. We believe that the Partnership’s assets
are well maintained and anticipate that a similar level of
capital expenditures will be sufficient for it to continue to
operate these assets in a prudent and cost-effective manner.
Asset Base
Well-Positioned for Organic Growth
We believe that the Partnership’s asset platform and
strategic locations allow it to maintain and potentially grow
its volumes and related cash flows as its supply areas continue
to benefit from exploration
99
and development. Generally, higher oil and gas prices result in
increased domestic oil and gas drilling and workover activity to
increase production. The location of the Partnership’s
assets provides it with access to stable natural gas supplies
and proximity to end-use markets and liquid market hubs while
positioning it to capitalize on drilling and production activity
in those areas. The Partnership’s existing infrastructure
has the capacity to handle incremental increases in volumes
without significant capital investments. We believe that as
domestic demand for natural gas and NGL grows over the long
term, the Partnership’s infrastructure will increase in
value, as such infrastructure takes on increasing importance in
meeting that demand.
While we have set forth the Partnership’s strategies and
competitive strengths above, its business involves numerous
risks and uncertainties which may prevent the Partnership from
executing its strategies or impact the amount of distributions
to its unitholders. These risks include the adverse impact of
changes in natural gas, NGL and condensate prices, its inability
to access sufficient additional production to replace natural
declines in production and the Partnership’s dependence on
a single natural gas producer for a significant portion of its
natural gas supply. For a more complete description of the risks
to which we and the Partnership are subject, see “Risk
Factors.”
We have used the Partnership as a growth vehicle to pursue the
acquisition and expansion of midstream natural gas, NGL and
other complementary energy businesses and assets as evidenced by
its acquisition of businesses from us. However, we are not
prohibited from competing with the Partnership and routinely
evaluate acquisitions that do not involve the Partnership. In
addition, through its relationship with us, the Partnership has
access to a significant pool of management talent, strong
commercial relationships throughout the energy industry and
access to our broad operational, commercial, technical, risk
management, and administrative functions.
As of April 12, 2011, we and our directors and executive
officers have a significant interest in the Partnership through
our combined 13.9% limited partner interest and our 2% general
partnership interest in the Partnership. In addition, we own
incentive distribution rights that entitle us to receive an
increasing percentage of quarterly distributions of the
Partnership’s available cash from its operating surplus
after the minimum quarterly distribution and the target
distribution levels have been achieved. We are party to an
Omnibus Agreement with the Partnership that governs our
relationship regarding certain reimbursement and indemnification
matters. See “Certain Relationships and Related
Transactions—Omnibus Agreement.” We employ
approximately 1,020 people who support primarily the
Partnership’s operations. See “—Employees.”
We allocate the cost of these employees to the Partnership in
accordance with the Omnibus Agreement. Following the conveyance
of all of our remaining operating assets to the Partnership in
September 2010, substantially all of our general and
administrative costs have been and will continue to be allocated
to the Partnership, other than our direct costs of being a
separate public reporting company.
The
Partnership’s Challenges
The Partnership faces a number of challenges in implementing its
business strategy. For example:
|
|
|
| |
•
|
The Partnership has a substantial amount of indebtedness which
may adversely affect its financial position.
|
| |
| |
•
|
The Partnership’s cash flow is affected by supply and
demand for oil, natural gas and NGL products and by natural gas
and NGL prices, and decreases in these prices could adversely
affect its results of operations and financial condition.
|
| |
| |
•
|
The Partnership’s long-term success depends on its ability
to obtain new sources of supplies of natural gas and NGLs, which
depends on certain factors beyond its control. Any decrease in
supplies of natural gas or NGLs could adversely affect the
Partnership’s business and operating results.
|
| |
| |
•
|
If the Partnership does not make investments in new assets or
acquisitions on economically acceptable terms or efficiently and
effectively integrate new assets, its results of operations and
financial condition could be adversely affected.
|
100
|
|
|
| |
•
|
The Partnership is subject to regulatory, environmental,
political, legal and economic risks, which could adversely
affect its results of operations and financial condition.
|
| |
| |
•
|
The Partnership’s growth strategy requires access to new
capital. Tightened capital markets or increased competition for
investment opportunities could impair its ability to grow.
|
| |
| |
•
|
The Partnership’s hedging activities may not be effective
in reducing the variability of its cash flows and may, in
certain circumstances, increase the variability of its cash
flows.
|
| |
| |
•
|
The Partnership’s industry is highly competitive, and
increased competitive pressure could adversely affect the
Partnership’s business and operating results.
|
For a further discussion of these and other challenges we and
the Partnership face, please read “Risk Factors.”
Business
Operations
The operations of the Partnership are reported in two divisions:
(i) Natural Gas Gathering and Processing, consisting of two
segments—(a) Field Gathering and Processing and
(b) Coastal Gathering and Processing; and
(ii) Logistics and Marketing, consisting of two
segments—(a) Logistics Assets and (b) Marketing and
Distribution.
Natural Gas
Gathering and Processing Division
The Partnership’s Natural Gas Gathering and Processing
division consists of gathering, compressing, dehydrating,
treating, conditioning, processing, transporting and marketing
natural gas. The gathering of natural gas consists of
aggregating natural gas produced from various wells through
small diameter gathering lines to processing plants. Natural gas
has a widely varying composition, depending on the field, the
formation and the reservoir from which it is produced. The
processing of natural gas consists of the extraction of imbedded
NGLs and the removal of water vapor and other contaminants to
form (i) a stream of marketable natural gas, commonly
referred to as residue gas, and (ii) a stream of mixed
NGLs, commonly referred to as “Mixed NGLs” or
“Y-grade.” Once processed, the residue gas is
transported to markets through pipelines that are either owned
by the gatherers or processors or third parties. End-users of
residue gas include large commercial and industrial customers,
as well as natural gas and electric utilities serving individual
consumers. The Partnership sells its residue gas either directly
to such end-users or to marketers into intrastate or interstate
pipelines, which are typically located in close proximity or
with ready access to its facilities.
The Partnership continually seeks new supplies of natural gas,
both to offset the natural declines in production from connected
wells and to increase throughput volumes. The Partnership
obtains additional natural gas supply in its operating areas by
contracting for production from new wells or by capturing
existing production currently gathered by others. Competition
for new natural gas supplies is based primarily on location of
assets, commercial terms, service levels and access to markets.
The commercial terms of natural gas gathering and processing
arrangements are driven, in part, by capital costs, which are
impacted by the proximity of systems to the supply source and by
operating costs, which are impacted by operational efficiencies,
facility design and economies of scale.
We believe the Partnership’s extensive asset base and scope
of operations in the regions in which the Partnership operates
provide the Partnership with significant opportunities to add
both new and existing natural gas production to its systems. We
believe the Partnership’s size and scope gives the
Partnership a strong competitive position by placing it in close
proximity to a large number of existing and new natural gas
producing wells in its areas of operations, allowing the
Partnership to generate economies of scale and to provide its
customers with access to its existing facilities and to multiple
end-use markets and market hubs. Additionally, we believe the
Partnership’s ability to serve its customers’ needs
across the natural gas and NGL value chain further augments the
Partnership’s ability to attract new customers.
101
Field Gathering
and Processing Segment
The Field Gathering and Processing segment gathers and processes
natural gas from the Permian Basin in West Texas and Southeast
New Mexico and the Fort Worth Basin, including the Barnett
Shale, in North Texas. The natural gas processed in this segment
is supplied through its gathering systems which, in aggregate,
consist of approximately 10,100 miles of natural gas
pipelines. The segment’s processing plants include nine
owned and operated facilities. For the year ended
December 31, 2010, the Partnership processed an average of
approximately
588 MMcf/d
of natural gas and produced an average of approximately
71 MBbl/d of NGLs.
We believe the Partnership is well positioned as a gatherer and
processor in the Permian and Fort Worth Basins. The
Partnership has broad geographic scope, covering portions of 40
counties and approximately 18,100 square miles across these
basins. We believe proximity to production and development
provides the Partnership with a competitive advantage in
capturing new supplies of natural gas because of the
Partnership’s competitive costs to connect new wells and to
process additional natural gas in its existing processing
plants. Additionally, because the Partnership operates all of
its plants in these regions, the Partnership is often able to
redirect natural gas among two or more of its processing plants,
allowing it to optimize processing efficiency and further
improve the profitability of its operations.
The Field Gathering and Processing segment’s operations
consist of the Permian Business, Versado, SAOU and the North
Texas System, each as described below.
Permian Business. The Permian Business
consists of the Sand Hills gathering and processing system and
the West Seminole and Puckett gathering systems. These systems
consist of approximately 1,300 miles of natural gas
gathering pipelines. These gathering systems are low-pressure
gathering systems with significant compression assets. The Sand
Hills refrigerated cryogenic processing plant has a gross
processing capacity of
150 MMcf/d
and residue gas connections to pipelines owned by affiliates of
Enterprise Products Partners L.P. (“Enterprise”),
ONEOK, Inc. (“ONEOK”) and El Paso Corporation
(“El Paso”).
Versado. Versado consists of the
Saunders, Eunice and Monument gas processing plants and related
gathering systems in Southeastern New Mexico. The gathering
systems consist of approximately 3,200 miles of natural gas
gathering pipelines. The Saunders, Eunice and Monument
refrigerated cryogenic processing plants have aggregate
processing capacity of
280 MMcf/d
(176 MMcf/d,
net to the Partnership’s ownership interest). These plants
have residue gas connections to pipelines owned by affiliates of
El Paso, MidAmerican Energy Company and Kinder Morgan
Energy Partners, L.P. (“Kinder Morgan”). The
Partnership’s ownership in the Versado System is held
through Versado Gas Processors, L.L.C., a joint venture that is
63% owned by the Partnership and 37% owned by Chevron U.S.A. Inc.
SAOU. Covering portions of 10 counties
and approximately 4,000 square miles in West Texas, SAOU
includes approximately 1,500 miles of pipelines in the
Permian Basin that gather natural gas to the Mertzon and
Sterling processing plants. SAOU is connected to numerous
producing wells and central delivery points. SAOU has
approximately 1,000 miles of low-pressure gathering systems
and approximately 500 miles of high-pressure gathering
pipelines to deliver the natural gas to the Partnership’s
processing plants. The gathering system has numerous compressor
stations to inject low-pressure gas into the high-pressure
pipelines. SAOU’s processing facilities include two
currently operating refrigerated cryogenic processing
plants—the Mertzon plant and the Sterling plant—which
have an aggregate processing capacity of approximately
110 MMcf/d.
The system also includes the Conger cryogenic plant with a
capacity of approximately
25 MMcf/d.
The Partnership is in the process of restarting the Conger plant
and anticipates completion by April 2011 and for it to provide
for rapidly increasing volumes in SAOU. Additionally, two
15 MMcf/d
processing trains from the Garden City plant are being
refurbished for future use at another SAOU location.
North Texas System. The North Texas
System includes two interconnected gathering systems with
approximately 4,100 miles of pipelines, covering portions
of 12 counties and approximately
102
5,700 square miles, gathering wellhead natural gas for the
Chico and Shackelford natural gas processing facilities.
The Chico Gathering System consists of approximately
2,000 miles of primarily low-pressure gathering pipelines.
Wellhead natural gas is either gathered for the Chico plant
located in Wise County, Texas, and then compressed for
processing, or it is compressed in the field at numerous
compressor stations and then moved via one of several
high-pressure gathering pipelines to the Chico plant. The
Shackelford Gathering System consists of approximately
2,100 miles of intermediate-pressure gathering pipelines
which gather wellhead natural gas largely for the Shackelford
plant in Albany, Texas. Natural gas gathered from the northern
and eastern portions of the Shackelford Gathering System is
typically compressed in the field at numerous compressor
stations and then transported to the Chico plant for processing.
The following table lists the Field Gathering and Processing
segment’s natural gas processing plants and related volumes
for the year ended December 31, 2010:
| |
|
|
|
|
|
|
|
|
|
|
|
|
|
|
|
|
|
|
|
|
|
|
|
|
|
|
|
|
|
|
|
|
|
Gross Plant
|
|
|
|
|
|
|
|
|
|
|
|
|
|
|
|
Natural Gas
|
|
|
|
|
|
|
|
|
|
|
|
|
|
Gross
|
|
Inlet
|
|
|
|
|
|
|
|
|
|
|
|
|
|
Processing
|
|
Throughput
|
|
Gross NGL
|
|
|
|
Operated/
|
|
|
|
%
|
|
|
|
Capacity
|
|
Volume
|
|
Production
|
|
Process
|
|
Non-
|
|
Facility
|
|
Owned
|
|
Location
|
|
(MMcf/d)
|
|
(MMcf/d)
|
|
(MBbl/d)
|
|
Type(5)
|
|
operated
|
|
|
|
Permian Business
|
|
|
|
|
|
|
|
|
|
|
|
|
|
|
|
|
|
|
|
|
|
|
|
|
|
Sand Hills
|
|
|
100.0
|
|
|
Crane, TX
|
|
|
150.0
|
|
|
|
116.5
|
|
|
|
14.4
|
|
|
Cryo
|
|
|
Operated
|
|
|
Other
Permian(1)
|
|
|
|
|
|
|
|
|
|
|
|
|
12.3
|
|
|
|
0.4
|
|
|
|
|
|
|
|
|
|
|
|
|
|
|
|
|
|
|
|
|
|
|
|
|
|
|
|
|
|
|
|
|
|
|
|
|
|
|
|
|
|
|
|
|
|
|
|
|
|
|
|
|
|
|
|
|
|
|
|
|
Versado
|
|
|
|
|
|
|
|
|
|
|
|
|
|
|
|
|
|
|
|
|
|
|
|
|
|
Saunders(2)
|
|
|
63.0
|
|
|
Lea, NM
|
|
|
70.0
|
|
|
|
|
|
|
|
|
|
|
Cryo
|
|
|
Operated
|
|
|
Eunice(2)
|
|
|
63.0
|
|
|
Lea, NM
|
|
|
120.0
|
|
|
|
|
|
|
|
|
|
|
Cryo
|
|
|
Operated
|
|
|
Monument(2)
|
|
|
63.0
|
|
|
Lea, NM
|
|
|
90.0
|
|
|
|
|
|
|
|
|
|
|
Cryo
|
|
|
Operated
|
|
|
|
|
|
|
|
|
|
|
|
|
|
|
|
|
|
|
|
|
|
|
|
|
|
|
|
|
|
|
|
|
|
|
Area Total
|
|
|
280.0
|
|
|
|
178.7
|
|
|
|
20.4
|
|
|
|
|
|
|
|
|
|
|
|
|
|
|
|
|
|
|
|
|
|
|
|
|
|
|
|
|
|
|
|
|
|
|
SAOU
|
|
|
|
|
|
|
|
|
|
|
|
|
|
|
|
|
|
|
|
|
|
|
|
|
|
Mertzon
|
|
|
100.0
|
|
|
Irion, TX
|
|
|
48.0
|
|
|
|
|
|
|
|
|
|
|
Cryo
|
|
|
Operated
|
|
|
Sterling
|
|
|
100.0
|
|
|
Sterling, TX
|
|
|
62.0
|
|
|
|
|
|
|
|
|
|
|
Cryo
|
|
|
Operated
|
|
|
Conger(3)
|
|
|
100.0
|
|
|
Sterling, TX
|
|
|
25.0
|
|
|
|
|
|
|
|
|
|
|
Cryo
|
|
|
Operated
|
|
|
|
|
|
|
|
|
|
|
|
|
|
|
|
|
|
|
|
|
|
|
|
|
|
|
|
|
|
|
|
|
|
|
Area Total
|
|
|
135.0
|
|
|
|
99.8
|
|
|
|
20.7
|
|
|
|
|
|
|
|
|
|
|
|
|
|
|
|
|
|
|
|
|
|
|
|
|
|
|
|
|
|
|
|
|
|
|
North Texas System
|
|
|
|
|
|
|
|
|
|
|
|
|
|
|
|
|
|
|
|
|
|
|
|
|
|
Chico(4)
|
|
|
100.0
|
|
|
Wise, TX
|
|
|
265.0
|
|
|
|
|
|
|
|
|
|
|
Cryo
|
|
|
Operated
|
|
|
Shackelford
|
|
|
100.0
|
|
|
Shackelford, TX
|
|
|
13.0
|
|
|
|
|
|
|
|
|
|
|
Cryo
|
|
|
Operated
|
|
|
|
|
|
|
|
|
|
|
|
|
|
|
|
|
|
|
|
|
|
|
|
|
|
|
|
|
|
|
|
|
|
|
Area Total
|
|
|
278.0
|
|
|
|
180.4
|
|
|
|
15.3
|
|
|
|
|
|
|
|
|
|
|
|
|
|
|
|
|
|
|
|
|
|
|
|
|
|
|
|
|
|
|
|
|
|
|
|
|
Segment System Total
|
|
|
843.0
|
|
|
|
587.7
|
|
|
|
71.2
|
|
|
|
|
|
|
|
|
|
|
|
|
|
|
|
|
|
|
|
|
|
|
|
|
|
|
|
|
|
|
|
|
|
(1) |
|
Other Permian includes throughput
other than plant inlet, primarily from compressor stations.
|
| |
|
(2) |
|
These plants are part of the
Partnership’s Versado joint venture, of which the
Partnership owns a 63.0% ownership interest, and volumes
represent a 100% ownership interest.
|
| |
|
(3) |
|
The Partnership is in the process
of restarting the Conger plant, which we anticipate occurring in
early 2011, to provide for rapidly increasing volumes in SAOU.
|
| |
|
(4) |
|
The Chico plant has fractionation
capacity of approximately 15 MBbl/d.
|
| |
|
(5) |
|
Cryo—Cryogenic Processing.
|
Coastal Gathering
and Processing Segment
The Partnership’s Coastal Gathering and Processing segment
assets are located in the onshore region of the Louisiana Gulf
Coast and the Gulf of Mexico. With the strategic location of its
assets in Louisiana, the Partnership has access to the Henry
Hub, the largest natural gas hub in the U.S., to many major gas
markets across the U.S. through the mainline interstate pipeline
network and to a substantial NGL distribution system with access
to markets throughout Louisiana and the southeast U.S. The
Coastal
103
Gathering and Processing segment’s assets consist of the
Coastal Straddles and LOU, each as described below. For the year
ended December 31, 2010, the Partnership processed an
average of approximately
1,680 MMcf/d
of plant natural gas inlet and produced an average of
approximately 50 MBbl/d of NGLs.
Coastal Straddles. Coastal Straddles
includes three wholly owned and operated gas processing
plants — Stingray, Barracuda and Lowry. Coastal
Straddles also includes six operating partially-owned plants
(one of which is operated by the Partnership) and the VESCO
joint venture, which is operated by the Partnership. Coastal
Straddles processes natural gas produced primarily from the
central and western Gulf of Mexico, from both shelf and
deepwater Gulf of Mexico production via connections to third
party pipelines or through pipelines owned by the Partnership.
Coastal Straddles has access to markets across the
U.S. through the interstate natural gas pipelines to which
it is interconnected. Coastal Straddles also includes the
Pelican and Seahawk pipeline systems, which are non-FERC
regulated gathering systems operated by the Partnership that
have a combined length of approximately 175 miles and a
combined capacity of approximately
230 MMcf/d.
These systems gather natural gas from the shallow waters of the
central Gulf of Mexico and supply a portion of the natural gas
delivered to the Barracuda and Lowry processing facilities.
The Partnership owns a 77% interest in VESCO, a natural gas
gathering and processing business, which includes our largest
coastal straddle facility in terms of natural gas throughput and
gross NGL production. The Partnership, through its interest in
VESCO, also operates the Venice Gathering System
(“VGS”), an offshore gathering system regulated as an
interstate pipeline by FERC. VGS is approximately 150 miles
in length and has a nominal capacity of
575 MMcf/d.
VGS gathers natural gas from the shallow waters of the Gulf of
Mexico and supplies a portion of the natural gas to the Venice
gas plant.
LOU. LOU consists of approximately
850 miles of gathering system pipelines, covering
approximately 3,800 square miles in Southwest Louisiana.
The gathering system is connected to numerous producing wells
and/or
central delivery points in the area between Lafayette and Lake
Charles, Louisiana. The gathering system is a high-pressure
gathering system that delivers natural gas for processing to
either the Acadia or Gillis plants via three main trunk lines.
The processing facilities include the Gillis and Acadia
processing plants, both of which are cryogenic plants. These
processing plants have an aggregate processing capacity of
approximately
260 MMcf/d.
In addition, the Gillis plant has integrated fractionation with
operating capacity of approximately 13 MBbl/d.
104
The following table lists the Coastal Gathering and Processing
segment’s natural gas processing plants for the year ended
December 31, 2010:
| |
|
|
|
|
|
|
|
|
|
|
|
|
|
|
|
|
|
|
|
|
|
|
|
|
|
|
|
|
|
|
|
|
|
|
|
Gross Plant
|
|
|
|
|
|
|
|
|
|
|
|
|
|
|
|
|
|
Approximate
|
|
|
Natural Gas
|
|
|
|
|
|
|
|
|
|
|
|
|
|
|
|
|
|
Gross
|
|
|
Inlet
|
|
|
|
|
|
|
|
|
|
|
|
|
|
|
|
|
|
Processing
|
|
|
Throughput
|
|
|
Gross NGL
|
|
|
|
|
Operated/
|
|
|
|
|
|
|
|
|
|
Capacity
|
|
|
Volume
|
|
|
Production
|
|
|
Process
|
|
Non-
|
|
|
Facility
|
|
% Owned
|
|
|
Location
|
|
(MMcf/d)
|
|
|
(MMcf/d)
|
|
|
(MBbl/d)
|
|
|
Type(5)
|
|
operated
|
|
|
|
|
Coastal
Straddles(1)
|
|
|
|
|
|
|
|
|
|
|
|
|
|
|
|
|
|
|
|
|
|
|
|
|
|
Barracuda
|
|
|
100.0
|
|
|
Cameron, LA
|
|
|
190
|
|
|
|
138.0
|
|
|
|
3.3
|
|
|
Cryo
|
|
|
Operated
|
|
|
Lowry
|
|
|
100.0
|
|
|
Cameron, LA
|
|
|
265
|
|
|
|
110.8
|
|
|
|
2.8
|
|
|
Cryo
|
|
|
Operated
|
|
|
Stingray
|
|
|
100.0
|
|
|
Cameron, LA
|
|
|
300
|
|
|
|
269.3
|
|
|
|
4.7
|
|
|
RA
|
|
|
Operated
|
|
|
Calumet(2)
|
|
|
32.4
|
|
|
St. Mary, LA
|
|
|
1,650
|
|
|
|
128.2
|
|
|
|
2.9
|
|
|
RA
|
|
|
Non-operated
|
|
|
Yscloskey(2)
|
|
|
25.3
|
|
|
St. Bernard, LA
|
|
|
1,850
|
|
|
|
290.3
|
|
|
|
2.1
|
|
|
RA
|
|
|
Operated
|
|
|
Bluewater(2)
|
|
|
21.8
|
|
|
Acadia, LA
|
|
|
425
|
|
|
|
—
|
|
|
|
—
|
|
|
Cryo
|
|
|
Non-operated
|
|
|
Terrebonne(2)
|
|
|
4.8
|
|
|
Terrebonne, LA
|
|
|
950
|
|
|
|
22.4
|
|
|
|
0.9
|
|
|
RA
|
|
|
Non-operated
|
|
|
Toca(2)
|
|
|
10.7
|
|
|
St. Bernard, LA
|
|
|
1,150
|
|
|
|
50.8
|
|
|
|
1.3
|
|
|
Cryo/RA
|
|
|
Non-operated
|
|
|
Iowa(3)
|
|
|
100.0
|
|
|
Jeff. Davis, LA
|
|
|
500
|
|
|
|
—
|
|
|
|
—
|
|
|
Cryo
|
|
|
Operated
|
|
|
Sea Robin
|
|
|
0.8
|
|
|
Vermillion, LA
|
|
|
700
|
|
|
|
25.4
|
|
|
|
0.6
|
|
|
Cryo
|
|
|
Non-operated
|
|
|
VESCO
|
|
|
76.8
|
|
|
Plaquemines, LA
|
|
|
750
|
|
|
|
427.3
|
|
|
|
23.2
|
|
|
Cryo
|
|
|
Operated
|
|
|
Other
|
|
|
|
|
|
|
|
|
|
|
|
|
33.2
|
|
|
|
1.1
|
|
|
|
|
|
|
|
|
|
|
|
|
|
|
|
|
|
|
|
|
|
|
|
|
|
|
|
|
|
|
|
|
|
|
|
|
|
|
|
|
Area Total
|
|
|
8,730
|
|
|
|
1,495.7
|
|
|
|
42.9
|
|
|
|
|
|
|
|
|
|
|
|
|
|
|
|
|
|
|
|
|
|
|
|
|
|
|
|
|
|
|
|
|
|
|
LOU
|
|
|
|
|
|
|
|
|
|
|
|
|
|
|
|
|
|
|
|
|
|
|
|
|
|
Gillis(4)
|
|
|
100.0
|
|
|
Calcasieu, LA
|
|
|
180
|
|
|
|
|
|
|
|
|
|
|
Cryo
|
|
|
|
|
|
Acadia
|
|
|
100.0
|
|
|
Acadia, LA
|
|
|
80
|
|
|
|
|
|
|
|
|
|
|
Cryo
|
|
|
|
|
|
|
|
|
|
|
|
Area Total
|
|
|
260
|
|
|
|
184.6
|
|
|
|
7.2
|
|
|
|
|
|
|
|
|
|
|
|
|
|
|
|
|
|
|
|
|
|
|
|
|
|
|
|
|
|
|
|
|
|
|
|
|
Consolidated System Total
|
|
|
8,990
|
|
|
|
1,680.3
|
|
|
|
50.1
|
|
|
|
|
|
|
|
|
|
|
|
|
|
|
|
|
|
|
|
|
|
|
|
|
|
|
|
|
|
|
|
|
|
(1) |
|
Coastal Straddles also includes
three offshore gathering systems which have a combined length of
approximately 325 miles.
|
| |
|
(2) |
|
Our ownership is adjustable and
subject to annual redetermination.
|
| |
|
(3) |
|
The Partnership has an option to
acquire the Iowa Plant, which is not operating, from us.
|
| |
|
(4) |
|
The Gillis plant has fractionation
capacity of approximately 13 MBbl/d.
|
| |
|
(5) |
|
Cryo—Cryogenic Processing;
RA—Refrigerated Absorption Processing.
|
Logistics and
Marketing Division
The Logistics and Marketing division is also referred to as the
Downstream Business. It includes the activities necessary to
convert mixed NGLs into NGL products, market the NGL products
and provides certain value added services such as the
fractionation, storage, terminaling, transportation,
distribution and marketing of NGLs, as well as certain natural
gas supply and marketing activities in support of the
Partnership’s other businesses. Through fractionation,
mixed NGLs are separated into its component parts (ethane,
propane, butanes and natural gasoline). These component parts
are delivered to end-users through pipelines, barges, trucks and
rail cars. End-users of component NGLs include petrochemical and
refining companies and propane markets for heating, cooking or
crop drying applications. Retail distributors often sell to
end-use propane customers.
Logistics Assets
Segment
This segment uses its platform of integrated assets to
fractionate, store, treat and transport NGLs typically under
fee-based and margin-based arrangements. For NGLs to be used by
refineries, petrochemical manufacturers, propane distributors
and other industrial end-users, they must be fractionated into
their component products and delivered to various points
throughout the U.S. The Partnership’s logistics assets
are generally connected to and supplied, in part, by its Natural
Gas Gathering
105
and Processing assets and are primarily located at Mont Belvieu
and Galena Park near Houston, Texas and in Lake Charles,
Louisiana.
Fractionation. After being extracted in
the field, mixed NGLs, sometimes referred to as
“Y-grade” or “raw NGL mix,” are typically
transported to a centralized facility for fractionation where
the mixed NGLs are separated into discrete NGL products: ethane,
propane, butanes and natural gasoline. Mixed NGLs delivered from
the Partnership’s Field and Coastal Gathering and
Processing segments represent the largest source of volumes
processed by the Partnership’s NGL fractionators.
The Partnership’s fractionation assets include ownership
interests in three stand-alone fractionation facilities that are
located on the Gulf Coast two of which it operates, one at Mont
Belvieu, Texas, and the other at Lake Charles, Louisiana. The
Partnership also has an equity investment in a third
fractionator, GCF, also located at Mont Belvieu. The Partnership
is subject to a consent decree with the Federal Trade
Commission, issued December 12, 1996, that, among other
things, prevents the Partnership from participating in
commercial decisions regarding rates paid by third parties for
fractionation services at GCF. This restriction on the
Partnerships’ activity at GCF will terminate on
December 12, 2016, twenty years after the date the consent
order was issued. In addition to the three stand-alone
facilities in the Logistics Assets segment, see the description
of fractionation assets in the North Texas System and LOU in the
Partnership’s Natural Gas Gathering and Processing division.
The majority of the Partnership’s NGL fractionation
business is under fee-based arrangements. These fees are subject
to adjustment for changes in certain fractionation expenses,
including energy costs. The operating results of the
Partnership’s NGL fractionation business are dependent upon
the volume of mixed NGLs fractionated and the level of
fractionation fees charged.
We believe that sufficient volumes of mixed NGLs will be
available for fractionation in commercially viable quantities
for the foreseeable future due to increases in NGL production
expected from shale plays in areas of the U.S. that include
North Texas, South Texas, Oklahoma and the Rockies and certain
other basins accessed by pipelines to Mont Belvieu, as well as
from continued production of NGLs in areas such as the Permian
Basin, Mid-Continent, East Texas, South Louisiana and shelf and
deepwater Gulf of Mexico. Dew point specifications implemented
by individual pipelines and the policy statement enacted by FERC
should result in volumes of mixed NGLs being available for
fractionation because natural gas requires processing or
conditioning to meet pipeline quality specifications. These
requirements establish a base volume of mixed NGLs during
periods when it might be otherwise uneconomical to process
certain sources of natural gas. Furthermore, significant volumes
of mixed NGLs are contractually committed to the
Partnership’s NGL fractionation facilities.
Although competition for NGL fractionation services is primarily
based on the fractionation fee, the ability of an NGL
fractionator to obtain mixed NGLs and distribute NGL products is
also an important competitive factor. This ability is a function
of the existence of storage infrastructure and supply and market
connectivity necessary to conduct such operations. We believe
that the location, scope and capability of the
Partnership’s logistics assets, including its
transportation and distribution systems, give the Partnership
access to both substantial sources of mixed NGLs and a large
number of end-use markets.
Treating. The Partnership also has a
natural gasoline hydrotreater at Mont Belvieu, Texas that
removes sulfur from natural gasoline, allowing customers to meet
new, more stringent environmental standards. The facility has a
capacity of 30 MBbls/d and is supported by fee-based
contracts with Marathon Petroleum Company LLC and Koch Supply
and Trading LP that have certain guaranteed volume commitments
or provisions for deficiency payments.
106
The following table details the Logistics Assets segment’s
fractionation and treating facilities:
| |
|
|
|
|
|
|
|
|
|
|
|
|
|
|
|
|
|
|
|
Gross
|
|
|
|
|
|
|
|
Throughput for
|
|
|
|
|
|
|
|
the Year Ended
|
|
|
|
|
|
Maximum Gross
|
|
December 31,
|
|
|
|
|
|
Capacity
|
|
2010
|
|
Facility
|
|
% Owned
|
|
(MBbls/d)
|
|
(MBbls/d)
|
|
|
|
Operated Facilities:
|
|
|
|
|
|
|
|
|
|
|
|
|
|
Lake Charles Fractionator (Lake Charles, LA)
|
|
|
100.0
|
|
|
|
55.0
|
|
|
|
39.1
|
|
|
Cedar Bayou Fractionator (Mont Belvieu,
TX)(1)
|
|
|
88.0
|
|
|
|
293.0
|
|
|
|
187.1
|
|
|
LSNG Hydrotreater (Mont Belvieu, TX)
|
|
|
100.0
|
|
|
|
30.0
|
|
|
|
18.0
|
|
|
Equity Fractionation Facilities (non-operated):
|
|
|
|
|
|
|
|
|
|
|
|
|
|
Gulf Coast Fractionator (Mont Belvieu, TX)
|
|
|
38.8
|
|
|
|
109.0
|
|
|
|
98.9
|
|
|
|
|
|
(1) |
|
Includes ownership through 88%
interest in Downstream Energy Ventures Co, LLC.
|
Storage and Terminaling. In general,
the Partnership’s storage assets provide warehousing of
mixed NGLs, NGL products and petrochemical products in
underground wells, which allows for the injection and withdrawal
of such products at various times in order to meet demand
cycles. Similarly, the Partnership’s terminaling operations
provide the inbound/outbound logistics and warehousing of mixed
NGLs, NGL products and petrochemical products in above-ground
storage tanks. The Partnership’s underground storage and
terminaling facilities serve single markets, such as propane, as
well as multiple products and markets. For example, the Mont
Belvieu and Galena Park facilities have extensive pipeline
connections for mixed NGL supply and delivery of component NGLs.
In addition, some of these facilities are connected to marine,
rail and truck loading and unloading facilities that provide
services and products to the Partnership’s customers. The
Partnership provides long and short-term storage and terminaling
services and throughput capability to third party customers for
a fee.
The Partnership owns
and/or
operates a total of 39 storage wells that are in service at its
facilities with a net storage capacity of approximately
65 MMBbl, the usage of which may be limited by brine
handling capacity, which is utilized to displace NGLs from
storage.
The Partnership operates its storage and terminaling facilities
based on the needs and requirements of its customers in the NGL,
petrochemical, refining, propane distribution and other related
industries. The Partnership usually experiences an increase in
demand for storage and terminaling of mixed NGLs during the
summer months when gas plants typically reach peak NGL
production, refineries have excess NGL products and LPG imports
are often highest. Demand for storage and terminaling at the
Partnership’s propane facilities typically peaks during
fall, winter and early spring.
The Partnership’s fractionation, storage and terminaling
business is supported by approximately 800 miles of
company-owned pipelines to transport mixed NGLs and
specification products.
The following table details the Logistics Assets segment’s
storage facilities at December 31, 2010:
| |
|
|
|
|
|
|
|
|
|
|
|
|
|
|
|
|
|
|
|
NGL Storage Facilities
|
|
|
|
|
|
|
|
|
|
Gross Storage
|
|
|
|
|
|
County/Parish,
|
|
Number of
|
|
Capacity
|
|
Facility
|
|
% Owned
|
|
State
|
|
Permitted Wells
|
|
(MMBbl)
|
|
|
|
Hackberry Storage (Lake Charles)
|
|
|
100.0
|
|
|
|
Cameron, LA
|
|
|
|
12
|
(1)
|
|
|
20.0
|
|
|
Mont Belvieu Storage
|
|
|
100.0
|
|
|
|
Chambers, TX
|
|
|
|
20
|
(2)
|
|
|
41.4
|
|
|
Easton Storage
|
|
|
100.0
|
|
|
|
Evangeline, LA
|
|
|
|
1
|
|
|
|
0.8
|
|
|
|
|
|
(1) |
|
Four of twelve owned wells leased
to CITGO under long-term leases; one of twelve currently in
service.
|
| |
|
(2) |
|
The Partnership owns 20 wells
and operates 6 wells owned by Chevron Phillips Chemical
Company LLC.
|
107
The following table details the Logistics Assets segment’s
Terminal Facilities and our throughput for the year ended
December 31, 2010:
| |
|
|
|
|
|
|
|
|
|
|
|
|
|
|
|
|
|
Terminal Facilities
|
|
|
|
|
|
|
|
|
|
|
|
|
|
Usable
|
|
|
|
|
|
|
|
|
|
Throughput
|
|
Storage
|
|
|
|
|
|
County/Parish,
|
|
|
|
for 2010
|
|
Capacity
|
|
Facility
|
|
% Owned
|
|
State
|
|
Description
|
|
(Million gallons)
|
|
(MMBbl)
|
|
|
|
Galena Park
Terminal(1)
|
|
100
|
|
Harris, TX
|
|
NGL import / export terminal
|
|
|
916.8
|
|
|
|
0.7
|
|
|
Mont Belvieu
Terminal(2)
|
|
100
|
|
Chambers, TX
|
|
Transport and storage
terminal
|
|
|
2,406.0
|
|
|
|
48.9
|
|
|
Hackberry Terminal
|
|
100
|
|
Cameron, LA
|
|
Storage terminal
|
|
|
289.7
|
|
|
|
17.8
|
|
|
Targa Channelview
Terminal(3)
|
|
100
|
|
Channelview, TX
|
|
Storage terminal / petroleum
products and crude oil
|
|
|
—
|
|
|
|
544.0
|
|
|
|
|
|
(1) |
|
Volumes reflect total import and
export across the dock/terminal.
|
| |
|
(2) |
|
Volumes reflect total transport and
terminal throughput volumes.
|
| |
|
(3) |
|
Acquired in March 2011.
|
Marketing and
Distribution Segment
The Marketing and Distribution segment transports, distributes
and markets NGLs via terminals and transportation assets across
the U.S. The Partnership owns or commercially manages
terminal facilities in a number of states, including Texas,
Louisiana, Arizona, Nevada, California, Florida, Alabama,
Mississippi, Tennessee, Kentucky and New Jersey. The geographic
diversity of the Partnership’s assets provides it direct
access to many NGL customers as well as markets via trucks,
barges, rail cars and open-access regulated NGL pipelines owned
by third parties. The Marketing and Distribution segment
consists of (i) NGL Distribution and Marketing,
(ii) Wholesale Marketing, (iii) Refinery Services and
(iv) Commercial Transportation, each as described below.
NGL Distribution and Marketing. The
Partnership markets its own NGL production and also purchases
component NGL products from other NGL producers and marketers
for resale. During the year ended December 31, 2010, the
Partnership’s distribution and marketing services business
sold an average of approximately 247 MBbl/d of NGLs.
The Partnership generally purchases mixed NGLs from producers at
a monthly pricing index less applicable fractionation,
transportation and marketing fees and resells these products to
petrochemical manufacturers, refineries and other marketing and
retail companies. This is primarily a physical settlement
business in which the Partnership earns margins from purchasing
and selling NGL products from producers under contract. The
Partnership earns margins by purchasing and reselling NGL
products in the spot and forward physical markets. To
effectively serve its Distribution and Marketing customers, the
Partnership contracts for and uses many of the assets included
in its Logistics Assets segment. The Partnership also markets
natural gas available from its Gathering and Processing
segments, and purchases and resells natural gas in selected
United States markets.
Wholesale Marketing. The
Partnership’s wholesale propane marketing operations
primarily sells propane and related logistics services to major
multi-state retailers, independent retailers and other
end-users. The Partnership’s propane supply primarily
originates from both its refinery/ gas supply contracts and its
other owned or managed logistics and marketing assets. The
Partnership generally sells propane at a fixed or posted price
at the time of delivery and, in some circumstances, the
Partnership earns margin on a net-back basis.
The wholesale propane marketing business is significantly
impacted by weather-driven demand, particularly in the winter,
which can impact the price of propane in the markets it serves
and impact the ability to deliver propane to satisfy peak demand.
108
Refinery Services. In its refinery
services business, the Partnership typically provides NGL
balancing services via contractual arrangements with refiners to
purchase
and/or
market propane and to supply butanes. The Partnership uses its
commercial transportation assets (discussed below) and contracts
for and uses the storage, transportation and distribution assets
included in its Logistics Assets segment to assist refinery
customers in managing their NGL product demand and production
schedules. This includes both feedstocks consumed in refinery
processes and the excess NGLs produced by those same refining
processes. Under typical net-back purchase contracts, the
Partnership generally retains a portion of the resale price of
NGL sales or receives a fixed minimum fee per gallon on products
sold. Under net-back sales contracts, fees are earned for
locating and supplying NGL feedstocks to the refineries based on
a percentage of the cost to obtain such supply or a minimum fee
per gallon.
Key factors impacting the results of the Partnership’s
refinery services business include production volumes, prices of
propane and butanes, as well as its ability to perform receipt,
delivery and transportation services in order to meet refinery
demand.
Commercial Transportation. The
Partnership’s NGL transportation and distribution
infrastructure includes a wide range of assets supporting both
third party customers and the delivery requirements of its
marketing and asset management business. The Partnership
provides fee-based transportation services to refineries and
petrochemical companies throughout the Gulf Coast area. The
Partnership’s assets are also deployed to serve its
wholesale distribution terminals, fractionation facilities,
underground storage facilities and pipeline injection terminals.
These distribution assets provide a variety of ways to transport
products to and from its customers.
The Partnership’s transportation assets, as of
December 31, 2010, include:
|
|
|
| |
•
|
approximately 760 railcars that the Partnership leases and
manages;
|
| |
| |
•
|
approximately 70 owned and leased transport tractors and
approximately 100 company-owned tank trailers; and
|
| |
| |
•
|
21 company-owned pressurized NGL barges.
|
Natural Gas Marketing. The Partnership
also markets natural gas available to the Partnership from the
Gathering and Processing segments, and purchases and resells
natural gas in selected United States markets.
The following table details the Marketing and Distribution
segment’s Terminal Facilities:
| |
|
|
|
|
|
|
|
|
|
|
|
|
|
|
|
Terminal Facilities
|
|
|
|
|
|
|
|
|
|
|
|
Throughput
|
|
|
|
|
|
|
|
|
|
|
|
for Year
|
|
Usable
|
|
|
|
|
|
County/Parish,
|
|
|
|
Ended December 31,
|
|
Storage
|
|
Facility
|
|
% Owned
|
|
State
|
|
Description
|
|
2010(1)
|
|
Capacity
|
|
|
|
|
|
|
|
|
|
(Million gallons)
|
|
(Million gallons)
|
|
|
|
Calvert City Terminal
|
|
|
100
|
|
|
Marshall, KY
|
|
Propane terminal
|
|
47.2
|
|
0.1
|
|
Greenville Terminal
|
|
|
100
|
|
|
Washington, MS
|
|
Marine propane terminal
|
|
23.1
|
|
1.7
|
|
Port Everglades Terminal
|
|
|
100
|
|
|
Broward, FL
|
|
Marine propane terminal
|
|
23.8
|
|
1.7
|
|
Tyler Terminal
|
|
|
100
|
|
|
Smith, TX
|
|
Propane terminal
|
|
9.3
|
|
0.2
|
|
Abilene
Transport(2)
|
|
|
100
|
|
|
Taylor, TX
|
|
Raw NGL transport terminal
|
|
12.4
|
|
Less than 0.1
|
|
Bridgeport
Transport(2)
|
|
|
100
|
|
|
Jack, TX
|
|
Raw NGL transport terminal
|
|
49.6
|
|
0.1
|
|
Gladewater
Transport(2)
|
|
|
100
|
|
|
Gregg, TX
|
|
Raw NGL transport terminal
|
|
20.5
|
|
0.4
|
|
Hammond Transport
|
|
|
100
|
|
|
Tangipahoa, LA
|
|
Transport terminal
|
|
31.6
|
|
No storage
|
|
Chattanooga Terminal
|
|
|
100
|
|
|
Hamilton, TN
|
|
Propane terminal
|
|
18.3
|
|
1.0
|
|
Sparta Terminal
|
|
|
100
|
|
|
Sparta, NJ
|
|
Propane terminal
|
|
10.7
|
|
0.2
|
|
Hattiesburg
Terminal(3)
|
|
|
50
|
|
|
Forrest, MS
|
|
Propane terminal
|
|
264.8
|
|
269.6
|
|
Winona Terminal
|
|
|
100
|
|
|
Flagstaff, AZ
|
|
Propane terminal
|
|
4.4
|
|
0.3
|
|
|
|
|
(1) |
|
Throughputs include volumes related
to exchange agreements and third-party storage agreements.
|
| |
|
(2) |
|
Volumes reflect total transport and
injection volumes.
|
| |
|
(3) |
|
Throughput volume is based on 100%
ownership.
|
109
Operational Risks
and Insurance
The Partnership is subject to all risks inherent in the
midstream natural gas business. These risks include, but are not
limited to, explosions, fires, mechanical failure, terrorist
attacks, product spillage, weather, nature and inadequate
maintenance of
rights-of-way
and could result in damage to or destruction of operating assets
and other property, or could result in personal injury, loss of
life or polluting the environment, as well as curtailment or
suspension of operations at the affected facility. We maintain,
on behalf of ourselves and our subsidiaries, including the
Partnership, general public liability, property, boiler and
machinery and business interruption insurance in amounts that we
consider to be appropriate for such risks. Such insurance is
subject to deductibles that we consider reasonable and not
excessive given the current insurance market environment. The
costs associated with these insurance coverages increased
significantly following Hurricanes Katrina and Rita in 2005.
Insurance premiums, deductibles and co-insurance requirements
increased substantially, and terms were generally less favorable
than terms that were obtained prior to those hurricanes.
Insurance market conditions worsened again as a result of
industry losses including those sustained from Hurricanes Gustav
and Ike in September 2008, and as a result of volatile
conditions in the financial markets. As a result, in 2009, the
Partnership experienced further increases in deductibles and
premiums, and further reductions in coverage and limits. During
2010, it saw the insurance market conditions improve slightly.
The occurrence of a significant event not fully insured or
indemnified against, or the failure of a party to meet its
indemnification obligations, could materially and adversely
affect the Partnership’s operations and financial
condition. While we currently maintain levels and types of
insurance that we believe to be prudent under current insurance
industry market conditions, our inability to secure these levels
and types of insurance in the future could negatively impact the
Partnership’s business operations and financial stability,
particularly if an uninsured loss were to occur. No assurance
can be given that we will be able to maintain these levels of
insurance in the future at rates considered commercially
reasonable, particularly named windstorm coverage and contingent
business interruption coverage for the Partnership’s
onshore operations.
Significant
Customers
The following table lists the percentage of the
Partnership’s consolidated sales and consolidated product
purchases with the Partnership’s significant customers and
suppliers:
| |
|
|
|
|
|
|
|
|
|
|
|
|
|
|
|
Year Ended
|
|
|
|
December 31,
|
|
|
|
2008
|
|
2009
|
|
2010
|
|
|
|
% of consolidated revenues CPC
|
|
|
19
|
%
|
|
|
15
|
%
|
|
|
10
|
%
|
|
% of consolidated product purchases Louis Dreyfus Energy
Services L.P.
|
|
|
9
|
%
|
|
|
11
|
%
|
|
|
10
|
%
|
No other customer or supplier accounted for more than 10% of the
Partnership’s consolidated revenues or consolidated product
purchases during these periods.
The Partnership has agreements with CPC, a separate joint
venture affiliate of Chevron, pursuant to which the Partnership
supplies a significant portion of CPC’s NGL feedstock needs
for petrochemical plants in the Texas Gulf Coast area and a
related services agreement, pursuant to which the Partnership
provides storage and logistical services to CPC for feedstocks
and products produced from the petrochemical plants. The
services contract was renegotiated in 2008 with key components
having a 10 year term. In September 2009, CPC executed
contracts to replace the previously terminated agreement with a
new feedstock and storage agreement effective for a term of
5 years, which will renew annually following the end of the
five year term unless terminated by either party. We believe
that the Partnership is well positioned to retain CPC as a
customer based on the Partnership’s long-standing history
of customer service, the criticality of the service provided,
the integrated nature of facilities and the difficulty and high
cost associated with replicating the Partnership’s assets.
In addition to these two agreements, The Partnership has
fractionation agreements in place with CPC for Y-grade streams
and butanes.
110
Competition
The Partnership faces strong competition in acquiring new
natural gas supplies. Competition for natural gas supplies is
primarily based on the location of gathering and processing
facilities, pricing arrangements, reputation, efficiency,
flexibility, reliability and access to end-use markets or liquid
marketing hubs. Competitors to the Partnership’s gathering
and processing operations include other natural gas gatherers
and processors, such as major interstate and intrastate pipeline
companies, master limited partnerships and oil and gas
producers. The Partnership’s major competitors for natural
gas supplies in its current operating regions include Atlas Gas
Pipeline Company, Copano Energy, L.L.C. (“Copano”),
WTG Gas Processing L.P. (“WTG”), DCP Midstream
Partners LP (“DCP”), Devon Energy Corp
(“Devon”), Enbridge Inc., GulfSouth Pipeline Company,
LP, Hanlon Gas Processing, Ltd., J W Operating Company,
Louisiana Intrastate Gas and several other interstate pipeline
companies. Many of its competitors have greater financial
resources than the Partnership possesses.
The Partnership also competes for NGL products to market through
its Logistics and Marketing division. The Partnership’s
competitors include major oil and gas producers who market NGL
products for their own account and for others. Additionally, the
Partnership competes with several other NGL marketing companies,
including Enterprise Products Partners L.P., DCP, ONEOK and BP
p.l.c.
Additionally, the Partnership faces competition for mixed NGLs
supplies at its fractionation facilities. Its competitors
include large oil, natural gas and petrochemical companies. The
fractionators in which the Partnership owns an interest in the
Mont Belvieu region compete for volumes of mixed NGLs with other
fractionators also located at Mont Belvieu. Among the primary
competitors are Enterprise Products Partners L.P. and ONEOK,
Inc. In addition, certain producers fractionate mixed NGLs for
their own account in captive facilities. The Mont Belvieu
fractionators also compete on a more limited basis with
fractionators in Conway, Kansas and a number of decentralized,
smaller fractionation facilities in Texas, Louisiana and New
Mexico. The Partnership’s other fractionation facilities
compete for mixed NGLs with the fractionators at Mont Belvieu as
well as other fractionation facilities located in Louisiana. The
Partnership’s customers who are significant producers of
mixed NGLs and NGL products or consumers of NGL products may
develop their own fractionation facilities in lieu of using the
Partnerships’ services.
Regulation of
Operations
Regulation of pipeline gathering and transportation services,
natural gas sales and transportation of NGLs may affect certain
aspects of the Partnership’s business and the market for
its products and services.
Regulation of
Interstate Natural Gas Pipelines
VGS is regulated by FERC under the NGA, and the NGPA. VGS
operates under a FERC-approved, open-access tariff that
establishes rates and terms and conditions under which the
system provides services to its customers. Pursuant to
FERC’s jurisdiction, existing pipeline rates
and/or terms
and conditions of service may be challenged by customer
complaint or by FERC and proposed rate changes or changes in the
terms and conditions of service may be challenged by protest.
Generally, FERC’s authority extends to: transportation of
natural gas; rates and charges for natural gas transportation;
certification and construction of new facilities; extension or
abandonment of services and facilities; maintenance of accounts
and records; commercial relationships and communications between
pipelines and certain affiliates; terms and conditions of
service and service contracts with customers; depreciation and
amortization policies; and acquisition and disposition of
facilities.
VGS holds a certificate of public convenience and necessity
issued by FERC permitting the construction, ownership, and
operation of its interstate natural gas pipeline facilities and
the provision of transportation services. This certificate
authorization requires VGS to provide on a non-discriminatory
basis open-access services to all customers who qualify under
its FERC gas tariff. FERC has the power to prescribe the
accounting treatment of items for regulatory purposes. Thus, the
books and records of VGS may be periodically audited by FERC.
111
The maximum recourse rates that may be charged by VGS for its
services are established through FERC’s ratemaking process.
Generally, the maximum filed recourse rates for interstate
pipelines are based on the cost of service including recovery of
and a return on the pipeline’s investment. Key determinants
in the ratemaking process are costs of providing service,
allowed rate of return and volume throughput and contractual
capacity commitment assumptions. VGS is permitted to discount
its firm and interruptible rates without further FERC
authorization down to the variable cost of performing service,
provided they do not “unduly discriminate.” The
applicable recourse rates and terms and conditions for service
are set forth in each pipeline’s FERC approved tariff. Rate
design and the allocation of costs also can impact a
pipeline’s profitability.
Gathering
Pipeline Regulation
The Partnership’s natural gas gathering operations are
typically subject to ratable take and common purchaser statutes
in the states in which it operates. The common purchaser
statutes generally require gathering pipelines to purchase or
take without undue discrimination as to source of supply or
producer. These statutes are designed to prohibit discrimination
in favor of one producer over another or one source of supply
over another. The regulations under these statutes can have the
effect of imposing some restrictions on the Partnership’s
ability as an owner of gathering facilities to decide with whom
it contracts to gather natural gas. The states in which the
Partnership operates have adopted complaint-based regulation of
natural gas gathering activities, which allows natural gas
producers and shippers to file complaints with state regulators
in an effort to resolve grievances relating to gathering access
and rate discrimination. The rates the Partnership charges for
gathering are deemed just and reasonable unless challenged in a
complaint. We cannot predict whether such a complaint will be
filed against the Partnership in the future. Failure to comply
with state regulations can result in the imposition of
administrative, civil and criminal penalties.
Section 1(b) of the NGA, exempts natural gas gathering
facilities from regulation as a natural gas company by FERC
under the NGA. We believe that the natural gas pipelines in the
Partnership’s gathering systems meet the traditional tests
FERC has used to establish a pipeline’s status as a
gatherer not subject to regulation as a natural gas company.
However, the distinction between FERC-regulated transmission
services and federally unregulated gathering services is the
subject of substantial, on-going litigation, so the
classification and regulation of the Partnership’s
gathering facilities are subject to change based on future
determinations by FERC, the courts or Congress. Natural gas
gathering may receive greater regulatory scrutiny at both the
state and federal levels. The Partnership’s natural gas
gathering operations could be adversely affected should they be
subject to more stringent application of state or federal
regulation of rates and services. Additional rules and
legislation pertaining to these matters are considered or
adopted from time to time. We cannot predict what effect, if
any, such changes might have on the Partnership’s
operations, but the industry could be required to incur
additional capital expenditures and increased costs depending on
future legislative and regulatory changes.
In 2007, Texas enacted new laws regarding rates, competition and
confidentiality for natural gas gathering and transmission
pipelines (“Competition Statute”) and new informal
complaint procedures for challenging determinations of lost and
unaccounted for gas by gas gatherers, processors and
transporters (“LUG Statute”). The Competition Statute
gives the Railroad Commission of Texas (“RRC”) the
ability to use either a
cost-of-service
method or a market-based method for setting rates for natural
gas gathering and transportation pipelines in formal rate
proceedings. This statute also gives the RRC specific authority
to enforce its statutory duty to prevent discrimination in
natural gas gathering and transportation, to enforce the
requirement that parties participate in an informal complaint
process and to punish purchasers, transporters, and gatherers
for taking discriminatory actions against shippers and sellers.
The Competition Bill also provides producers with the unilateral
option to determine whether or not confidentiality provisions
are included in a contract to which a producer is a party for
the sale, transportation, or gathering of natural gas. The LUG
Statute modifies the informal complaint process at the RRC with
procedures unique to lost and unaccounted for gas issues. Such
statute also extends the types of information that can be
requested and provides the RRC with the authority to make
determinations and issue orders in specific situations. We
cannot predict what effect, if any, these statutes might have on
the Partnership’s future operations in Texas.
112
Intrastate
Pipeline Regulation
Though the Partnership’s natural gas intrastate pipelines
are not subject to regulation by FERC as natural gas companies
under the NGA, the Partnership’s intrastate pipelines may
be subject to certain FERC-imposed daily scheduled flow and
capacity posting requirements depending on the volume of flows
in a given period and the design capacity of the pipelines’
receipt and delivery meters. See “—Other Federal Laws
and Regulation Affecting Our Industry—FERC Market
Transparency Rules.”
The Partnership’s intrastate pipelines located in Texas are
regulated by the RRC. The Partnership’s Texas intrastate
pipeline, Targa Intrastate Pipeline LLC (“Targa
Intrastate”), owns the intrastate pipeline that transports
natural gas from the Partnership’s Shackelford processing
plant to an interconnect with Atmos Pipeline-Texas that in turn
delivers gas to the West Texas Utilities Company’s Paint
Creek Power Station. Targa Intrastate also owns a
1.65 mile, 10 inch diameter intrastate pipeline that
transports natural gas from a third party gathering system into
the Chico System in Denton County, Texas. Targa Intrastate is a
gas utility subject to regulation by the RRC and has a tariff on
file with such agency. The Partnership notes that the RRC is
subject to a sunset condition. If the Texas Legislature does not
take action to continue the RRC, the RRC will be abolished
effective September 1, 2011, and will begin a one-year
wind-down process. The Sunset Advisory Commission has
recommended certain organizational changes be made to the RRC.
The Partnership cannot tell what, if any, changes will be made
to the RRC as a result of the pending regular session or any
called sessions of the Texas Legislature in 2011, but the
Partnership does not believe that any such changes would affect
its business in a way that would be materially different from
the way such changes would affect its competitors.
The Partnership’s Louisiana intrastate pipeline, Targa
Louisiana Intrastate LLC (“TLI”) owns an approximately
60-mile
intrastate pipeline system that receives all of the natural gas
it transports within or at the boundary of the State of
Louisiana. Because all such gas ultimately is consumed within
Louisiana, and since the pipeline’s rates and terms of
service are subject to regulation by the Office of Conservation
of the Louisiana Department of Natural Resources
(“DNR”), the pipeline qualifies as a Hinshaw pipeline
under Section 1(c) of the NGA and thus is exempt from full
FERC regulation.
Texas and Louisiana have adopted complaint-based regulation of
intrastate natural gas transportation activities, which allows
natural gas producers and shippers to file complaints with state
regulators in an effort to resolve grievances relating to
pipeline access and rate discrimination. The rates the
Partnership charges for intrastate transportation are deemed
just and reasonable unless challenged in a complaint. We cannot
predict whether such a complaint will be filed against the
Partnership in the future. Failure to comply with state
regulations can result in the imposition of administrative,
civil and criminal penalties.
Regulation of NGL
intrastate pipelines
The Partnership’s intrastate NGL pipelines in Louisiana
gather mixed NGLs streams that the Partnership owns from
processing plants in Louisiana and deliver such streams to the
Gillis fractionator in Lake Charles, Louisiana, where the mixed
NGLs streams are fractionated into various products. The
Partnership delivers such refined products (ethane, propane,
butanes and natural gasoline) out of its fractionator to and
from Targa-owned storage, to other third-party facilities and to
various third-party pipelines in Louisiana. These pipelines are
not subject to FERC regulation or rate regulation by the DNR,
but are regulated by United States Department of Transportation
(“DOT”) safety regulations.
Natural Gas
Processing
The Partnership’s natural gas gathering and processing
operations are not presently subject to FERC regulation.
However, starting in May 2009 the Partnership was required to
report to FERC information regarding natural gas sale and
purchase transactions for some of its operations depending on
the volume of natural gas transacted during the prior calendar
year. See “—Other Federal Laws and
Regulation Affecting Our Industry—FERC Market
Transparency Rules.” There can be no assurance that the
Partnership’s processing operations will continue to be
exempt from other FERC regulation in the future.
113
Availability,
Terms and Cost of Pipeline Transportation
The Partnership’s processing facilities and marketing of
natural gas and NGLs are affected by the availability, terms and
cost of pipeline transportation. The price and terms of access
to pipeline transportation can be subject to extensive federal
and, if a complaint is filed, state regulation. FERC is
continually proposing and implementing new rules and regulations
affecting the interstate transportation of natural gas, and to a
lesser extent, the interstate transportation of NGLs. These
initiatives also may indirectly affect the intrastate
transportation of natural gas and NGLs under certain
circumstances. We cannot predict the ultimate impact of these
regulatory changes to the Partnership’s processing
operations and its natural gas and NGL marketing operations. We
do not believe that the Partnership would be affected by any
such FERC action materially differently than other natural gas
processors and natural gas and NGL marketers with whom it
competes.
The ability of the Partnership’s processing facilities and
pipelines to deliver natural gas into third-party natural gas
pipeline facilities is directly impacted by the gas quality
specifications required by those pipelines. In 2006, FERC issued
a policy statement on provisions governing gas quality and
interchangeability in the tariffs of interstate gas pipeline
companies and a separate order declining to set generic
prescriptive national standards. FERC strongly encouraged all
natural gas pipelines subject to its jurisdiction to adopt, as
needed, gas quality and interchangeability standards in their
FERC gas tariffs modeled on the interim guidelines issued by a
group of industry representatives, headed by the Natural Gas
Council (“NGC+ Work Group”), or to explain how and why
their tariff provisions differ. We do not believe that the
adoption of the NGC+ Work Group’s gas quality interim
guidelines by a pipeline that either directly or indirectly
interconnects with the Partnership’s facilities would
materially affect the Partnership’s operations. We have no
way to predict, however, whether FERC will approve of gas
quality specifications that materially differ from the NGC+ Work
Group’s interim guidelines for such an interconnecting
pipeline.
Sales of
Natural Gas and NGLs
The price at which the Partnership buys and sells natural gas
and NGLs is currently not subject to federal rate regulation
and, for the most part, is not subject to state regulation.
However, with regard to the Partnership’s physical
purchases and sales of these energy commodities and any related
hedging activities that it undertakes, the Partnership is
required to observe anti-market manipulation laws and related
regulations enforced by FERC
and/or the
CFTC. See “—Other Federal Laws and
Regulation Affecting Our Industry—Energy Policy Act of
2005.” Starting May 1, 2009, the Partnership was
required to report to FERC information regarding natural gas
sale and purchase transactions for some of its operations
depending on the volume of natural gas transacted during the
prior calendar year. See “—Other Federal Laws and
Regulation Affecting Our Industry—FERC Market
Transparency Rules.” Should the Partnership violate the
anti-market manipulation laws and regulations, it could also be
subject to related third party damage claims by, among others,
market participants, sellers, royalty owners and taxing
authorities.
Other State
and Local Regulation of Operations
The Partnership’s business activities are subject to
various state and local laws and regulations, as well as orders
of regulatory bodies pursuant thereto, governing a wide variety
of matters, including marketing, production, pricing, community
right-to-know,
protection of the environment, safety and other matters. For
additional information regarding the potential impact of
federal, state or local regulatory measures on the
Partnership’s business, see “Risk Factors—Risks
Related to Our Business.”
Interstate Common
Carrier Liquids Pipeline Regulation
As part of the Downstream Business acquired from us on
September 24, 2009, the Partnership acquired Targa NGL
Pipeline Company LLC (“Targa NGL”). Targa NGL is an
interstate NGL common carrier subject to regulation by FERC
under the ICA. Targa NGL owns a twelve inch diameter pipeline
that runs between Lake Charles, Louisiana and Mont Belvieu,
Texas. This pipeline can move mixed NGLs and purity NGL
products. Targa NGL also owns an eight inch diameter pipeline
and a 20 inch diameter pipeline, each of
114
which run between Mont Belvieu, Texas and Galena Park, Texas.
The eight inch and the 20 inch pipelines are part of an
extensive mixed NGL and purity NGL pipeline receipt and delivery
system that provides services to domestic and foreign import and
export customers. The ICA requires that the Partnership maintain
tariffs on file with FERC for each of these pipelines. Those
tariffs set forth the rates the Partnership charges for
providing transportation services as well as the rules and
regulations governing these services. The ICA requires, among
other things, that rates on interstate common carrier pipelines
be “just and reasonable” and non-discriminatory. All
shippers on this pipeline are Partnership subsidiaries.
Other Federal
Laws and Regulation Affecting Our Industry
Energy Policy Act
of 2005
The EP Act of 2005 is a comprehensive compilation of tax
incentives, authorized appropriations for grants and guaranteed
loans, and significant changes to the statutory policy that
affects all segments of the energy industry. Among other
matters, EP Act of 2005 amends the NGA to add an anti- market
manipulation provision which makes it unlawful for any entity to
engage in prohibited behavior to be prescribed by FERC, and
furthermore provides FERC with additional civil penalty
authority. The EP Act of 2005 provides FERC with the power to
assess civil penalties of up to $1 million per day for
violations of the NGA and $1 million per violation per day
for violations of the NGPA. The civil penalty provisions are
applicable to entities that engage in the sale of natural gas
for resale in interstate commerce, including VGS. In 2006, FERC
issued Order 670 to implement the anti-market manipulation
provision of EP Act of 2005. Order 670 makes it unlawful to:
(1) in connection with the purchase or sale of natural gas
subject to the jurisdiction of FERC, or the purchase or sale of
transportation services subject to the jurisdiction of FERC, for
any entity, directly or indirectly, to use or employ any device,
scheme or artifice to defraud; (2) to make any untrue
statement of material fact or omit any statement necessary to
make the statements made not misleading; or (3) to engage
in any act or practice that operates as a fraud or deceit upon
any person. Order 670 does not apply to activities that relate
only to intrastate or other non-jurisdictional sales or
gathering, but does apply to activities of gas pipelines and
storage companies that provide interstate services, as well as
otherwise non-jurisdictional entities to the extent the
activities are conducted “in connection with” gas
sales, purchases or transportation subject to FERC jurisdiction,
which now includes the annual reporting requirements under a
final rule on the annual natural gas transaction reporting
requirements, as amended by subsequent orders on rehearing
(Order 704), the daily schedule flow and capacity posting
requirements under Order 720, and the quarterly reporting
requirement under Order 735. The anti-market manipulation rule
and enhanced civil penalty authority reflect an expansion of
FERC’s NGA enforcement authority.
FERC Standards of
Conduct for Transmission Providers
On October 16, 2008, FERC issued new standards of conduct
for transmission providers (Order 717) to regulate the
manner in which interstate natural gas pipelines may interact
with their marketing affiliates based on an employee separation
approach. A “Transmission Provider” includes an
interstate natural gas pipeline that provides open access
transportation pursuant to FERC’s regulations. Under these
rules, a Transmission Provider’s transmission function
employees (including the transmission function employees of any
of its affiliates) must function independently from the
Transmission Provider’s marketing function employees
(including the marketing function employees of any of its
affiliates). FERC clarified on October 15, 2009 in a
rehearing order, Order
717-A,
however, that if a Hinshaw pipeline affiliated with a
Transmission Provider engages in off-system sales of gas that
has been transported on the Transmission Provider’s
affiliated pipeline, then the Transmission Provider and the
Hinshaw pipeline (which is engaging in marketing functions) will
be required to observe the Standards of Conduct by, among other
things, having the marketing function employees function
independently from the transmission function employees. The
Partnership’s only Hinshaw pipeline, TLI, does not engage
in any off-system sales of gas that have been transported on an
affiliated Transmission Provider, and we do not believe that the
Partnership’s operations will be affected by the new
standards of conduct. FERC further clarified Order
717-A in a
rehearing order, Order 717-B, on November 16, 2009 and in
Order 717-C, on April 16, 2010. However, Orders 717-B and
717-C did not substantively alter the rules promulgated under
115
Orders 717 and
717-A.
Requests for rehearing of Order 717-C have been filed and are
currently pending before FERC. Our only Transmission Provider,
VGS, does not engage in any transactions with marketing
affiliates, and we do not believe that our operations will be
affected by the new standards of conduct. We have no way to
predict with certainty whether and to what extent FERC will
revise the new standards of conduct in response to those
requests for rehearing.
FERC Market
Transparency Rules
In 2007, FERC issued Order 704, whereby wholesale buyers and
sellers of more than 2.2 BBtu of physical natural gas in the
previous calendar year, including interstate and intrastate
natural gas pipelines, natural gas gatherers, natural gas
processors and natural gas marketers, are now required to
report, on May 1 of each year, beginning in 2009, aggregate
volumes of natural gas purchased or sold at wholesale in the
prior calendar year to the extent such transactions utilize,
contribute to, or may contribute to the formation of price
indices. It is the responsibility of the reporting entity to
determine which transactions should be reported based on the
guidance of Order 704 as clarified in orders on clarification
and rehearing.
On November 20, 2008, FERC issued a final rule on daily
scheduled flows and capacity posting requirements (Order 720).
Under Order 720, as clarified in orders on clarification and
rehearing certain non-interstate pipelines delivering, on an
annual basis, more than an average of 50 million MMBtu of
gas over the previous three calendar years, are required to post
daily certain information regarding the pipeline’s capacity
and scheduled flows for each receipt and delivery point that has
a design capacity equal to or greater than 15,000 MMBtu/d
and interstate pipelines are required to post information
regarding the provision of no-notice service. The Partnership
takes the position that, at this time, all of its entities are
exempt from this rule as currently written.
On May 20, 2010, the FERC issued Order No. 735, which
requires intrastate pipelines providing interstate
transportation services under Section 311 of the NGPA and
“Hinshaw” pipelines providing interstate
transportation service subject to FERC jurisdiction under
Section 1(c) of the NGA to report on a quarterly basis more
detailed transportation and storage transaction information,
including: rates charged by the pipeline under each contract;
receipt and delivery points and zones or segments covered by
each contract; the quantity of natural gas the shipper is
entitled to transport, store, or deliver; the duration of the
contract; and whether there is an affiliate relationship between
the pipeline and the shipper. Order No. 735 further
requires that such information must be supplied through a new
electronic reporting system and will be posted on FERC’s
website, and that such quarterly reports may not contain
information redacted as privileged. The FERC promulgated this
Rule after determining that such transactional information would
help shippers make more informed purchasing decisions and would
improve the ability of both shippers and the FERC to monitor
actual transactions for evidence of market power or undue
discrimination. Order No. 735 also extends the
Commission’s periodic review of the rates charged by the
subject pipelines from three years to five years. Order
No. 735 becomes effective on April 1, 2011. On
December 16, 2010, the Commission issued Order
No. 735-A.
In Order
No. 735-A,
the Commission generally reaffirmed Order No. 735 requiring
section 311 and Hinshaw pipelines to report on a quarterly
basis storage and transportation transactions containing
specific information for each transaction, aggregated by
contract. Order
No. 735-A
did grant rehearing of three requests, including removing the
requirement that the quarterly reports include the contract
end-date for interruptible transactions, eliminating the
increased per-customer revenue reporting requirements, and
extending the deadline for submitting the quarterly reports from
30 days to 60 days following the quarter end date. As
currently written, this rule does not apply to the
Partnership’s Hinshaw pipelines because they are not
certificated to provide interstate transportation service. We
will continue to monitor developments with respect to this
rulemaking.
Additional proposals and proceedings that might affect the
natural gas industry are pending before Congress, FERC and the
courts. We cannot predict the ultimate impact of these or the
above regulatory changes to the Partnership’s natural gas
operations. We do not believe that the Partnership would be
affected by any such FERC action materially differently than
other midstream natural gas companies with whom it competes.
116
Environmental,
Health and Safety Matters
General
The Partnership’s operations are subject to stringent and
complex federal, state and local laws and regulations pertaining
to health, safety and the environment. As with the industry
generally, compliance with current and anticipated environmental
laws and regulations increases the Partnership’s overall
cost of business, including its capital costs to construct,
maintain and upgrade equipment and facilities. These laws and
regulations may, among other things, require the acquisition of
various permits to conduct regulated activities, require the
installation of pollution control equipment or otherwise
restrict the way the Partnership can handle or dispose of its
wastes; limit or prohibit construction activities in sensitive
areas such as wetlands, wilderness areas or areas inhabited by
endangered or threatened species; impose specific health and
safety criteria addressing worker protection, require
investigatory and remedial action to mitigate pollution
conditions caused by the Partnership’s operations or
attributable to former operations; and enjoin some or all of the
operations of facilities deemed in non-compliance with permits
issued pursuant to such environmental laws and regulations.
Failure to comply with these laws and regulations may result in
assessment of administrative, civil and criminal penalties, the
imposition of removal or remedial obligations and the issuance
of injunctions limiting or prohibiting the Partnership’s
activities.
The Partnership has implemented programs and policies designed
to keep its pipelines, plants and other facilities in compliance
with existing environmental laws and regulations. The clear
trend in environmental regulation, however, is to place more
restrictions and limitations on activities that may affect the
environment and thus, any changes in environmental laws and
regulations or re-interpretation of enforcement policies that
result in more stringent and costly waste handling, storage,
transport, disposal or remediation requirements could have a
material adverse effect on the Partnership’s operations and
financial position. The Partnership may be unable to pass on
such increased compliance costs to its customers. Moreover,
accidental releases or spills may occur in the course of the
Partnership’s operations and we cannot assure you that the
Partnership will not incur significant costs and liabilities as
a result of such releases or spills, including any third party
claims for damage to property, natural resources or persons.
While we believe that the Partnership is in substantial
compliance with existing environmental laws and regulations and
that continued compliance with current requirements would not
have a material adverse effect on the Partnership, there is no
assurance that the current conditions will continue in the
future.
The following is a summary of the more significant existing
environmental, health and safety laws and regulations to which
the Partnership’s business operations are subject and for
which compliance may have a material adverse impact on its
capital expenditures, results of operations or financial
position.
Hazardous
Substances and Waste
CERCLA and comparable state laws impose liability without regard
to fault or the legality of the original conduct, on certain
classes of persons who are considered to be responsible for the
release of a “hazardous substance” into the
environment. These persons include current and prior owners or
operators of the site where the release occurred and entities
that disposed or arranged for the disposal of the hazardous
substances found at the site. Under CERCLA, these
“responsible persons” may be subject to joint and
several, strict liability for the costs of cleaning up the
hazardous substances that have been released into the
environment, for damages to natural resources and for the costs
of certain health studies. CERCLA also authorizes the EPA and,
in some instances, third parties to act in response to threats
to the public health or the environment and to seek to recover
from the responsible classes of persons the costs they incur. It
is not uncommon for neighboring landowners and other third
parties to file claims for personal injury and property damage
allegedly caused by the release of hazardous substances or other
pollutants into the environment. The Partnership generates
materials in the course of its operations that are regulated as
“hazardous substances” under CERCLA or similar state
statutes and, as a result, may be jointly and severally liable
under CERCLA or such statutes for all or part of the costs
required to clean up sites at which these hazardous substances
have been released into the environment.
117
The Partnership also generates solid wastes, including hazardous
wastes that are subject to the requirements of RCRA and
comparable state statutes. While RCRA regulates both solid and
hazardous wastes, it imposes strict requirements on the
generation, storage, treatment, transportation and disposal of
hazardous wastes. In the course of its operations, the
Partnership generates petroleum product wastes and ordinary
industrial wastes such as paint wastes, waste solvents and waste
compressor oils that are regulated as hazardous wastes. Certain
materials generated in the exploration, development or
production of crude oil and natural gas are excluded from
RCRA’s hazardous waste regulations. However, it is possible
that future changes in law or regulation could result in these
wastes, including wastes currently generated during the
Partnership’s operations, being designated as
“hazardous wastes” and therefore subject to more
rigorous and costly disposal requirements. Any such changes in
the laws and regulations could have a material adverse effect on
the Partnership’s capital expenditures and operating
expenses as well as those of the oil and gas industry in general.
The Partnership currently owns or leases and has in the past
owned or leased, properties that for many years have been used
for midstream natural gas and NGL activities. Although the
Partnership has utilized operating and disposal practices that
were standard in the industry at the time, hydrocarbons or
wastes may have been disposed of or released on or under the
properties owned or leased by us or on or under the other
locations where these hydrocarbons and wastes have been taken
for treatment or disposal. In addition, certain of these
properties have been operated by third parties whose treatment
and disposal or release of hydrocarbons or wastes was not under
the Partnership’s control. These properties and wastes
disposed thereon may be subject to CERCLA, RCRA and analogous
state laws. Under these laws, the Partnership could be required
to remove or remediate previously disposed wastes (including
wastes disposed of or released by prior owners or operators), to
clean up contaminated property (including contaminated
groundwater) and to perform remedial operations to prevent
future contamination. We are not currently aware of any facts,
events or conditions relating to such requirements that could
materially impact the Partnership’s operations or financial
condition.
Air
Emissions
The Clean Air Act, as amended, and comparable state laws and
regulations restrict the emission of air pollutants from many
sources, including processing plants and compressor stations and
also impose various monitoring and reporting requirements. These
laws and regulations may require the Partnership to obtain
pre-approval for the construction or modification of certain
projects or facilities expected to produce or significantly
increase air emissions, obtain and strictly comply with
stringent air permit requirements or utilize specific equipment
or technologies to control emissions. The Partnership is
currently reviewing the air emissions monitoring systems at
certain of its facilities. The Partnership may be required to
incur capital expenditures in the next few years to implement
various air emissions leak detection and monitoring programs as
well as to install air pollution control equipment or
non-ambient
storage tanks as a result of its review or in connection with
maintaining, amending or obtaining operating permits and
approvals for air emissions. We currently believe, however, that
such requirements will not have a material adverse affect on the
Partnership’s operations.
Climate
Change
There is increasing attention in the United States and worldwide
concerning the issue of climate change and the effect of GHGs.
In December 2009, the EPA published its findings that emissions
of carbon dioxide, methane and other GHGs present an
endangerment to public health and the environment because
emissions of such gases are, according to the EPA, contributing
to warming of the earth’s atmosphere and other climatic
changes. These findings allow the EPA to proceed with the
adoption and implementation of regulations restricting emissions
of GHGs under existing provisions of the federal Clean Air Act.
The EPA already has adopted two sets of regulations regarding
possible future regulation of GHG emissions under the Clean Air
Act, one of which purports to regulate emissions of GHGs from
motor vehicles and the other of which would regulate emissions
of GHGs from large stationary sources of emissions, such as
power plants or industrial facilities effective January 2,
2011. In June 2010, EPA published its final rule to address
118
permitting of GHG emissions from stationary sources under the
Clean Air Act’s Prevention of Significant Deterioration
(“PSD”) and Title V permitting programs. The
final rule tailors the PSD and Title V permitting programs
to apply to certain stationary sources of GHG emissions in a
multi-step process, with the largest sources first subject to
permitting. The EPA’s rules relating to emissions of GHGs
from large stationary sources of emissions are currently subject
to a number of legal challenges but the federal courts have thus
far declined to issue any injunctions to prevent EPA from
implementing or requiring state environmental agencies to
implement the rules. Moreover, on October 30, 2009, the EPA
published a final rule requiring the reporting of GHG emissions
from specified large GHG emission sources in the U.S. on an
annual basis beginning in 2011 for emissions occurring in 2010.
On November 8, 2010, the EPA adopted amendments to this GHG
reporting rule, expanding the monitoring and reporting
obligations to include onshore and offshore oil and natural gas
production facilities and onshore oil and natural gas
processing, transmission, storage and distribution facilities on
an annual basis, beginning in 2012 for emissions occurring in
2011.
In addition, the U.S. Congress has from time to time
considered legislation to reduce emissions of GHGs, and almost
half of the states have already taken legal measures to reduce
emissions of GHGs, primarily through the planned development of
GHG emission inventories
and/or
regional GHG cap and trade programs. Most of these cap and trade
programs work by requiring either major sources of emissions,
such as electric power plants, or major producers of fuels, such
as refineries and NGL fractionation plants, to acquire and
surrender emission allowances. The number of allowances
available for purchase is reduced each year until the overall
GHG emission reduction goal is achieved. The adoption and
implementation of any regulations imposing GHG reporting or
permitting obligations on, or limiting emissions of GHGs from,
the Partnership’s equipment and operations could require
the Partnership to incur costs to reduce emissions of GHGs
associated with its operations, could adversely affect its
performance of operations in the absence of any permits that may
be required to regulate emission of greenhouse gases, or could
adversely affect demand for its natural gas and NGL processing
services.
Finally, it should be noted that some scientists have concluded
that increasing concentrations of greenhouse gases in the
Earth’s atmosphere may produce climate changes that have
significant physical effects, such as increased frequency and
severity of storms, droughts, and floods and other climatic
events; if any such effects were to occur, they could have in
adverse effect on the Partnership’s assets and operations.
Water
Discharges
The Federal Water Pollution Control Act, as amended (“Clean
Water Act” or “CWA”), and analogous state laws
impose restrictions and strict controls regarding the discharge
of pollutants into navigable waters. Pursuant to the CWA and
analogous state laws, permits must be obtained to discharge
pollutants into state waters or waters of the U.S. Any such
discharge of pollutants into regulated waters must be performed
in accordance with the terms of the permit issued by the EPA or
the analogous state agency. Spill prevention, control and
countermeasure requirements under federal law require
appropriate containment berms and similar structures to help
prevent the contamination of navigable waters in the event of a
petroleum hydrocarbon tank spill, rupture or leak. In addition,
the CWA and analogous state laws require individual permits or
coverage under general permits for discharges of storm water
runoff from certain types of facilities. These permits may
require the Partnership to monitor and sample the storm water
runoff. The CWA and analogous state laws can impose substantial
civil and criminal penalties for non-compliance including spills
and other non-authorized discharges.
It is customary to recover natural gas from deep shale
formations through the use of hydraulic fracturing, combined
with sophisticated horizontal drilling. Hydraulic fracturing
involves the injection of water, sand and chemical additives
under pressure into rock formations to stimulate gas production.
The process is typically regulated by state oil and gas
commissions. However, the EPA recently asserted federal
regulatory authority over hydraulic fracturing involving diesel
additives under the SDWA’s Underground Injection Control
Program. While the EPA has yet to take any action to enforce or
implement this newly asserted regulatory authority, industry
groups have filed suit challenging the EPA’s recent
decision. At the same time, the EPA has commenced a study of the
potential adverse impact of hydraulic fracturing
119
activities, with the initial results of the study expected to
be available in late 2012 and final results in 2014. Also,
legislation that was introduced in the recently completed 111th
session of Congress has been re-introduced in the 112th Congress
that would amend the SDWA to subject hydraulic fracturing
operations to regulation under the Act and require both
pre-fracturing and post-fracturing disclosure of chemicals used
by the oil and natural gas industry, and such legislation could
be introduced in the current session of Congress. Moreover, some
states have adopted, and other states, including Texas, are
considering adopting, regulations that could restrict hydraulic
fracturing in certain circumstances. Adoption of legislation or
of any implementing regulations placing restrictions on
hydraulic fracturing activities could impose operational delays,
increased operating costs and additional regulatory burdens on
exploration and production operators, which could reduce their
production of natural gas and, in turn, adversely affect our
revenues and results of operation by decreasing the volumes of
natural gas that the Partnership gathers, processes and
fractionates. Moreover, required disclosure without protection
for trade secret or proprietary products could discourage
service companies from using such products and as a result
impact the degree to which some oil and natural gas wells may be
efficiently and economically completed or brought into
production.
The Oil Pollution Act of 1990, as amended (“OPA”),
which amends the CWA, establishes strict liability for owners
and operators of facilities that are the site of a release of
oil into waters of the United States. OPA and its associated
regulations impose a variety of requirements on responsible
parties related to the prevention of oil spills and liability
for damages resulting from such spills. A “responsible
party” under OPA includes owners and operators of onshore
facilities, such as the Partnership’s plants, and the
Partnership’s pipelines. Under OPA, owners and operators of
facilities that handle, store, or transport oil are required to
develop and implement oil spill response plans, and establish
and maintain evidence of financial responsibility sufficient to
cover liabilities related to an oil spill for which such parties
could be statutorily responsible. We believe that the
Partnership is in substantial compliance with the CWA, SDWA, OPA
and analogous state laws.
Endangered
Species Act
The federal Endangered Species Act, as amended
(“ESA”), restricts activities that may affect
endangered or threatened species or their habitats. While some
of the Partnership’s facilities may be located in areas
that are designated as habitat for endangered or threatened
species, we believe that the Partnership is in substantial
compliance with the ESA. However, the designation of previously
unidentified endangered or threatened species could cause the
Partnership to incur additional costs or become subject to
operating restrictions or bans in the affected areas.
Pipeline
Safety
The pipelines used by the Partnership to gather and transport
natural gas and transport NGLs are subject to regulation by the
DOT under the Natural Gas Pipeline Safety Act of 1968, as
amended (“NGPSA”), with respect to natural gas and the
Hazardous Liquids Pipeline Safety Act of 1979, as amended
(“HLPSA”), with respect to crude oil, NGLs and
condensates. The NGPSA and HLPSA govern the design,
installation, testing, construction, operation, replacement and
management of natural gas and NGL pipeline facilities. Pursuant
to these acts, the DOT has promulgated regulations governing
pipeline wall thickness, design pressures, maximum operating
pressures, pipeline patrols and leak surveys, minimum depth
requirements, and emergency procedures, as well as other matters
intended to ensure adequate protection for the public and to
prevent accidents and failures. Where applicable, the NGPSA and
HLPSA require any entity that owns or operates pipeline
facilities to comply with the regulations under these acts, to
permit access to and allow copying of records and to make
certain reports and provide information as required by the
Secretary of Transportation. We believe that the
Partnership’s pipeline operations are in substantial
compliance with applicable NGPSA and HLPSA requirements;
however, due to the possibility of new or amended laws and
regulations or reinterpretation of existing laws and
regulations, future compliance with the NGPSA and HLPSA could
result in increased costs.
120
The Partnership’s pipelines are also subject to regulation
by the DOT under the Pipeline Safety Improvement Act of 2002,
which was amended by the Pipeline Inspection, Protection,
Enforcement, and Safety Act of 2006 (“PIPES Act”). The
DOT, through the Pipeline and Hazardous Materials Safety
Administration (“PHMSA”) has established a series of
rules, which require pipeline operators to develop and implement
integrity management programs for gas transmission pipelines
that, in the event of a failure, could affect “high
consequence areas.” “High consequence areas” are
currently defined as areas with specified population densities,
buildings containing populations of limited mobility and areas
where people gather that are located along the route of a
pipeline. Similar rules are also in place for operators of
hazardous liquid pipelines including lines transporting NGLs and
condensates.
In addition, states have adopted regulations, similar to
existing DOT regulations, for intrastate gathering and
transmission lines. Texas and Louisiana have developed
regulatory programs that parallel the federal regulatory scheme
and are applicable to intrastate pipelines transporting natural
gas and NGLs. We currently estimate an annual average cost of
$2.2 million for years 2011 through 2013 to perform
necessary integrity management program testing on the
Partnership’s pipelines required by existing DOT and state
regulations. This estimate does not include the costs, if any,
of any repair, remediation, preventative or mitigating actions
that may be determined to be necessary as a result of the
testing program, which costs could be substantial. However, we
do not expect that any such costs would be material to the
Partnership’s financial condition or results of operations.
More recently, on December 3, 2009, the PHMSA issued a
final rule mandated by the PIPES Act focusing on how human
interactions of control room personnel, such as avoidance of
error or the performance of mitigating actions, may impact
pipeline system integrity. Among other things, the final rule
requires operators of hazardous liquid and gas pipelines to
amend their existing written operations and maintenance
procedures, operator qualification programs and emergency plans
to take into account such items as specificity of the
responsibilities and roles of control room personnel; listing of
planned pipeline-related occurrences during a particular shift
that may be easily shared with other controllers during a shift
turnover; establishment of appropriate shift rotations to
protect against controller fatigue; and development of
appropriate communications between controllers, management and
field personnel when planning and implementing changes to
pipeline equipment or operations. We do not anticipate that the
rule, as issued in final form, will result in substantial costs
with respect to the Partnership’s operations.
Employee
Health and Safety
We and the Partnership are subject to a number of federal and
state laws and regulations, including the federal Occupational
Safety and Health Act, as amended (“OSHA”), and
comparable state statutes, whose purpose is to protect the
health and safety of workers, both generally and within the
pipeline industry. In addition, the OSHA hazard communication
standard, the EPA community
right-to-know
regulations under Title III of the Federal Superfund
Amendment and Reauthorization Act and comparable state statutes
require that information be maintained concerning hazardous
materials used or produced in the Partnership’s operations
and that this information be provided to employees, state and
local government authorities and citizens. The Partnership and
the entities in which it owns an interest are also subject to
OSHA Process Safety Management regulations, which are designed
to prevent or minimize the consequences of catastrophic releases
of toxic, reactive, flammable or explosive chemicals. These
regulations apply to any process which involves a chemical at or
above the specified thresholds or any process which involves
flammable liquid or gas, pressurized tanks, caverns and wells in
excess of 10,000 pounds at various locations. Flammable liquids
stored in atmospheric tanks below their normal boiling point
without the benefit of chilling or refrigeration are exempt. The
Partnership has an internal program of inspection designed to
monitor and enforce compliance with worker safety requirements.
We believe that the Partnership is in substantial compliance
with all applicable laws and regulations relating to worker
health and safety.
121
Title to
Properties and
Rights-of-Way
The Partnership’s real property falls into two categories:
(1) parcels that it owns in fee and (2) parcels in
which its interest derives from leases, easements,
rights-of-way,
permits or licenses from landowners or governmental authorities
permitting the use of such land for its operations. Portions of
the land on which the Partnership’s plants and other major
facilities are located are owned by the Partnership in fee
title, and we believe that the Partnership has satisfactory
title to these lands. The remainder of the land on which the
Partnership’s plant sites and major facilities are located
is held by the Partnership pursuant to ground leases between the
Partnership, as lessee, and the fee owner of the lands, as
lessors. The Partnership, or its predecessors, has leased these
lands for many years without any material challenge known to us
relating to the title to the land upon which the assets are
located, and we believe that the Partnership has satisfactory
leasehold estates to such lands. We have no knowledge of any
challenge to the underlying fee title of any material lease,
easement,
right-of-way,
permit or license held by the Partnership, and we believe that
the Partnership has satisfactory title to all of its material
leases, easements,
rights-of-way,
permits and licenses.
We may continue to hold record title to portions of certain
assets until we make the appropriate filings in the
jurisdictions in which such assets are located and obtain any
consents and approvals that are not obtained prior to transfer.
Such consents and approvals would include those required by
federal and state agencies or political subdivisions. In some
cases, we may, where required consents or approvals have not
been obtained, temporarily hold record title to property as
nominee for our benefit and in other cases may, on the basis of
expense and difficulty associated with the conveyance of title,
causing us to retain title, as nominee for our benefit, until a
future date. We anticipate that there will be no material change
in the tax treatment of our common units resulting from our
holding of title to any part of such assets subject to future
conveyance or as our nominee.
Employees
Through our subsidiaries, we employ approximately
1,020 people who primarily support the Partnership’s
operations. None of these employees are covered by collective
bargaining agreements. We consider our employee relations to be
good.
Legal
Proceedings
On December 8, 2005, WTG filed suit in the
333rd District Court of Harris County, Texas against
several defendants, including Targa and two other Targa entities
and private equity funds affiliated with Warburg Pincus LLC,
seeking damages from the defendants. The suit alleges that Targa
and private equity funds affiliated with Warburg Pincus, along
with ConocoPhillips Company (“ConocoPhillips”) and
Morgan Stanley, tortiously interfered with (i) a contract
WTG claims to have had to purchase SAOU from ConocoPhillips and
(ii) prospective business relations of WTG. WTG claims the
alleged interference resulted from Targa’s competition to
purchase the ConocoPhillips’ assets and its successful
acquisition of those assets in 2004. In October 2007, the
District Court granted defendants’ motions for summary
judgment on all of WTG’s claims. In February 2010, the
14th Court of Appeals affirmed the District Court’s
final judgment in favor of defendants in its entirety. In
January 2011, the Texas Supreme Court denied WTG’s petition
for review of the lower court’s judgment and in March 2011,
the Texas Supreme Court denied WTG’s motion for rehearing
of the Court’s denial to review WTG’s appeal. We have
agreed to indemnify the Partnership for any claim or liability
arising out of the WTG suit.
Except as provided above, neither we nor the Partnership is a
party to any other legal proceedings other than legal
proceedings arising in the ordinary course of our business. The
Partnership is a party to various administrative and regulatory
proceedings that have arisen in the ordinary course of its
business. See “—Regulation of Operations” and
“—Environmental, Health and Safety Matters.”
122
MANAGEMENT
Targa Resources
Corp.
Our executive officers listed below serve in the same capacity
for the General Partner and devote their time as needed to
conduct the business and affairs of both the Company and the
Partnership. Because our only cash-generating assets are direct
and indirect partnership interests in the Partnership, we expect
that our executive officers will devote a substantial majority
of their time to the Partnership’s business. We expect the
amount of time that our executive officers devote to our
business as opposed to the Partnership’s business in future
periods will not be substantial unless significant changes are
made to the nature of our business.
Our directors hold office until the earlier of their death,
resignation, removal or disqualification or until their
successors have been elected and qualified. Officers serve at
the discretion of the board of directors. There are no family
relationships among any of our directors or executive officers.
Please read “Certain Relationships and Related
Transactions—Stockholders’ Agreement” for a
discussion of arrangements among our stockholders pursuant to
which our directors were selected prior to our IPO. The
following table sets forth certain information with respect to
our directors, executive officers and other officers as of
April 12, 2011.
| |
|
|
|
|
|
|
|
Name
|
|
Age
|
|
Position
|
|
|
|
Rene R. Joyce
|
|
|
63
|
|
|
Chief Executive Officer and Director
|
|
James W. Whalen
|
|
|
69
|
|
|
Executive Chairman and Director
|
|
Joe Bob Perkins
|
|
|
50
|
|
|
President
|
|
Jeffrey J. McParland
|
|
|
56
|
|
|
President-Finance and Administration
|
|
Roy E. Johnson
|
|
|
66
|
|
|
Executive Vice President
|
|
Michael A. Heim
|
|
|
62
|
|
|
Executive Vice President and Chief Operating Officer
|
|
Paul W. Chung
|
|
|
51
|
|
|
Executive Vice President, General Counsel and Secretary
|
|
Matthew J. Meloy
|
|
|
33
|
|
|
Senior Vice President and Chief Financial Officer
|
|
John R. Sparger
|
|
|
57
|
|
|
Senior Vice President and Chief Accounting Officer
|
|
Charles R. Crisp
|
|
|
63
|
|
|
Director
|
|
In Seon Hwang
|
|
|
34
|
|
|
Director
|
|
Peter R. Kagan
|
|
|
42
|
|
|
Director
|
|
Chris Tong
|
|
|
54
|
|
|
Director
|
|
Ershel C. Redd Jr.
|
|
|
63
|
|
|
Director
|
Rene R. Joyce has served as a director and Chief
Executive Officer of the Company since its formation on
October 27, 2005, of the General Partner since October 2006
and of TRI since its formation in February 2004 and was a
consultant for the TRI predecessor company during 2003. He is
also a member of the supervisory directors of Core Laboratories
N.V. Mr. Joyce served as a consultant in the energy
industry from 2000 through 2003 providing advice to various
energy companies and investors regarding their operations,
acquisitions and dispositions. Mr. Joyce served as
President of onshore pipeline operations of Coral Energy, LLC, a
subsidiary of Shell Oil Company (“Shell”) from 1998
through 1999 and President of energy services of Coral Energy
Holding, L.P. (“Coral”), a subsidiary of Shell which
was the gas and power marketing joint venture between Shell and
Tejas Gas Corporation (“Tejas”), during 1999.
Mr. Joyce served as President of various operating
subsidiaries of Tejas, a natural gas pipeline company, from 1990
until 1998 when Tejas was acquired by Shell. As the founding
Chief Executive Officer of TRI, Mr. Joyce brings deep
experience in the midstream business, expansive knowledge of the
oil and gas industry, as well as relationships with chief
executives and other senior management at peer companies,
customers and other oil and natural gas companies throughout the
world. His experience and industry knowledge,
123
complemented by an engineering and legal educational background,
enable Mr. Joyce to provide the board with executive
counsel on the full range of business, technical, and
professional matters.
James W. Whalen has served as Executive Chairman of the
Company’s board of directors since October 25, 2010,
and the General Partner’s board of directors since
December 15, 2010. He served as a director of the Company
since its formation on October 27, 2005, of the General
Partner since February 2007 and of TRI since 2004.
Mr. Whalen served as President-Finance and Administration
of the Company and of TRI between January 2006 and
October 25, 2010. He has served as President-Finance and
Administration of the General Partner since October 2006 and for
various Targa subsidiaries since November 2005. Between October
2002 and October 2005, Mr. Whalen served as the Senior Vice
President and Chief Financial Officer of Parker Drilling
Company. Between January 2002 and October 2002, he was the Chief
Financial Officer of Diversified Diagnostic Products, Inc. He
served as Chief Commercial Officer of Coral from February 1998
through January 2000. Previously, he served as Chief Financial
Officer for Tejas from 1992 to 1998. Mr. Whalen brings a
breadth and depth of experience as an executive, board member,
and audit committee member across several different companies
and in energy and other industry areas. His valuable management
and financial expertise includes an understanding of the
accounting and financial matters that the Partnership and
industry address on a regular basis.
Joe Bob Perkins has served as President of the Company
since its formation on October 27, 2005, of the General
Partner since October 2006 and of TRI since February 2004 and
was a consultant for the TRI predecessor company during 2003.
Mr. Perkins also served as a consultant in the energy
industry from 2002 through 2003 and was an active partner in RTM
Media (an outdoor advertising firm) during such time period.
Mr. Perkins served as President and Chief Operating Officer
for the Wholesale Businesses, Wholesale Group and Power
Generation Group of Reliant Resources, Inc. and its
parent/predecessor companies, from 1998 to 2002 and Vice
President, Corporate Planning and Development, of Houston
Industries from 1996 to 1998. He served as Vice President,
Business Development, of Coral from 1995 to 1996 and as
Director, Business Development, of Tejas from 1994 to 1995.
Prior to 1994, Mr. Perkins held various positions with the
consulting firm of McKinsey & Company and with an
exploration and production company.
Roy E. Johnson has served as Executive Vice President of
the Company since its formation on October 27, 2005, of the
General Partner since October 2006 and of TRI since April 2004
and was a consultant for the TRI predecessor company during
2003. Mr. Johnson also served as a consultant in the energy
industry from 2000 through 2003 providing advice to various
energy companies and investors regarding their operations,
acquisitions and dispositions. He served as Vice President,
Business Development and President of the International Group of
Tejas from 1995 to 2000. In these positions, he was responsible
for acquisitions, pipeline expansion and development projects in
North and South America. Mr. Johnson served as President of
Louisiana Resources Company, a company engaged in intrastate
natural gas transmission, from 1992 to 1995. Prior to 1992,
Mr. Johnson held various positions with a number of
different companies in the upstream and downstream energy
industry.
Michael A. Heim has served as Executive Vice President
and Chief Operating Officer of the Company since its formation
on October 27, 2005, of the General Partner since October
2006 and of TRI since April 2004 and was a consultant for the
TRI predecessor company during 2003. Mr. Heim also served
as a consultant in the energy industry from 2001 through 2003
providing advice to various energy companies and investors
regarding their operations, acquisitions and dispositions.
Mr. Heim served as Chief Operating Officer and Executive
Vice President of Coastal Field Services, a subsidiary of The
Coastal Corp. (“Coastal”) a diversified energy
company, from 1997 to 2001 and President of Coastal States Gas
Transmission Company from 1997 to 2001. In these positions, he
was responsible for Coastal’s midstream gathering,
processing, and marketing businesses. Prior to 1997, he served
as an officer of several other Coastal exploration and
production, marketing and midstream subsidiaries.
Jeffrey J. McParland has served as President-Finance and
Administration of the Company and TRI since October 25,
2010 and of the General Partner since December 15, 2010. He
has also served as a director of TRI since December 16,
2010. Mr. McParland served as Executive Vice President and
Chief Financial Officer of the Company between October 27,
2005 and October 25, 2010 and of TRI between April 2004 and
124
October 25, 2010 and was a consultant for the TRI
predecessor company during 2003. He served as Executive Vice
President and Chief Financial Officer of the General Partner
between October 2006 and December 15, 2010 and served as a
director of the General Partner from October 2006 to February
2007. Mr. McParland served as Treasurer of the Company from
October 27, 2005 until May 2007, of the General Partner
from October 2006 until May 2007 and of TRI from April 2004
until May 2007. Mr. McParland served as Secretary of TRI
between February 2004 and May 2004, at which time he was elected
as Assistant Secretary. Mr. McParland served as Senior Vice
President, Finance of Dynegy Inc., a company engaged in power
generation, the midstream natural gas business and energy
marketing, from 2000 to 2002. In this position, he was
responsible for corporate finance and treasury operations
activities. He served as Senior Vice President, Chief Financial
Officer and Treasurer of PG&E Gas Transmission, a midstream
natural gas and regulated natural gas pipeline company, from
1999 to 2000. Prior to 1999, he worked in various engineering
and finance positions with companies in the power generation and
engineering and construction industries.
Paul W. Chung has served as Executive Vice President,
General Counsel and Secretary of the Company since its formation
on October 27, 2005, of the General Partner since October
2006 and of TRI since May 2004. Mr. Chung served as
Executive Vice President and General Counsel of Coral from 1999
to April 2004; Shell Trading North America Company, a subsidiary
of Shell, from 2001 to April 2004; and Coral Energy, LLC from
1999 to 2001. In these positions, he was responsible for all
legal and regulatory affairs. He served as Vice President and
Assistant General Counsel of Tejas from 1996 to 1999. Prior to
1996, Mr. Chung held a number of legal positions with
different companies, including the law firm of
Vinson & Elkins L.L.P.
Matthew J. Meloy has served as Senior Vice President,
Chief Financial Officer and Treasurer of the Company and TRI
since October 25, 2010 and of the General Partner since
December 15, 2010. Mr. Meloy served as Vice
President-Finance and Treasurer of the Company and TRI between
March 2008 and October 2010, and as Director, Corporate
Development of the Company and TRI between March 2006 and March
2008 and of the General Partner between October 2006 and March
2008. He served as Vice President—Finance and Treasurer of
the General Partner between March 2008 and December 15,
2010. Mr. Meloy was with The Royal Bank of Scotland in the
structured finance group, focusing on the energy sector from
October 2003 to March 2006, most recently serving as Assistant
Vice President.
John R. Sparger has served as Senior Vice President and
Chief Accounting Officer of the Company and TRI since January
2006 and of the General Partner since October 2006.
Mr. Sparger served as Vice President, Internal Audit of the
Company between October 2005 and January 2006 and of TRI between
November 2004 and January 2006. Mr. Sparger served as a
consultant in the energy industry from 2002 through September
2004, including TRI between February 2004 and September 2004,
providing advice to various energy companies and entities
regarding processes, systems, accounting and internal controls.
Prior to 2002, he worked in various accounting and
administrative positions with companies in the energy industry,
audit and consulting positions in public accounting and
consulting positions with a large international consulting firm.
Charles R. Crisp has served as a director of the Company
since its formation on October 27, 2005 and of TRI between
February 2004 and December 16, 2010. Mr. Crisp was
President and Chief Executive Officer of Coral Energy, LLC, a
subsidiary of Shell Oil Company from 1999 until his retirement
in November 2000, and was President and Chief Operating Officer
of Coral from January 1998 through February 1999. Prior to this,
Mr. Crisp served as President of the power generation group
of Houston Industries and, between 1988 and 1996, as President
and Chief Operating Officer of Tejas. Mr. Crisp is also a
director of AGL Resources Inc., EOG Resources Inc. and
Intercontinental Exchange, Inc. Mr. Crisp brings extensive
energy experience, a vast understanding of many aspects of our
industry and experience serving on the boards of other public
companies in the energy industry. His leadership and business
experience and deep knowledge of various sectors of the energy
industry bring a crucial insight to the board of directors.
In Seon Hwang has served as a director of the Company
since May 2006, of TRI between May 2006 and December 16,
2010, and of the General Partner since February 2011.
Mr. Hwang is a Member and Managing Director of Warburg
Pincus LLC and a general partner of Warburg Pincus &
Co., where he has
125
been employed since 2004, and became a partner of Warburg
Pincus & Co. in 2009. Prior to joining Warburg Pincus,
Mr. Hwang worked at GSC Partners, a distressed investment
firm, from 2002 until 2004, the M&A group at Goldman Sachs
from 1998 to 2000, and the Boston Consulting Group from 1997 to
1998. He is also a director of Competitive Power Ventures and
serves on the investment committee of Sheridan Production
Partners LLC. Mr. Hwang serves as a director because
certain investment funds managed by Warburg Pincus LLC, for whom
Mr. Hwang is a managing director and member, control us
through their ownership of securities in Targa Resources Corp.
Mr. Hwang has significant experience with energy companies
and investments and broad familiarity with the industry and
related transactions and capital markets activity, which enhance
his contributions to the board of directors.
Peter R. Kagan has served as a director of the Company
since its formation on October 27, 2005, of the General
Partner since February 2007 and of TRI between February 2004 and
December 2010. Mr. Kagan is a member and Managing Director
of Warburg Pincus LLC and a general partner of Warburg
Pincus & Co., where he has been employed since 1997
and became a partner of Warburg Pincus & Co. in 2002.
He is also a member of Warburg Pincus’ Executive Management
Group. He is also a director of Antero Resources Corporation,
Broad Oak, Canbriam Energy, Fairfield Energy Limited, Laredo
Petroleum and MEG Energy Corp. Mr. Kagan serves as a
director because certain investment funds managed by Warburg
Pincus LLC, for whom Mr. Kagan is a managing director and
member, control us through their ownership of securities in
Targa Resources Corp. Mr. Kagan has significant experience
with energy companies and investments and broad familiarity with
the industry and related transactions and capital markets
activity, which enhance his contributions to the board of
directors.
Chris Tong has served as a director of the Company since
January 2006 and of TRI between January 2006 and
December 16, 2010. Mr. Tong is a director of Cloud
Peak Energy Inc. and Kosmos Energy Holdings. He served as Senior
Vice President and Chief Financial Officer of Noble Energy, Inc.
from January 2005 until August 2009. He also served as Senior
Vice President and Chief Financial Officer for Magnum Hunter
Resources, Inc. from August 1997 until December 2004. Prior
thereto, he was Senior Vice President of Finance of Tejas
Acadian Holding Company and its subsidiaries, including Tejas
Gas Corp., Acadian Gas Corporation and Transok, Inc., all of
which were wholly-owned subsidiaries of Tejas Gas Corporation.
Mr. Tong held these positions from August 1996 until August
1997, and had served in other treasury positions with Tejas
since August 1989. Mr. Tong brings a breadth and depth of
experience as a chief financial officer in the energy industry,
a financial executive, a director of another public company and
member of another audit committee. He brings significant
financial, capital markets and energy industry experience to the
board and in his position as the chairman of our Audit Committee.
Ershel C. Redd Jr. has served as a director of the
Company since February 2011. Mr. Redd has served as a
consultant in the energy industry since 2008 providing advice to
various energy companies and investors regarding their
operations, acquisitions and dispositions. Mr. Redd was
President and Chief Executive Officer of El Paso Electric
Company, a public utility company, from May 2007 until March
2008. Prior to this, Mr. Redd served in various positions
with NRG Energy, Inc., a wholesale energy company, including as
Executive Vice President—Commercial Operations from October
2002 through July 2006, as President—Western Region from
February 2004 through July 2006, and as a director between May
2003 and December 2003. On May 14, 2003, NRG filed for
protection under Chapter 11 of the Federal Bankruptcy Code.
On November 24, 2003, NRG’s Chapter 11 Plan of
Reorganization was confirmed. Mr. Redd served as Vice
President of Business Development for Xcel Energy Markets, a
unit of Xcel Energy Inc., from 2000 through 2002, and as
President and Chief Operating Officer for New Century
Energy’s (predecessor to Xcel Energy Inc.) subsidiary,
Texas Ohio Gas Company, from 1997 through 2000. Mr. Redd
brings to the Company extensive energy industry experience, a
vast understanding of varied aspects of the energy industry and
experience in corporate performance, marketing and trading of
natural gas and natural gas liquids, risk management, finance,
acquisitions and divestitures, business development, regulatory
relations and strategic planning. His leadership and business
experience and deep knowledge of various sectors of the energy
industry bring a crucial insight to the board of directors.
126
Board of
Directors
Our board of directors consists of seven members. Please read
“Certain Relationships and Related
Transactions—Stockholders’ Agreement” for a
description of arrangements pursuant to which our directors were
elected prior to the completion of our IPO. The board reviewed
the independence of our directors using the independence
standards of the NYSE and various other factors discussed under
“Certain Relationships and Related
Transactions—Director Independence” and, based on this
review, determined that Messrs. Crisp, Hwang, Kagan, Redd
and Tong are independent within the meaning of the NYSE listing
standards currently in effect.
Our directors are divided into three classes serving staggered
three-year terms. Class I, Class II and Class III
directors will serve until our annual meetings of stockholders
in 2011, 2012 and 2013, respectively. The Class I directors
are Messrs. Crisp and Whalen, the Class II directors
are Messrs. Redd and Hwang and the Class III directors
are Messrs. Kagan, Tong and Joyce. At each annual meeting
of stockholders, directors will be elected to succeed the class
of directors whose terms have expired. This classification of
our board of directors could have the effect of increasing the
length of time necessary to change the composition of a majority
of the board of directors. In general, at least two annual
meetings of stockholders will be necessary for stockholders to
effect a change in a majority of the members of the board of
directors.
Committees of the
Board of Directors
Our board of directors has four standing committees—an
Audit Committee, a Compensation Committee, a Nominating and
Governance Committee and a Conflicts Committee—and may have
such other committees as the board of directors shall determine
from time to time. Each of the standing committees of the board
of directors has the composition and responsibilities described
below.
Audit
Committee
The members of our Audit Committee are Messrs. Tong, Redd
and Crisp. Mr. Tong is the Chairman of this committee. Our
board of directors has affirmatively determined that
Messrs. Crisp, Redd, and Tong are independent as described
in the rules of the NYSE and the Securities Exchange Act of
1934, as amended (the “Exchange Act”). Our board of
directors has also determined that, based upon relevant
experience, Mr. Tong is an “audit committee financial
expert” as defined in Item 407 of
Regulation S-K
of the Exchange Act.
This committee oversees, reviews, acts on and reports on various
auditing and accounting matters to our board of directors,
including: the selection of our independent accountants, the
scope of our annual audits, fees to be paid to the independent
accountants, the performance of our independent accountants and
our accounting practices. In addition, the Audit Committee
oversees our compliance programs relating to legal and
regulatory requirements. We have adopted an Audit Committee
charter defining the committee’s primary duties in a manner
consistent with the rules of the SEC and NYSE or market
standards.
Compensation
Committee
The members of our Compensation Committee are
Messrs. Kagan, Crisp and Hwang. Mr. Crisp is the
Chairman of this committee. This committee establishes salaries,
incentives and other forms of compensation for officers and
other employees. Our Compensation Committee also administers our
incentive compensation and benefit plans. We have adopted a
Compensation Committee charter defining the committee’s
primary duties in a manner consistent with the rules of the SEC
and NYSE or market standards.
Nominating and
Governance Committee
The members of our Nominating and Governance Committee are
Messrs. Kagan, Redd and Tong. Mr. Kagan is the
Chairman of this committee. This committee identifies, evaluates
and recommends qualified nominees to serve on our board of
directors, develops and oversees our internal corporate
127
governance processes and maintains a management succession plan.
We have adopted a Nominating and Governance Committee charter
defining the committee’s primary duties in a manner
consistent with the rules of the SEC and NYSE or market
standards.
In evaluating the director candidates, the Nominating and
Governance Committee assesses whether a candidate possesses the
integrity, judgment, knowledge, experience, skills and expertise
that are likely to enhance the board’s ability to manage
and direct the affairs and business of the Company, including,
when applicable, to enhance the ability of committees of the
board to fulfill their duties.
Conflicts
Committee
The members of our Conflicts Committee are Messrs. Crisp,
Redd and Tong. Mr. Tong is the Chairman of this committee.
This Committee reviews matters of potential conflicts of
interest, as directed by our board of directors. We adopted a
Conflicts Committee charter defining the committee’s
primary duties.
Compensation
Committee Interlocks and Insider Participation
No member of our Compensation Committee has been at any time an
employee of ours. None of our executive officers served on the
board of directors or compensation committee of a company that
has an executive officer that served on our board or
Compensation Committee. No member of our board is an executive
officer of a company in which one of our executive officers
serves as a member of the board of directors or compensation
committee of that company.
Messrs. Kagan and Joung, both of whom were members of our
Compensation Committee during 2010, were affiliates of Warburg
Pincus during 2010. Mr. Joung resigned from our
Compensation Committee in February 2011. Messrs. Kagan and
Joung were directors of Broad Oak during 2010, from whom we
bought natural gas and NGL products and in which affiliates of
Warburg Pincus own a controlling interest. Messrs. Kagan
and Joung are party to indemnification agreements with us.
Warburg Pincus was a party to the Stockholders Agreement and is
a party to the Registration Rights Agreement with us. The
Stockholders Agreement was terminated in connection with the
IPO. Mr. Kagan was also a director of Antero Resources
Corporation (“Antero”) during 2010, from whom we
bought natural gas and NGL products and in which affiliates of
Warburg Pincus own a controlling interest. Please read
“Certain Relationships and Related Transactions” for a
description of these transactions.
Code of Business
Conduct and Ethics
Our board of directors has adopted a Code of Ethics For Chief
Executive Officer and Senior Financial Officers (the “Code
of Ethics”), which applies to our Chief Executive Officer,
Chief Financial Officer, Chief Accounting Officer, Controller
and all of our other senior financial and accounting officers,
and TRI Resources Inc.’s Code of Conduct (the “Code of
Conduct”), which applies to officers, directors and
employees of TRI Resources Inc. and its subsidiaries. In
accordance with the disclosure requirements of applicable law or
regulation, we intend to disclose any amendment to, or waiver
from, any provision of the Code of Ethics or Code of Conduct
under Item 5.05 of a current report on
Form 8-K.
Corporate
Governance Guidelines
Our board of directors has adopted corporate governance
guidelines in accordance with the corporate governance rules of
the NYSE.
Executive
Compensation
Compensation
Discussion and Analysis
The following discussion and analysis contains statements
regarding our and our executive officers’ future
performance targets and goals. These targets and goals are
disclosed in the limited context of our
128
compensation programs and should not be understood to be
statements of management’s expectations or estimates of
results or other guidance.
Overview
Prior to our IPO in December 2010, under the terms of our
Amended and Restated Stockholders’ Agreement, as amended
(the “Stockholders’ Agreement”) that was in
effect until the closing of the IPO, compensatory arrangements
with our executive officers identified in the Summary
Compensation Table (“named executive officers”) were
required to be submitted to a vote of our stockholders unless
such arrangements were approved by the Compensation Committee
(the “Compensation Committee”) of our board of
directors. As such, the Compensation Committee was responsible
for overseeing the development of an executive compensation
philosophy, strategy, framework and individual compensation
elements for our named executive officers that were based on our
business priorities.
The Stockholders’ Agreement terminated upon completion of
the IPO. Compensatory arrangements with our named executive
officers will remain the responsibility of our Compensation
Committee.
The following Compensation Discussion and Analysis describes the
material elements of compensation for our named executive
officers as determined by the Compensation Committee.
Compensation
Philosophy
The Compensation Committee believes that total compensation of
executives should be competitive with the market in which we
compete for executive talent which encompasses not only
midstream natural gas companies, but also other energy industry
companies as described in “The Role of Peer Groups and
Benchmarking” below. The following compensation objectives
guide the Compensation Committee in its deliberations about
executive compensation matters:
|
|
|
| |
•
|
provide a competitive total compensation program that enables us
to attract and retain key executives;
|
| |
| |
•
|
ensure an alignment between our strategic and financial
performance and the total compensation received by our named
executive officers;
|
| |
| |
•
|
provide compensation for performance that reflects individual
and company performance both in absolute terms and relative to
our peer group;
|
| |
| |
•
|
ensure a balance between short-term and long-term compensation
while emphasizing at-risk or variable, compensation as a
valuable means of supporting our strategic goals and aligning
the interests of our named executive officers with those of our
shareholders; and
|
| |
| |
•
|
ensure that our total compensation program supports our business
objectives and priorities.
|
Consistent with this philosophy and compensation objectives, we
do not pay for perquisites for any of our named executive
officers, other than parking subsidies.
The Role of
Peer Groups and Benchmarking
Our Chief Executive Officer (the “CEO”), President and
President—Finance and Administration (collectively,
“Senior Management”) review compensation practices at
peer companies, as well as broader industry compensation
practices, at a general level and by individual position to
ensure that our total compensation is reasonably comparable to
industry practice and meets our compensation objectives. In
addition, when evaluating compensation levels for each named
executive officer, the Compensation Committee reviews publicly
available compensation data for executives in our peer group,
compensation surveys and compensation levels for each named
executive officer with respect to their roles and levels of
responsibility, accountability and decision-making authority.
Although Senior Management and the Compensation Committee
consider compensation data from other companies,
129
they do not attempt to set compensation components to meet
specific benchmarks, such as salaries “above the
median” or total compensation “at the
50th percentile.” The peer company data that is
reviewed by Senior Management and the Compensation Committee is
simply one factor out of many that is used in connection with
the establishment of the compensation for our officers. The
other factors considered by Senior Management and the
Compensation Committee include, but are not limited to,
(i) available compensation data about rankings and
comparisons, (ii) effort and accomplishment on a group
basis, (iii) challenges faced and challenges overcome,
(iv) unique skills, (v) contribution to the management
team and (vi) the perception of both the board of directors
and the Compensation Committee of performance relative to
expectations, actual market/business conditions and peer company
performance. All of these factors, including peer company data,
are utilized in a subjective assessment of each year’s
decisions relating to annual cash incentives, long-term
incentives and base compensation changes with a view towards
total compensation and
pay-for-performance.
As part of the annual review process conducted in 2009 for 2010
compensation, Senior Management identified peer companies in the
midstream energy industry and reviewed compensation information
filed by the peer companies with the SEC. The peer group
reviewed by Senior Management and the Compensation Committee for
2010 consisted of the following companies: Atlas Pipeline
Partners, L.P., Copano Energy L.L.C., Crosstex Energy, L.P., DCP
Midstream Partners LP, Enbridge Energy Partners LP, Energy
Transfer Partners, LP, Magellan Midstream Partners LP, MarkWest
Energy Partners, LP, Martin Midstream Partners, NuStar Energy,
ONEOK Partners, LP, Plains All American Pipeline Partners, LP,
Regency Energy Partners LP, TEPPCO Partners and Williams
Partners LP. During the second quarter of 2010, following its
initial review relating to 2010 compensation, the Compensation
Committee engaged BDO USA, LLP (“BDO”), a compensation
consultant, to conduct a new review of executive and key
employee compensation to help it assure that compensation goals
were being met and that the most recent trends in compensation
were appropriately considered. In this additional review
process, the peer companies were reassessed to determine whether
the peer groups for long-term cash incentive awards (performance
units) and for compensation comparison and analysis remained
appropriate and adequately reflected the market for executive
talent. As a result, the peer group used for long-term cash
incentive awards and for compensation comparison was expanded
and weighted to include energy companies other than midstream
master limited partnerships (“MLPs”) to better reflect
the market for executive talent in the energy industry. Because
many companies in the expanded peer group are larger than the
Company as measured by market capitalization and total assets,
with the assistance of BDO, compensation data for the peer
companies was analyzed using multiple regression analysis to
develop a prediction of the total compensation that peer
companies of comparable size to the Company would offer
similarly-situated executives. This regressed data was then
weighted as follows to develop a reference point for judging the
adequacy of executive pay at the Company: MLPs (given a 70%
weighting), exploration and production companies
(“E&Ps”) (given a 15% weighting) and utility
companies (given a 15% weighting). The peer group companies in
each of the three categories are:
|
|
|
| |
•
|
MLP peer companies: Atlas Pipeline Partners, L.P., Copano
Energy, L.L.C., Crosstex Energy, LP, DCP Midstream Partners, LP,
Enbridge Energy Partners LP, Energy Transfer Partners, LP,
Enterprise Products Partners LP, Magellan Midstream Partners,
LP, MarkWest Energy Partners, LP, NuStar Energy LP, ONEOK
Partners, LP, Regency Energy Partners LP and Williams Partners LP
|
| |
| |
•
|
E&P peer companies: Cabot Oil & Gas Corp.,
Cimarex Energy Co., Denbury Resources Inc., EOG Resources Inc.,
Murphy Oil Corp., Newfield Exploration Co., Noble Energy Inc.,
Penn Virginia Corp., Petrohawk Energy Corp., Pioneer Natural
Resources Co., Southwestern Energy Co. and Ultra Petroleum Corp.
|
| |
| |
•
|
Utility peer companies: Centerpoint Energy Inc., El Paso
Corp., Enbridge Inc., EQT Corp., National Fuel Gas Co., NiSource
Inc., ONEOK Inc., Questar Corp., Sempra Energy, Spectra Energy
Co., Southern Union Co. and Williams Companies Inc.
|
Senior Management and the Compensation Committee review our
compensation practices and performance against peer companies on
at least an annual basis.
130
Role of Senior
Management in Establishing Compensation for Named Executive
Officers
Typically, Senior Management consults with BDO, the compensation
consultant engaged by the Compensation Committee, and reviews
market data to determine relevant compensation levels and
compensation program elements. Based on these consultations and
a review of publicly available information for the peer group,
Senior Management submits emerging conclusions and later a
proposal to the chairman of the Compensation Committee. The
proposal includes a recommendation of base salary, annual bonus
and any new long-term compensation to be paid or awarded to
executive officers and employees. The chairman of the
Compensation Committee reviews and discusses the proposal with
Senior Management and the consultant and may discuss it with the
other members of the Compensation Committee, other board
members, or the full boards of the Company and Targa Resources
GP LLC and may request that Senior Management provide him with
additional information or reconsider their proposal. The
resulting recommendation is then submitted to the Compensation
Committee for consideration, which also meets separately with
the compensation consultant. The final compensation decisions
are reported to the Board.
The Compensation Committee may delegate the approval of award
grants and other transactions and responsibilities regarding the
administration of compensatory programs to the Chairman of the
Board of Directors or the Chief Executive Officer, provided that
such administration and approval of awards does not apply for
our Section 16 officers. Further, our Senior Management has
no other role in determining compensation for our named
executive officers, but our executive officers are delegated the
authority and responsibility to determine the compensation for
all other employees.
Elements of
Compensation for Named Executive Officers
Our compensation philosophy for executive officers emphasizes
our executives having a significant long-term equity stake. For
this reason, in connection with TRI Resources Inc.’s
formation in 2004 and with our acquisition of Dynegy Midstream
Services, Limited Partnership from Dynegy, Inc. in 2005, the
named executive officers were granted restricted stock and
options to purchase restricted stock to attract, motivate and
retain our executive team. In connection with the IPO, the named
executive officers were granted additional shares of bonus stock
as an additional recognition for past performance and
positioning to this point in time and restricted stock as
one-time retention and incentive awards in connection with our
transition from a private to a public company. Both of these
equity awards align our executive officers interests with those
of stockholders. Our executive officers have also invested a
significant portion of their personal investable assets in our
equity and have made significant investments in the equity of
the Partnership. With these equity interests as context,
elements of compensation for our named executive officers are
the following: (i) annual base salary;
(ii) discretionary annual cash awards;
(iii) performance awards under our long-term incentive
plan, (iv) awards under our new stock incentive plan;
(v) contributions under our 401(k) and profit sharing plan;
and (vi) participation in our health and welfare plans on
the same basis as all of our other employees.
Base Salary. The base salaries for our named
executive officers are set and reviewed annually by the
Compensation Committee. The salaries are intended to provide
fixed compensation based on historical salaries paid to our
named executive officers for services rendered to us, market
data on compensation paid to similarly situated executives and
responsibilities and performance of our named executive officers.
Annual Cash Incentives. The discretionary
annual cash awards available to our named executive officers
provide an opportunity to supplement the annual base salary of
our named executive officers so that, on a combined basis, the
annual cash compensation opportunity for our named executive
officers yields competitive cash compensation levels and drives
performance in support of our business strategies. It is our
general policy to pay these awards prior to the end of the first
quarter of the fiscal year following the fiscal year to which
they related. The payment of individual cash bonuses to
executive management, including our named executive officers, is
subject to the sole discretion of the Compensation Committee.
The discretionary annual cash awards are designed to reward our
employees for contributions towards our achievement of financial
and operational business priorities (including business
priorities of
131
the Partnership) approved by the Compensation Committee and to
aid us in retaining and motivating employees. These priorities
are not objective in nature—they are subjective and
performance in regard to these priorities is ultimately
evaluated by the Compensation Committee in its sole discretion.
The approach taken by the Compensation Committee in reviewing
performance against the priorities is along the lines of grading
a multi-faceted essay rather than a simple true/false exam. As
such, success does not depend on achieving a particular target;
rather, success is determined based on past norms, expectations
and unanticipated obstacles or opportunities that arise. For
example, hurricanes and deteriorating market conditions may
alter the priorities initially established by the Compensation
Committee such that certain performance that would otherwise be
deemed a negative may, in context, be a positive result. This
subjectivity allows the Compensation Committee to account for
the full industry and economic context of our actual performance
or that of our personnel. The Compensation Committee considers
all strategic priorities and reviews performance against the
priorities but does not assign specific weightings to the
strategic priorities in advance.
Under plans to pay a discretionary annual cash award that have
been adopted and may be adopted in subsequent years, funding of
a discretionary cash bonus pool is expected to be recommended by
our Senior Management and approved by the Compensation Committee
annually based on our achievement of certain strategic,
financial and operational objectives. Such plans are and will be
approved by the Compensation Committee, which considers certain
recommendations by our Senior Management. Near or following the
end of each year, Senior Management recommends to the
Compensation Committee the total amount of cash to be allocated
to the bonus pool based upon our overall performance relative to
these objectives. Upon receipt of our Senior Management’s
recommendation, the Compensation Committee, in its sole
discretion, determines the total amount of cash to be allocated
to the bonus pool. Additionally, the Compensation Committee, in
its sole discretion, determines the amount of the cash bonus
award to each of our executive officers, including the CEO. The
executive officers determine the amount of the cash bonus pool
to be allocated to our departments, groups and employees (other
than our executive officers) based on performance and on the
recommendation of their supervisors, managers and line officers.
Stock Option Grants. Under our 2005 Stock
Incentive Plan, as amended (the “2005 Incentive
Plan”), incentive stock options and non-incentive stock
options to purchase, in the aggregate, up to
2,536,969 shares of our restricted stock may be granted to
our employees, directors and consultants. No option awards have
been granted to the named executive officers since 2005 under
the 2005 Incentive Plan and option awards that were previously
granted to our named executive officers under the 2005 Incentive
Plan and that were outstanding upon the closing of the IPO were
surrendered and cancelled. We will no longer make grants under
the 2005 Incentive Plan.
Restricted Stock Grants. Under the 2005
Incentive Plan, up to 3,586,236 shares of our restricted
stock may be granted to our employees, directors and
consultants. No restricted stock awards have been granted to the
named executive officers under the 2005 Stock Incentive Plan
since 2005. We will no longer make grants under the 2005
Incentive Plan.
New Incentive Plan. In connection with the
IPO, we adopted the 2010 Stock Incentive Plan (the “2010
Incentive Plan”) under which we may grant to the named
executive officers, other key employees, consultants and
directors certain awards, including restricted stock and
performance awards. The 2010 Incentive Plan provides for
discretionary grants of the following types of awards:
(a) incentive stock options qualified as such under
U.S. federal income tax laws, (b) stock options that
do not qualify as incentive stock options, (c) phantom
stock awards, (d) restricted stock awards, (e) performance
awards, (f) bonus stock awards, or (g) any combination
of such awards. The maximum aggregate number of shares of our
common stock that may be granted in connection with awards under
the 2010 Incentive Plan is 5 million, of which
approximately 1.9 million shares were awarded in connection
with our IPO. A restricted stock award is a grant of shares of
common stock subject to a risk of forfeiture, restrictions on
transferability, and any other restrictions imposed by the
Compensation Committee in its discretion. Except as otherwise
provided under the terms of the 2010 Incentive Plan or an award
agreement, the holder of a restricted stock award may have
rights as a stockholder, including the right to vote or to
receive dividends (subject to any mandatory reinvestment or
other requirements imposed by the Compensation Committee). A
restricted stock award
132
that is subject to forfeiture restrictions may be forfeited and
reacquired by us upon termination of employment or services.
Common stock distributed in connection with a stock split or
stock dividend, and other property distributed as a dividend,
may be subject to the same restrictions and risk of forfeiture
as the restricted stock with respect to which the distribution
was made. Bonus stock awards under the 2010 Incentive Plan are
awards of our common stock. These awards are granted on such
terms and conditions and at such purchase price (if any)
determined by the Compensation Committee and need not be subject
to performance criteria, objectives, or forfeiture. Additional
details relating to shares of restricted stock and bonus stock
granted under the 2010 Incentive Plan are included below under
“—Application of Compensation Elements—Equity
Ownership” and “—Executive
Compensation—Outstanding Equity Awards at 2010 Fiscal
Year-End.”
LTIP Awards. We may grant to the named
executive officers and other key employees performance unit
awards linked to the performance of the Partnership’s
common units, with the amounts vesting under such awards
dependent on the Partnership’s performance compared to a
peer-group consisting of the Partnership and 12 other publicly
traded partnerships. These awards, which may be settled in cash
or equity, are designed to further align the interests of the
named executive officers and other key employees with those of
the Partnership’s equity holders. Additional details
relating to our peer group applicable to LTIP awards payouts are
included below under “—Application of Compensation
Elements—Long-Term Cash Incentives.”
Retirement Benefits. We offer eligible
employees a Section 401(k) tax-qualified, defined
contribution plan (the “401(k) Plan”) to enable
employees to save for retirement through a tax-advantaged
combination of employee and Company contributions and to provide
employees the opportunity to directly manage their retirement
plan assets through a variety of investment options. Our
employees, including our named executive officers, are eligible
to participate in our 401(k) Plan and may elect to defer up to
30% of their annual compensation on a pre-tax basis and have it
contributed to the plan, subject to certain limitations under
the Internal Revenue Code of 1986, as amended (the
“Code”). In addition, we make the following
contributions to the 401(k) Plan for the benefit of our
employees, including our named executive officers: (i) 3%
of the employee’s eligible compensation; and (ii) an
amount equal to the employee’s contributions to the 401(k)
Plan up to 5% of the employee’s eligible compensation. We
may also make discretionary contributions to the 401(k) Plan for
the benefit of employees depending on our performance.
Health and Welfare Benefits. All full-time
employees, including our named executive officers, may
participate in our health and welfare benefit programs,
including medical, health, life insurance and dental coverage
and disability insurance.
Perquisites. We believe that the elements of
executive compensation should be tied directly or indirectly to
the actual performance of the Company. It is the Compensation
Committee’s policy not to pay for perquisites for any of
our named executive officers, other than parking subsidies.
Relation of
Compensation Elements to Compensation Philosophy
Our named executive officers, other executives and
Section 16 officers and directors, through a combination of
personal investment and equity grants, own approximately 13.9%
of our fully diluted equity. Based on our named executive
officers’ ownership interests in us and their direct
ownership of the Partnership’s common units, they own,
directly and indirectly, approximately 0.4% of the
Partnership’s limited partner interests. The Compensation
Committee believes that the elements of its compensation program
fit the established overall compensation objectives in the
context of management’s substantial ownership of our
equity, which allows us to provide competitive compensation
opportunities to align and drive the performance of the named
executive officers in support of our and the Partnership’s
business strategies and to attract, motivate and retain high
quality talent with the skills and competencies required by us
and the Partnership.
133
Application of
Compensation Elements
Equity Ownership. Historically, we have used
both stock options and restricted stock to compensate our
employees, including our named executive officers. Based on
recommendations by our compensation consultant after completing
the second quarter compensation review, we currently
expect awards under our incentive plans to consist primarily of
restricted stock, restricted units and performance based awards
of restricted stock or units or cash-settled performance units
rather than stock options or unit options. In connection with
the IPO, our employees, including the named executive officers,
were granted an aggregate of approximately 1.9 million
shares of restricted stock and bonus stock under the 2010
Incentive Plan. Of these initial awards, our named executive
officers were granted shares of restricted stock and bonus stock
as follows: (i) with respect to restricted stock:
Mr. Joyce—121,125 shares;
Mr. Perkins—67,980 shares;
Mr. Whalen—67,980 shares;
Mr. Heim—60,885 shares;
Mr. McParland—56,100 shares; and
Mr. Meloy—22,425 shares and (ii) with
respect to bonus stock: Mr. Joyce—122,439 shares;
Mr. Perkins—106,200 shares;
Mr. Whalen—106,200 shares;
Mr. Heim—61,825 shares; and
Mr. McParland—87,642 shares. The restricted stock
awards have vesting restrictions. The restricted stock awards
((i) above) to executive officers and other key employees were
made based upon the recommendation of BDO using market-based
precedent and market-based amounts to provide a one-time
retention and incentive award in connection with our transition
from a private to a public company. The awards to the executive
officers were established using a market-based multiple of 3X
annual target long-term incentive compensation for each
individual. BDO concluded that at the proposed 3X annual target
long-term incentive level, the awards for executive management
were of lesser value than grants awarded to senior executives in
connection with other recent industry transactions over the last
three years and that the value of the overall program available
to executive officers would fall in a range between the
50th and 75th percentile of the expanded peer group
over the next three years. The comparable transactions included
the merger of MarkWest Hydrocarbons with MarkWest Energy
Partners, L.P., the acquisition of the controlling interest of
Buckeye GP Holding by BGHGP Holdings, LLC, the merger of Inergy
L.P. and Inergy LP Holdings, the acquisition of Genesis
Energy’s general partner from Denbury Resources by Quintana
Energy Investor Group and transactions involving Precision
Drilling, Apache, RRI Energy, Approach Resources, Concho
Resources, Encore Energy Partners, and Vanguard Natural
Resources. The bonus stock awards ((ii) above) were fully vested
on the date of grant. Both of these awards are intended to align
the interests of key employees (including our named executive
officers) with those of our stockholders. Therefore,
participants (including our named executive officers) did not
pay any consideration for the common stock they received with
respect to these awards, and we did not receive any cash
remuneration for the common stock delivered with respect to
these awards. Partially as a result of the overall award
structure, our named executive officers, as well as all other
holders, of outstanding
out-of-the-money
options that were granted under the 2005 Incentive Plan
cancelled those options.
The Compensation Committee also made cash bonus awards to our
executive officers, including our named executive officers, in
connection with the IPO in the aggregate amount of
$3 million. After the internal reallocation described
below, the cash awards to our named executive officers were as
follows: Mr. Heim—$732,000.
The bonus stock awards and the cash bonus awards were granted to
the seven-person executive management team to provide (i) a
higher “carry” of their equity interests and
(ii) additional discretionary compensation, in each case in
recognition of our executive management team’s efforts in
bringing us to this point in our successful history. The initial
allocation among the seven persons of the bonus stock awards and
$3 million cash bonus awarded to the executive team was
initially based on the relative current base compensation of
each individual. Our board of directors and the Compensation
Committee allowed a voluntary reallocation of equity for cash
among the members of the executive management group to
accommodate individual preferences. The named executive
officers, other than Mr. Heim, elected to exchange their
portion of the cash bonus for additional equity and
Mr. Heim and our two other executive officers elected to
exchange some of their equity for larger shares of the cash
bonus. The final allocation for the named executive officers is
shown above. The amounts of restricted stock, bonus stock and
cash bonus
134
awards were determined pursuant to our compensation philosophy
and the compensation review discussed above.
Base Salary. In 2010, base salaries for our
named executive officers were established based on historical
levels for these officers, taking into consideration officer
salaries in our peer group and the value of the total
compensation opportunities available to our executive officers
including the long-term equity component of our compensation
program. As described above, the second quarter compensation
review indicated that the compensation for our named executive
officers was not consistent with compensation paid at MLP peer
companies or with our expanded peer group generally when the
data is adjusted for company size. In order to begin closing
this gap in compensation, the Compensation Committee authorized
the following increased base salaries for our named executive
officers effective July 1, 2010.
| |
|
|
|
|
|
Rene R. Joyce
|
|
$
|
475,000
|
|
|
Jeffrey J. McParland
|
|
|
340,000
|
|
|
Joe Bob Perkins
|
|
|
412,000
|
|
|
James W. Whalen
|
|
|
412,000
|
|
|
Michael A. Heim
|
|
|
369,000
|
|
|
Matthew J. Meloy
|
|
|
207,500
|
|
Annual Cash Incentives. The Compensation
Committee approved our 2010 Annual Incentive Plan (the
“Bonus Plan”) in February 2010 with the following nine
key business priorities to be considered when making awards
under the Bonus Plan: (i) continue to control all
operating, capital and general and administrative costs,
(ii) invest in our businesses primarily within existing
cash flow, (iii) continue priority emphasis and strong
performance relative to a safe workplace, (iv) reinforce
business philosophy and mindset that promotes environmental and
regulatory compliance, (v) continue to tightly manage the
Downstream Business’ inventory exposure, (vi) execute
on major capital and development projects, such as finalizing
negotiations, completing projects on time and on budget, and
optimizing economics and capital funding, (vii) pursue
selected opportunities, including new shale play gathering and
processing build-outs, other fee-based capex projects and
potential purchases of strategic assets, (viii) pursue
commercial and financial approaches to achieve maximum value and
manage risks, and (ix) execute on all business dimensions,
including the financial business plan. The Compensation
Committee also established the following overall threshold,
target and maximum levels for the Company’s bonus pool: 50%
of the cash bonus pool for the threshold level; 100% for the
target level and 200% for the maximum level. The CEO and the
Compensation Committee relied on compensation consultants and
market data from peer company and broader industry compensation
practices to establish the threshold, target and maximum
percentage levels, which are generally consistent with peer
company and broader energy compensation practices. The cash
bonus pool target amount is determined by summing, on an
employee by employee basis, the product of base salaries and
market-based target bonus percentages. The CEO and the
Compensation Committee arrive at the total amount of cash to be
allocated to the cash bonus pool by multiplying percentage of
target awarded by the Compensation Committee by the total target
cash bonus pool. The funding of the cash bonus pool and the
payment of individual cash bonuses to executive management,
including our named executive officers, are subject to the sole
discretion of the Compensation Committee.
In February 2011, the Compensation Committee approved a cash
bonus pool equal to 180% of the target level for the employee
group, including our named executive officers, under the Bonus
Plan for performance during 2010 in recognition of outstanding
efforts and organizational performance. The Compensation
Committee determined to pay these above target level bonuses
because it considered overall performance, including
organizational performance, to have substantially exceeded
expectations in 2010 based on the nine key business priorities
it established for 2010. The Compensation Committee considered
or subjectively evaluated (rather than measured) organizational
performance by reviewing the apparent overall performance of our
personnel with respect to the initial and subsequent business
priorities relative to both the overall and management-specific
performance expectations of the Compensation Committee, each on
an absolute level and relative to the Compensation
Committee’s sense of peer
135
performance. This subjective assessment that performance
substantially exceeded expectations was based on a qualitative
evaluation rather than a mechanical, quantitative determination
of results across each of the key business priorities. Aspects
of performance important to this qualitative determination
included (i) continued focus on cost control, including the
completion of capital projects typically below budget,
(ii) strong success investing in our businesses,
(iii) proactive efforts to enhance safety and compliance
with environmental and regulatory requirements,
(iv) disciplined management of NGL inventory levels and
related commodity price exposure, (v) success on
transactions including project economics and project management,
(vi) pursuing multiple opportunities to expand our
downstream position and to add fee-based business,
(vii) innovation in new gathering and processing commercial
transactions and in securing significant volume guarantees in
downstream contracting, (viii) exceeding the financial
business plan, (ix) resolution of certain significant
disputes and (x) completion of the dropdown of our
businesses to the Partnership and clarification of strategic
direction for our investors. This subjective evaluation that
performance had substantially exceeded expectations occurred
with the background and ongoing context of detailed board and
committee refinements of the 2010 business priorities both
before the beginning of and during the year, continued board and
committee discussion and active dialogue with management about
priorities in subsequent board and committee meetings, and
further board and committee discussion of performance relative
to expectations following the end of 2010. The extensive
business and board experience of the Compensation Committee and
of our board of directors provide the perspective to make this
subjective assessment in a qualitative manner and to evaluate
management performance overall and the performance of the
executive officers. The executive officers received the
following bonus awards, which are equivalent to the same average
percentage of target as the Company bonus pool:
| |
|
|
|
|
|
Rene R. Joyce
|
|
$
|
855,000
|
|
|
Jeffrey J. McParland
|
|
|
489,600
|
|
|
Joe Bob Perkins
|
|
|
593,280
|
|
|
James W. Whalen
|
|
|
593,280
|
|
|
Michael A. Heim
|
|
|
531,360
|
|
|
Matthew J. Meloy
|
|
|
224,100
|
|
In addition to the cash bonus awards approved under the Bonus
Plan, in February 2011, the Compensation Committee approved an
aggregate cash bonus pool of $1.5 million for our executive
officers and two other employees in recognition of their role in
extraordinary execution of the business priorities, completion
of drop downs to the Partnership and clarification of our
strategic direction in 2010.
Long-term Cash Incentives. In January 2008 and
2009, we granted our executive officers cash-settled performance
unit awards linked to the performance of the Partnership’s
common units that will vest in June of 2011 and 2012, with the
amounts vesting under such awards dependent on the
Partnership’s performance compared to a peer-group
consisting of the Partnership and 12 other publicly traded
partnerships. The peer group companies for 2008 and 2009 were
Energy Transfer Partners, ONEOK Partners, Copano, DCP Midstream,
Regency Energy Partners, Plains All American Pipeline, MarkWest
Energy Partners, Williams Energy Partners, Magellan Midstream,
Martin Midstream, Enbridge Energy Partners, Crosstex and Targa
Resources Partners LP. The Compensation Committee has the
ability to modify the peer-group in the event a peer company is
no longer determined to be one of the Partnership’s peers.
The cash settlement value of these performance unit awards will
be the sum of the value of an equivalent Partnership common unit
at the time of vesting plus associated distributions over the
three year period multiplied by a performance vesting percentage
which may be zero or range from 50% to 100%. This cash
settlement value may be higher or lower than the Partnership
common unit price at the time of the grant. If the
Partnership’s performance equals or exceeds the performance
for the median of the group, 100% of the award will vest. If the
Partnership ranks tenth in the group, 50% of the award will
vest, between tenth and seventh, 50% to 100% will vest based on
an interpolated basis, and for a performance ranking lower than
tenth, no amounts will vest. In January 2008, our named
executive officers, who are also executive officers of the
General Partner, received awards of performance units as
follows: 4,000 performance units to Mr. Joyce, 2,700
performance units to Mr. McParland, 3,500 performance units
to
136
Mr. Perkins, 3,500 performance units to Mr. Whalen and
3,500 performance units to Mr. Heim. In August 2008,
Mr. Meloy received an award of 1,500 performance units. In
January 2009, the named executive officers received awards of
performance units as follows: 34,000 performance units to
Mr. Joyce, 15,500 performance units to Mr. McParland,
20,800 performance units to Mr. Perkins and 20,800
performance units to Mr. Heim. In August 2009,
Mr. Meloy received an award of 7,500 performance units.
In addition to the January 2009 grants, in December 2009, our
executive officers were awarded performance units under our
long-term incentive plan for the 2010 compensation cycle that
will vest in June 2013 as follows: 18,025 performance units to
Mr. Joyce, 13,464 performance units to Mr. Whalen,
9,350 performance units to Mr. McParland, 13,860
performance units to Mr. Perkins and 9,894 performance
units to Mr. Heim. In August 2010, Mr. Meloy received
an award of 4,000 performance units. The cash settlement value
of these performance unit awards will be the sum of the value of
an equivalent Partnership common unit at the time of vesting
plus associated distributions over the three year period
multiplied by a performance vesting percentage which may be zero
or range from 25% to 150%. This cash settlement value may be
higher or lower than the Partnership common unit price at the
time of the grant. If the Partnership’s performance equals
or exceeds the performance for the 25th percentile of the
group but is less than or equal to the 50th percentile of
the group, then 25% to 100% of the award will vest. If the
Partnership’s performance equals or exceeds the performance
for the 50th percentile of the group but is less than or
equal to the 75th percentile of the group, then 100% to
150% of the award will vest. The vesting between the
25th percentile and the 50th percentile will be done
on an interpolated basis between 25% and 100% and the vesting
between the 50th percentile and 75th percentile will
be done on an interpolated basis between 100% and 150%. If the
Partnership’s performance is above the performance of the
75th percentile of the group, the performance percentage
will be 150% of the award. If the Partnership’s performance
is below the performance of the 25th percentile of the
group, the performance percentage will be zero. The performance
period for these performance unit awards began on June 30,
2010 and ends on the third anniversary of such date.
Set forth below is the “performance for the median” of
the peer group for each of the 2008, 2009 and 2010 grants and a
comparison of the Partnership’s performance to the peer
group as of December 31, 2010:
| |
|
|
|
|
|
|
|
|
|
|
|
|
|
|
|
Performance(1)
|
|
|
|
Grant
|
|
Peer Group Median
|
|
Partnership
|
|
Partnership
Position(2)
|
|
|
|
2008
|
|
|
43.5
|
%
|
|
|
74.6
|
%
|
|
|
1 of 13
|
|
|
2009 (January grants)
|
|
|
59.4
|
%
|
|
|
100.6
|
%
|
|
|
1 of 13
|
|
|
2009 (December grants)
|
|
|
16.8
|
%
|
|
|
34.3
|
%
|
|
|
100th percentile
|
|
|
2010
|
|
|
16.8
|
%
|
|
|
34.3
|
%
|
|
|
100th percentile
|
|
|
|
|
|
(1) |
|
Total return measured by (i) subtracting the average
closing price per share/unit for the first ten trading days of
the performance period (the “Beginning Price”) from
the sum of (a) the average closing price per share/unit for
the last ten trading days ending on the date that is
15 days prior to the end of the performance period plus
(b) the aggregate amount of dividends/distributions paid
with respect to a share/unit during such period (the result
being referred to as the “Value Increase”) and
(ii) dividing the Value Increase by the Beginning Price.
The performance period for the 2008 and January 2009 awards
begins on June 30, 2008 and June 30, 2009 while the
December 2009 and 2010 awards begins on June 30, 2010, and
all awards end on the third anniversary of such dates. |
| |
|
(2) |
|
The Partnership’s position for the December 2009 and the
2010 grants is measured by the Partnership’s placement in a
particular quartile rather than its specific rank against the
peer group. |
Health and Welfare Benefits. For 2010, our
named executive officers participated in our health and welfare
benefit programs, including medical, health, life insurance,
dental coverage and disability insurance on the same basis as
all of our other employees.
Perquisites. Consistent with our compensation
philosophy, we did not pay for perquisites for any of our named
executive officers during 2010, other than parking subsidies.
137
Changes for
2011
Base Salary. The 2010 increase in base pay for
the key employees closed only approximately one-half of the gap
in executive compensation highlighted by the review referred to
above under “—The Role of Peer Groups and
Benchmarking.” In order to begin closing this remaining gap
in compensation, the Compensation Committee authorized, and
executive management will implement, the following increased
base salaries for our named executive officers effective
April 1, 2011:
| |
|
|
|
|
|
Rene R. Joyce
|
|
$
|
547,000
|
|
|
Jeffrey J. McParland
|
|
|
389,000
|
|
|
Joe Bob Perkins
|
|
|
468,000
|
|
|
James W. Whalen
|
|
|
468,000
|
|
|
Michael A. Heim
|
|
|
415,000
|
|
|
Matthew J. Meloy
|
|
|
235,000
|
|
With this move in base salaries, the gap will be reduced by
approximately one-half.
Annual Cash Incentives. In light of recent
economic and financial events, Senior Management developed and
proposed a set of strategic priorities to the Compensation
Committee. In February 2011, the Compensation Committee approved
our 2011 Annual Incentive Compensation Plan (the “2011
Bonus Plan”), the cash bonus plan for performance during
2011, and established the following eight key business
priorities: (i) continue to control all operating, capital
and general and administrative costs, (ii) invest in our
businesses, (iii) continue priority emphasis and strong
performance relative to a safe workplace, (iv) reinforce
business philosophy and mindset that promotes compliance with
all aspects of our business including environmental and
regulatory compliance, (v) continue to manage tightly
credit, inventory, interest rate and commodity price exposures,
(vi) execute on major capital and development projects,
such as finalizing negotiations, completing projects on time and
on budget, and optimizing economics and capital funding,
(vii) pursue selected growth opportunities, including new
gathering and processing build-outs leveraging our logistics
platform for development projects, other fee-based capex
projects and potential purchases of strategic assets and
(viii) execute on all business dimensions to maximize value
and manage risks. The Compensation Committee also established
the following overall threshold, target and maximum levels for
the Company’s bonus pool: 50% of the cash bonus pool for
the threshold level; 100% for the target level and 200% for the
maximum level. As with the Bonus Plan, funding of the cash bonus
pool and the payment of individual cash bonuses to executive
management, including our named executive officers, are subject
to the sole discretion of the Compensation Committee. The
market-based base salary bonus percentages for the named
executive officers used in determining the annual cash
incentives were increased in connection with the increases in
base salary in 2010.
Long-term Incentives. On February 14,
2011, our named executive officers were awarded restricted
common stock of the Company under our stock incentive plan for
the 2011 compensation cycle that will vest in three years from
the grant date as follows: 7,690 shares to Mr. Joyce,
4,250 shares to Mr. Perkins, 4,250 shares to
Mr. Whalen, 3,770 shares to Mr. Heim,
3,540 shares to Mr. McParland, and 1,260 shares
to Mr. Meloy.
On February 17, 2011, our named executive officers were
awarded equity-settled performance units under the
Partnership’s long-term incentive plan for the 2011
compensation cycle that will vest in June 2014 as follows:
21,110 performance units to Mr. Joyce, 11,690 performance
units to Mr. Perkins, 11,690 performance units to
Mr. Whalen, 10,360 performance units to Mr. Heim,
9,710 performance units to Mr. McParland, and 3,470
performance units to Mr. Meloy. The settlement value of
these performance unit awards will be determined using the
formula adopted for the performance unit awards granted in
December 2009.
138
Executive
Compensation
The following Summary Compensation Table sets forth the
compensation of our named executive officers for 2010, 2009 and
2008. Additional details regarding the applicable elements of
compensation in the Summary Compensation Table are provided in
the footnotes following the table.
| |
|
|
|
|
|
|
|
|
|
|
|
|
|
|
|
|
|
|
|
|
|
|
|
|
|
|
|
|
|
|
|
Summary Compensation Table for 2010
|
|
|
|
|
|
|
|
|
|
|
|
Non-Equity
|
|
|
|
|
|
|
|
|
|
|
|
|
|
Stock
|
|
Incentive Plan
|
|
All Other
|
|
|
|
Name
|
|
Year
|
|
Salary
|
|
Bonus(2)
|
|
Awards
($)(3)
|
|
Compensation(4)
|
|
Compensation(5)
|
|
Total Compensation
|
|
|
|
Rene R. Joyce
|
|
|
2010
|
|
|
$
|
410,000
|
|
|
$
|
265,067
|
|
|
$
|
5,358,408
|
|
|
$
|
855,000
|
|
|
$
|
22,410
|
|
|
$
|
6,910,885
|
|
|
Chief Executive Officer
|
|
|
2009
|
|
|
|
337,500
|
|
|
|
|
|
|
|
1,398,946
|
|
|
|
510,000
|
|
|
|
20,187
|
|
|
|
2,266,633
|
|
|
|
|
|
2008
|
|
|
|
322,500
|
|
|
|
|
|
|
|
148,400
|
|
|
|
247,500
|
|
|
|
19,205
|
|
|
|
737,605
|
|
|
Jeffrey J.
McParland(1)
|
|
|
2010
|
|
|
|
305,500
|
|
|
|
189,732
|
|
|
|
3,162,324
|
|
|
|
489,600
|
|
|
|
20,904
|
|
|
|
4,168,060
|
|
|
President—Finance and
|
|
|
2009
|
|
|
|
265,000
|
|
|
|
|
|
|
|
683,450
|
|
|
|
400,500
|
|
|
|
20,061
|
|
|
|
1,369,011
|
|
|
Administration
|
|
|
2008
|
|
|
|
253,000
|
|
|
|
|
|
|
|
110,170
|
|
|
|
194,250
|
|
|
|
19,031
|
|
|
|
566,451
|
|
|
Joe Bob Perkins
|
|
|
2010
|
|
|
|
361,250
|
|
|
|
229,911
|
|
|
|
3,831,960
|
|
|
|
593,280
|
|
|
|
20,448
|
|
|
|
5,036,849
|
|
|
President
|
|
|
2009
|
|
|
|
303,750
|
|
|
|
|
|
|
|
970,109
|
|
|
|
459,000
|
|
|
|
20,129
|
|
|
|
1,752,988
|
|
|
|
|
|
2008
|
|
|
|
290,250
|
|
|
|
|
|
|
|
129,850
|
|
|
|
222,750
|
|
|
|
19,124
|
|
|
|
661,974
|
|
|
James W.
Whalen(1)
|
|
|
2010
|
|
|
|
356,750
|
|
|
|
|
|
|
|
3,831,960
|
|
|
|
593,280
|
|
|
|
22,328
|
|
|
|
4,804,318
|
|
|
Executive Chairman of the
|
|
|
2009
|
|
|
|
297,000
|
|
|
|
|
|
|
|
543,150
|
|
|
|
445,500
|
|
|
|
19,936
|
|
|
|
1,305,586
|
|
|
Board
|
|
|
2008
|
|
|
|
290,250
|
|
|
|
|
|
|
|
129,850
|
|
|
|
222,750
|
|
|
|
18,871
|
|
|
|
661,721
|
|
|
Michael A. Heim
|
|
|
2010
|
|
|
|
328,000
|
|
|
|
937,915
|
|
|
|
2,699,620
|
|
|
|
531,360
|
|
|
|
21,776
|
|
|
|
4,518,671
|
|
|
Executive Vice President
|
|
|
2009
|
|
|
|
281,000
|
|
|
|
|
|
|
|
810,117
|
|
|
|
424,500
|
|
|
|
20,089
|
|
|
|
1,535,706
|
|
|
and Chief Operating Officer
|
|
|
2008
|
|
|
|
268,750
|
|
|
|
|
|
|
|
129,850
|
|
|
|
206,250
|
|
|
|
19,071
|
|
|
|
623,921
|
|
|
Matthew J. Meloy
|
|
|
2010
|
|
|
|
195,625
|
|
|
|
|
|
|
|
493,350
|
|
|
|
224,100
|
|
|
|
19,740
|
|
|
|
932,815
|
|
|
Senior Vice President and
|
|
|
|
|
|
|
|
|
|
|
|
|
|
|
|
|
|
|
|
|
|
|
|
|
|
|
|
|
|
Chief Financial Officer
|
|
|
|
|
|
|
|
|
|
|
|
|
|
|
|
|
|
|
|
|
|
|
|
|
|
|
|
|
|
|
|
|
(1) |
|
Mr. McParland became President, Finance and Administration
in December 2010 and previously served as Executive Vice
President and Chief Financial Officer. Mr. Whalen became
Executive Chairman of the Board of Directors in December 2010
and previously served as President, Finance and Administration.
Mr. Meloy was promoted to Senior Vice President and Chief
Financial Officer in December 2010. Prior to his promotion,
Mr. Meloy served as Vice President—Finance and
Treasurer. |
| |
|
(2) |
|
Represents discretionary cash bonuses paid to the named
executive officers in recognition of the executive team’s
role in extraordinary execution of the business priorities,
completion of drop downs to the Partnership and clarification of
our strategic direction in 2010. $732,000 of the amount reported
for Mr. Heim represents a cash bonus paid in lieu of equity
in connection with the IPO. Please see “Executive
Compensation—Compensation Discussion and
Analysis—Application of Compensation Elements—Bonus
Stock Awards” and “Executive
Compensation—Compensation Discussion and
Analysis—Application of Compensation Elements—Annual
Cash Incentives.” |
| |
|
(3) |
|
The restricted stock awards in 2010 to executive officers were
made based upon the recommendation of the compensation
consultant using market-based precedent and market-based amounts
to provide a one-time retention and incentive award in
connection with our transition from a private to a public
company. Please see “Executive
Compensation—Compensation Discussion and
Analysis—Application of Compensation Elements.”
Amounts represent the aggregate grant date fair value of awards
computed in accordance with FASB ASC Topic 718. Assumptions used
in the calculation of these amounts are included in Note 24
to our “Consolidated Financial Statements” beginning
on
page F-1.
Detailed information about the amount recognized for specific
awards is reported in the table under “—Grants of
Plan-Based Awards” below. The grant date fair value of a
common stock award approved on December 6, 2010 and granted
on December 10, 2010, assuming vesting will occur, is
$22.00. |
| |
|
(4) |
|
Amounts represent awards granted pursuant to our Bonus Plan. See
the narrative to the section titled “—Grants of
Plan-Based Awards” below for further information regarding
these awards. |
139
|
|
|
|
(5) |
|
For 2010 “All Other Compensation” includes the
(i) aggregate value of matching and non-matching
contributions to our 401(k) plan and (ii) the dollar value
of life insurance coverage provided by the Company. |
| |
|
|
|
|
|
|
|
|
|
|
|
|
|
|
|
401(k) and Profit
|
|
Dollar Value of
|
|
|
|
Name
|
|
Sharing Plan
|
|
Life Insurance
|
|
Total
|
|
|
|
Rene R. Joyce
|
|
$
|
19,600
|
|
|
$
|
2,810
|
|
|
$
|
22,410
|
|
|
Jeffrey J. McParland
|
|
|
19,600
|
|
|
|
1,304
|
|
|
|
20,904
|
|
|
Joe Bob Perkins
|
|
|
19,600
|
|
|
|
848
|
|
|
|
20,448
|
|
|
James W. Whalen
|
|
|
19,600
|
|
|
|
2,728
|
|
|
|
22,328
|
|
|
Michael A. Heim
|
|
|
19,600
|
|
|
|
2,176
|
|
|
|
21,776
|
|
|
Matthew J. Meloy
|
|
|
19,600
|
|
|
|
140
|
|
|
|
19,740
|
|
Grants of
Plan-Based Awards
The following table and the footnotes thereto provide
information regarding grants of plan-based equity and non-equity
awards made to the named executive officers during 2010:
| |
|
|
|
|
|
|
|
|
|
|
|
|
|
|
|
|
|
|
|
|
|
|
|
|
|
|
|
|
|
|
|
Grants of Plan Based Awards for 2010
|
|
|
|
|
|
|
|
Estimated Possible Payouts Under
|
|
All Other Stock
|
|
Grant Date Fair
|
|
|
|
|
|
|
|
Non-Equity Incentive Plan
Awards(1)
|
|
Awards: Number of
|
|
Value of
|
|
|
|
Grant
|
|
Approval
|
|
|
|
|
|
|
|
Shares of Stocks or
|
|
Stock and
|
|
Name
|
|
Date
|
|
Date
|
|
Threshold
|
|
Target
|
|
2X Target
|
|
Units(2)
|
|
Option
Awards(3)
|
|
|
|
Mr. Joyce
|
|
|
N/A
|
|
|
|
N/A
|
|
|
$
|
237,500
|
|
|
$
|
475,000
|
|
|
$
|
950,000
|
|
|
|
|
|
|
|
|
|
|
|
|
|
12/10/10
|
|
|
|
12/06/10
|
|
|
|
|
|
|
|
|
|
|
|
|
|
|
|
121,125
|
(4)
|
|
$
|
2,644,750
|
|
|
|
|
|
12/10/10
|
|
|
|
12/06/10
|
|
|
|
|
|
|
|
|
|
|
|
|
|
|
|
122,439
|
(5)
|
|
|
2,693,658
|
|
|
Mr. McParland
|
|
|
N/A
|
|
|
|
N/A
|
|
|
|
136,000
|
|
|
|
272,000
|
|
|
|
544,000
|
|
|
|
|
|
|
|
|
|
|
|
|
|
12/10/10
|
|
|
|
12/06/10
|
|
|
|
|
|
|
|
|
|
|
|
|
|
|
|
56,100
|
(4)
|
|
|
1,234,200
|
|
|
|
|
|
12/10/10
|
|
|
|
12/06/10
|
|
|
|
|
|
|
|
|
|
|
|
|
|
|
|
87,642
|
(5)
|
|
|
1,928,124
|
|
|
Mr. Perkins
|
|
|
N/A
|
|
|
|
N/A
|
|
|
|
164,800
|
|
|
|
329,600
|
|
|
|
659,200
|
|
|
|
|
|
|
|
|
|
|
|
|
|
12/10/10
|
|
|
|
12/06/10
|
|
|
|
|
|
|
|
|
|
|
|
|
|
|
|
67,980
|
(4)
|
|
|
1,495,560
|
|
|
|
|
|
12/10/10
|
|
|
|
12/06/10
|
|
|
|
|
|
|
|
|
|
|
|
|
|
|
|
106,200
|
(5)
|
|
|
2,336,400
|
|
|
Mr. Whalen
|
|
|
N/A
|
|
|
|
N/A
|
|
|
|
164,800
|
|
|
|
329,600
|
|
|
|
659,200
|
|
|
|
|
|
|
|
|
|
|
|
|
|
12/10/10
|
|
|
|
12/06/10
|
|
|
|
|
|
|
|
|
|
|
|
|
|
|
|
67,980
|
(4)
|
|
|
1,495,560
|
|
|
|
|
|
12/10/10
|
|
|
|
12/06/10
|
|
|
|
|
|
|
|
|
|
|
|
|
|
|
|
106,200
|
(5)
|
|
|
2,336,400
|
|
|
Mr. Heim
|
|
|
N/A
|
|
|
|
N/A
|
|
|
|
147,600
|
|
|
|
295,200
|
|
|
|
590,400
|
|
|
|
|
|
|
|
|
|
|
|
|
|
12/10/10
|
|
|
|
12/06/10
|
|
|
|
|
|
|
|
|
|
|
|
|
|
|
|
60,885
|
(4)
|
|
|
1,339,470
|
|
|
|
|
|
12/10/10
|
|
|
|
12/06/10
|
|
|
|
|
|
|
|
|
|
|
|
|
|
|
|
61,825
|
(5)
|
|
|
1,360,150
|
|
|
Mr. Meloy
|
|
|
N/A
|
|
|
|
N/A
|
|
|
|
41,500
|
|
|
|
83,000
|
|
|
|
166,000
|
|
|
|
22,425
|
(4)
|
|
|
493,350
|
|
|
|
|
|
12/10/10
|
|
|
|
12/06/10
|
|
|
|
|
|
|
|
|
|
|
|
|
|
|
|
|
|
|
|
|
|
|
|
|
|
(1) |
|
These awards were granted under the Bonus Plan. At the time the
Bonus Plan was adopted, the estimated future payouts in the
above table under the heading “Estimated Possible Payouts
Under Non-Equity Incentive Plan Awards” represented the
portion of the cash bonus pool available for awards to the named
executive officers under the Bonus Plan based on the three
performance levels. In February 2011, the Compensation Committee
approved a bonus award for the named executive officers equal to
1.8x of the target. See “—Executive
Compensation—Compensation Discussion and
Analysis—Application of Compensation Elements—Annual
Cash Incentives.” |
| |
|
(2) |
|
These common stock awards were granted under our 2010 Incentive
Plan. The stock awards to executive officers were made based
upon the recommendation of the compensation consultant using
market-based precedent and market-based amounts to provide a
one-time retention and incentive award in connection with our
transition from a private to a public company. |
140
|
|
|
|
(3) |
|
The dollar amounts shown for the common stock awards approved on
December 6, 2010 and granted on December 10, 2010 are
determined by multiplying the shares reported in the table by
$22.00 (the grant date fair value of awards computed in
accordance with FASB ASC Topic 718). |
| |
|
(4) |
|
Restricted stock awards. |
| |
|
(5) |
|
Bonus stock awards. |
Narrative
Disclosure to Summary Compensation Table and Grants of Plan
Based Awards Table
A discussion of 2010 salaries, bonuses, incentive plans and
awards is included in “—Executive
Compensation—Compensation Discussion and Analysis.”
2010 Stock
Incentive Plan
Restricted Stock Awards. Subject to the terms
of the applicable restricted stock agreement, restricted stock
granted under the 2010 Incentive Plan during 2010 has a vesting
period of two years from the date of grant (with respect to 60%
of the shares awarded) and three years from the date of grant
(with respect to 40% of the shares awarded). The named executive
officers have all of the rights of a stockholder of the Company
with respect to the restricted stock granted in 2010 including,
without limitation, voting rights. The named executive officers
do not have the right to receive any dividends or other
distributions, including any special or extraordinary dividends
or distributions, with respect to the restricted stock granted
in 2010 unless and until the restricted stock vests. Dividends
on unvested restricted stock are credited to an unfunded account
maintained by the Company. These credited dividends are paid to
the employee when the shares of restricted stock vest. In the
event all or any portion of the restricted stock granted in 2010
fails to vest, such restricted stock and dividends will be
forfeited to us.
Bonus Stock Awards. Bonus stock awarded in
2010 is not subject to any vesting or forfeiture provisions.
Please see “—Executive Compensation—Compensation
Discussion and Analysis—Elements of Compensation for Named
Executive Officers—New Incentive Plan” and
“—Executive Compensation—Compensation Discussion
and Analysis—Application of Compensation
Elements—Equity Ownership” for a detailed discussion
of the grants of restricted stock and bonus stock.
Outstanding
Equity Awards at 2010 Fiscal Year-End
The following table and the footnotes related thereto provide
information regarding each stock option and other equity-based
awards outstanding as of December 31, 2010 for each of our
named executive officers.
| |
|
|
|
|
|
|
|
|
|
|
|
|
|
|
|
|
|
|
|
Outstanding Equity Awards at 2010 Fiscal Year End
|
|
|
|
Stock Awards
|
|
|
|
|
|
|
|
Equity Incentive
|
|
Equity Incentive Plan
|
|
|
|
|
|
|
|
Plan Awards: Number
|
|
Awards: Market or
|
|
|
|
|
|
Market Value of
|
|
of Unearned
|
|
Payout Value of
|
|
|
|
Number of Shares of
|
|
Shares of Stock
|
|
Performance Units
|
|
Unearned Performance
|
|
|
|
Stock That Have Not
|
|
That Have Not
|
|
That Have Not
|
|
Units That Have Not
|
|
Name
|
|
Vested(1)
|
|
Vested(2)
|
|
Vested(3)
|
|
Vested
(4)
|
|
|
|
Rene R. Joyce
|
|
|
121,125
|
|
|
$
|
3,247,361
|
|
|
|
56,025
|
|
|
$
|
2,263,953
|
|
|
Jeffrey J. McParland
|
|
|
56,100
|
|
|
|
1,504,041
|
|
|
|
27,550
|
|
|
|
1,113,254
|
|
|
Joe Bob Perkins
|
|
|
67,980
|
|
|
|
1,822,544
|
|
|
|
38,160
|
|
|
|
1,542,127
|
|
|
James W. Whalen
|
|
|
67,980
|
|
|
|
1,822,544
|
|
|
|
16,964
|
|
|
|
686,185
|
|
|
Michael A. Heim
|
|
|
60,885
|
|
|
|
1,632,327
|
|
|
|
34,194
|
|
|
|
1,381,504
|
|
|
Matthew J. Meloy
|
|
|
22,425
|
|
|
|
601,214
|
|
|
|
13,000
|
|
|
|
525,233
|
|
|
|
|
|
(1) |
|
Represents shares of our restricted common stock awarded on
December 10, 2010. These shares vest as follows: 60% on
December 10, 2012 and 40% on December 10, 2013. |
141
|
|
|
|
(2) |
|
The dollar amounts shown are determined by multiplying the
number of shares of common stock reported in the table by the
sum of the closing price of a share of common stock on
December 31, 2010 ($26.81). |
| |
|
(3) |
|
Represents the number of performance units awarded on
January 17, 2008, January 22, 2009 and
December 3, 2009 under our long-term incentive plan. With
respect to Mr. Meloy, the performance units were granted on
October 1, 2008, August 4, 2009 and August 2,
2010. These awards vest in June 2011, June 2012, and June 2013,
based on the Partnership’s performance over the applicable
period measured against a peer group of companies. These awards
are discussed in more detail under the heading
“—Executive Compensation—Compensation Discussion
and Analysis—Application of Compensation
Elements—Long-Term Cash Incentives.” |
| |
|
(4) |
|
The dollar amounts shown are determined by multiplying the
number of performance units reported in the table by the sum of
the closing price of a common unit of the Partnership on
December 31, 2010 ($33.96) and the related distribution
equivalent rights for each award and assume full payout under
the awards at the time of vesting. |
Option Exercises
and Stock Vested in 2010
The following table provides the amount realized during 2010 by
each named executive officer upon the exercise of options and
upon the vesting of our restricted common stock and performance
units.
| |
|
|
|
|
|
|
|
|
|
|
|
|
|
|
|
|
|
|
|
Option Exercises and Stock Vested for 2010
|
|
|
|
Option Awards
|
|
Stock Awards
|
|
|
|
Number of Shares
|
|
|
|
|
|
|
|
|
|
Acquired on
|
|
Value Realized on
|
|
Number of Shares
|
|
Value Realized on
|
|
|
|
Exercise(1)
|
|
Exercise
|
|
Acquired on
Vesting(2)
|
|
Vesting(3)
|
|
|
|
Rene R. Joyce
|
|
|
155,447
|
|
|
$
|
459,957
|
|
|
|
15,000
|
|
|
$
|
499,406
|
|
|
Jeffrey J. McParland
|
|
|
108,556
|
|
|
|
324,555
|
|
|
|
8,200
|
|
|
|
273,009
|
|
|
Joe Bob Perkins
|
|
|
117,241
|
|
|
|
350,520
|
|
|
|
10,800
|
|
|
|
359,573
|
|
|
James W. Whalen
|
|
|
45,158
|
|
|
|
135,012
|
|
|
|
10,800
|
|
|
|
359,573
|
|
|
Michael A. Heim
|
|
|
127,946
|
|
|
|
377,735
|
|
|
|
10,000
|
|
|
|
332,938
|
|
|
Matthew J. Meloy
|
|
|
15,942
|
|
|
|
43,162
|
|
|
|
3,000
|
|
|
|
99,881
|
|
|
|
|
|
(1) |
|
At the time of exercise of the stock options, the common stock
acquired upon exercise had a value of $3.46 per share. This
value was determined by an independent consultant pursuant to a
valuation of our common stock dated June 2, 2010. |
| |
|
(2) |
|
Represents performance units granted in February 2007 that
vested in August 2010 and were settled by cash payment. |
| |
|
(3) |
|
Computed by multiplying the number of performance units by the
value of an equivalent Partnership common unit at the time of
vesting and adding associated distributions over the vesting
period. |
Change in Control
and Termination Benefits
2010 Incentive
Plan.
If a Change in Control (as defined below) occurs and the named
executive officer has remained continuously employed by us from
the date of grant to the date upon which such Change in Control
occurs, then the restricted stock granted to him under our form
of restricted stock agreement (the “Stock Agreement”)
and related dividends then credited to him will fully vest on
the date upon which such Change in Control occurs.
Restricted stock granted to a named executive officer under the
Stock Agreement and related dividends then credited to him will
fully vest if his employment is terminated by reason of death or
a Disability (as defined below). If a named executive
officer’s employment with us is terminated for any
142
reason other than death or Disability, then his unvested
restricted stock is forfeited to us for no consideration.
The following terms have the specified meanings for purposes of
the 2010 Incentive Plan and Stock Agreement:
|
|
|
| |
•
|
Affiliate means any corporation, partnership (including
the Partnership), limited liability company or partnership,
association, trust, or other organization which, directly or
indirectly, controls, is controlled by, or is under common
control with, the Company. For purposes of the preceding
sentence, “control” (including, with correlative
meanings, the terms “controlled by” and “under
common control with”), as used with respect to any entity
or organization, shall mean the possession, directly or
indirectly, of the power (i) to vote more than 50% of the
securities having ordinary voting power for the election of
directors of the controlled entity or organization or
(ii) to direct or cause the direction of the management and
policies of the controlled entity or organization, whether
through the ownership of voting securities or by contract or
otherwise.
|
| |
| |
•
|
Change in Control means the occurrence of one of the
following events: (i) any Person, including a
“group” as contemplated by section 13(d)(3) of
the Exchange Act (other than Warburg Pincus LLC or any other
Affiliate), acquires or gains ownership or control (including,
without limitation, the power to vote), by way of merger,
consolidation, recapitalization, reorganization or otherwise, of
more than 50% of the outstanding shares of the Company’s
voting stock (based upon voting power) or more than 50% of the
combined voting power of the equity interests in the Partnership
or the general partner of the Partnership; (ii) the
completion of a liquidation or dissolution of the Company or the
approval by the limited partners of the Partnership, in one or a
series of transactions, of a plan of complete liquidation of the
Partnership; (iii) the sale or other disposition by the
Company of all or substantially all of its assets in or more
transactions to any Person other than Warburg Pincus LLC or any
other Affiliate; (iv) the sale or disposition by either the
Partnership or the general partner of the Partnership of all or
substantially all of its assets in one or more transactions to
any Person other than to Warburg Pincus LLC, Targa Resources GP
LLC, or any other Affiliate; (v) a transaction resulting in
a Person other than Targa Resources GP LLC or an Affiliate being
the general partner of the Partnership; or (vi) as a result
of or in connection with a contested election of directors, the
persons who were directors of the Company before such election
shall cease to constitute a majority of the Company’s board
of directors. Notwithstanding the foregoing, with respect to an
award under the 2010 Incentive Plan that is subject to
section 409A of the Internal Revenue Code of 1986, as
amended, and with respect to which a Change in Control will
accelerate payment, “Change in Control” shall mean a
“change of control event” as defined in the
regulations and guidance issued under section 409A of the
Code.
|
| |
| |
•
|
Disability means a disability that entitles the named
executive officer to disability benefits under our long-term
disability plan.
|
| |
| |
•
|
Person means an individual or a corporation, limited
liability company, partnership, joint venture, trust,
unincorporated organization, association, government agency or
political subdivision thereof, or other entity.
|
143
The following table reflects payments that would have been made
to each of the named executive officers under the 2010 Incentive
Plan and related agreements in the event there was a Change in
Control or their employment was terminated, each as of
December 31, 2010.
| |
|
|
|
|
|
|
|
|
|
|
|
|
|
Termination for
|
|
Name
|
|
Change of
Control(1)
|
|
Death or
Disability(1)
|
|
|
|
Rene R. Joyce
|
|
$
|
3,247,361
|
|
|
$
|
3,247,361
|
|
|
Jeffrey J. McParland
|
|
|
1,504,041
|
|
|
|
1,504,041
|
|
|
Joe Bob Perkins
|
|
|
1,822,544
|
|
|
|
1,822,544
|
|
|
James W. Whalen
|
|
|
1,822,544
|
|
|
|
1,822,544
|
|
|
Michael A. Heim
|
|
|
1,632,327
|
|
|
|
1,632,327
|
|
|
Matthew J. Meloy
|
|
|
601,214
|
|
|
|
601,214
|
|
|
|
|
|
(1) |
|
Amounts relate to the unvested shares of restricted stock of the
Company granted on December 10, 2010. |
Long-Term
Incentive Plan.
If a Change of Control (as defined below) occurs during the
performance period established for the performance units and
related distribution equivalent rights granted to a named
executive officer under our form of Performance Unit Grant
Agreement (a “Performance Unit Agreement”), the
performance units and related distribution equivalent rights
then credited to a named executive officer will be cancelled and
the named executive officer will be paid an amount of cash equal
to the sum of (i) the product of (a) the Fair Market
Value (as defined below) of a common unit of the Partnership
multiplied by (b) the number of performance units granted
to the named executive officer, plus (ii) the amount of
distribution equivalent rights then credited to the named
executive officer, if any.
Performance units and the related distribution equivalent rights
granted to a named executive officer under a Performance Unit
Agreement will be automatically forfeited without payment upon
the termination of his employment with us and our affiliates,
except that: if his employment is terminated by reason of his
death, a disability that entitles him to disability benefits
under our long-term disability plan or by us other than for
Cause (as defined below), he will be vested in his performance
units that he is otherwise qualified to receive payment for
based on achievement of the performance goal at the end of the
Performance Period.
The following terms have the specified meanings for purposes of
our long-term incentive plan:
|
|
|
| |
•
|
Change of Control means (i) any “person”
or “group” within the meaning of those terms as used
in Sections 13(d) and 14(d)(2) of the Exchange Act, other
than an affiliate of us, becoming the beneficial owner, by way
of merger, consolidation, recapitalization, reorganization or
otherwise, of 50% or more of the combined voting power of the
equity interests in the Partnership or its general partner,
(ii) the limited partners of the Partnership approving, in
one or a series of transactions, a plan of complete liquidation
of the Partnership, (iii) the sale or other disposition by
either the Partnership or the General Partner of all or
substantially all of its assets in one or more transactions to
any person other than the General Partner or one of the General
Partner’s affiliates or (iv) a transaction resulting
in a person other than the Partnership’s general partner or
one of such general partner’s affiliates being the general
partner of the Partnership. With respect to an award subject to
Section 409A of the Code, Change of Control will mean a
“change of control event” as defined in the
regulations and guidance issued under Section 409A of the
Code.
|
| |
| |
•
|
Fair Market Value means the closing sales price of a
common unit of the Partnership on the principal national
securities exchange or other market in which trading in such
common units occurs on the applicable date (or if there is not
trading in the common units on such date, on the next preceding
date on which there was trading) as reported in The Wall Street
Journal (or other reporting service approved by the Compensation
Committee). In the event the common units are
|
144
|
|
|
| |
|
not traded on a national securities exchange or other market at
the time a determination of fair market value is required to be
made, the determination of fair market value shall be made in
good faith by the Compensation Committee.
|
|
|
|
| |
•
|
Cause means (i) failure to perform assigned duties
and responsibilities, (ii) engaging in conduct which is
injurious (monetarily of otherwise) to us or our affiliates,
(iii) breach of any corporate policy or code of conduct
established by us or our affiliates or breach of any agreement
between the named executive officer and us or our affiliates or
(iv) conviction of a misdemeanor involving moral turpitude
or a felony. If the named executive officer is a party to an
agreement with us or our affiliates in which this term is
defined, then that definition will apply for purposes of our
long-term incentive plan and the Performance Unit Agreement.
|
The following table reflects payments that would have been made
to each of the named executive officers under our long-term
incentive plan and related agreements in the event there was a
Change of Control or their employment was terminated, each as of
December 31, 2010.
| |
|
|
|
|
|
|
|
|
|
|
|
|
|
Termination for
|
|
Name
|
|
Change of Control
|
|
Death or Disability
|
|
|
|
Rene R. Joyce
|
|
$
|
2,049,196
|
(1)
|
|
$
|
2,049,196
|
(1)
|
|
Jeffrey J. McParland
|
|
|
1,008,188
|
(2)
|
|
|
1,008,188
|
(2)
|
|
Joe Bob Perkins
|
|
|
1,394,083
|
(3)
|
|
|
1,394,083
|
(3)
|
|
James W. Whalen
|
|
|
608,637
|
(4)
|
|
|
608,637
|
(4)
|
|
Michael A. Heim
|
|
|
1,255,173
|
(5)
|
|
|
1,255,173
|
(5)
|
|
Matthew J. Meloy
|
|
|
477,053
|
(6)
|
|
|
477,053
|
(6)
|
|
|
|
|
(1) |
|
Of this amount, $135,840 and $20,800 relate to the performance
units and related distribution equivalent rights granted on
January 17, 2008; $1,154,640 and $106,590 relate to the
performance units and related distribution equivalent rights
granted on January 22, 2009; and $612,129 and $19,197
relate to the performance units and related distribution
equivalent rights granted on December 3, 2009. |
| |
|
(2) |
|
Of this amount, $91,692 and $14,040 relate to the performance
units and related distribution equivalent rights granted on
January 17, 2008; $526,380 and $48,593 relate to the
performance units and related distribution equivalent rights
granted on January 22, 2009; and $317,526 and $9,958 relate
to the performance units and related distribution equivalent
rights granted on December 3, 2009. |
| |
|
(3) |
|
Of this amount, $118,860 and $18,200 relate to the performance
units and related distribution equivalent rights granted on
January 17, 2008; $706,368 and $65,208 relate to the
performance units and related distribution equivalent rights
granted on January 22, 2009; and $470,686 and $14,761
relate to the performance units and related distribution
equivalent rights granted on December 3, 2009. |
| |
|
(4) |
|
Of this amount, $118,860 and $18,200 relate to the performance
units and related distribution equivalent rights granted on
January 17, 2008; $0 and $0 relate to the performance units
and related distribution equivalent rights granted on
January 22, 2009; and $457,237 and $14,339 relate to the
performance units and related distribution equivalent rights
granted on December 3, 2009. |
| |
|
(5) |
|
Of this amount, $118,860 and $18,200 relate to the performance
units and related distribution equivalent rights granted on
January 17, 2008; $706,368 and $65,208 relate to the
performance units and related distribution equivalent rights
granted on January 22, 2009; and $336,000 and $10,537
relate to the performance units and related distribution
equivalent rights granted on December 3, 2009. |
| |
|
(6) |
|
Of this amount, $50,940 and $7,800 relate to the performance
units and related distribution equivalent rights granted on
October 1, 2008; $254,700 and $23,513 relate to the
performance units and related distribution equivalent rights
granted on August 4, 2009; and $135,840 and $4,260 relate
to the performance units and related distribution equivalent
rights granted on August 1, 2010. |
145
2005 Incentive
Plan.
No payments would have been made to each of the named executive
officers under the 2005 Incentive Plan and related agreements in
the event there was a Change of Control or their employment was
terminated, each as of December 31, 2010.
The following table reflects the aggregate payments that would
have been made to each of the named executive officers under the
2010 Incentive Plan, the Long-Term Incentive Plan and related
agreements in the event there was a Change in Control/Change of
Control or their employment was terminated, each as of
December 31, 2010.
| |
|
|
|
|
|
|
|
|
|
|
|
Change of
|
|
Termination for
|
|
Name
|
|
Control
|
|
Death or Disability
|
|
|
|
Rene R. Joyce
|
|
$
|
5,296,557
|
|
|
$
|
5,296,557
|
|
|
Jeffrey J. McParland
|
|
|
2,512,229
|
|
|
|
2,512,229
|
|
|
Joe Bob Perkins
|
|
|
3,216,627
|
|
|
|
3,216,627
|
|
|
James W. Whalen
|
|
|
2,431,181
|
|
|
|
2,431,181
|
|
|
Michael A. Heim
|
|
|
2,887,500
|
|
|
|
2,887,500
|
|
|
Matthew J. Meloy
|
|
|
1,078,267
|
|
|
|
1,078,267
|
|
Director
Compensation
The following table sets forth the compensation earned by our
non-employee directors for 2010:
| |
|
|
|
|
|
|
|
|
|
|
|
|
|
|
|
Fees Earned Or
|
|
Stock Awards
|
|
|
|
Name
|
|
Paid in Cash
|
|
($)(5)
|
|
Total Compensation
|
|
|
|
Chris
Tong(1)(2)(3)
|
|
$
|
71,500
|
|
|
$
|
53,213
|
|
|
$
|
124,713
|
|
|
Charles R.
Crisp(1)(2)(3)
|
|
|
56,500
|
|
|
|
53,213
|
|
|
|
109,713
|
|
|
In Seon Hwang
|
|
|
11,500
|
|
|
|
—
|
|
|
|
11,500
|
|
|
Chansoo
Joung(1)(2)(4)
|
|
|
11,500
|
|
|
|
—
|
|
|
|
11,500
|
|
|
Peter R.
Kagan(1)(2)(4)
|
|
|
11,500
|
|
|
|
—
|
|
|
|
11,500
|
|
|
|
|
|
(1) |
|
On January 22, 2010, Messrs. Crisp and Tong each
received 2,250 common units of the Partnership in connection
with their service on our board of directors and
Messrs. Joung and Kagan each received 2,250 common units of
the Partnership in connection with their service on the board of
directors of the General Partner. The grant date fair value of
each common unit granted to each of these named individuals
computed in accordance with FAS 123R was $23.65, based on
the closing price of the common units on the day prior to the
grant date. |
| |
|
(2) |
|
As of December 31, 2010, Mr. Tong held 23,150 common
units and 49,439 shares of common stock, Mr. Crisp
held 11,350 common units and 140,080 shares of common stock
and Messrs. Joung and Mr. Kagan each held 10,250
common units of the Partnership. |
| |
|
(3) |
|
On February 14, 2011, Mr. Crisp received
7,200 shares of common stock of the Company and
Mr. Tong received 5,500 shares of common stock of the
Company in partial consideration of their agreement to cancel
outstanding stock options to acquire common stock in connection
with our IPO. |
| |
|
(4) |
|
Messrs. Joung and Kagan earned $131,238 and $129,738 in
fees for service on the board of directors of the
partnership’s General Partner in 2010.
Mr. Joung’s compensation included $56,500 in fees,
$53,213 in common unit awards and $21,525 in all other
compensation. Mr. Kagan’s compensation included
$55,000 in fees, $53,213 in common unit awards and $21,525 in
all other compensation. |
| |
|
(5) |
|
Amounts represent the aggregate grant date fair value of awards
computed in accordance with FASB ASC Topic 718. For a discussion
of the assumptions and methodologies used to value the awards
reported in this column, see the discussion of common unit and
common stock awards contained in the Notes to Consolidated
Financial Statements at Note 24 included in this prospectus. |
146
Narrative to
Director Compensation Table
For 2010, Messrs. Crisp and Tong received an annual cash
retainer of $40,000. Messrs. Hwang, Joung and Kagan
received a prorated annual cash retainer, which was paid after
the IPO. Prior to the IPO, Messrs. Hwang, Joung and Kagan
were not paid an annual cash retainer (or any meeting fees). The
chairman of the Audit Committee received an additional annual
retainer of $20,000. All of our independent directors receive
$1,500 for each Board, Audit Committee, Compensation Committee,
Governance and Nominating Committee and Conflicts Committee
meeting attended. Payment of independent director fees is
generally made twice annually, at the second regularly scheduled
meeting of the Board and the final regularly scheduled meeting
of the Board for the fiscal year. All independent directors are
reimbursed for
out-of-pocket
expenses incurred in attending Board and committee meetings.
A director who is also an employee receives no additional
compensation for services as a director. Accordingly, the
Summary Compensation Table reflects total compensation received
by Messrs. Joyce and Whalen for services performed for us
and our affiliates.
Director Long-term Equity Incentives. The
Partnership made equity-based awards in January 2010 to our
non-management and independent directors under the
Partnership’s long-term incentive plan. These awards were
determined by us and approved by the General Partner’s
board of directors. Each of these directors received an award of
2,250 restricted units, which will settle with the delivery of
Partnership common units. All of these awards are subject to
three-year vesting, without a performance condition and vest
ratably on each anniversary of the grant. The awards are
intended to align the long-term interests of our directors with
those of the Partnership’s unitholders. Our independent and
non-management directors currently participate in the
Partnership’s plan.
Changes for
2011
Director Compensation. In February 2011, the
board of directors approved changes to director compensation for
the 2011 fiscal year. For 2011, each independent director will
receive an annual cash retainer of $50,000.
Director Long-term Equity Incentives. In
February 2011, each of our non-management and independent
directors received an award of 2,310 shares of our common
stock under the 2010 Incentive Plan.
147
SECURITY
OWNERSHIP OF MANAGEMENT AND SELLING STOCKHOLDERS
Targa Resources
Corp.
The following table sets forth information regarding the
beneficial ownership of our common stock and, for our executive
officers and directors, the beneficial ownership of the
Partnership’s common units, each as of April 12, 2011,
held by:
|
|
|
| |
•
|
each person who beneficially owns more than 5% of our
outstanding shares of common stock;
|
| |
| |
•
|
each of our named executive officers;
|
| |
| |
•
|
each of our directors;
|
| |
| |
•
|
each selling stockholder; and
|
| |
| |
•
|
all of our executive officers and directors as a group.
|
Beneficial ownership is determined under the rules of the
Securities and Exchange Commission. In general, these rules
attribute beneficial ownership of securities to persons who
possess sole or shared voting power
and/or
investment power with respect to those securities and include,
among other things, securities that an individual has the right
to acquire within 60 days. Unless otherwise indicated, the
stockholders and unitholders identified in the table below have
sole voting and investment power with respect to all securities
shown as beneficially owned by them. Percentage ownership
calculations for any security holder listed in the table below
are based on 42,349,738 shares of our common stock and
84,756,009 common units of the Partnership outstanding on
April 12, 2011.
| |
|
|
|
|
|
|
|
|
|
|
|
|
|
|
|
|
|
|
|
|
|
|
|
|
|
|
|
|
|
|
|
Targa Resources Partners L.P.
|
|
Targa Resources Corp.
|
|
|
|
|
|
Percentage of
|
|
|
|
|
|
Number of
|
|
|
|
|
|
|
|
Common
|
|
Common
|
|
|
|
|
|
Shares of
|
|
|
|
|
|
|
|
Units
|
|
Units
|
|
Shares Beneficially Owned
|
|
Common
|
|
Shares Beneficially Owned
|
|
|
|
Beneficially
|
|
Beneficially
|
|
Prior to the Offering
|
|
Stock Being
|
|
After the
Offering(15)
|
|
Name of Beneficial
Owner(1)
|
|
Owned(13)
|
|
Owned
|
|
Number
|
|
Percentage
|
|
Offered(14)
|
|
Number
|
|
Percentage
|
|
|
|
Selling Stockholders and 5% Stockholders:
|
|
|
|
|
|
|
|
|
|
|
|
|
|
|
|
|
|
|
|
|
|
|
|
|
|
|
|
|
|
Warburg Pincus Private Equity VIII,
L.P.(2)
|
|
|
|
|
|
|
|
|
|
|
8,617,912
|
|
|
|
20.3
|
%
|
|
|
2,421,845
|
|
|
|
6,196,067
|
|
|
|
14.6
|
%
|
|
Warburg Pincus Netherlands Private Equity VIII C.V.
I(2)
|
|
|
|
|
|
|
|
|
|
|
249,795
|
|
|
|
|
*
|
|
|
70,198
|
|
|
|
179,597
|
|
|
|
|
*
|
|
WP-WPVIII Investors,
L.P.(2)
|
|
|
|
|
|
|
|
|
|
|
24,987
|
|
|
|
|
*
|
|
|
7,022
|
|
|
|
17,965
|
|
|
|
|
*
|
|
Warburg Pincus Private Equity IX,
L.P.(2)
|
|
|
|
|
|
|
|
|
|
|
4,996,737
|
|
|
|
11.8
|
%
|
|
|
1,404,206
|
|
|
|
3,592,531
|
|
|
|
8.5
|
%
|
|
Merrill Lynch Ventures L.P.
2001(3)
|
|
|
|
|
|
|
|
|
|
|
1,233,458
|
|
|
|
2.9
|
%
|
|
|
616,729
|
|
|
|
616,729
|
|
|
|
1.5
|
%
|
|
Paul W.
Chung(4)
|
|
|
|
|
|
|
|
|
|
|
607,528
|
|
|
|
1.4
|
%
|
|
|
75,000
|
|
|
|
532,528
|
|
|
|
1.3
|
%
|
|
Roy E.
Johnson(5):
|
|
|
|
|
|
|
|
|
|
|
|
|
|
|
|
|
|
|
|
|
|
|
|
|
|
|
|
|
|
Roy E. Johnson, Trustee of the Roy Johnson 2010 Family Trust
|
|
|
|
|
|
|
|
|
|
|
184,821
|
|
|
|
|
*
|
|
|
58,912
|
|
|
|
125,909
|
|
|
|
|
*
|
|
Karen M. Johnson, Trustee of the Karen Johnson 2008 Family Trust
|
|
|
|
|
|
|
|
|
|
|
134,162
|
|
|
|
|
*
|
|
|
58,912
|
|
|
|
75,250
|
|
|
|
|
*
|
|
Individually
|
|
|
|
|
|
|
|
|
|
|
292,636
|
|
|
|
|
*
|
|
|
82,176
|
|
|
|
210,460
|
|
|
|
|
*
|
|
Total
|
|
|
|
|
|
|
|
|
|
|
611,619
|
|
|
|
1.4
|
%
|
|
|
200,000
|
|
|
|
411,619
|
|
|
|
|
*
|
|
John R.
Sparger(6)
|
|
|
|
|
|
|
|
|
|
|
142,843
|
|
|
|
|
*
|
|
|
75,000
|
|
|
|
67,843
|
|
|
|
|
*
|
148
| |
|
|
|
|
|
|
|
|
|
|
|
|
|
|
|
|
|
|
|
|
|
|
|
|
|
|
|
|
|
|
|
Targa Resources Partners L.P.
|
|
Targa Resources Corp.
|
|
|
|
|
|
Percentage of
|
|
|
|
|
|
Number of
|
|
|
|
|
|
|
|
Common
|
|
Common
|
|
|
|
|
|
Shares of
|
|
|
|
|
|
|
|
Units
|
|
Units
|
|
Shares Beneficially Owned
|
|
Common
|
|
Shares Beneficially Owned
|
|
|
|
Beneficially
|
|
Beneficially
|
|
Prior to the Offering
|
|
Stock Being
|
|
After the
Offering(15)
|
|
Name of Beneficial
Owner(1)
|
|
Owned(13)
|
|
Owned
|
|
Number
|
|
Percentage
|
|
Offered(14)
|
|
Number
|
|
Percentage
|
|
|
|
Directors and Executive Officers:
|
|
|
|
|
|
|
|
|
|
|
|
|
|
|
|
|
|
|
|
|
|
|
|
|
|
|
|
|
|
Rene R.
Joyce(7)
|
|
|
81,000
|
|
|
|
|
*
|
|
|
1,122,596
|
|
|
|
2.7
|
%
|
|
|
|
|
|
|
1,122,596
|
|
|
|
2.7
|
%
|
|
Joe Bob
Perkins(8):
|
|
|
|
|
|
|
|
|
|
|
|
|
|
|
|
|
|
|
|
|
|
|
|
|
|
|
|
|
|
Claudia Capp Vaglica, Trustee of the JBP Liquidity Trust
|
|
|
|
|
|
|
|
|
|
|
151,805
|
|
|
|
|
*
|
|
|
65,000
|
|
|
|
86,805
|
|
|
|
|
*
|
|
Claudia Capp Vaglica, Trustee of the JBP Family Trust
|
|
|
|
|
|
|
|
|
|
|
147,645
|
|
|
|
|
*
|
|
|
65,000
|
|
|
|
82,645
|
|
|
|
|
*
|
|
Individually
|
|
|
32,100
|
|
|
|
|
*
|
|
|
614,608
|
|
|
|
1.5
|
%
|
|
|
130,000
|
|
|
|
484,608
|
|
|
|
1.1
|
%
|
|
Total
|
|
|
32,100
|
|
|
|
|
*
|
|
|
914,058
|
|
|
|
2.2
|
%
|
|
|
260,000
|
|
|
|
654,058
|
|
|
|
1.5
|
%
|
|
Michael A.
Heim(9):
|
|
|
|
|
|
|
|
|
|
|
|
|
|
|
|
|
|
|
|
|
|
|
|
|
|
|
|
|
|
Michael A. Heim and Nicholas Heim, Co-Trustees of the Michael
Heim 2009 Family Trust
|
|
|
|
|
|
|
|
|
|
|
312,378
|
|
|
|
|
*
|
|
|
166,000
|
|
|
|
146,378
|
|
|
|
|
*
|
|
Michael A. Heim and Patricia N. Heim, Co-Trustees of the
Patricia Heim 2009 Grantor Retained Annuity Trust
|
|
|
|
|
|
|
|
|
|
|
196,672
|
|
|
|
|
*
|
|
|
104,000
|
|
|
|
92,672
|
|
|
|
|
*
|
|
Individually
|
|
|
8,000
|
|
|
|
|
*
|
|
|
306,502
|
|
|
|
|
*
|
|
|
|
|
|
|
306,502
|
|
|
|
|
*
|
|
Total
|
|
|
8,000
|
|
|
|
|
*
|
|
|
815,552
|
|
|
|
1.9
|
%
|
|
|
270,000
|
|
|
|
545,552
|
|
|
|
1.3
|
%
|
|
Jeffrey J.
McParland(10)
|
|
|
16,500
|
|
|
|
|
*
|
|
|
757,316
|
|
|
|
1.8
|
%
|
|
|
250,000
|
|
|
|
507,316
|
|
|
|
1.2
|
%
|
|
James W.
Whalen(11)
|
|
|
111,152
|
|
|
|
|
*
|
|
|
637,679
|
|
|
|
1.5
|
%
|
|
|
|
|
|
|
637,679
|
|
|
|
1.5
|
%
|
|
Matthew J. Meloy
|
|
|
6,000
|
|
|
|
|
*
|
|
|
79,599
|
|
|
|
|
*
|
|
|
|
|
|
|
79,599
|
|
|
|
|
*
|
|
Peter R.
Kagan(2)(12)
|
|
|
12,370
|
|
|
|
|
*
|
|
|
13,891,741
|
|
|
|
32.8
|
%
|
|
|
3,903,271
|
|
|
|
9,988,470
|
|
|
|
23.6
|
%
|
|
In Seon
Hwang(2)(12)
|
|
|
2,120
|
|
|
|
|
*
|
|
|
13,891,741
|
|
|
|
32.8
|
%
|
|
|
3,903,271
|
|
|
|
9,988,470
|
|
|
|
23.6
|
%
|
|
Charles R. Crisp
|
|
|
11,350
|
|
|
|
|
*
|
|
|
149,590
|
|
|
|
|
*
|
|
|
|
|
|
|
149,590
|
|
|
|
|
*
|
|
Chris Tong
|
|
|
23,150
|
|
|
|
|
*
|
|
|
57,249
|
|
|
|
|
*
|
|
|
|
|
|
|
57,249
|
|
|
|
|
*
|
|
Ershel C. Redd Jr.
|
|
|
1,100
|
|
|
|
|
*
|
|
|
2,510
|
|
|
|
|
*
|
|
|
|
|
|
|
2,510
|
|
|
|
|
*
|
|
All directors and executive officers as a group
(13 persons)(13)
|
|
|
332,342
|
|
|
|
|
*
|
|
|
19,649,347
|
|
|
|
46.4
|
%
|
|
|
4,958,271
|
|
|
|
14,691,076
|
|
|
|
34.7
|
%
|
|
|
|
|
(1) |
|
Unless otherwise indicated, the address for all beneficial
owners in this table is 1000 Louisiana, Suite 4300,
Houston, Texas 77002. |
|
|
|
|
(2) |
|
Warburg Pincus Private Equity VIII, L.P., a Delaware limited
partnership, and two affiliated partnerships, Warburg Pincus
Netherlands Private Equity VIII C.V.I., a company organized
under the laws of the Netherlands, and WP-WP VIII Investors,
L.P., a Delaware limited partnership (together “WP
VIII”), and Warburg Pincus Private Equity IX, L.P., a
Delaware limited partnership (“WP IX”), in the
aggregate will own, on a fully diluted basis, approximately 24%
of our equity interests upon completion of this offering. The
general partner of WP VIII is Warburg Pincus Partners, LLC, a
New York limited liability company (“WP Partners
LLC”), and the general partner of WP IX is Warburg Pincus
IX, LLC, a New York |
149
|
|
|
|
|
|
limited liability company, of which WP Partners LLC is the sole
member. Warburg Pincus & Co., a New York general
partnership (“WP”), is the managing member of WP
Partners LLC. WP VIII and WP IX are managed by Warburg Pincus
LLC, a New York limited liability company (“WP LLC”).
The address of the Warburg Pincus entities is 450 Lexington
Avenue, New York, New York 10017. Messrs. Hwang and Kagan
are Partners of WP and Managing Directors and Members of WP LLC.
Charles R. Kaye and Joseph P. Landy are Managing General
Partners of WP and Managing Members and Co-Presidents of WP LLC
and may be deemed to control the Warburg Pincus entities.
Messrs. Hwang, Kagan, Kaye and Landy disclaim beneficial
ownership of all shares held by the Warburg Pincus entities. |
|
|
|
|
(3) |
|
Merrill Lynch & Co., Inc., a Delaware corporation
(“ML&Co.”), is a wholly owned subsidiary of Bank
of America Corporation, a Delaware corporation
(“BAC”). Merrill Lynch Group, Inc., a Delaware
corporation (“ML Group”), is a wholly owned subsidiary
of ML&Co. Merrill Lynch Ventures L.P. 2001, a Delaware
limited partnership, is a private investment fund whose general
partner is Merrill Lynch Ventures, LLC (“MLV LLC”), a
Delaware limited liability company and a wholly owned subsidiary
of ML Group. Merrill Lynch Ventures L.P. 2001’s decisions
regarding the voting or disposition of shares of its portfolio
investments (including its investment in us) are made by the
management and investment committee of the board of directors of
MLV LLC. BAC is the ultimate parent company of each of the
foregoing. Each of BAC, ML&Co., ML Group and MLV LLC
disclaims beneficial ownership of these securities except to the
extent of its pecuniary interest therein. The address of the BAC
entities, including Merrill Lynch Ventures L.P. 2001, is
767 Fifth Avenue, 7th Floor, New York, NY 10153. |
|
|
|
|
(4) |
|
Shares of common stock beneficially owned by Mr. Chung
include (i) 112,194 shares issued to the Helen Chung
2007 Family Trust, of which Mr. Chung’s wife and
sister-in-law
are co-trustees with shared voting and investment power; and
(ii) 112,193 shares issued to the Paul Chung 2008
Family Trust, of which Mr. Chung is the trustee with sole
voting and investment power. Mr. Chung acquired the shares
that he is offering by purchase in connection with our formation
in October 2005 and under our 2005 Stock Incentive Plan, either
as a direct issuance or as a result of option exercises. |
|
|
|
|
(5) |
|
Shares of common stock beneficially owned by Mr. Johnson
include: (i) 134,162 shares issued to the Karen
Johnson 2008 Family Trust, of which Mr. Johnson’s wife
is the trustee and has sole voting and investment power; and
(ii) 184,821 shares issued to the Roy Johnson 2010
Family Trust, of which Mr. Johnson is the trustee with sole
voting and investment power. Mr. Johnson acquired the
shares that he is offering by purchase in connection with our
formation in October 2005 and under our 2005 Stock Incentive
Plan, either as a direct issuance or as a result of option
exercises. |
|
|
|
|
(6) |
|
Mr. Sparger acquired the shares that he is offering under
our 2005 Stock Incentive Plan, either as a direct issuance or as
a result of option exercises. |
|
|
|
|
(7) |
|
Shares of common stock beneficially owned by Mr. Joyce
include: (i) 234,959 shares issued to The Rene Joyce
2010 Grantor Retained Annuity Trust, of which Mr. Joyce and
his wife are co-trustees and have shared voting and investment
power; and (ii) 561,292 shares issued to The Kay Joyce
2010 Family Trust, of which Mr. Joyce’s wife is
trustee and has sole voting and investment power. |
|
|
|
|
(8) |
|
Shares of common stock beneficially owned by Mr. Perkins
include: (i) 151,805 shares issued to the
JBP Liquidity Trust, of which Ms. Claudia Capp Vaglica
is trustee and has sole voting and investment power;
(ii) 147,645 shares issued to the JBP Family Trust, of
which Ms. Vaglica is the trustee and has sole voting and
investment power; and (iii) 4,159 shares issued to
Mr. Perkins’ wife over which she has sole voting and
investment power. Mr. Perkins acquired the shares that he
is offering by purchase in connection with our formation in
October 2005 and under our 2005 Stock Incentive Plan, either as
a direct issuance or as a result of option exercises. |
|
|
|
|
(9) |
|
Shares of common stock beneficially owned by Mr. Heim
include: (i) 312,378 shares issued to The Michael Heim
2009 Family Trust, of which Mr. Heim and Nicholas Heim are
co-trustees and have shared voting and investment power; and
(ii) 196,672 shares issued to The Patricia Heim 2009
Grantor Retained Annuity Trust, of which Mr. Heim and his
wife are co-trustees and have shared voting and investment
power. Mr. Heim acquired the shares that he is offering by
purchase in connection with our formation in October 2005 and
under our 2005 Stock Incentive Plan, either as a direct issuance
or as a result of option exercises. |
150
|
|
|
|
(10) |
|
Mr. McParland acquired the shares that he is offering by
purchase in connection with our formation in October 2005 and
under our 2005 Stock Incentive Plan, either as a direct issuance
or as a result of option exercises. |
|
|
|
|
(11) |
|
Shares of common stock beneficially owned by Mr. Whalen
include 459,249 shares issued to the Whalen Family
Investments Limited Partnership. |
|
|
|
|
(12) |
|
13,889,431 of the shares indicated as owned, and 3,903,271 of
the shares indicated as being offered, by Messrs. Hwang and
Kagan are included because of their affiliation with the Warburg
Pincus entities. |
|
|
|
|
(13) |
|
The common units of the Partnership presented as being
beneficially owned by our directors and officers do not include
the common units held indirectly by us that may be attributable
to such directors and officers based on their ownership of
equity interests in us. |
|
|
|
|
(14) |
|
Represents all of the shares that each selling stockholder will
offer under this prospectus assuming no exercise of the
underwriters’ over-allotment option. |
|
|
|
|
(15) |
|
Assumes no exercise of the underwriters’ over-allotment
option to purchase an aggregate of 847,500 shares, granted
by certain of the selling stockholders. |
151
CERTAIN
RELATIONSHIPS AND RELATED TRANSACTIONS
Our Relationship
with Targa Resources Partners LP and its General
Partner
General
Our only cash generating assets consist of our partnership
interests in the Partnership, which, upon completion of this
offering, will initially consist of the following:
|
|
|
| |
•
|
a 2.0% general partner interest in the Partnership, which we
hold through our 100% ownership interests in the General Partner;
|
| |
| |
•
|
all of the outstanding IDRs of the Partnership; and
|
| |
| |
•
|
11,645,659 of the 84,756,009 outstanding common units of the
Partnership, representing 13.7% of the limited partnership
interest.
|
Stockholders’
Agreement
Prior to our initial public offering, our stockholders,
including our named executive officers, certain of our
directors, Warburg Pincus and ML Ventures, were party to
the Stockholders’ Agreement. The Stockholders’
Agreement (i) provided certain holders of our then
outstanding preferred stock with preemptive rights relating to
certain issuances of securities by us or our subsidiaries,
(ii) imposed restrictions on the disposition and transfer
of our securities, (iii) established vesting and forfeiture
provisions for securities held by our management,
(iv) provided us with the option to repurchase our
securities held by our management and directors upon the
termination of their employment or service to us in certain
circumstances, and (v) imposed on us the obligation to
furnish financial information to Warburg Pincus and ML Ventures
as long as they maintain a certain ownership level in our
securities.
The Stockholders’ Agreement also required the stockholders
party thereto to vote to elect to our Board of Directors two of
our executive officers (one of whom would be our chief executive
officer unless otherwise agreed by the majority holders), five
individuals that were to be designated by Warburg Pincus and one
individual (two individuals if there are only four Warburg
nominees or three individuals if there are only three Warburg
nominees) who were to be independent that were to be selected by
Warburg Pincus, after consultation with our chief executive
officer and approved by the majority holders.
The Stockholders’ Agreement terminated upon completion of
the IPO.
Registration
Rights Agreement
Agreement with
Series B Preferred Stock Investors
On October 31, 2005, we entered into an amended and
restated registration rights agreement with the holders of our
then outstanding Series B preferred stock that received or
purchased 6,453,406 shares of preferred stock pursuant to a
stock purchase agreement dated October 31, 2005. Pursuant
to the registration rights agreement, we agreed to register the
sale of shares of our common stock that holders of such
preferred stock received upon conversion of the preferred stock,
under certain circumstances. These holders include (directly or
indirectly through subsidiaries or affiliates), among others,
Warburg Pincus and ML Ventures.
Demand Registration Rights. At any time, the
qualified holders have the right to require us by written notice
to register a specified number of shares of common stock in
accordance with the Securities Act and the registration rights
agreement. The qualified holders have the right to request up to
an aggregate of five registrations; provided that such qualified
holders are not limited in the number of demand registrations
that constitute “shelf” registrations pursuant to
Rule 415 under the Securities Act. In no event shall more
than one demand registration occur during any six-month period
or within 120 days after the effective date of a
registration statement we file, provided that no demand
registration may be prohibited for that
120-day
period more than once in any
12-month
period.
152
Piggy-back Registration Rights. If, at any
time, we propose to file a registration statement under the
Securities Act with respect to an offering of common stock
(subject to certain exceptions), for our own account, then we
must give at least 15 days’ notice prior to the
anticipated filing date to all holders of registrable securities
to allow them to include a specified number of their shares in
that registration statement. We will be required to maintain the
effectiveness of that registration statement until the earlier
of 180 days after the effective date and the consummation
of the distribution by the participating holders.
Conditions and Limitations; Expenses. These
registration rights are subject to certain conditions and
limitations, including the right of the underwriters to limit
the number of shares to be included in a registration and our
right to delay or withdraw a registration statement under
certain circumstances. We will generally pay all registration
expenses in connection with our obligations under the
registration rights agreement, regardless of whether a
registration statement is filed or becomes effective.
Related Party
Transactions Involving the Partnership
Purchase and
Sale Agreements
On July 27, 2009, we entered into a purchase and sale
agreement (the “Downstream Purchase Agreement”) with
the Partnership pursuant to which we contributed to the
Partnership (i) 100% of the limited liability company
interests in Targa Downstream GP LLC (“Targa Downstream
GP”), (ii) 100% of the limited liability company
interests in Targa LSNG GP LLC (“Targa LSNG GP”),
(iii) 100% of the limited partner interests in Targa
Downstream LP (“Targa Downstream LP”), and
(iv) 100% of the limited partner interests in Targa LSNG LP
(“Targa LSNG LP”), for aggregate consideration of
$530 million, subject to certain adjustments, consisting of
$397.5 million in cash, the issuance to us of 8,527,615
common units and the issuance to the General Partner of 174,033
general partner units, enabling the General Partner to maintain
its 2% general partner interest in the Partnership. Targa
Downstream LP and Targa LSNG LP, collectively, own the
Downstream Business. Pursuant to the Downstream Purchase
Agreement, we indemnified the Partnership, its affiliates and
their respective officers, directors, employees, counsel,
accountants, financial advisers and consultants from and against
(i) all losses that they incur arising from any breach of
our representations, warranties or covenants in the Downstream
Purchase Agreement, (ii) certain environmental matters and
(iii) certain litigation matters. The Partnership has
indemnified us, our affiliates and our respective officers,
directors, employees, counsel, accountants, financial advisers
and consultants from and against all losses that we incur
arising from or out of (i) the business and operations of
Targa Downstream GP, Targa LSNG GP, Targa Downstream LP, Targa
LSNG LP (whether relating to periods prior to or after the
closing of the acquisition of the Downstream Business) to the
extent such losses are not matters for which we have indemnified
the Partnership or (ii) any breach of the
Partnership’s representations, warranties or covenants in
the Downstream Purchase Agreement. Certain of our
indemnification obligations are subject to an aggregate
deductible of $7.95 million and a cap equal to
$58.3 million. In addition, the parties’ reciprocal
indemnification obligations for certain tax liability and losses
are not subject to the deductible and cap. Our environmental
indemnification was limited to matters for which we receive
notice and a claim for indemnification prior to the second
anniversary of the closing. Indemnification claims for breaches
of representations and warranties (other than for certain
fundamental representations and warranties) must be delivered to
us prior to the first anniversary of the closing. We have
received no claims for indemnification under the Downstream
Purchase Agreement. The acquisition closed on September 24,
2009.
On April 27, 2010, we closed on our sale of the Permian
Business and Straddle Assets to the Partnership, pursuant to
which we contributed to the Partnership (i) all of the
limited partner interests in Targa Midstream Services Limited
Partnership (“TMS”), (ii) all of the limited
liability company interests in Targa Gas Marketing LLC
(“TGM”), (iii) all of the limited and general
partner interests in Targa Permian LP (“Permian”),
(iv) all of the limited partner interests in Targa Straddle
LP (“Targa Straddle”), and (v) all of the limited
liability company interests in Targa Straddle GP LLC
(“Targa Straddle GP”), (such limited partner interests
in TMS, Permian and Targa Straddle, general partner interests in
Permian and limited liability company interests in TGM and Targa
Straddle GP being collectively referred to as the “Permian/
Straddle Business”), for aggregate consideration of
$420 million, subject to certain adjustments. Pursuant to
the
153
Permian/Straddle Purchase Agreement, we have indemnified the
Partnership, its affiliates and their respective officers,
directors, employees, counsel, accountants, financial advisers
and consultants from and against (i) all losses that they
incur arising from any breach of our representations, warranties
or covenants in the Permian/Straddle Purchase Agreement and
(ii) certain environmental, operational and litigation
matters. The Partnership has indemnified us, our affiliates and
our respective officers, directors, employees, counsel,
accountants, financial advisers and consultants from and against
all losses that we incur arising from or out of (i) the
business or operations of the Permian/Straddle Business (whether
relating to periods prior to or after the closing of the
acquisition of the Permian/Straddle Business) to the extent such
losses are not matters for which we have indemnified the
Partnership or (ii) any breach of the Partnership’s
representations, warranties or covenants in the Permian/Straddle
Purchase Agreement. Certain of our indemnification obligations
are subject to an aggregate deductible of $6.3 million and
a cap equal to $46.2 million. In addition, the
parties’ reciprocal indemnification obligations for certain
tax liability and losses are not subject to the deductible and
cap. Our environmental indemnification was limited to matters
for which we receive notice and a claim for indemnification
prior to the second anniversary of the closing. Indemnification
claims for breaches of representations and warranties (other
than for certain fundamental representations and warranties)
must be delivered to us prior to the first anniversary of the
closing. We have received no claims for indemnification under
the Permian/Straddle Purchase Agreement.
On August 25, 2010, we closed on the sale of our interest
in the Versado operations to the Partnership, pursuant to which
we contributed to the Partnership (i) all of the member
interests in Targa Versado GP LLC (“Targa Versado GP”)
and (ii) all of the limited partner interests in Targa
Versado LP (“Targa Versado LP”), for aggregate
consideration of $247 million, subject to certain
adjustments, including the issuance to us of 89,813 common units
and the issuance to us of 1,833 general partner units, enabling
us to maintain our 2% general partner interest in the
Partnership. Targa Versado GP and Targa Versado LP,
collectively, own the interests in Versado. Pursuant to the
Versado Purchase Agreement, we indemnified the Partnership, its
affiliates and their respective officers, directors, employees,
counsel, accountants, financial advisers and consultants from
and against (i) all losses that they incur arising from any
breach of our representations, warranties or covenants in the
Versado Purchase Agreement and (ii) certain environmental
matters. The Partnership has indemnified us, our affiliates and
our respective officers, directors, employees, counsel,
accountants, financial advisers and consultants from and against
all losses that we incur arising from or out of (i) the
business or operations of Targa Versado GP and Targa Versado LP
(whether relating to periods prior to or after the closing of
the acquisition of the interests in Versado) to the extent such
losses are not matters for which we have indemnified the
Partnership or (ii) any breach of the Partnership’s
representations, warranties or covenants in the Versado Purchase
Agreement. Certain of our indemnification obligations are
subject to an aggregate deductible of $3.4 million and a
cap equal to $25.3 million. In addition, the parties’
reciprocal indemnification obligations for certain tax liability
and losses are not subject to the deductible and cap. Pursuant
to the Versado Purchase Agreement, we also agreed to reimburse
the Partnership for maintenance capital expenditure amounts
incurred by the Partnership or its subsidiaries in respect of
certain New Mexico Environmental Department capital projects.
On September 28, 2010, we closed on the sale of our
interests in the VESCO operations to the Partnership, pursuant
to which the Partnership acquired all of the member interests in
Targa Capital LLC (“Targa Capital”), for aggregate
consideration of $175.6 million, subject to certain
adjustments. Targa Capital owns a 76.7536% ownership interest in
VESCO. Pursuant to the VESCO Purchase Agreement, we indemnified
the Partnership, its affiliates and their respective officers,
directors, employees, counsel, accountants, financial advisers
and consultants from and against (i) all losses that they
incur arising from any breach of our representations, warranties
or covenants in the VESCO Purchase Agreement and
(ii) certain environmental and litigation matters. The
Partnership has indemnified us, our affiliates and our
respective officers, directors, employees, counsel, accountants,
financial advisers and consultants from and against all losses
that we incur arising from or out of (i) the business or
operations of Targa Capital (whether relating to periods prior
to or after the closing of the acquisition of Targa Capital) to
the extent such losses are not matters for which we have
indemnified the Partnership or (ii) any breach of the
Partnership’s representations, warranties or covenants in
the VESCO Purchase Agreement. Certain of our indemnification
obligations are subject to an aggregate deductible of
$2.5 million and a cap equal to $18.4 million. In
154
addition, the parties’ reciprocal indemnification
obligations for certain tax liability and losses are not subject
to the deductible and cap.
Omnibus
Agreement
Our Omnibus Agreement with the Partnership addresses the
reimbursement to us for costs incurred on the Partnership’s
behalf, competition and indemnification matters. Any or all of
the provisions of the Omnibus Agreement, other than the
indemnification provisions described below, are terminable by us
at our option if the General Partner is removed as the
Partnership’s general partner without cause and units held
by us and our affiliates are not voted in favor of that removal.
The Omnibus Agreement will also terminate in the event of a
Change of Control of the Partnership or its general partner.
Reimbursement
of Operating and General and Administrative
Expense
Under the terms of the Omnibus Agreement, the Partnership
reimburses us for the payment of certain operating and direct
expenses, including compensation and benefits of operating
personnel, and for the provision of various general and
administrative services for the Partnership’s benefit.
Pursuant to these arrangements, we perform centralized corporate
functions for the Partnership, such as legal, accounting,
treasury, insurance, risk management, health, safety and
environmental, information technology, human resources, credit,
payroll, internal audit, taxes, engineering and marketing. The
Partnership reimburses us for the direct expenses to provide
these services as well as other direct expenses we incur on the
Partnership’s behalf, such as compensation of operational
personnel performing services for the Partnership’s benefit
and the cost of their employee benefits, including 401(k),
pension and health insurance benefits. The general partner
determines the amount of general and administrative expenses to
be allocated to the Partnership in accordance with the
partnership agreement. Since October 1, 2010, after the
conveyance of all of our remaining operating assets by us to the
Partnership, substantially all of our general and administrative
costs have been and will continue to be allocated to the
Partnership, other than our direct costs of being a separate
reporting company.
With respect to the North Texas System, prior to
February 15, 2010, the Partnership reimbursed us for
general and administrative expenses, which were capped at
$5.0 million annually, subject to certain increases; and
operating and certain direct expenses, which were not capped.
Between October 24, 2007 and February 15, 2010, with
respect to SAOU and LOU, and between September 24, 2009 and
February 15, 2010, with respect to the Downstream Business,
the Partnership reimbursed us for general and administrative
expenses, which were not capped, allocated to SAOU and LOU and
the Downstream Business according to our allocation practice;
and operating and certain direct expenses, which were not capped.
During the nine-quarter period beginning with the fourth quarter
of 2009 and continuing through the fourth quarter of 2011, we
will provide distribution support to the Partnership in the form
of a reduction in the reimbursement for general and
administrative expense allocated to the Partnership if necessary
(or make a payment to the Partnership, if needed) for a 1.0
times distribution coverage ratio, at the distribution level, at
the time of the dropdown of the Downstream Business, of $0.5175
per limited partner unit, subject to maximum support of
$8.0 million in any quarter. No distribution support was
necessary through the fourth quarter of 2010.
Competition
We are not restricted, under either the Partnership’s
partnership agreement or the Omnibus Agreement, from competing
with the Partnership. We may acquire, construct or dispose of
additional midstream energy or other assets in the future
without any obligation to offer the Partnership the opportunity
to purchase or construct those assets.
155
Indemnification
Under the Omnibus Agreement, we indemnified the Partnership for
pre-closing claims relating to the North Texas System for a
period of three years. Additionally, we indemnified the
Partnership for losses relating to income tax liabilities
attributable to pre-IPO operations that are not reserved on the
books of the Predecessor Business of the North Texas System as
of February 14, 2007. We do not have any obligation under
this indemnification until the Partnership’s aggregate
losses exceed $250,000. Our obligation under this
indemnification will terminate upon the expiration of any
applicable statute of limitations. The Partnership will
indemnify us for all losses attributable to the post-IPO
operations of the North Texas System.
Contracts with
Affiliates
Services
Agreement
We entered into a service arrangement with Sajet Resources LLC,
a subsidiary that we spun off immediately prior to our IPO to
persons who were equity holders in us, including our executive
officers and certain of our directors, Warburg Pincus and
ML Ventures. This company owns certain real property and
developmental intellectual property rights. Pursuant to the
services arrangements, we provide general and administrative
services and other services in support of this company’s
business operations and will be reimbursed by this company for
such services at our actual cost.
Indemnification
Agreements
In February 2007, the Partnership and the General Partner
entered into indemnification agreements with each independent
director of the General Partner. Each indemnification agreement
provides that each of the Partnership and the General Partner
will indemnify and hold harmless each indemnitee against
Expenses (as defined in the indemnification agreement) to the
fullest extent permitted or authorized by law, including the
Delaware Revised Uniform Limited Partnership Act and the
Delaware Limited Liability Company Act in effect on the date of
the agreement or as such laws may be amended to provide more
advantageous rights to the indemnitee. If such indemnification
is unavailable as a result of a court decision and if the
Partnership or the General Partner is jointly liable in the
proceeding with the indemnitee, the Partnership and the General
Partner will contribute funds to the indemnitee for his Expenses
(as defined in the in the Indemnification Agreement) in
proportion to relative benefit and fault of the Partnership or
the General Partner on the one hand and indemnitee on the other
in the transaction giving rise to the proceeding.
Each indemnification agreement also provides that the
Partnership and the General Partner will indemnify and hold
harmless the indemnitee against Expenses incurred for actions
taken as a director or officer of the Partnership or the General
Partner or for serving at the request of the Partnership or the
General Partner as a director or officer or another position at
another corporation or enterprise, as the case may be, but only
if no final and non-appealable judgment has been entered by a
court determining that, in respect of the matter for which the
indemnitee is seeking indemnification, the indemnitee acted in
bad faith or engaged in fraud or willful misconduct or, in the
case of a criminal proceeding, the indemnitee acted with
knowledge that the indemnitee’s conduct was unlawful. The
indemnification agreement also provides that the Partnership and
the General Partner must advance payment of certain Expenses to
the indemnitee, including fees of counsel, subject to receipt of
an undertaking from the indemnitee to return such advance if it
is it is ultimately determined that the Indemnitee is not
entitled to indemnification.
In February 2007, we entered into parent indemnification
agreements with each of our directors and officers, including
Messrs. Joyce, Whalen, Kagan and Joung who serve or served
as directors
and/or
officers of the General Partner. Each parent indemnification
agreement provides that we will indemnify and hold harmless each
indemnitee for Expenses (as defined in the parent
indemnification agreement) to the fullest extent permitted or
authorized by law, including the Delaware General Corporation
Law, in effect on the date of the agreement or as it may be
amended to provide more advantageous rights to the indemnitee.
If such indemnification is unavailable as a result of a court
decision and if we and the indemnitee are jointly
156
liable in the proceeding, we will contribute funds to the
indemnitee for his Expenses in proportion to relative benefit
and fault of us and indemnitee in the transaction giving rise to
the proceeding.
Each parent indemnification agreement also provides that we will
indemnify the indemnitee for monetary damages for actions taken
as our director or officer or for serving at our request as a
director or officer or another position at another corporation
or enterprise, as the case may be but only if (i) the
indemnitee acted in good faith and, in the case of conduct in
his official capacity, in a manner he reasonably believed to be
in our best interests and, in all other cases, not opposed to
our best interests and (ii) in the case of a criminal
proceeding, the indemnitee must have had no reasonable cause to
believe that his conduct was unlawful. The parent
indemnification agreement also provides that we must advance
payment of certain Expenses to the indemnitee, including fees of
counsel, subject to receipt of an undertaking from the
indemnitee to return such advance if it is it is ultimately
determined that the indemnitee is not entitled to
indemnification. In December 2010, we entered into a parent
indemnification agreement with Mr. Meloy and in February
2011 we entered into a parent indemnification agreement with
Mr. Redd.
Relationships
with Warburg Pincus LLC
Prior to this offering, Warburg Pincus holds approximately 33%
of our outstanding common stock. Warburg Pincus will
beneficially own approximately 24% of our outstanding voting
stock on a fully diluted basis upon completion of this offering.
Accordingly, Warburg Pincus can exert significant influence over
us and any action requiring the approval of the holders of our
stock, including the election of directors, the approval of
significant corporate transactions, the amendment of our
certificate of incorporation and mergers or sales of
substantially all of our assets. Warburg’s concentrated
ownership makes it less likely that any other holder or group of
holders of common stock will be able to affect the way we are
managed or the direction of our business.
Chansoo Joung and Peter Kagan, two of our directors and
directors of the General Partner during 2010 and Managing
Directors of Warburg Pincus LLC during 2010, were also directors
of Broad Oak during 2010 from whom we buy natural gas and NGL
products. Affiliates of Warburg Pincus LLC own a controlling
interest in Broad Oak. During 2010, we purchased
$41.5 million of product from Broad Oak. Peter Kagan is
also a director of Antero from whom we buy natural gas and NGL
products. Affiliates of Warburg Pincus own a controlling
interest in Antero. We purchased $0.1 million of product
from Antero during 2010. These transactions were at market
prices consistent with similar transactions with nonaffiliated
entities.
Relationships
with Bank of America Corporation and its subsidiaries
(“BofA”)
Equity
Until December 10, 2010, BofA was a beneficial security
holder of more than 5% of our common stock as defined by
Item 403(a) of
Regulation S-K.
After this date, BofA’s beneficial ownership of our
outstanding common stock dropped below 5%.
Financial
Services
A subsidiary of BofA is a lender and an agent under our and our
subsidiaries’ senior credit facilities with commitments of
$86 million. BofA and its affiliates have engaged, and may
in the future engage, in other commercial and investment banking
transactions with the Company and/or its subsidiaries in the
ordinary course of our business. They have received, and expect
to receive, customary compensation and expense reimbursement for
these commercial and investment banking services.
Hedging
Arrangements
The Partnership entered into various commodity derivative
transactions with BofA which terminated, in accordance with the
terms of the contracts, during 2010. The Partnership has no open
commodity derivatives with BofA as of December 31, 2010.
During 2010 the Partnership received
157
$1.9 million from BofA in commodity derivative
settlements. During 2009 and 2008, we received from (paid to)
BofA $24.2 million and $(30.5) million in commodity
derivative settlements.
Commercial
Relationships
We have executed NGL sales and purchase transactions on the spot
market with BofA. Our product sales included in revenues to
affiliates of BofA during 2008, 2009 and 2010 were
$97.0 million, $36.7 million and $26.0 million.
Our product purchases from affiliates of BofA during 2008, 2009
and 2010 were $5.1 million, $1.0 million and
$3.7 million.
Conflicts of
Interest
Conflicts of interest exist and may arise in the future as a
result of the relationships between the General Partner and its
affiliates (including us), on the one hand, and the Partnership
and its other limited partners, on the other hand. The directors
and officers of the General Partner have fiduciary duties to
manage the General Partner and us, if applicable, in a manner
beneficial to our owners. At the same time, the General Partner
has a fiduciary duty to manage the Partnership in a manner
beneficial to it and its unitholders. Please see
“—Review, Approval or Ratification of Transactions
with Related Persons” below for additional detail of how
these conflicts of interest will be resolved.
Review, Approval
or Ratification of Transactions with Related Persons
Our policies and procedures for approval or ratification of
transactions with “related persons” are not contained
in a single policy or procedure. Instead, they were historically
contained in the Stockholders Agreement and are reflected in the
general operation of our board of directors. Historically, our
Stockholders Agreement prohibited us from entering into,
modifying, amending or terminating any transaction (other than
certain compensatory arrangements and sales or purchases of
capital stock) with an executive officer, director or affiliate
without the prior written consent of the holders of at least a
majority of our outstanding shares of Series B Preferred
(or our common stock if no Series B Preferred was
outstanding). In addition, we were prohibited from entering into
any material transaction with Warburg Pincus and its affiliates
(other than us, any of its subsidiaries or any our managers,
directors or officers or any of its subsidiaries) without the
prior written consent of ML Ventures. We will distribute and
review a questionnaire to our executive officers and directors
requesting information regarding, among other things, certain
transactions with us in which they or their family members have
an interest. If a conflict or potential conflict of interest
arises between us and our affiliates (excluding the Partnership)
on the one hand and the Partnership and its limited partners
(other than us and our affiliates), on the other hand, the
resolution of any such conflict or potential conflict is
addressed as described under “—Conflicts of
Interest.” Pursuant to our Code of Conduct, our officers
and directors are required to abandon or forfeit any activity or
interest that creates a conflict of interest between them and us
or any of our subsidiaries, unless the conflict is pre-approved
by our board of directors.
Whenever a conflict arises between the General Partner or its
affiliates, on the one hand, and the Partnership or any other
partner, on the other hand, the General Partner will resolve
that conflict. The Partnership’s partnership agreement
contains provisions that modify and limit the general
partner’s fiduciary duties to the Partnership’s
unitholders. The partnership agreement also restricts the
remedies available to unitholders for actions taken that,
without those limitations, might constitute breaches of
fiduciary duty.
The General Partner will not be in breach of its obligations
under the partnership agreement or its duties to the Partnership
or its unitholders if the resolution of the conflict is:
|
|
|
| |
•
|
approved by the General Partner’s conflicts committee,
although the General Partner is not obligated to seek such
approval;
|
| |
| |
•
|
approved by the vote of a majority of the Partnership’s
outstanding common units, excluding any common units owned by
the General Partner or any of its affiliates;
|
158
|
|
|
| |
•
|
on terms no less favorable to the Partnership than those
generally being provided to or available from unrelated third
parties; or
|
| |
| |
•
|
fair and reasonable to the Partnership, taking into account the
totality of the relationships among the parties involved,
including other transactions that may be particularly favorable
or advantageous to the Partnership.
|
The General Partner may, but is not required to, seek the
approval of such resolution from the conflicts committee of its
board of directors. If the General Partner does not seek
approval from the conflicts committee and its board of directors
determines that the resolution or course of action taken with
respect to the conflict of interest satisfies either of the
standards set forth in the third or fourth bullet points above,
then it will be presumed that, in making its decision, the board
of directors acted in good faith and in any proceeding brought
by or on behalf of any limited partner of the Partnership, the
person bringing or prosecuting such proceeding will have the
burden of overcoming such presumption. Unless the resolution of
a conflict is specifically provided for in the partnership
agreement, the general partner or its conflicts committee may
consider any factors they determines in good faith to consider
when resolving a conflict. When the partnership agreement
provides that someone act in good faith, it requires that person
to believe he is acting in the best interests of the Partnership.
Director
Independence
Messrs. Crisp, Hwang, Kagan, Redd and Tong are our
independent directors under the NYSE’s listing standards.
Please see “Management—Targa Resources Corp.” Our
board of directors examined the commercial relationships between
us and companies for whom our independent directors serve as
directors or with whom family members of our independent
directors have an employment relationship. The commercial
relationships reviewed consisted of product purchases and
product sales at market prices consistent with similar
arrangements with unrelated entities.
159
DESCRIPTION OF
OUR CAPITAL STOCK
The authorized capital stock of Targa Resources Corp. consists
of 300,000,000 shares of common stock, $0.001 par
value per share, of which 42,349,738 shares were issued and
outstanding on April 12, 2011, and 100,000,000 shares
of preferred stock, $0.001 par value per share, of which no
shares were issued and outstanding on April 12, 2011. As of
April 12, 2011, there were 219 holders of record of our
common stock.
The following summary of our capital stock and our amended and
restated certificate of incorporation and amended and restated
bylaws does not purport to be complete and is qualified in its
entirety by reference to the provisions of applicable law and to
our amended and restated certificate of incorporation and
amended and restated bylaws, which are filed as exhibits to the
registration statement of which this prospectus is a part.
Common
Stock
Except as provided by law or in a preferred stock designation,
holders of common stock are entitled to one vote for each share
held of record on all matters submitted to a vote of the
stockholders, have the exclusive right to vote for the election
of directors and do not have cumulative voting rights. Except as
otherwise required by law, holders of common stock, as such, are
not entitled to vote on any amendment to the certificate of
incorporation (including any certificate of designations
relating to any series of preferred stock) that relates solely
to the terms of any outstanding series of preferred stock if the
holders of such affected series are entitled, either separately
or together with the holders of one or more other such series,
to vote thereon pursuant to the certificate of incorporation
(including any certificate of designations relating to any
series of preferred stock) or pursuant to the General
Corporation Law of the State of Delaware. Subject to preferences
that may be applicable to any outstanding shares or series of
preferred stock, holders of common stock are entitled to receive
ratably such dividends (payable in cash, stock or otherwise), if
any, as may be declared from time to time by our board of
directors out of funds legally available for dividend payments.
All outstanding shares of common stock are fully paid and
non-assessable. The holders of common stock have no preferences
or rights of conversion, exchange, pre-emption or other
subscription rights. There are no redemption or sinking fund
provisions applicable to the common stock. In the event of any
liquidation, dissolution or
winding-up
of our affairs, holders of common stock will be entitled to
share ratably in our assets that are remaining after payment or
provision for payment of all of our debts and obligations and
after liquidation payments to holders of outstanding shares of
preferred stock, if any.
Preferred
Stock
Our amended and restated certificate of incorporation authorizes
our board of directors, subject to any limitations prescribed by
law, without further stockholder approval, to establish and to
issue from time to time one or more classes or series of
preferred stock, par value $0.001 per share, covering up to an
aggregate of 100,000,000 shares of preferred stock. Each
class or series of preferred stock will cover the number of
shares and will have the powers, preferences, rights,
qualifications, limitations and restrictions determined by our
board of directors, which may include, among others, dividend
rights, liquidation preferences, voting rights, conversion
rights, preemptive rights and redemption rights. Except as
provided by law or in a preferred stock designation, the holders
of preferred stock will not be entitled to vote at or receive
notice of any meeting of stockholders.
Anti-Takeover
Effects of Provisions of Our Amended and Restated Certificate of
Incorporation, Our Amended and Restated Bylaws and Delaware
Law
Some provisions of Delaware law, and our amended and restated
certificate of incorporation and our amended and restated bylaws
described below, contain provisions that could make the
following transactions more difficult: acquisitions of us by
means of a tender offer, a proxy contest or otherwise and
removal of our incumbent officers and directors. These
provisions may also have the effect of preventing
160
changes in our management. It is possible that these provisions
could make it more difficult to accomplish or could deter
transactions that stockholders may otherwise consider to be in
their best interest or in our best interests, including
transactions that might result in a premium over the market
price for our shares.
These provisions, summarized below, are expected to discourage
coercive takeover practices and inadequate takeover bids. These
provisions are also designed to encourage persons seeking to
acquire control of us to first negotiate with us. We believe
that the benefits of increased protection and our potential
ability to negotiate with the proponent of an unfriendly or
unsolicited proposal to acquire or restructure us outweigh the
disadvantages of discouraging these proposals because, among
other things, negotiation of these proposals could result in an
improvement of their terms.
Delaware
Law
We have opted out of the provisions of Section 203 of the
Delaware General Corporation Law, or DGCL, which regulates
corporate takeovers until such time as Warburg Pincus and,
subject to certain exceptions, its direct and indirect
transferees and their respective affiliates and successors, as
well as any group (within the meaning of
Rule 13d-5
of the Exchange Act) that includes any of the foregoing persons
or entities, do not beneficially own at least 15% of our common
stock. In general, those provisions prohibit a Delaware
corporation, including those whose securities are listed for
trading on the NYSE, from engaging in any business combination
with any interested stockholder for a period of three years
following the date that the stockholder became an interested
stockholder, unless:
|
|
|
| |
•
|
the transaction is approved by the board of directors before the
date the interested stockholder attained that status;
|
| |
| |
•
|
upon consummation of the transaction that resulted in the
stockholder becoming an interested stockholder, the interested
stockholder owned at least 85% of the voting stock of the
corporation outstanding at the time the transaction commenced; or
|
| |
| |
•
|
on or after such time the business combination is approved by
the board of directors and authorized at a meeting of
stockholders by at least two-thirds of the outstanding voting
stock that is not owned by the interested stockholder.
|
Section 203 defines “business combination” to
include the following:
|
|
|
| |
•
|
any merger or consolidation involving the corporation and the
interested stockholder;
|
| |
| |
•
|
any sale, transfer, pledge or other disposition of 10% or more
of the assets of the corporation involving the interested
stockholder;
|
| |
| |
•
|
subject to certain exceptions, any transaction that results in
the issuance or transfer by the corporation of any stock of the
corporation to the interested stockholder;
|
| |
| |
•
|
any transaction involving the corporation that has the effect of
increasing the proportionate share of the stock of any class or
series of the corporation beneficially owned by the interested
stockholder; or
|
| |
| |
•
|
the receipt by the interested stockholder of the benefit of any
loans, advances, guarantees, pledges or other financial benefits
provided by or through the corporation.
|
In general, Section 203 defines an interested stockholder
as any entity or person beneficially owning 15% or more of the
outstanding voting stock of the corporation and any entity or
person affiliated with or controlling or controlled by any of
these entities or persons.
161
Certificate of
Incorporation and Bylaws
Among other things, our amended and restated certificate of
incorporation and amended and restated bylaws:
|
|
|
| |
•
|
provide advance notice procedures with regard to stockholder
proposals relating to the nomination of candidates for election
as directors or new business to be brought before meetings of
our stockholders. These procedures provide that notice of
stockholder proposals must be timely given in writing to our
corporate secretary prior to the meeting at which the action is
to be taken. Generally, to be timely, notice must be received at
our principal executive offices not less than 90 days nor
more than 120 days prior to the first anniversary date of
the annual meeting for the preceding year. Our amended and
restated bylaws specify the requirements as to form and content
of all stockholders’ notices. These requirements may
preclude stockholders from bringing matters before the
stockholders at an annual or special meeting;
|
| |
| |
•
|
provide our board of directors the ability to authorize
undesignated preferred stock. This ability makes it possible for
our board of directors to issue, without stockholder approval,
preferred stock with voting or other rights or preferences that
could impede the success of any attempt to change control of us.
These and other provisions may have the effect of deterring
hostile takeovers or delaying changes in control or management
of our company;
|
| |
| |
•
|
provide that the authorized number of directors may be changed
only by resolution of our board of directors;
|
| |
| |
•
|
provide that all vacancies, including newly created
directorships, may, except as otherwise required by law, be
filled by the affirmative vote of a majority of directors then
in office, even if less than a quorum;
|
| |
| |
•
|
provide that any action required or permitted to be taken by the
stockholders must be effected at a duly called annual or special
meeting of stockholders and may not be effected by any consent
in writing in lieu of a meeting of such stockholders, subject to
the rights of the holders of any series of preferred stock;
|
| |
| |
•
|
provide that directors may be removed only for cause and only by
the affirmative vote of holders of at least
662/3%
of the voting power of our then outstanding common stock;
|
| |
| |
•
|
provide that our amended and restated certificate of
incorporation and amended and restated bylaws may be amended by
the affirmative vote of the holders of at least two-thirds of
our then outstanding common stock;
|
| |
| |
•
|
provide that special meetings of our stockholders may only be
called by the board of directors, the chief executive officer or
the chairman of the board; and
|
| |
| |
•
|
provide that our amended and restated bylaws can be amended or
repealed by our board of directors or our stockholders.
|
Limitation of
Liability and Indemnification Matters
Our amended and restated certificate of incorporation limits the
liability of our directors for monetary damages for breach of
their fiduciary duty as directors, except for the following
liabilities that cannot be eliminated under the DGCL:
|
|
|
| |
•
|
for any breach of their duty of loyalty to us or our
stockholders;
|
| |
| |
•
|
for acts or omissions not in good faith or which involve
intentional misconduct or a knowing violation of law;
|
| |
| |
•
|
for an unlawful payment of dividends or an unlawful stock
purchase or redemption, as provided under Section 174 of
the DGCL; or
|
| |
| |
•
|
for any transaction from which the director derived an improper
personal benefit.
|
162
Any amendment or repeal of these provisions will be prospective
only and would not affect any limitation on liability of a
director for acts or omissions that occurred prior to any such
amendment or repeal.
Our amended and restated bylaws also provide that we will
indemnify our directors and officers to the fullest extent
permitted by Delaware law. Our amended and restated bylaws also
permit us to purchase insurance on behalf of any of our
officers, directors, employees or agents or any person who is or
was serving at our request as an officer, director, employee or
agent of another enterprise for any expense, liability or loss
asserted against such person and incurred by any such person in
any such capacity, or arising out of that person’s status
as such, regardless of whether Delaware law would permit
indemnification.
We have entered into indemnification agreements with each of our
directors and officers. The agreements provide that we will
indemnify and hold harmless each indemnitee for certain expenses
to the fullest extent permitted or authorized by law, including
the DGCL, in effect on the date of the agreement or as it may be
amended to provide more advantageous rights to the indemnitee.
If such indemnification is unavailable as a result of a court
decision and if we and the indemnitee are jointly liable in the
proceeding, we will contribute funds to the indemnitee for his
expenses in proportion to relative benefit and fault of us and
indemnitee in the transaction giving rise to the proceeding. The
indemnification agreements also provide that we will indemnify
the indemnitee for monetary damages for actions taken as our
director or officer or for serving at our request as a director
or officer or another position at another corporation or
enterprise, as the case may be but only if (i) the
indemnitee acted in good faith and, in the case of conduct in
his official capacity, in a manner he reasonably believed to be
in our best interests and, in all other cases, not opposed to
the our best interests and (ii) in the case of a criminal
proceeding, the indemnitee must have had no reasonable cause to
believe that his conduct was unlawful. The indemnification
agreements also provide that we must advance payment of certain
expenses to the indemnitee, including fees of counsel, subject
to receipt of an undertaking from the indemnitee to return such
advance if it is it is ultimately determined that the indemnitee
is not entitled to indemnification.
We believe that the limitation of liability provision in our
amended and restated certificate of incorporation and the
indemnification agreements will facilitate our ability to
continue to attract and retain qualified individuals to serve as
directors and officers.
Corporate
Opportunity
Our amended and restated certificate of incorporation provides
that, to the fullest extent permitted by applicable law, we
renounce any interest or expectancy in any business opportunity,
transaction or other matter in which any of Warburg Pincus or
any private fund that it manages or advises, their affiliates
(other than us and our subsidiaries), their officers, directors,
partners, employees or other agents who serve as one of our
directors, Merrill Lynch Ventures L.P. 2001, its affiliates
(other than us and our subsidiaries), and any portfolio company
in which such entities or persons has an equity investment
(other than us and our subsidiaries) participates or desires or
seeks to participate in and that involves any aspect of the
energy business or industry, unless any such business
opportunity, transaction or matter is (i) offered to such
person in its capacity as one of our directors and with respect
to which no other such person (other than one of our directors)
independently receives notice or otherwise identifies such
business opportunity, transaction or matter or
(ii) identified by such person solely through the
disclosure of information by us or on our behalf.
Transfer Agent
and Registrar
The transfer agent and registrar for our common stock is
Computershare Trust Company, N.A.
Listing
Our common stock trades on the NYSE under the symbol
“TRGP.”
163
THE
PARTNERSHIP’S CASH DISTRIBUTION POLICY
Distributions of
Available Cash
General. The Partnership’s partnership
agreement requires that, within 45 days after the end of
each quarter, the Partnership distributes all of its available
cash from operating surplus for any quarter to unitholders of
record on the applicable record date in the following manner:
|
|
|
| |
•
|
first, 98% to all unitholders, pro rata, and 2% to the
General Partner, until the Partnership distributes for each
outstanding unit an amount equal to the minimum quarterly
distribution for that quarter; and
|
| |
| |
•
|
thereafter, in the manner described in
“—General Partner Interest and IDRs” below.
|
The preceding discussion is based on the assumptions that the
General Partner maintains its 2% general partner interest and
that the Partnership does not issue additional classes of equity
securities.
Definition of Available Cash. The term
“available cash,” for any quarter, means all cash and
cash equivalents on hand on the date of determination of
available cash for that quarter less the amount of cash reserves
established by the General Partner to:
|
|
|
| |
•
|
provide for the proper conduct of the Partnership’s
business;
|
| |
| |
•
|
comply with applicable law, any of the Partnership’s debt
instruments or other agreements; or
|
| |
| |
•
|
provide funds for distributions to the Partnership’s
unitholders and to the General Partner for any one or more of
the next four quarters.
|
Minimum Quarterly Distribution. The
Partnership will distribute to the holders of its common units
on a quarterly basis at least the minimum quarterly distribution
to the extent it has sufficient cash from its operations after
establishment of cash reserves and payment of fees and expenses,
including payments to the General Partner. However, there is no
guarantee that the Partnership will pay the minimum quarterly
distribution on the units in any quarter. Even if the
Partnership’s cash distribution policy is not modified or
revoked, the amount of distributions paid under its policy and
the decision to make any distribution is determined by the
General Partner, taking into consideration the terms of the
Partnership’s partnership agreement. The Partnership will
be prohibited from making any distributions to unitholders if it
would cause an event of default, or an event of default exists,
under its credit agreement.
General Partner Interest and IDRs. The General
Partner is currently entitled to 2% of all quarterly
distributions that the Partnership makes prior to its
liquidation. The General Partner has the right, but not the
obligation, to contribute a proportionate amount of capital to
the Partnership to maintain its current general partner
interest. The General Partner’s 2% interest in these
distributions may be reduced if the Partnership issues
additional units in the future and the General Partner does not
contribute a proportionate amount of capital to the Partnership
to maintain its 2% general partner interest.
The General Partner also currently holds IDRs that entitle it to
receive increasing percentages, up to a maximum of 50%, of the
cash the Partnership distributes from operating surplus (as
defined below) in excess of $0.3881 per unit per quarter. The
maximum distribution of 50% includes distributions paid to the
General Partner on its general partner interest and assumes that
the General Partner maintains its general partner interest at
2%. Please see “—General Partner Interest and
IDRs” for additional information.
Operating Surplus
and Capital Surplus
General. All cash distributed to unitholders
will be characterized as either “operating surplus” or
“capital surplus.” The Partnership’s partnership
agreement requires that the Partnership distribute available
cash from operating surplus differently than available cash from
capital surplus.
164
Operating Surplus. Operating surplus consists
of:
|
|
|
| |
•
|
an amount equal to four times the amount needed for any one
quarter for the Partnership to pay a distribution on all of its
units (including the general partner units) and the IDRs at the
same
per-unit
amount as was distributed in the immediately preceding quarter;
plus
|
| |
| |
•
|
all of the Partnership’s cash receipts, excluding cash from
borrowings, sales of equity and debt securities, sales or other
dispositions of assets outside the ordinary course of business,
capital contributions or corporate reorganizations or
restructurings (provided that cash receipts from the termination
of a commodity hedge or interest rate swap prior to its
specified termination date shall be included in operating
surplus in equal quarterly installments over the scheduled life
of such commodity hedge or interest rate swap); less
|
| |
| |
•
|
all of the Partnership’s operating expenditures, but
excluding the repayment of borrowings, and including maintenance
capital expenditures; less
|
| |
| |
•
|
the amount of cash reserves established by the General Partner
to provide funds for future operating expenditures.
|
Maintenance capital expenditures represent capital expenditures
made to replace partially or fully depreciated assets, to
maintain the existing operating capacity of the
Partnership’s assets and to extend their useful lives, or
other capital expenditures that are incurred in maintaining
existing system volumes and related cash flows. Expansion
capital expenditures represent capital expenditures made to
expand or to increase the efficiency of the existing operating
capacity of the Partnership’s assets or to expand the
operating capacity or revenues of existing or new assets,
whether through construction or acquisition. Costs for repairs
and minor renewals to maintain facilities in operating condition
and that do not extend the useful life of existing assets will
be treated as operating expenses as the Partnership incurs them.
The Partnership’s partnership agreement provides that the
General Partner determines how to allocate a capital expenditure
for the acquisition or expansion of the Partnership’s
assets between maintenance capital expenditures and expansion
capital expenditures.
Capital Surplus. Capital surplus generally
consists of:
|
|
|
| |
•
|
borrowings;
|
| |
| |
•
|
sales of the Partnership’s equity and debt securities;
|
| |
| |
•
|
sales or other dispositions of assets for cash, other than
inventory, accounts receivable and other current assets sold in
the ordinary course of business or as part of normal retirement
or replacement of assets;
|
| |
| |
•
|
capital contributions received; and
|
| |
| |
•
|
corporate restructurings.
|
Characterization of Cash Distributions. The
Partnership’s partnership agreement requires that the
Partnership treat all available cash distributed as coming from
operating surplus until the sum of all available cash
distributed since it began operations equals the operating
surplus as of the most recent date of determination of available
cash. The Partnership’s partnership agreement requires that
it treat any amount distributed in excess of operating surplus,
regardless of its source, as capital surplus. As reflected
above, operating surplus includes an amount equal to four times
the amount needed for any one quarter for the Partnership to pay
a distribution on all of its units (including the general
partner units) and the IDRs at the same
per-unit
amount as was distributed in the immediately preceding quarter.
This amount does not reflect actual cash on hand that is
available for distribution to the Partnership’s
unitholders. Rather, it is a provision that will enable the
Partnership, if it chooses, to distribute as operating surplus
up to this amount of cash it receives in the future from
non-operating sources, such as asset sales, issuances of
securities, and borrowings, that would otherwise be distributed
as capital surplus. The Partnership does not anticipate that it
will make any distributions from capital surplus.
165
General Partner
Interest and IDRs
The Partnership’s partnership agreement provides that the
General Partner is entitled to 2% of all distributions that the
Partnership makes prior to its liquidation as long as the
General Partner maintains its current 2% interest in the
Partnership. The General Partner has the right, but not the
obligation, to contribute a proportionate amount of capital to
the Partnership to maintain its 2% general partner interest if
the Partnership issues additional units. The General
Partner’s 2% interest, and the percentage of the
Partnership’s cash distributions to which it is entitled,
will be proportionately reduced if the Partnership issues
additional units in the future and the General Partner does not
contribute a proportionate amount of capital to the Partnership
in order to maintain its 2% general partner interest. The
General Partner will be entitled to make a capital contribution
in order to maintain its 2% general partner interest in the form
of the contribution to the Partnership of common units that it
may hold based on the current market value of the contributed
common units.
IDRs represent the right to receive an increasing percentage
(13%, 23% and 48%) of quarterly distributions of available cash
from operating surplus after the minimum quarterly distribution
and the target distribution levels have been achieved. The
General Partner currently holds the IDRs, but may transfer these
rights separately from its general partner interest, subject to
restrictions in the partnership agreement.
The following discussion assumes that the General Partner
maintains its 2% general partner interest and continues to own
the IDRs.
If for any quarter the Partnership has distributed available
cash from operating surplus to the common unitholders in an
amount equal to the minimum quarterly distribution, then, the
partnership agreement requires that the Partnership distribute
any additional available cash from operating surplus for that
quarter among the unitholders and the General Partner in the
following manner:
|
|
|
| |
•
|
first, 98% to all unitholders, pro rata, and 2% to the
General Partner, until each unitholder receives a total of
$0.3881 per unit for that quarter (the “first target
distribution”);
|
| |
| |
•
|
second, 85% to all unitholders, pro rata, and 15% to the
General Partner, until each unitholder receives a total of
$0.4219 per unit for that quarter (the “second target
distribution”);
|
| |
| |
•
|
third, 75% to all unitholders, pro rata, and 25% to the
General Partner, until each unitholder receives a total of
$0.50625 per unit for that quarter (the “third target
distribution”); and
|
| |
| |
•
|
thereafter, 50% to all unitholders, pro rata, and 50% to
the General Partner.
|
166
Percentage
Allocations of Available Cash from Operating Surplus
The following table illustrates the percentage allocations of
available cash from operating surplus between the unitholders
and the General Partner based on the specified target
distribution levels. The amounts set forth under “Marginal
Percentage Interest in Distributions” are the percentage
interests of the General Partner and the unitholders in any
available cash from operating surplus the Partnership
distributes up to and including the corresponding amount in the
column “Total Quarterly Distribution Per Unit Target
Amount,” until available cash from operating surplus the
Partnership distributes reaches the next target distribution
level, if any. The percentage interests shown for the
unitholders and the General Partner for the minimum quarterly
distribution are also applicable to quarterly distribution
amounts that are less than the minimum quarterly distribution.
The percentage interests set forth below for the General Partner
include its 2% general partner interest and assume the General
Partner has contributed any additional capital to maintain its
2% general partner interest and has not transferred its IDRs.
| |
|
|
|
|
|
|
|
|
|
|
|
|
|
|
|
Marginal Percentage
|
|
|
|
Total Quarterly
|
|
Interest in Distributions
|
|
|
|
Distribution per Unit
|
|
|
|
General
|
|
|
|
Target Amount
|
|
Unitholders
|
|
Partner
|
|
|
|
Minimum Quarterly Distribution
|
|
$0.3375
|
|
|
98
|
%
|
|
|
2
|
%
|
|
First Target Distribution
|
|
up to $0.3881
|
|
|
98
|
%
|
|
|
2
|
%
|
|
Second Target Distribution
|
|
above $0.3881 up to $0.4219
|
|
|
85
|
%
|
|
|
15
|
%
|
|
Third Target Distribution
|
|
above $0.4219 up to $0.50625
|
|
|
75
|
%
|
|
|
25
|
%
|
|
Thereafter
|
|
above $0.50625
|
|
|
50
|
%
|
|
|
50
|
%
|
General
Partner’s Right to Reset Incentive Distribution
Levels
The General Partner, as the holder of the Partnership’s
IDRs, has the right under the Partnership’s partnership
agreement to elect to relinquish the right to receive incentive
distribution payments based on the initial cash target
distribution levels and to reset, at higher levels, the minimum
quarterly distribution amount and cash target distribution
levels upon which the incentive distribution payments to the
General Partner would be set. The General Partner’s right
to reset the minimum quarterly distribution amount and the
target distribution levels upon which the incentive
distributions payable to the General Partner are based may be
exercised, without approval of the Partnership’s
unitholders or the conflicts committee of the General Partner,
at anytime when the Partnership has made cash distributions to
the holders of the IDRs at the highest level of incentive
distribution for each of the prior four consecutive fiscal
quarters. The reset minimum quarterly distribution amount and
target distribution levels will be higher than the minimum
quarterly distribution amount and the target distribution levels
prior to the reset such that the General Partner will not
receive any incentive distributions under the reset target
distribution levels until cash distributions per unit following
this event increase as described below. The Partnership
anticipates that the General Partner would exercise this reset
right in order to facilitate acquisitions or growth projects
that would otherwise not be sufficiently accretive to cash
distributions per common unit, taking into account the existing
levels of incentive distribution payments being made to the
General Partner.
In connection with the resetting of the minimum quarterly
distribution amount and the target distribution levels and the
corresponding relinquishment by the General Partner of incentive
distribution payments based on the target cash distributions
prior to the reset, the General Partner will be entitled to
receive a number of newly issued Class B units based on a
predetermined formula described below that takes into account
the “cash parity” value of the average cash
distributions related to the IDRs received by the General
Partner for the two quarters prior to the reset event as
compared to the average cash distributions per common unit
during this period.
The number of Class B units that the General Partner would
be entitled to receive from the Partnership in connection with a
resetting of the minimum quarterly distribution amount and the
target distribution levels then in effect would be equal to
(x) the average amount of cash distributions received by
the General Partner in respect of its IDRs during the two
consecutive fiscal quarters ended immediately prior
167
to the date of such reset election divided by (y) the
average of the amount of cash distributed per common unit during
each of these two quarters. Each Class B unit will be
convertible into one common unit at the election of the holder
of the Class B unit at any time following the first
anniversary of the issuance of these Class B units. The
Partnership will also issue an additional amount of general
partner units in order to maintain the General Partner’s
ownership interest in the Partnership relative to the issuance
of the Class B units.
Following a reset election by the General Partner, the minimum
quarterly distribution amount will be reset to an amount equal
to the average cash distribution amount per common unit for the
two fiscal quarters immediately preceding the reset election
(such amount is referred to as the “reset minimum quarterly
distribution”) and the target distribution levels will be
reset to be correspondingly higher such that the Partnership
would distribute all of its available cash from operating
surplus for each quarter thereafter as follows:
|
|
|
| |
•
|
first, 98% to all unitholders, pro rata, and 2% to the
General Partner, until each unitholder receives an amount equal
to 115% of the reset minimum quarterly distribution for that
quarter;
|
| |
| |
•
|
second, 85% to all unitholders, pro rata, and 15% to the
General Partner, until each unitholder receives an amount per
unit equal to 125% of the reset minimum quarterly distribution
for that quarter;
|
| |
| |
•
|
third, 75% to all unitholders, pro rata, and 25% to the
General Partner, until each unitholder receives an amount per
unit equal to 150% of the reset minimum quarterly distribution
for that quarter; and
|
| |
| |
•
|
thereafter, 50% to all unitholders, pro rata, and 50% to
the General Partner.
|
Distributions
from Capital Surplus
How Distributions from Capital Surplus Will Be
Made. The Partnership’s partnership
agreement requires that the Partnership make distributions of
available cash from capital surplus, if any, in the following
manner:
|
|
|
| |
•
|
first, 98% to all unitholders, pro rata, and 2% to the
General Partner, until the Partnership distributes for each
common unit an amount of available cash from capital surplus
equal to the initial public offering price; and
|
| |
| |
•
|
thereafter, the Partnership will make all distributions
of available cash from capital surplus as if they were from
operating surplus.
|
Effect of a Distribution from Capital
Surplus. The Partnership’s partnership
agreement treats a distribution of capital surplus as the
repayment of the initial unit price from the initial public
offering, which is a return of capital. The initial public
offering price less any distributions of capital surplus per
unit is referred to as the “unrecovered initial unit
price.” Each time a distribution of capital surplus is
made, the minimum quarterly distribution and the target
distribution levels will be reduced in the same proportion as
the corresponding reduction in the unrecovered initial unit
price. Because distributions of capital surplus will reduce the
minimum quarterly distribution, after any of these distributions
are made, it may be easier for the General Partner to receive
incentive distributions. However, any distribution of capital
surplus before the unrecovered initial unit price is reduced to
zero cannot be applied to the payment of the minimum quarterly
distribution or any arrearages.
Once the Partnership distributes capital surplus on a unit in an
amount equal to the initial unit price, its partnership
agreement specifies that the minimum quarterly distribution and
the target distribution levels will be reduced to zero. The
Partnership’s partnership agreement specifies that the
Partnership then makes all future distributions from operating
surplus, with 50% being paid to the holders of units and 50% to
the General Partner. The percentage interests shown for the
General Partner include its 2% general partner interest and
assume the General Partner has not transferred the IDRs.
168
Adjustment to the
Minimum Quarterly Distribution and Target Distribution
Levels
In addition to adjusting the minimum quarterly distribution and
target distribution levels to reflect a distribution of capital
surplus, if the Partnership combines its units into fewer units
or subdivides its units into a greater number of units, the
partnership agreement specifies that the following items will be
proportionately adjusted:
|
|
|
| |
•
|
the minimum quarterly distribution;
|
| |
| |
•
|
target distribution levels; and
|
| |
| |
•
|
the unrecovered initial unit price.
|
For example, if a
two-for-one
split of the Partnership’s common units should occur, the
minimum quarterly distribution, the target distribution levels
and the unrecovered initial unit price would each be reduced to
50% of its initial level. The Partnership’s partnership
agreement provides that the Partnership not make any adjustment
by reason of the issuance of additional units for cash or
property.
In addition, if legislation is enacted or if existing law is
modified or interpreted by a governmental taxing authority, so
that the Partnership becomes taxable as a corporation or
otherwise subject to taxation as an entity for federal, state or
local income tax purposes, the partnership agreement specifies
that the General Partner may reduce the minimum quarterly
distribution and the target distribution levels for each quarter
by multiplying each distribution level by a fraction, the
numerator of which is available cash for that quarter and the
denominator of which is the sum of available cash for that
quarter plus the General Partner’s estimate of the
Partnership’s aggregate liability for the quarter for such
income taxes payable by reason of such legislation or
interpretation. To the extent that the actual tax liability
differs from the estimated tax liability for any quarter, the
difference will be accounted for in subsequent quarters.
Distributions of
Cash Upon Liquidation
General. If the Partnership dissolves in
accordance with the partnership agreement, it will sell or
otherwise dispose of its assets in a process called liquidation.
The Partnership will first apply the proceeds of liquidation to
the payment of its creditors. The Partnership will distribute
any remaining proceeds to the unitholders and the General
Partner, in accordance with their capital account balances, as
adjusted to reflect any gain or loss upon the sale or other
disposition of the Partnership’s assets in liquidation.
The allocations of gain and loss upon liquidation are intended,
to the extent required, to permit common unitholders to receive
their unrecovered initial unit price plus the minimum quarterly
distribution for the quarter during which liquidation occurs.
However, there may not be sufficient gain upon the
Partnership’s liquidation to enable the holders of common
units to fully recover all of these amounts. Any further net
gain recognized upon liquidation will be allocated in a manner
that takes into account the IDRs of the General Partner.
Manner of Adjustments for Gain. The manner of
the adjustment for gain is set forth in the partnership
agreement. The Partnership will allocate any gain to the
partners in the following manner:
|
|
|
| |
•
|
first, to the General Partner and the holders of units
who have negative balances in their capital accounts to the
extent of and in proportion to those negative balances;
|
| |
| |
•
|
second, 98% to the common unitholders, pro rata, and 2%
to the General Partner, until the capital account for each
common unit is equal to the sum of: (1) the unrecovered
initial unit price; and (2) the amount of the minimum
quarterly distribution for the quarter during which the
Partnership’s liquidation occurs;
|
| |
| |
•
|
third, 98% to all unitholders, pro rata, and 2% to the
General Partner, until the Partnership allocates under this
paragraph an amount per unit equal to: (1) the sum of the
excess of the first target distribution per unit over the
minimum quarterly distribution per unit for each quarter of the
Partnership’s existence; less (2) the cumulative
amount per unit of any distributions of available cash from
operating surplus in excess of the minimum quarterly
distribution per unit
|
169
|
|
|
| |
|
that the Partnership distributed 98% to the unitholders, pro
rata, and 2% to the General Partner, for each quarter of the
Partnership’s existence;
|
|
|
|
| |
•
|
fourth, 85% to all unitholders, pro rata, and 15% to the
General Partner, until the Partnership allocates under this
paragraph an amount per unit equal to: (1) the sum of the
excess of the second target distribution per unit over the first
target distribution per unit for each quarter of the
Partnership’s existence; less (2) the cumulative
amount per unit of any distributions of available cash from
operating surplus in excess of the first target distribution per
unit that the Partnership distributed 85% to the unitholders,
pro rata, and 15% to the General Partner for each quarter of the
Partnership’s existence;
|
| |
| |
•
|
fifth, 75% to all unitholders, pro rata, and 25% to the
General Partner, until the Partnership allocates under this
paragraph an amount per unit equal to: (1) the sum of the
excess of the third target distribution per unit over the second
target distribution per unit for each quarter of the
Partnership’s existence; less (2) the cumulative
amount per unit of any distributions of available cash from
operating surplus in excess of the second target distribution
per unit that the Partnership distributed 75% to the
unitholders, pro rata, and 25% to the General Partner for each
quarter of the Partnership’s existence; and
|
| |
| |
•
|
thereafter, 50% to all unitholders, pro rata, and 50% to
the General Partner.
|
The percentage interests set forth above for the General Partner
include its 2% general partner interest and assume the General
Partner has not transferred the IDRs.
Manner of Adjustments for Losses. After making
allocations of loss to the General Partner and the unitholders
in a manner intended to offset in reverse order the allocations
of gains that have previously been allocated, the Partnership
will generally allocate any loss to the General Partner and the
unitholders in the following manner:
|
|
|
| |
•
|
first, 98% to the holders of common units in proportion
to the positive balances in their capital accounts and 2% to the
General Partner, until the capital accounts of the common
unitholders have been reduced to zero; and
|
| |
| |
•
|
thereafter, 100% to the General Partner.
|
Adjustments to Capital Accounts. The
Partnership’s partnership agreement requires that it make
adjustments to capital accounts upon the issuance of additional
units. In this regard, the partnership agreement specifies that
the Partnership allocates any unrealized and, for tax purposes,
unrecognized gain or loss resulting from the adjustments to the
unitholders and the General Partner in the same manner as the
Partnership allocates gain or loss upon liquidation. In the
event that the Partnership makes positive adjustments to the
capital accounts upon the issuance of additional units, the
partnership agreement requires that the Partnership allocate any
later negative adjustments to the capital accounts resulting
from the issuance of additional units or upon the
Partnership’s liquidation in a manner which results, to the
extent possible, in the General Partner’s capital account
balances equaling the amount which they would have been if no
earlier positive adjustments to the capital accounts had been
made.
170
MATERIAL
PROVISIONS OF THE PARTNERSHIP’S PARTNERSHIP
AGREEMENT
The following is a summary of the material provisions of the
Partnership’s partnership agreement.
Organization and
Duration
The Partnership was organized on October 23, 2006 and will
have a perpetual existence unless terminated pursuant to the
terms of its partnership agreement.
Purpose
The Partnership’s purpose under the partnership agreement
is limited to any business activity that is approved by the
General Partner and that lawfully may be conducted by a limited
partnership organized under Delaware law; provided, that the
General Partner shall not cause the Partnership to engage,
directly or indirectly, in any business activity that the
General Partner determines would cause the Partnership to be
treated as an association taxable as a corporation or otherwise
taxable as an entity for federal income tax purposes.
Power of
Attorney
Each limited partner, and each person who acquires a unit from a
unitholder, by accepting the common unit, automatically grants
to the General Partner and, if appointed, a liquidator, a power
of attorney to, among other things, execute and file documents
required for the Partnership’s qualification, continuance
or dissolution. The power of attorney also grants the General
Partner the authority to amend, and to make consents and waivers
under, the Partnership’s partnership agreement.
Capital
Contributions
Unitholders are not obligated to make additional capital
contributions, except as described below under
“—Limited Liability.”
The General Partner has the right, but not the obligation, to
contribute a proportionate amount of capital to the Partnership
to maintain its 2% general partner interest if the Partnership
issues additional units. The General Partner’s 2% interest,
and the percentage of the Partnership’s cash distributions
to which it is entitled, will be proportionately reduced if the
Partnership issues additional units in the future and the
General Partner does not contribute a proportionate amount of
capital to the Partnership to maintain its 2% general partner
interest. The General Partner will be entitled to make a capital
contribution in order to maintain its 2% general partner
interest in the form of the contribution to the Partnership of
common units based on the current market value of the
contributed common units.
Voting
Rights
The following is a summary of the unitholder vote required for
the matters specified below. Matters requiring the approval of a
“unit majority” require the approval of a majority of
the Partnership’s common units and Class B units, if
any, voting as a class.
171
In voting their common units and Class B units, the General
Partner and its affiliates will have no fiduciary duty or
obligation whatsoever to the Partnership or the limited
partners, including any duty to act in good faith or in the best
interests of the Partnership or the limited partners.
| |
|
|
|
Issuance of additional units
|
|
No approval right.
|
|
Amendment of the partnership agreement
|
|
Certain amendments may be made by the General Partner without
the approval of the unitholders. Other amendments generally
require the approval of a unit majority. Please see
“—Amendment of the Partnership Agreement.”
|
|
Merger of the Partnership or the sale of all or substantially
all of the Partnership’s assets
|
|
Unit majority in certain circumstances. Please see
“—Merger, Consolidation, Conversion, Sale or Other
Disposition of Assets.”
|
|
Dissolution of the Partnership
|
|
Unit majority. Please see “—Termination and
Dissolution.”
|
|
Continuation of the Partnership’s business upon dissolution
|
|
Unit majority. Please see “—Termination and
Dissolution.”
|
|
Withdrawal of the General Partner
|
|
Under most circumstances, the approval of a majority of the
Partnership’s common units, excluding common units held by
the General Partner and its affiliates, is required for the
withdrawal of the General Partner prior to December 31, 2016 in
a manner that would cause dissolution of the Partnership’s
partnership. Please see “—Withdrawal or Removal of the
General Partner.”
|
|
Removal of the General Partner
|
|
Not less than
662/3%
of the outstanding units, voting as a single class, including
units held by the General Partner and its affiliates. Please see
“—Withdrawal or Removal of the General Partner.”
|
|
Transfer of the general partner interest
|
|
The General Partner may transfer all, but not less than all, of
its general partner interest in the Partnership’s without a
vote of the Partnership’s unitholders to an affiliate or
another person in connection with its merger or consolidation
with or into, or sale of all or substantially all of its assets,
to such person. The approval of a majority of the
Partnership’s common units, excluding common units held by
the General Partner and its affiliates, is required in other
circumstances for a transfer of the General Partner interest to
a third party prior to December 31, 2016. See
“—Transfer of General Partner Units.”
|
|
Transfer of IDRs
|
|
Except for transfers to an affiliate or another person as part
of the General Partner’s merger or consolidation, sale of
all or substantially all of its assets or the sale of all of the
ownership interests in such holder, the approval of a majority
of the Partnership’s common units, excluding common units
held by the General Partner and its affiliates, is required in
most circumstances for a transfer of the IDRs to a third party
prior to December 31, 2016. Please see “—Transfer of
IDRs.”
|
|
Transfer of ownership interests in the General Partner
|
|
No approval required at any time. Please see Partner
“—Transfer of Ownership Interests in the General
Partner.”
|
172
Limited
Liability
Assuming that a limited partner does not participate in the
control of the Partnership’s business within the meaning of
the Delaware Act and that he otherwise acts in conformity with
the provisions of the partnership agreement, his liability under
the Delaware Act will be limited, subject to possible
exceptions, to the amount of capital he is obligated to
contribute to the Partnership for his common units plus his
share of any undistributed profits and assets. If it were
determined, however, that the right, or exercise of the right,
by the limited partners as a group:
|
|
|
| |
•
|
to remove or replace the General Partner;
|
| |
| |
•
|
to approve some amendments to the partnership agreement; or
|
| |
| |
•
|
to take other action under the partnership agreement,
|
constituted “participation in the control” of the
Partnership’s business for the purposes of the Delaware
Act, then the limited partners could be held personally liable
for the Partnership’s obligations under the laws of
Delaware, to the same extent as the General Partner. This
liability would extend to persons who transact business with the
Partnership who reasonably believe that the limited partner is a
general partner. Neither the partnership agreement nor the
Delaware Act specifically provides for legal recourse against
the General Partner if a limited partner were to lose limited
liability through any fault of the General Partner. While this
does not mean that a limited partner could not seek legal
recourse, the Partnership knows of no precedent for this type of
a claim in Delaware case law.
Under the Delaware Act, a limited partnership may not make a
distribution to a partner if, after the distribution, all
liabilities of the limited partnership, other than liabilities
to partners on account of their partnership interests and
liabilities for which the recourse of creditors is limited to
specific property of the partnership, would exceed the fair
value of the assets of the limited partnership. For the purpose
of determining the fair value of the assets of a limited
partnership, the Delaware Act provides that the fair value of
property subject to liability for which recourse of creditors is
limited shall be included in the assets of the limited
partnership only to the extent that the fair value of that
property exceeds the nonrecourse liability. The Delaware Act
provides that a limited partner who receives a distribution and
knew at the time of the distribution that the distribution was
in violation of the Delaware Act shall be liable to the limited
partnership for the amount of the distribution for three years.
Under the Delaware Act, a substituted limited partner of a
limited partnership is liable for the obligations of his
assignor to make contributions to the partnership, except that
such person is not obligated for liabilities unknown to him at
the time he became a limited partner and that could not be
ascertained from the partnership agreement.
The Partnership’s subsidiaries conduct business in Texas
and Louisiana, as well as other states. Maintenance of the
Partnership’s limited liability as a limited partner of
Targa Resources Operating LP (the “Operating
Partnership”), may require compliance with legal
requirements in the jurisdictions in which the Operating
Partnership conducts business, including qualifying the
Partnership’s subsidiaries to do business there.
Limitations on the liability of limited partners for the
obligations of a limited partner have not been clearly
established in many jurisdictions. If, by virtue of the
Partnership’s partnership interest in the Operating
Partnership or otherwise, it were determined that the
Partnership were conducting business in any state without
compliance with the applicable limited partnership or limited
liability company statute, or that the right or exercise of the
right by the limited partners as a group to remove or replace
the General Partner, to approve some amendments to the
partnership agreement, or to take other action under the
partnership agreement constituted “participation in the
control” of the Partnership’s business for purposes of
the statutes of any relevant jurisdiction, then the limited
partners could be held personally liable for the
Partnership’s obligations under the law of that
jurisdiction to the same extent as the General Partner under the
circumstances. The Partnership will operate in a manner that the
General Partner considers reasonable and necessary or
appropriate to preserve the limited liability of the limited
partners.
173
Issuance of
Additional Securities
The Partnership’s partnership agreement authorizes the
Partnership to issue an unlimited number of additional
partnership securities for the consideration and on the terms
and conditions determined by the General Partner without the
approval of the unitholders.
It is possible that the Partnership will fund acquisitions
through the issuance of additional common units or other
partnership securities. Holders of any additional common units
the Partnership issues will be entitled to share equally with
the then-existing holders of common units in its distributions
of available cash. In addition, the issuance of additional
common units or other partnership securities may dilute the
value of the interests of the then-existing holders of common
units in the Partnership’s net assets.
In accordance with Delaware law and the provisions of the
Partnership’s partnership agreement, the Partnership may
also issue additional partnership securities that, as determined
by the General Partner, may have special voting rights to which
the Partnership’s common units are not entitled. In
addition, the partnership agreement does not prohibit the
issuance by the Partnership’s subsidiaries of equity
securities, which may effectively rank senior to the
Partnership’s common units.
Upon the issuance of additional partnership securities, the
General Partner will be entitled, but not required, to make
additional capital contributions to the extent necessary to
maintain its 2% general partner interest in the Partnership. The
General Partner’s 2% interest in the Partnership will be
reduced if the Partnership issues additional units in the future
(other than the issuance of units issued in connection with a
reset of the incentive distribution target levels relating to
the General Partner’s IDRs or the issuance of units upon
conversion of outstanding partnership securities) and the
General Partner does not contribute a proportionate amount of
capital to the Partnership to maintain its 2% general partner
interest. Moreover, the General Partner will have the right,
which it may from time to time assign in whole or in part to any
of its affiliates, to purchase common units or other partnership
securities whenever, and on the same terms that, the Partnership
issues those securities to persons other than the General
Partner and its affiliates, to the extent necessary to maintain
the percentage interest of the General Partner and its
affiliates, including such interest represented by common units
that existed immediately prior to each issuance. The holders of
common units will not have preemptive rights to acquire
additional common units or other partnership securities.
Amendment of the
Partnership Agreement
General. Amendments to the Partnership’s
partnership agreement may be proposed only by or with the
consent of the General Partner. However, the General Partner
will have no duty or obligation to propose any amendment and may
decline to do so free of any fiduciary duty or obligation
whatsoever to the Partnership or the limited partners, including
any duty to act in good faith or in the best interests of the
Partnership or the limited partners. In order to adopt a
proposed amendment, other than the amendments discussed below,
the General Partner is required to seek written approval of the
holders of the number of units required to approve the amendment
or call a meeting of the limited partners to consider and vote
upon the proposed amendment. Except as described below, an
amendment must be approved by a unit majority.
Prohibited Amendments. No amendment may be
made that would:
|
|
|
| |
•
|
enlarge the obligations of any limited partner without its
consent, unless approved by at least a majority of the type or
class of limited partner interests so affected; or
|
| |
| |
•
|
enlarge the obligations of, restrict in any way any action by or
rights of, or reduce in any way the amounts distributable,
reimbursable or otherwise payable by the Partnership to the
General Partner or any of its affiliates without the consent of
the General Partner, which consent may be given or withheld at
its option.
|
The provision of the Partnership’s partnership agreement
preventing the amendments having the effects described in any of
the clauses above can be amended upon the approval of the
holders of at least 90% of the outstanding units voting together
as a single class (including units owned by the General Partner
and its affiliates).
174
No Unitholder Approval. The General Partner
may generally make amendments to the Partnership’s
partnership agreement without the approval of any limited
partner or assignee to reflect:
|
|
|
| |
•
|
a change in the Partnership’s name, the location of its
principal place of its business, its registered agent or its
registered office;
|
| |
| |
•
|
the admission, substitution, withdrawal or removal of partners
in accordance with the Partnership’s partnership agreement;
|
| |
| |
•
|
a change that the General Partner determines to be necessary or
appropriate to qualify or continue the Partnership’s
qualification as a limited partnership or a partnership in which
the limited partners have limited liability under the laws of
any state or to ensure that neither the Partnership nor the
Operating Partnership nor any of its subsidiaries will be
treated as an association taxable as a corporation or otherwise
taxed as an entity for federal income tax purposes;
|
| |
| |
•
|
a change in the Partnership’s fiscal year and related
changes;
|
| |
| |
•
|
an amendment that is necessary, in the opinion of the
Partnership’s counsel, to prevent the Partnership or the
General Partner or the directors, officers, agents or trustees
of the General Partner from in any manner being subjected to the
provisions of the Investment Company Act of 1940, the Investment
Advisors Act of 1940, or “plan asset” regulations
adopted under the Employee Retirement Income Security Act of
1974, or ERISA, whether or not substantially similar to plan
asset regulations currently applied or proposed;
|
| |
| |
•
|
an amendment that the General Partner determines to be necessary
or appropriate for the authorization of additional partnership
securities or rights to acquire partnership securities,
including any amendment that the General Partner determines is
necessary or appropriate in connection with:
|
|
|
|
| |
•
|
the adjustments of the minimum quarterly distribution, first
target distribution, second target distribution and third target
distribution in connection with the reset of the General
Partner’s IDRs as described under “The
Partnership’s Cash Distribution Policy—General
Partner’s Right to Reset Incentive Distribution
Levels”;
|
| |
| |
•
|
the implementation of the provisions relating to the General
Partner’s right to reset its IDRs in exchange for
Class B units; or
|
| |
| |
•
|
any modification of the IDRs made in connection with the
issuance of additional partnership securities or rights to
acquire partnership securities, provided that, any such
modifications and related issuance of partnership securities
have received approval by a majority of the members of the
conflicts committee of the General Partner;
|
|
|
|
| |
•
|
any amendment expressly permitted in the Partnership’s
partnership agreement to be made by the General Partner acting
alone;
|
| |
| |
•
|
an amendment effected, necessitated or contemplated by a merger
agreement that has been approved under the terms of the
Partnership’s partnership agreement;
|
| |
| |
•
|
any amendment that the General Partner determines to be
necessary or appropriate for the formation by the Partnership
of, or the Partnership’s investment in, any corporation,
partnership or other entity, as otherwise permitted by the
partnership agreement;
|
| |
| |
•
|
conversions into, mergers with or conveyances to another limited
liability entity that is newly formed and has no assets,
liabilities or operations at the time of the conversion, merger
or conveyance other than those it receives by way of the
conversion, merger or conveyance; or
|
| |
| |
•
|
any other amendments substantially similar to any of the matters
described in the clauses above.
|
175
In addition, the General Partner may make amendments to the
Partnership’s partnership agreement without the approval of
any limited partner if the General Partner determines that those
amendments:
|
|
|
| |
•
|
do not adversely affect the limited partners (or any particular
class of limited partners) in any material respect;
|
| |
| |
•
|
are necessary or appropriate to satisfy any requirements,
conditions or guidelines contained in any opinion, directive,
order, ruling or regulation of any federal or state agency or
judicial authority or contained in any federal or state statute;
|
| |
| |
•
|
are necessary or appropriate to facilitate the trading of
limited partner interests or to comply with any rule,
regulation, guideline or requirement of any securities exchange
on which the limited partner interests are or will be listed for
trading;
|
| |
| |
•
|
are necessary or appropriate for any action taken by the General
Partner relating to splits;
|
| |
| |
•
|
combinations of units under the provisions of the
Partnership’s partnership agreement; or
|
| |
| |
•
|
are required to effect the intent expressed in this prospectus
or the intent of the provisions of the Partnership’s
partnership agreement or are otherwise contemplated by the
Partnership’s partnership agreement.
|
Opinion of Counsel and Unitholder
Approval. For amendments of the type not
requiring unitholder approval, the General Partner will not be
required to obtain an opinion of counsel that an amendment will
not result in a loss of limited liability to the limited
partners or result in the Partnership being treated as an
association taxable as a corporation or otherwise taxable as an
entity for federal income tax purposes in connection with any of
the amendments. No amendments to the Partnership’s
partnership agreement other than those described above under
“—Amendment of the Partnership Agreement—No
Unitholder Approval” will become effective without the
approval of holders of at least 90% of the outstanding units
voting as a single class unless the Partnership first obtains an
opinion of counsel to the effect that the amendment will not
affect the limited liability under applicable law of any of the
Partnership’s limited partners.
In addition to the above restrictions, any amendment that would
have a material adverse effect on the rights or preferences of
any type or class of outstanding units in relation to other
classes of units will require the approval of at least a
majority of the type or class of units so affected. Any
amendment that reduces the voting percentage required to take
any action is required to be approved by the affirmative vote of
limited partners whose aggregate outstanding units constitute
not less than the voting requirement sought to be reduced.
Merger,
Consolidation, Conversion, Sale or Other Disposition of
Assets
A merger, consolidation or conversion of the Partnership
requires the prior consent of the General Partner. However, the
General Partner will have no duty or obligation to consent to
any merger, consolidation or conversion and may decline to do so
free of any fiduciary duty or obligation whatsoever to the
Partnership or the limited partners, including any duty to act
in good faith or in the best interest of the Partnership or the
limited partners.
In addition, the partnership agreement generally prohibits the
General Partner without the prior approval of the holders of a
unit majority, from causing the Partnership to, among other
things, sell, exchange or otherwise dispose of all or
substantially all of the Partnership’s assets in a single
transaction or a series of related transactions, including by
way of merger, consolidation or other combination, or approving
on the Partnership’s behalf the sale, exchange or other
disposition of all or substantially all of the assets of the
Partnership’s subsidiaries. The General Partner may,
however, mortgage, pledge, hypothecate or grant a security
interest in all or substantially all of the Partnership’s
assets without that approval. The General Partner may also sell
all or substantially all of the Partnership’s assets under
a foreclosure or other realization upon those encumbrances
without that approval. Finally, the General
176
Partner may consummate any merger without the prior approval of
the Partnership’s unitholders if the Partnership is the
surviving entity in the transaction, the General Partner has
received an opinion of counsel regarding limited liability and
tax matters, the transaction would not result in a material
amendment to the partnership agreement, each of the
Partnership’s units will be an identical unit of the
partnership following the transaction, and the partnership
securities to be issued do not exceed 20% of the
Partnership’s outstanding partnership securities
immediately prior to the transaction.
If the conditions specified in the partnership agreement are
satisfied, the General Partner may convert the Partnership or
any of its subsidiaries into a new limited liability entity or
merge the Partnership or any of its subsidiaries into, or convey
all of the Partnership’s assets to, a newly formed entity
if the sole purpose of that conversion, merger or conveyance is
to effect a mere change in the Partnership’s legal form
into another limited liability entity, the General Partner has
received an opinion of counsel regarding limited liability and
tax matters, and the governing instruments of the new entity
provide the limited partners and the General Partner with the
same rights and obligations as contained in the partnership
agreement. The unitholders are not entitled to dissenters’
rights of appraisal under the partnership agreement or
applicable Delaware law in the event of a conversion, merger or
consolidation, a sale of substantially all of the
Partnership’s assets or any other similar transaction or
event.
Termination and
Dissolution
The Partnership will continue as a limited partnership until
terminated under the partnership agreement. The Partnership will
dissolve upon:
|
|
|
| |
•
|
the election of the General Partner to dissolve the Partnership,
if approved by the holders of units representing a unit majority;
|
| |
| |
•
|
there being no limited partners, unless the Partnership is
continued without dissolution in accordance with applicable
Delaware law;
|
| |
| |
•
|
the entry of a decree of judicial dissolution of the
Partnership’s partnership; or
|
| |
| |
•
|
the withdrawal or removal of the General Partner or any other
event that results in its ceasing to be the Partnership’s
general partner other than by reason of a transfer of its
general partner interest in accordance with the partnership
agreement or withdrawal or removal following approval and
admission of a successor.
|
Upon a dissolution under the last clause above, the holders of a
unit majority may also elect, within specific time limitations,
to continue the Partnership’s business on the same terms
and conditions described in the Partnership’s partnership
agreement by appointing as a successor general partner an entity
approved by the holders of units representing a unit majority,
subject to the Partnership’s receipt of an opinion of
counsel to the effect that:
|
|
|
| |
•
|
the action would not result in the loss of limited liability of
any limited partner; and
|
| |
| |
•
|
neither the Partnership, the Operating Partnership nor any of
the Partnership’s other subsidiaries would be treated as an
association taxable as a corporation or otherwise be taxable as
an entity for federal income tax purposes upon the exercise of
that right to continue.
|
Liquidation and
Distribution of Proceeds
Upon the Partnership’s dissolution, unless it is continued
as a new limited partnership, the liquidator authorized to wind
up the Partnership’s affairs will, acting with all of the
powers of the General Partner that are necessary or appropriate,
liquidate the Partnership’s assets and apply the proceeds
of the liquidation as described in “The Partnership’s
Cash Distribution Policy—Distributions of Cash Upon
Liquidation.” The liquidator may defer liquidation or
distribution of the Partnership’s assets for a reasonable
period of time or distribute assets to partners in kind if it
determines that a sale would be impractical or would cause undue
loss to the Partnership’s partners.
177
Withdrawal or
Removal of the General Partner
Except as described below, the General Partner has agreed not to
withdraw voluntarily as the Partnership’s general partner
prior to December 31, 2016 without obtaining the approval
of the holders of at least a majority of the outstanding common
units, excluding common units held by the General Partner and
its affiliates, and furnishing an opinion of counsel regarding
limited liability and tax matters. On or after December 31,
2016, the General Partner may withdraw as general partner
without first obtaining approval of any unitholder by giving
90 days’ written notice, and that withdrawal will not
constitute a violation of the Partnership’s partnership
agreement. Notwithstanding the information above, the General
Partner may withdraw without unitholder approval upon
90 days’ notice to the limited partners if at least
50% of the outstanding common units are held or controlled by
one person and its affiliates other than the General Partner and
its affiliates. In addition, the partnership agreement permits
the General Partner in some instances to sell or otherwise
transfer all of its general partner interest in the Partnership
without the approval of the unitholders. Please see
“—Transfer of General Partner Units” and
“—Transfer of IDRs.”
Upon withdrawal of the General Partner under any circumstances,
other than as a result of a transfer by the General Partner of
all or a part of its general partner interest in the
Partnership, the holders of a unit majority, voting as separate
classes, may select a successor to that withdrawing general
partner. If a successor is not elected, or is elected but an
opinion of counsel regarding limited liability and tax matters
cannot be obtained, the Partnership will be dissolved, wound up
and liquidated, unless within a specified period after that
withdrawal, the holders of a unit majority agree in writing to
continue the Partnership’s business and to appoint a
successor general partner. Please see “—Termination
and Dissolution.”
The General Partner may not be removed unless that removal is
approved by the vote of the holders of not less than
662/3%
of the outstanding units, voting together as a single class,
including units held by the General Partner and its affiliates,
and the Partnership receives an opinion of counsel regarding
limited liability and tax matters. Any removal of the General
Partner is also subject to the approval of a successor general
partner by the vote of the holders of a majority of the
outstanding common units and Class B units, if any, voting
as separate classes. The ownership of more than
331/3%
of the outstanding units by the General Partner and its
affiliates would give them the practical ability to prevent the
General Partner’s removal.
The Partnership’s partnership agreement also provides that
if the General Partner is removed as the Partnership’s
general partner under circumstances where cause does not exist
and units held by the General Partner and its affiliates are not
voted in favor of that removal the General Partner will have the
right to convert its general partner interest and its IDRs into
common units or to receive cash in exchange for those interests
based on the fair market value of those interests at that time.
In the event of removal of a general partner under circumstances
where cause exists or withdrawal of a general partner where that
withdrawal violates the Partnership’s partnership
agreement, a successor general partner will have the option to
purchase the general partner interest and IDRs of the departing
general partner for a cash payment equal to the fair market
value of those interests. Under all other circumstances where a
general partner withdraws or is removed by the limited partners,
the departing general partner will have the option to require
the successor general partner to purchase the general partner
interest of the departing general partner and its IDRs for fair
market value. In each case, this fair market value will be
determined by agreement between the departing general partner
and the successor general partner. If no agreement is reached,
an independent investment banking firm or other independent
expert selected by the departing general partner and the
successor general partner will determine the fair market value.
Or, if the departing general partner and the successor general
partner cannot agree upon an expert, then an expert chosen by
agreement of the experts selected by each of them will determine
the fair market value.
If the option described above is not exercised by either the
departing general partner or the successor general partner, the
departing general partner interest and its IDRs will
automatically convert into common units equal to the fair market
value of those interests as determined by an investment banking
firm or other independent expert selected in the manner
described in the preceding paragraph.
178
In addition, the Partnership is required to reimburse the
departing general partner for all amounts due the departing
general partner, including, without limitation, all
employee-related liabilities, including severance liabilities,
incurred for the termination of any employees employed by the
departing general partner or its affiliates for the
Partnership’s benefit.
Transfer of
General Partner Units
Except for transfer by the General Partner of all, but not less
than all, of its general partner units to:
|
|
|
| |
•
|
an affiliate of the General Partner (other than an individual);
or
|
| |
| |
•
|
another entity as part of the merger or consolidation of the
General Partner with or into another entity or the transfer by
the General Partner of all or substantially all of its assets to
another entity,
|
the General Partner may not transfer all or any of its general
partner units to another person prior to December 31, 2016
without the approval of the holders of at least a majority of
the outstanding common units, excluding common units held by the
General Partner and its affiliates. As a condition of this
transfer, the transferee must assume, among other things, the
rights and duties of the General Partner, agree to be bound by
the provisions of the Partnership’s partnership agreement,
and furnish an opinion of counsel regarding limited liability
and tax matters.
The General Partner and its affiliates may at any time, transfer
units to one or more persons, without unitholder approval.
Transfer of
Ownership Interests in the General Partner
At any time, Targa may sell or transfer all or part of their
membership interests in the General Partner to an affiliate or
third party without the approval of the Partnership’s
unitholders.
Transfer of
IDRs
The General Partner or its affiliates or a subsequent holder may
transfer its IDRs to an affiliate of the holder (other than an
individual) or another entity as part of the merger or
consolidation of such holder with or into another entity, the
sale of all of the ownership interest in the holder or the sale
of all or substantially all of its assets to, that entity
without the prior approval of the unitholders. Prior to
December 31, 2016, other transfers of IDRs will require the
affirmative vote of holders of a majority of the outstanding
common units, excluding common units held by the General Partner
and its affiliates. On or after December 31, 2016, the IDRs
will be freely transferable.
Change of
Management Provisions
The Partnership’s partnership agreement contains specific
provisions that are intended to discourage a person or group
from attempting to remove the General Partner or otherwise
change the management of the General Partner. If any person or
group other than the General Partner and its affiliates acquires
beneficial ownership of 20% or more of any class of units, that
person or group loses voting rights on all of its units. This
loss of voting rights does not apply to any person or group that
acquires the units from the General Partner or its affiliates
and any transferees of that person or group approved by the
General Partner or to any person or group who acquires the units
with the prior approval of the board of directors of the General
Partner.
The Partnership’s partnership agreement also provides that
if the General Partner is removed as the Partnership’s
general partner under circumstances where cause does not exist
and units held by the General Partner and its affiliates are not
voted in favor of that removal the General Partner will have the
right to convert its general partner units and its IDRs into
common units or to receive cash in exchange for those interests
based on the fair market value of those interests at that time.
179
Limited Call
Right
If at any time the General Partner and its affiliates own more
than 80% of the then-issued and outstanding limited partner
interests of any class, the General Partner will have the right,
which it may assign in whole or in part to any of its affiliates
or to the Partnership, to acquire all, but not less than all, of
the limited partner interests of the class held by unaffiliated
persons as of a record date to be selected by the General
Partner, on at least 10 but not more than 60 days notice.
The purchase price in the event of this purchase is the greater
of:
|
|
|
| |
•
|
the highest price paid by either of the General Partner or any
of its affiliates for any limited partner interests of the class
purchased within the 90 days preceding the date on which
the General Partner first mails notice of its election to
purchase those limited partner interests; and
|
| |
| |
•
|
the current market price as of the date three days before the
date the notice is mailed.
|
As a result of the General Partner’s right to purchase
outstanding limited partner interests, a holder of limited
partner interests may have his limited partner interests
purchased at a price that may be lower than market prices at
various times prior to such purchase or lower than a unitholder
may anticipate the market price to be in the future. The tax
consequences to a unitholder of the exercise of this call right
are the same as a sale by that unitholder of his common units in
the market.
Meetings;
Voting
Except as described below regarding a person or group owning 20%
or more of any class of units then outstanding, record holders
of units on the record date will be entitled to notice of, and
to vote at, meetings of the Partnership’s limited partners
and to act upon matters for which approvals may be solicited.
The General Partner does not anticipate that any meeting of
unitholders will be called in the foreseeable future. Any action
that is required or permitted to be taken by the unitholders may
be taken either at a meeting of the unitholders or without a
meeting if consents in writing describing the action so taken
are signed by holders of the number of units necessary to
authorize or take that action at a meeting. Meetings of the
unitholders may be called by the General Partner or by
unitholders owning at least 20% of the outstanding units of the
class for which a meeting is proposed. Unitholders may vote
either in person or by proxy at meetings. The holders of a
majority of the outstanding units of the class or classes for
which a meeting has been called represented in person or by
proxy will constitute a quorum unless any action by the
unitholders requires approval by holders of a greater percentage
of the units, in which case the quorum will be the greater
percentage.
Each record holder of a unit has a vote according to his
percentage interest in the Partnership; although additional
limited partner interests having special voting rights could be
issued. Please see “—Issuance of Additional
Securities.” However, if at any time any person or group,
other than the General Partner and its affiliates, or a direct
or subsequently approved transferee of the General Partner or
its affiliates, acquires, in the aggregate, beneficial ownership
of 20% or more of any class of units then outstanding, that
person or group will lose voting rights on all of its units and
the units may not be voted on any matter and will not be
considered to be outstanding when sending notices of a meeting
of unitholders, calculating required votes, determining the
presence of a quorum or for other similar purposes. Common units
held in nominee or street name account will be voted by the
broker or other nominee in accordance with the instruction of
the beneficial owner unless the arrangement between the
beneficial owner and his nominee provides otherwise.
Any notice, demand, request, report or proxy material required
or permitted to be given or made to record holders of common
units under the Partnership’s partnership agreement will be
delivered to the record holder by the Partnership or by the
transfer agent.
180
Status as Limited
Partner
By transfer of common units in accordance with the
Partnership’s partnership agreement, each transferee of
common units shall be admitted as a limited partner with respect
to the common units transferred when such transfer and admission
is reflected in the Partnership’s books and records. Except
as described under “—Limited Liability,” the
common units will be fully paid, and unitholders will not be
required to make additional contributions.
Non-Citizen
Assignees; Redemption
If the Partnership is or becomes subject to federal, state or
local laws or regulations that, in the reasonable determination
of the General Partner, create a substantial risk of
cancellation or forfeiture of any property that the Partnership
has an interest in because of the nationality, citizenship or
other related status of any limited partner, the Partnership may
redeem the units held by the limited partner at their current
market price. In order to avoid any cancellation or forfeiture,
the General Partner may require each limited partner to furnish
information about his nationality, citizenship or related
status. If a limited partner fails to furnish information about
his nationality, citizenship or other related status within
30 days after a request for the information or the General
Partner determines after receipt of the information that the
limited partner is not an eligible citizen, the limited partner
may be treated as a non-citizen assignee. A non-citizen assignee
is entitled to an interest equivalent to that of a limited
partner for the right to share in allocations and distributions
from the Partnership, including liquidating distributions. A
non-citizen assignee does not have the right to direct the
voting of his units and may not receive distributions in-kind
upon the Partnership’s liquidation.
Indemnification
Under the Partnership’s partnership agreement, in most
circumstances, the Partnership will indemnify the following
persons, to the fullest extent permitted by law, from and
against all losses, claims, damages or similar events:
|
|
|
| |
•
|
the General Partner;
|
| |
| |
•
|
any departing general partner;
|
| |
| |
•
|
any person who is or was an affiliate of a general partner or
any departing general partner;
|
| |
| |
•
|
any person who is or was a director, officer, member, partner,
fiduciary or trustee of any entity set forth in the preceding
three bullet points;
|
| |
| |
•
|
any person who is or was serving as director, officer, member,
partner, fiduciary or trustee of another person at the request
of the General Partner, any departing general partner, an
affiliate of the General Partner or an affiliate of any
departing general partner; and
|
| |
| |
•
|
any person designated by the General Partner.
|
Any indemnification under these provisions will only be out of
the Partnership’s assets. Unless it otherwise agrees, the
General Partner will not be personally liable for, or have any
obligation to contribute or lend funds or assets to the
Partnership to enable the Partnership to effectuate,
indemnification. The Partnership may purchase insurance against
liabilities asserted against and expenses incurred by persons
for the Partnership’s activities, regardless of whether the
Partnership would have the power to indemnify the person against
liabilities under the partnership agreement.
Reimbursement of
Expenses
The Partnership’s partnership agreement requires the
Partnership to reimburse the General Partner for all direct and
indirect expenses it incurs or payments it makes on the
Partnership’s behalf and all other expenses allocable to
the Partnership or otherwise incurred by the General Partner in
connection with operating the Partnership’s business. These
expenses include salary, bonus, incentive compensation and
181
other amounts paid to persons who perform services for the
Partnership or on the Partnership’s behalf and expenses
allocated to the General Partner by its affiliates. The General
Partner is entitled to determine in good faith the expenses that
are allocable to the Partnership.
Books and
Reports
The General Partner is required to keep appropriate books of the
Partnership’s business at the Partnership’s principal
offices. The books are maintained for both tax and financial
reporting purposes on an accrual basis. For tax and fiscal
reporting purposes, the Partnership’s fiscal year is the
calendar year.
The Partnership will furnish or make available to record holders
of common units, within 120 days after the close of each
fiscal year, an annual report containing audited financial
statements and a report on those financial statements by the
Partnership’s independent public accountants. Except for
the Partnership’s fourth quarter, the Partnership will also
furnish or make available summary financial information within
90 days after the close of each quarter.
The Partnership will furnish each record holder of a unit with
information reasonably required for tax reporting purposes
within 90 days after the close of each calendar year. This
information will be furnished in summary form so that some
complex calculations normally required of partners can be
avoided. The Partnership’s ability to furnish this summary
information to unitholders will depend on the cooperation of
unitholders in supplying the Partnership with specific
information. Every unitholder will receive information to assist
him in determining his federal and state tax liability and
filing his federal and state income tax returns, regardless of
whether he supplies the Partnership with information.
Right to Inspect
the Partnership’s Books and Records
The Partnership’s partnership agreement provides that a
limited partner can, for a purpose reasonably related to his
interest as a limited partner, upon reasonable written demand
stating the purpose of such demand and at his own expense, have
furnished to him:
|
|
|
| |
•
|
a current list of the name and last known address of each
partner;
|
| |
| |
•
|
a copy of the Partnership’s tax returns;
|
| |
| |
•
|
information as to the amount of cash, and a description and
statement of the agreed value of any other property or services,
contributed or to be contributed by each partner and the date on
which each partner became a partner;
|
| |
| |
•
|
copies of the Partnership’s partnership agreement, the
Partnership’s certificate of limited partnership, related
amendments and powers of attorney under which they have been
executed;
|
| |
| |
•
|
information regarding the status of the Partnership’s
business and financial condition; and
|
| |
| |
•
|
any other information regarding the Partnership’s affairs
as is just and reasonable.
|
The General Partner may, and intends to, keep confidential from
the limited partners trade secrets or other information the
disclosure of which the General Partner believes in good faith
is not in the Partnership’s best interests or that the
Partnership is required by law or by agreements with third
parties to keep confidential.
Registration
Rights
Under the Partnership’s partnership agreement, the
Partnership has agreed to register for resale under the
Securities Act and applicable state securities laws any common
units or other partnership securities proposed to be sold by the
General Partner or any of its affiliates or their assignees if
an exemption from the registration requirements is not otherwise
available. These registration rights continue for two years
following any withdrawal or removal of the General Partner. The
Partnership is obligated to pay all expenses incidental to the
registration, excluding underwriting discounts and a structuring
fee.
182
MATERIAL U.S.
FEDERAL INCOME TAX
CONSEQUENCES TO
NON-U.S.
HOLDERS
The following is a general discussion of the material
U.S. federal income tax consequences of the acquisition,
ownership and disposition of our common stock to a
non-U.S. holder.
For the purpose of this discussion, a
non-U.S. holder
is any beneficial owner of our common stock that is not for
U.S. federal income tax purposes any of the following:
|
|
|
| |
•
|
an individual citizen or resident of the United States;
|
| |
| |
•
|
a corporation (or other entity treated as a corporation for
U.S. federal income tax purposes) created or organized in
or under the laws of the United States, or any state thereof or
the District of Columbia;
|
| |
| |
•
|
a partnership (or other entity treated as a partnership or other
pass-through entity for U.S. federal income tax purposes);
|
| |
| |
•
|
an estate whose income is subject to U.S. federal income
tax regardless of its source; or
|
| |
| |
•
|
a trust (x) whose administration is subject to the primary
supervision of a U.S. court and which has one or more
U.S. persons who have the authority to control all
substantial decisions of the trust or (y) which has made a
valid election to be treated as a U.S. person.
|
If a partnership (or an entity or arrangement treated as a
partnership for U.S. federal income tax purposes) holds our
common stock, the tax treatment of a partner in the partnership
will generally depend on the status of the partner and upon the
activities of the partnership. Accordingly, we urge partnerships
that hold our common stock and partners in such partnerships to
consult their tax advisors.
This discussion assumes that a
non-U.S. holder
will hold our common stock issued pursuant to the offering as a
capital asset (generally, property held for investment). This
discussion does not address all aspects of U.S. federal
income taxation or any aspects of state, local, estate or
non-U.S. taxation,
nor does it consider any U.S. federal income tax
considerations that may be relevant to
non-U.S. holders
that may be subject to special treatment under U.S. federal
income tax laws, including, without limitation,
U.S. expatriates, insurance companies, tax-exempt or
governmental organizations, dealers in securities or currency,
banks or other financial institutions, investors whose
functional currency is other than the U.S. dollar, and
investors that hold our common stock as part of a hedge,
straddle, synthetic security, conversion or other integrated
transaction. Furthermore, the following discussion is based on
current provisions of the Internal Revenue Code of 1986, as
amended, and Treasury Regulations and administrative and
judicial interpretations thereof, all as in effect on the date
hereof, and all of which are subject to change, possibly with
retroactive effect.
We urge each prospective investor to consult a tax advisor
regarding the U.S. federal, state, local, estate and
non-U.S. income
and other tax consequences of acquiring, holding and disposing
of shares of our common stock.
Dividends
Distributions with respect to our common stock will constitute
dividends for U.S. tax purposes to the extent paid from our
current or accumulated earnings and profits, as determined under
U.S. federal income tax principles. To the extent those
dividends exceed our current and accumulated earnings and
profits, the dividends will constitute a return of capital and
will first reduce a holder’s adjusted tax basis in the
common stock, but not below zero, and then will be treated as
gain from the sale of the common stock (see “—Gain on
Disposition of Common Stock”).
Any dividend (out of earnings and profits) paid to a
non-U.S. holder
of our common stock generally will be subject to
U.S. withholding tax either at a rate of 30% of the gross
amount of the dividend or such lower rate as may be specified by
an applicable income tax treaty. To receive the benefit of a
reduced treaty rate, a
non-U.S. holder
must provide us with an IRS
Form W-8BEN
or other appropriate version of IRS
183
Form W-8
certifying qualification for the reduced rate. Dividends
received by a
non-U.S. holder
that are effectively connected with a U.S. trade or
business conducted by the
non-U.S. holder
(and, if required by an applicable income tax treaty, are
attributable to a permanent establishment maintained by the
non-U.S. holder
within the U.S.) are exempt from the withholding tax described
above. To obtain this exemption, the
non-U.S. holder
must provide us with an IRS
Form W-8ECI
properly certifying such exemption. Such effectively connected
dividends, although not subject to withholding tax, will be
subject to U.S. federal income tax on a net income basis at
the same graduated rates generally applicable to
U.S. persons, net of certain deductions and credits,
subject to any applicable tax treaty providing otherwise. In
addition to the income tax described above, dividends received
by corporate
non-U.S. holders
that are effectively connected with a U.S. trade or
business of the corporate
non-U.S. holder
may be subject to a branch profits tax at a rate of 30% or such
lower rate as may be specified by an applicable income tax
treaty.
A
non-U.S. holder
of our common stock may obtain a refund of any excess amounts
withheld if the
non-U.S. holder
is eligible for a reduced rate of United States withholding tax
and an appropriate claim for refund is timely filed with the
Internal Revenue Service or the IRS.
Gain on
Disposition of Common Stock
A
non-U.S. holder
generally will not be subject to U.S. federal income tax on
any gain realized upon the sale or other disposition of our
common stock unless:
|
|
|
| |
•
|
the gain is effectively connected with a U.S. trade or
business of the
non-U.S. holder
and, if required by an applicable tax treaty, is attributable to
a U.S. permanent establishment maintained by such
non-U.S. holder;
|
| |
| |
•
|
the
non-U.S. holder
is an individual who is present in the United States for a
period or periods aggregating 183 days or more during the
calendar year in which the sale or disposition occurs and
certain other conditions are met; or
|
| |
| |
•
|
we are or have been a “U.S. real property holding
corporation,” or USRPHC, for U.S. federal income tax
purposes and the
non-U.S. holder
holds or has held, directly or indirectly, at any time within
the shorter of the five-year period preceding the disposition or
the period that the
non-U.S. holder
held our common stock.
|
Unless an applicable tax treaty provides otherwise, gain
described in the first bullet point above will be subject to
U.S. federal income tax on net income basis at the same
graduated rates generally applicable to U.S. persons.
Corporate
non-U.S. holders
also may be subject to a branch profits tax equal to 30% (or
such lower rate as may be specified by an applicable tax treaty)
of its earnings and profits that are effectively connected with
a U.S. trade or business.
Gain described in the second bullet point above (which may be
offset by U.S. source capital losses, provided that the
non-U.S. holder
has timely filed U.S. federal income tax returns with
respect to such losses) will be subject to a flat 30%
U.S. federal income tax (or such lower rate as may be
specified by an applicable income tax treaty).
Generally, a corporation is a USRPHC if the fair market value of
its United States real property interests equals or exceeds 50%
of the sum of the fair market value of its worldwide real
property interests and its other assets used or held for use in
a trade or business. We believe that we are, and will remain for
the foreseeable future, a USRPHC for U.S. federal income
tax purposes. However, the tax relating to stock in a USRPHC
generally will not apply to a
non-U.S. holder
whose actual and constructive stock holdings of our common stock
constituted 5% or less of our common stock at all times during
the applicable period described in the third bullet point,
above, provided that our common stock continues to be
“regularly traded on an established securities market”
within the meaning of the Code and applicable Treasury
regulations.
Non-U.S. holders
should consult any applicable income tax treaties that may
provide for different rules.
184
Backup
Withholding and Information Reporting
Generally, we must report annually to the IRS the amount of
dividends paid to each
non-U.S. holder,
the name and address of the recipient, and the amount, if any,
of tax withheld with respect to those dividends. A similar
report is sent to each
non-U.S. holder.
These information reporting requirements apply even if
withholding was not required. Pursuant to tax treaties or other
agreements, the IRS may make its reports available to tax
authorities in the recipient’s country of residence.
Payments of dividends to a
non-U.S. holder
may be subject to backup withholding (at the applicable rate)
unless the
non-U.S. holder
establishes an exemption, for example, by properly certifying
its
non-U.S. status
on an IRS
Form W-8BEN
or another appropriate version of IRS
Form W-8.
Notwithstanding the foregoing, backup withholding may apply if
either we or our paying agent has actual knowledge, or reason to
know, that the beneficial owner is a U.S. person that is
not an exempt recipient.
Payments of the proceeds from sale or other disposition by a
non-U.S. holder
of our common stock effected outside the U.S. by or through
a foreign office of a broker generally will not be subject to
information reporting or backup withholding. However,
information reporting (but not backup withholding) will apply to
those payments if the broker does not have documentary evidence
that the holder is a
non-U.S. holder,
an exemption is not otherwise established, and the broker has
certain relationships with the United States.
Payments of the proceeds from a sale or other disposition by a
non-U.S. holder
of our common stock effected by or through a U.S. office of
a broker generally will be subject to information reporting and
backup withholding (at the applicable rate) unless the
non-U.S. holder
establishes an exemption, for example, by properly certifying
its
non-U.S. status
on an IRS
Form W-8BEN
or another appropriate version of IRS
Form W-8.
Notwithstanding the foregoing, information reporting and backup
withholding may apply if the broker has actual knowledge, or
reason to know, that the holder is a U.S. person that is
not an exempt recipient.
Backup withholding is not an additional tax. Rather, the
U.S. income tax liability of persons subject to backup
withholding will be reduced by the amount of tax withheld. If
withholding results in an overpayment of taxes, a refund may be
obtained, provided that the required information is timely
furnished to the IRS.
Legislation
Affecting Common Stock Held Through Foreign
Accounts
Newly enacted legislation may result in materially different
withholding and information reporting requirements than those
described above, for payments made after December 31, 2012.
The legislation limits the ability of
non-U.S. holders
who hold our common stock through a foreign financial
institution to claim relief from U.S. withholding tax in
respect of dividends paid on our common stock unless the foreign
financial institution agrees, among other things, to annually
report certain information with respect to “United States
accounts” maintained by such institution. The legislation
also limits the ability of certain non-financial foreign
entities to claim relief from U.S. withholding tax in
respect of dividends paid by us to such entities unless
(1) those entities meet certain certification requirements;
(2) the withholding agent does not know or have reason to
know that any such information provided is incorrect and
(3) the withholding agent reports the information provided
to the IRS. The legislation provisions will have a similar
effect with respect to dispositions of our common stock after
December 31, 2012. A
non-U.S. holder
generally would be permitted to claim a refund to the extent any
tax withheld exceeded the holder’s actual tax liability.
Non-U.S. holders
are encouraged to consult with their tax advisers regarding the
possible implication of the legislation on their investment in
respect of the common stock.
185
UNDERWRITING
Barclays Capital Inc., Morgan Stanley & Co. Incorporated,
Merrill Lynch, Pierce, Fenner & Smith Incorporated,
Citigroup Global Markets Inc. and Deutsche Bank Securities Inc.
are acting as the representatives of the underwriters and
book-running managers of this offering. Under the terms of an
underwriting agreement, the form of which has been filed as an
exhibit to the registration statement, each of the underwriters
named below has severally agreed to purchase from the selling
stockholders the respective number of common stock shown
opposite its name below:
| |
|
|
|
|
|
|
|
Number of
|
|
|
Underwriters
|
|
Shares
|
|
|
|
|
Barclays Capital Inc.
|
|
|
|
|
|
Morgan Stanley & Co. Incorporated
|
|
|
|
|
|
Merrill Lynch, Pierce, Fenner & Smith
Incorporated
|
|
|
|
|
|
Citigroup Global Markets Inc.
|
|
|
|
|
|
Deutsche Bank Securities Inc.
|
|
|
|
|
|
Credit Suisse Securities (USA) LLC
|
|
|
|
|
|
J.P. Morgan Securities LLC
|
|
|
|
|
|
Wells Fargo Securities, LLC
|
|
|
|
|
|
Raymond James & Associates, Inc.
|
|
|
|
|
|
RBC Capital Markets, LLC
|
|
|
|
|
|
UBS Securities LLC
|
|
|
|
|
|
Robert W. Baird & Co. Incorporated
|
|
|
|
|
|
ING Financial Markets LLC
|
|
|
|
|
|
|
|
|
|
|
|
Total
|
|
|
5,650,000
|
|
|
|
|
|
|
|
The underwriting agreement provides that the underwriters’
obligation to purchase shares of common stock depends on the
satisfaction of the conditions contained in the underwriting
agreement including:
|
|
|
| |
•
|
the obligation to purchase all of the shares of common stock
offered hereby (other than those shares of common stock covered
by their option to purchase additional shares as described
below), if any of the shares are purchased;
|
| |
| |
•
|
the representations and warranties made by us and the selling
stockholders to the underwriters are true;
|
| |
| |
•
|
there is no material change in our business or the financial
markets; and
|
| |
| |
•
|
we deliver customary closing documents to the underwriters.
|
Commissions and
Expenses
The following table summarizes the underwriting discounts and
commissions the selling stockholders will pay to the
underwriters. These amounts are shown assuming both no exercise
and full exercise of the underwriters’ option to purchase
additional shares. The underwriting fee is the difference
between the price to the public and the amount the underwriters
pay to the selling stockholders for the shares.
| |
|
|
|
|
|
|
|
|
|
|
|
No Exercise
|
|
Full Exercise
|
|
|
|
Per unit
|
|
$
|
|
|
|
$
|
|
|
|
Total
|
|
$
|
|
|
|
$
|
|
|
186
The representatives of the underwriters have advised us that the
underwriters propose to offer the shares of common stock
directly to the public at the public offering price on the cover
of this prospectus and to selected dealers, which may include
the underwriters, at such offering price less a selling
concession not in excess of $ per
share. After the offering, the representatives may change the
offering price and other selling terms. Sales of shares made
outside of the United States may be made by affiliates of the
underwriters.
We have agreed to pay expenses incurred by the selling
stockholders in connection with the offering, other than the
underwriting discounts and commission.
Option to
Purchase Additional Shares
Certain of the selling stockholders have granted the
underwriters an option exercisable for 30 days after the
date of the underwriting agreement, to purchase, from time to
time, in whole or in part, up to an aggregate of shares at the
public offering price less underwriting discounts and
commissions. This option may be exercised if the underwriters
sell more than 5,650,000 shares in connection with this
offering. To the extent that this option is exercised, each
underwriter will be obligated, subject to certain conditions, to
purchase its pro rata portion of these additional shares based
on the underwriter’s underwriting commitment in the
offering as indicated in the table at the beginning of this
Underwriting Section.
Lock-Up
Agreements
We, all of our directors and executive officers and the selling
stockholders will not, without the prior written consent of
Barclays Capital Inc., offer, sell, contract to sell, pledge, or
otherwise dispose of, or enter into any transaction which is
designed to, or might reasonably be expected to, result in the
disposition (whether by actual disposition or effective economic
disposition due to cash settlement or otherwise), directly or
indirectly, including the filing (or participation in the
filing) of a registration statement with the Commission in
respect of, or establish or increase a put equivalent position
or liquidate or decrease a call equivalent position within the
meaning of Section 16 of the Exchange Act, any other
Company shares or any securities convertible into, or
exercisable, or exchangeable for, Company shares; or publicly
announce an intention to effect any such transaction, for a
period 90 days after the date of the underwriting agreement.
These restrictions do not, among other things, apply to:
|
|
|
| |
•
|
the sale of common stock pursuant to the underwriting agreement;
|
| |
| |
•
|
issuances of common stock by us pursuant to any employee benefit
plan in effect as of the date of the underwriting agreement;
|
| |
| |
•
|
issuances of common stock by us upon the conversion of
securities or the exercise of warrants outstanding as of the
date of the underwriting agreement; and
|
| |
| |
•
|
the filing of one or more registration statements on
Form S-8
relating to any employee benefit plan in effect as of the date
of the underwriting agreement.
|
The 90-day
restricted period described above will be extended if:
|
|
|
| |
•
|
during the last 17 days of the
90-day
restricted period we issue an earnings release or announce
material news or a material event relating to us occurs; or
|
| |
| |
•
|
prior to the expiration of the
90-day
restricted period, we announce that we will release earnings
results during the
16-day
period beginning on the last day of the
90-day
period, in which case the restrictions described in the
preceding paragraph will continue to apply until the expiration
of the
18-day
period beginning on the issuance of the earnings release or the
announcement of the material news or occurrence of material
event unless such extension is waived in writing by Barclays
Capital Inc.
|
187
Barclays Capital Inc., in its sole discretion, may release the
common stock and other securities subject to the
lock-up
agreements described above in whole or in part at any time with
or without notice. When determining whether or not to release
common stock and other securities from
lock-up
agreements, Barclays Capital Inc. will consider, among other
factors, the holder’s reasons for requesting the release,
the number of shares of common stock and other securities for
which the release is being requested and market conditions at
the time.
Indemnification
We and the selling stockholders have agreed to indemnify the
underwriters against certain liabilities, including liabilities
under the Securities Act and to contribute to payments that the
underwriters may be required to make for these liabilities.
Stabilization,
Short Positions and Penalty Bids
The representative may engage in stabilizing transactions, short
sales and purchases to cover positions created by short sales,
and penalty bids or purchases for the purpose of pegging, fixing
or maintaining the price of the common stock, in accordance with
Regulation M under the Securities Exchange Act of 1934.
|
|
|
| |
•
|
Stabilizing transactions permit bids to purchase the underlying
security so long as the stabilizing bids do not exceed a
specified maximum.
|
| |
| |
•
|
A short position involves a sale by the underwriters of shares
in excess of the number of shares the underwriters are obligated
to purchase in the offering, which creates the syndicate short
position. This short position may be either a covered short
position or a naked short position. In a covered short position,
the number of shares involved in the sales made by the
underwriters in excess of the number of shares they are
obligated to purchase is not greater than the number of shares
that they may purchase by exercising their option to purchase
additional shares. In a naked short position, the number of
shares involved is greater than the number of shares in their
option to purchase additional shares. The underwriters may close
out any short position by either exercising their option to
purchase additional shares
and/or
purchasing shares in the open market. In determining the source
of shares to close out the short position, the underwriters will
consider, among other things, the price of shares available for
purchase in the open market as compared to the price at which
they may purchase shares through their option to purchase
additional shares. A naked short position is more likely to be
created if the underwriters are concerned that there could be
downward pressure on the price of the shares in the open market
after pricing that could adversely affect investors who purchase
in the offering.
|
| |
| |
•
|
Syndicate covering transactions involve purchases of the common
stock in the open market after the distribution has been
completed in order to cover syndicate short positions.
|
| |
| |
•
|
Penalty bids permits the representative to reclaim a selling
concession from a syndicate member when the common stock
originally sold by the syndicate member is purchased in a
stabilizing or syndicate covering transaction to cover syndicate
short positions.
|
These stabilizing transactions, syndicate covering transactions
and penalty bids may have the effect of raising or maintaining
the market price of our common stock or preventing or retarding
a decline in the market price of the common stock. As a result,
the price of the common stock may be higher than the price that
might otherwise exist in the open market. These transactions may
be effected on The New York Stock Exchange or otherwise and, if
commenced, may be discontinued at any time.
Neither we nor any of the underwriters make any representation
or prediction as to the direction or magnitude of any effect
that the transactions described above may have on the price of
the common stock. In addition, neither we nor any of the
underwriters make representation that the representative will
engage in these stabilizing transactions or that any
transaction, once commenced, will not be discontinued without
notice.
188
Electronic
Distribution
A prospectus in electronic format may be made available on the
Internet sites or through other online services maintained by
one or more of the underwriters
and/or
selling group members participating in this offering, or by
their affiliates. In those cases, prospective investors may view
offering terms online and, depending upon the particular
underwriter or selling group member, prospective investors may
be allowed to place orders online. The underwriters may agree
with us to allocate a specific number of shares for sale to
online brokerage account holders. Any such allocation for online
distributions will be made by the representative on the same
basis as other allocations.
Other than the prospectus in electronic format, the information
on any underwriter’s or selling group member’s web
site and any information contained in any other web site
maintained by an underwriter or selling group member is not part
of the prospectus or the registration statement of which this
prospectus forms a part, has not been approved
and/or
endorsed by us or any underwriter or selling group member in its
capacity as underwriter or selling group member and should not
be relied upon by investors.
New York Stock
Exchange
Our common stock is traded on the New York Stock Exchange under
the symbol “TRGP.”
Stamp
Taxes
If you purchase shares of common stock offered in this
prospectus, you may be required to pay stamp taxes and other
charges under the laws and practices of the country of purchase,
in addition to the offering price listed on the cover page of
this prospectus.
Conflicts of
Interest
ML Ventures, an affiliate of BofA Merrill Lynch, an underwriter
in this offering, will receive more than 5% of the net proceeds
of the offering as a selling stockholder. Accordingly, BofA
Merrill Lynch’s interest may go beyond receiving customary
underwriting discounts and commissions. In particular, there may
be a conflict of interest between BofA Merrill Lynch’s own
interests as underwriter and the interests of its affiliate ML
Ventures as a selling stockholder. Because an affiliate of BofA
Merrill Lynch will receive more than 5% of the net proceeds,
this offering is being conducted in accordance with FINRA
Rule 5121. This rule requires, among other things, that a
qualified independent underwriter has participated in the
preparation of, and has exercised the usual standards of due
diligence with respect to, this prospectus and the registration
statement of which this prospectus is a part. Accordingly,
Barclays Capital is assuming the responsibilities of acting as
the qualified independent underwriter in this offering. Although
the qualified independent underwriter has participated in the
preparation of the registration statement and prospectus and
conducted due diligence, we cannot assure you that this will
adequately address any potential conflicts of interest related
to BofA Merrill Lynch and ML Ventures. We have agreed to
indemnify Barclays Capital for acting as qualified independent
underwriter against certain liabilities, including liabilities
under the Securities Act and to contribute to payments that
Barclays Capital may be required to make for these liabilities.
Pursuant to FINRA Rule 5121, no sale of the shares shall be
made to an account over which BofA Merrill Lynch exercises
discretion without the prior specific written consent of the
account holder.
Other
Relationships
The underwriters and their affiliates have engaged, and may in
the future engage, in commercial and investment banking
transactions with us in the ordinary course of their business.
They have received, and expect to receive, customary
compensation and expense reimbursement for these commercial and
investment banking transactions.
In addition, Barclays Capital Inc., Merrill Lynch, Pierce,
Fenner & Smith Incorporated, Wells Fargo Securities,
LLC, Deutsche Bank Securities Inc., Citigroup Global Markets
Inc., J.P. Morgan Securities LLC, RBC
189
Capital Markets, LLC, ING Financial Markets LLC, Morgan
Stanley & Co. Incorporated, UBS Securities LLC,
Raymond James & Associates, Inc. and Credit Suisse
Securities (USA) LLC, or their affiliates, are lenders under the
Partnership’s senior secured credit facility, and an
affiliate of Merrill Lynch, Pierce, Fenner & Smith
Incorporated is the administrative agent and collateral agent,
L/C issuer and swing line lender, an affiliate of Wells Fargo
Securities, LLC is the co-syndication agent, an affiliate of
Barclays Capital Inc. is the co-documentation agent, and an
affiliate of Deutsche Bank Securities Inc. is a co-documentation
agent under such facility. Deutsche Bank Securities Inc., Credit
Suisse Securities (USA) LLC, Merrill Lynch, Pierce,
Fenner & Smith Incorporated, ING Financial Markets LLC
and Barclays Capital Inc., or their affiliates, are lenders
under our senior secured credit facility, and an affiliate of
Deutsche Bank Securities Inc. is the administrative agent,
collateral agent, swing line lender and an L/C Issuer, and
Credit Suisse Securities (USA) LLC is an L/C issuer under such
facility. Credit Suisse Securities (USA) LLC, Deutsche Bank
Securities Inc. and Merrill Lynch, Pierce, Fenner &
Smith, or their affiliates, are or were lenders under the Holdco
Loan, and an affiliate of Credit Suisse Securities (USA) LLC is
administrative agent, Deutsche Bank Securities Inc. is
syndication agent, and an affiliate of Merrill Lynch, Pierce,
Fenner & Smith is co-documentation agent under such
facility. Barclays Capital Inc., Morgan Stanley & Co.
Incorporated, Merrill Lynch, Pierce, Fenner & Smith
Incorporated, Citigroup Global Markets Inc., Deutsche Bank
Securities Inc., Credit Suisse Securities (USA) LLC,
J.P. Morgan Securities LLC, Wells Fargo Securities, LLC,
Raymond James & Associates, Inc., RBC Capital Markets,
LLC, UBS Securities LLC, Robert W. Baird & Co.
Incorporated and ING Financial Markets LLC, or their affiliates,
were underwriters in our December 2010 initial public offering.
Merrill Lynch, Pierce, Fenner & Smith Incorporated,
Barclays Capital Inc., Citigroup Global Markets Inc., Morgan
Stanley & Co. Incorporated, Wells Fargo Securities,
LLC, Deutsche Bank Securities Inc., J.P. Morgan Securities
LLC, RBC Capital Markets, LLC, Raymond James &
Associates, Inc., UBS Securities LLC and Robert W.
Baird & Co. Incorporated, or their affiliates, were
underwriters in the Partnership’s January 2011 equity
offering. Deutsche Bank Securities Inc., Merrill Lynch, Pierce,
Fenner & Smith Incorporated, Barclays Capital Inc.,
J.P. Morgan Securities LLC, Citigroup Global Markets Inc.,
RBC Capital Markets, LLC, Wells Fargo Securities, LLC and ING
Financial Markets LLC, or their affiliates, served as initial
purchasers of the Partnership’s senior notes issued in
February 2011. Deutsche Bank Securities Inc. and Barclays
Capital Inc., or their affiliates, served as dealer managers of
the Partnership’s exchange offer for senior notes issued in
February 2011. In addition, affiliates of Morgan
Stanley & Co. Incorporated, Merrill Lynch, Pierce,
Fenner & Smith Incorporated, Credit Suisse Securities
(USA) LLC and UBS Securities LLC directly or indirectly own
interests in Warburg Pincus Private Equity VIII, L.P.
and/or
Warburg Pincus Private Equity IX, L.P., both of which are
selling stockholders in this offering. None of the affiliates of
such underwriters will receive more than 5% of the proceeds of
this offering as a result of their direct or indirect ownership
in such selling stockholders.
Additionally, in the ordinary course of their various business
activities, the underwriters and their respective affiliates may
make or hold a broad array of investments and actively trade
debt and equity securities (or related derivative securities)
and financial instruments (including bank loans) for their own
account and for the accounts of their customers and may at any
time hold long and short positions in such securities and
instruments. Such investment and securities activities may
involve our securities and instruments.
Selling
Restrictions
European
Economic Area
In relation to each member state of the European Economic Area
which has implemented the Prospectus Directive (each, a
“Relevant Member State”), including each Relevant
Member State that has implemented amendments to
Article 3(2) of the Prospectus Directive with regard to
persons to whom an offer of securities is addressed and the
denomination per unit of the offer of securities (each, an
“Early Implementing Member State”), with effect from
and including the date on which the Prospectus Directive is
implemented in that Relevant Member State (the “Relevant
Implementation Date”), no offer of New Shares will be made
in the Institutional Offering to the public in that Relevant
Member State (other than offers (the “Permitted Public
Offers”) where a prospectus will be published in relation
to the New Shares that has been
190
approved by the competent authority in a Relevant Member State
or, where appropriate, approved in another Relevant Member State
and notified to the competent authority in that Relevant Member
State, all in accordance with the Prospectus Directive), except
that with effect from and including that Relevant Implementation
Date, offers of New Shares may be made to the public in that
Relevant Member State at any time:
(a) to “qualified investors” as defined in the
Prospectus Directive, including:
(A) (in the case of Relevant Member States other than Early
Implementing Member States), legal entities which are authorised
or regulated to operate in the financial markets or, if not so
authorised or regulated, whose corporate purpose is solely to
invest in securities, or any legal entity which has two or more
of (i) an average of at least 250 employees during the
last financial year; (ii) a total balance sheet of more
than €43.0 million and (iii) an annual turnover
of more than €50.0 million as shown in its last annual
or consolidated accounts; or
(B) (in the case of Early Implementing Member States),
persons or entities that are described in points (1) to
(4) of Section I of Annex II to Directive
2004/39/EC, and those who are treated on request as professional
clients in accordance with Annex II to Directive
2004/39/EC, or recognised as eligible counterparties in
accordance with Article 24 of Directive 2004/39/EC unless
they have requested that they be treated as non-professional
clients; or
(b) to fewer than 100 (or, in the case of Early
Implementing Member States, 150) natural or legal persons
(other than “qualified investors” as defined in the
Prospectus Directive) subject to obtaining the prior consent of
the Subscribers; or
(c) in any other circumstances falling within
Article 3(2) of the Prospectus Directive, provided that no
such offer of New Shares shall result in a requirement for the
publication of a prospectus pursuant to Article 3 of the
Prospectus Directive or of a supplement to a prospectus pursuant
to Article 16 of the Prospectus Directive.
Each person in a Relevant Member State (other than a Relevant
Member State where there is a Permitted Public Offer) who
initially acquires any New Shares or to whom any offer is made
under the Institutional Offering will be deemed to have
represented, acknowledged and agreed to and with each Subscriber
and the Bank that (A) it is a “qualified
investor”, and (B) in the case of any New Shares
acquired by it as a financial intermediary, as that term is used
in Article 3(2) of the Prospectus Directive, (x) the
New Shares acquired by it in the Institutional Offering have not
been acquired on behalf of, nor have they been acquired with a
view to their offer or resale to, persons in any Relevant Member
State other than “qualified investors” as defined in
the Prospectus Directive, or in circumstances in which the prior
consent of the Subscribers has been given to the offer or
resale, or (y) where New Shares have been acquired by it on
behalf of persons in any Relevant Member State other than
“qualified investors” as defined in the Prospectus
Directive, the offer of those New Shares to it is not treated
under the Prospectus Directive as having been made to such
persons.
For the purpose of the above provisions, the expression “an
offer to the public” in relation to any New Shares in any
Relevant Member State means the communication in any form and by
any means of sufficient information on the terms of the offer of
any New Shares to be offered so as to enable an investor to
decide to purchase any New Shares, as the same may be varied in
the Relevant Member State by any measure implementing the
Prospectus Directive in the Relevant Member State and the
expression “Prospectus Directive” means Directive
2003/71 EC (including that Directive as amended, in the case of
Early Implementing Member States) and includes any relevant
implementing measure in each Relevant Member State.
191
United
Kingdom
This prospectus is only being distributed to, and is only
directed at, persons in the United Kingdom that are qualified
investors within the meaning of Article 2(1)(e) of the
Prospectus Directive (“Qualified Investors”) that are
also (i) investment professionals falling within
Article 19(5) of the Financial Services and Markets Act
2000 (Financial Promotion) Order 2005 (the “Order”) or
(ii) high net worth entities, and other persons to whom it
may lawfully be communicated, falling within
Article 49(2)(a) to (d) of the Order (all such persons
together being referred to as “relevant persons”).
This prospectus and its contents are confidential and should not
be distributed, published or reproduced (in whole or in part) or
disclosed by recipients to any other persons in the United
Kingdom. Any person in the United Kingdom that is not a relevant
person should not act or rely on this document or any of its
contents.
Switzerland
The Prospectus does not constitute an issue prospectus pursuant
to Article 652a or Article 1156 of the Swiss Code of
Obligations (“CO”) and the shares will not be listed
on the SIX Swiss Exchange. Therefore, the Prospectus may not
comply with the disclosure standards of the CO
and/or the
listing rules (including any prospectus schemes) of the SIX
Swiss Exchange. Accordingly, the shares may not be offered to
the public in or from Switzerland, but only to a selected and
limited circle of investors, which do not subscribe to the
shares with a view to distribution.
Dubai
International Financial Centre
This prospectus relates to an Exempt Offer in accordance with
the Offered Securities Rules of the Dubai Financial Services
Authority (“DFSA”). This prospectus is intended for
distribution only to persons of a type specified in the Offered
Securities Rules of the DFSA. It must not be delivered to, or
relied on by, any other person. The DFSA has no responsibility
for reviewing or verifying any documents in connection with
Exempt Offers. The DFSA has not approved this prospectus nor
taken steps to verify the information set forth herein and has
no responsibility for the prospectus. The securities to which
this prospectus relates may be illiquid
and/or
subject to restrictions on their resale. Prospective purchasers
of the securities offered should conduct their own due diligence
on the securities. If you do not understand the contents of this
prospectus you should consult an authorized financial advisor.
Australia
No prospectus or other disclosure document (as defined in the
Corporations Act 2001 (Cth) of Australia (“Corporations
Act”)) in relation to the common stock has been or will be
lodged with the Australian Securities & Investments
Commission (“ASIC”). This document has not been lodged
with ASIC and is only directed to certain categories of exempt
persons. Accordingly, if you receive this document in Australia:
(a) you confirm and warrant that you are either:
(i) a “sophisticated investor” under
section 708(8)(a) or (b) of the Corporations Act;
(ii) a “sophisticated investor” under
section 708(8)(c) or (d) of the Corporations Act and
that you have provided an accountant’s certificate to us
which complies with the requirements of
section 708(8)(c)(i) or (ii) of the Corporations Act
and related regulations before the offer has been made;
(iii) a person associated with the company under
section 708(12) of the Corporations Act; or
(iv) a “professional investor” within the meaning
of section 708(11)(a) or (b) of the Corporations Act,
and to the extent that you are unable to confirm or warrant that
you are an exempt sophisticated investor, associated person or
professional investor under the
192
Corporations Act any offer made to you under this document is
void and incapable of acceptance; and
(b) you warrant and agree that you will not offer any of
the common stock for resale in Australia within 12 months
of that common stock being issued unless any such resale offer
is exempt from the requirement to issue a disclosure document
under section 708 of the Corporations Act.
Hong
Kong
The common stock may not be offered or sold in Hong Kong, by
means of any document, other than (a) to “professional
investors” as defined in the Securities and Futures
Ordinance (Cap. 571, Laws of Hong Kong) and any rules made under
that Ordinance or (b) in other circumstances which do not
result in the document being a “prospectus” as defined
in the Companies Ordinance (Cap. 32, Laws of Hong Kong) or which
do not constitute an offer to the public within the meaning of
that Ordinance. No advertisement, invitation or document
relating to the common stock may be issued or may be in the
possession of any person for the purpose of the issue, whether
in Hong Kong or elsewhere, which is directed at, or the contents
of which are likely to be read by, the public in Hong Kong
(except if permitted to do so under the laws of Hong Kong) other
than with respect to the common stock which are intended to be
disposed of only to persons outside Hong Kong or only to
“professional investors” as defined in the Securities
and Futures Ordinance (Cap. 571, Laws of Hong Kong) or any rules
made under that Ordinance.
Japan
No securities registration statement (“SRS”) has been
filed under Article 4, Paragraph 1 of the Financial
Instruments and Exchange Law of Japan (Law No. 25 of 1948,
as amended) (“FIEL”) in relation to the common stock.
The shares of common stock are being offered in a private
placement to “qualified institutional investors”
(tekikaku-kikan-toshika) under Article 10 of the Cabinet
Office Ordinance concerning Definitions provided in
Article 2 of the FIEL (the Ministry of Finance Ordinance
No. 14, as amended) (“QIIs”), under
Article 2, Paragraph 3, Item 2 i of the FIEL. Any
QII acquiring the shares of common stock in this offer may not
transfer or resell those shares except to other QIIs.
Korea
The shares may not be offered, sold and delivered directly or
indirectly, or offered or sold to any person for reoffering or
resale, directly or indirectly, in Korea or to any resident of
Korea except pursuant to the applicable laws and regulations of
Korea, including the Korea Securities and Exchange Act and the
Foreign Exchange Transaction Law and the decrees and regulations
thereunder. The shares have not been registered with the
Financial Services Commission of Korea for public offering in
Korea. Furthermore, the shares may not be resold to Korean
residents unless the purchaser of the shares complies with all
applicable regulatory requirements (including but not limited to
government approval requirements under the Foreign Exchange
Transaction Law and its subordinate decrees and regulations) in
connection with the purchase of the shares.
Singapore
This prospectus has not been registered as a prospectus with the
Monetary Authority of Singapore. Accordingly, this prospectus
and any other document or material in connection with the offer
or sale, or invitation for subscription or purchase, of the
shares may not be circulated or distributed, nor may the shares
be offered or sold, or be made the subject of an invitation for
subscription or purchase, whether directly or indirectly, to
persons in Singapore other than (i) to an institutional
investor under Section 274 of the Securities and Future
Act, Chapter 289 of Singapore (the “SFA”),
(ii) to a “relevant person” as defined in
Section 275(2) of the SFA, or any person pursuant to
Section 275(1A), and in accordance with the conditions,
specified in Section 275 of the SFA or (iii) otherwise
pursuant to, and in accordance with the conditions of, any other
applicable provision of the SFA.
193
Where the shares are subscribed and purchased under
Section 275 of the SFA by a relevant person which is:
(a) a corporation (which is not an accredited investor (as
defined in Section 4A of the SFA)) the sole business of
which is to hold investments and the entire share capital of
which is owned by one or more individuals, each of whom is an
accredited investor; or
(b) a trust (where the trustee is not an accredited
investor (as defined in Section 4A of the SFA)) whose sole whole
purpose is to hold investments and each beneficiary is an
accredited investor, shares, debentures and units of shares and
debentures of that corporation or the beneficiaries’ rights
and interest (howsoever described) in that trust shall not be
transferable within six months after that corporation or that
trust has acquired the shares under Section 275 of the SFA
except:
(i) to an institutional investor under Section 274 of
the SFA or to a relevant person (as defined in
Section 275(2) of the SFA) and in accordance with the
conditions, specified in Section 275 of the SFA;
(ii) (in the case of a corporation) where the transfer
arises from an offer referred to in Section 275(1A) of the
SFA, or (in the case of a trust) where the transfer arises from
an offer that is made on terms that such rights or interests are
acquired at a consideration of not less than S$200,000 (or its
equivalent in a foreign currency) for each transaction, whether
such amount is to be paid for in cash or by exchange of
securities or other assets;
(iii) where no consideration is or will be given for the
transfer; or
(iv) where the transfer is by operation of law.
By accepting this prospectus, the recipient hereof represents
and warrants that he is entitled to receive it in accordance
with the restrictions set forth above and agrees to be bound by
limitations contained herein. Any failure to comply with these
limitations may constitute a violation of law.
194
LEGAL
MATTERS
The validity of our common stock offered by this prospectus will
be passed upon for Targa Resources Corp. by Vinson &
Elkins L.L.P., Houston, Texas. Certain legal matters in
connection with this offering will be passed upon for the
underwriters by Baker Botts L.L.P., Dallas, Texas.
EXPERTS
The financial statements and financial statement schedule of
Targa Resources Corp. as of December 31, 2010 and 2009 and
for each of the three years in the period ended
December 31, 2010 included in this Prospectus have been so
included in reliance on the reports of PricewaterhouseCoopers
LLP, an independent registered public accounting firm, given on
the authority of said firm as experts in auditing and accounting.
WHERE YOU CAN
FIND MORE INFORMATION
We have filed with the Securities and Exchange Commission, or
the SEC, a registration statement on
Form S-1
regarding our common units. This prospectus does not contain all
of the information found in the registration statement. For
further information regarding us and our common stock offered by
this prospectus, you may desire to review the full registration
statement, including its exhibits and schedules, filed under the
Securities Act. The registration statement of which this
prospectus forms a part, including its exhibits and schedules,
may be inspected and copied at the public reference room
maintained by the SEC at 100 F Street, N.E.,
Room 1580, Washington, D.C. 20549. Copies of the
materials may also be obtained from the SEC at prescribed rates
by writing to the public reference room maintained by the SEC at
100 F Street, N.E., Room 1580,
Washington, D.C. 20549. You may obtain information on the
operation of the public reference room by calling the SEC at
1-800-SEC-0330.
The SEC maintains a web site on the Internet at
http://www.sec.gov.
Our registration statement, of which this prospectus constitutes
a part, can be downloaded from the SEC’s web site.
We make available free of charge on our internet website at
www.targaresources.com our annual reports on
Form 10-K,
our quarterly reports on
Form 10-Q,
our current reports on
Form 8-K
and any amendments to these reports as soon as reasonably
practicable after we electronically file such material with, or
furnish it to, the SEC. Information contained on our website is
not incorporated by reference into this prospectus and you
should not consider such information as part of this prospectus.
FORWARD-LOOKING
STATEMENTS
This prospectus may contain “forward looking”
statements. These forward looking statements reflect our current
views with respect to, among other things, our operations and
financial performance. All statements herein or therein that are
not historical facts, including statements about our beliefs or
expectations, are forward-looking statements. We generally
identify these statements by words or phrases, such as
“anticipate,” “estimate,” “plan,”
“project,” “expect,” “believe,”
“intend,” “foresee,” “forecast,”
“will,” “may,” “outlook” or the
negative version of these words or other similar words or
phrases. These statements discuss, among other things, our
strategy, store openings, integration and remodeling, future
financial or operational performance, projected sales or
earnings per share for certain periods, comparable store sales
from one period to another, cost savings, results of store
closings and restructurings, outcome or impact of pending or
threatened litigation, domestic or international developments,
nature and allocation of future capital expenditures, growth
initiatives, inventory levels, cost of goods, future financings
and other goals and targets and statements of the assumptions
underlying or relating to any such statements.
These statements are subject to risks, uncertainties, and other
factors, including, among others, competition in the retail
industry and changes in our product distribution mix and
distribution channels, seasonality of our business, changes in
consumer preferences and consumer spending patterns, product
195
safety issues including product recalls, general economic
conditions in the United States and other countries in which we
conduct our business, our ability to implement our strategy, our
substantial level of indebtedness and related debt-service
obligations, restrictions imposed by covenants in our debt
agreements, availability of adequate financing, changes in laws
that impact our business, changes in employment legislation, our
dependence on key vendors for our merchandise, costs of goods
that we sell, labor costs, transportation costs, domestic and
international events affecting the delivery of toys and other
products to our stores, political and other developments
associated with our international operations, existence of
adverse litigation and other risks, uncertainties and factors
set forth under “Risk Factors” herein. In addition, we
typically earn a disproportionate part of our annual operating
earnings in the fourth quarter as a result of seasonal buying
patterns and these buying patterns are difficult to forecast
with certainty. These factors should not be construed as
exhaustive, and should be read in conjunction with the other
cautionary statements that are included in this report. We
believe that all forward-looking statements are based on
reasonable assumptions when made; however, we caution that it is
impossible to predict actual results or outcomes or the effects
of risks, uncertainties or other factors on anticipated results
or outcomes and that, accordingly, one should not place undue
reliance on these statements. Forward-looking statements speak
only as of the date they were made, and we undertake no
obligation to update these statements in light of subsequent
events or developments unless required by SEC rules and
regulations. Actual results may differ materially from
anticipated results or outcomes discussed in any forward-looking
statement.
196
MANAGEMENT’S
REPORT ON INTERNAL CONTROL OVER FINANCIAL REPORTING
Management is responsible for establishing and maintaining
adequate internal control over financial reporting. Our internal
control over financial reporting is a process designed to
provide reasonable assurance regarding the reliability of
financial reporting and the preparation of financial statements
for external purposes in accordance with generally accepted
accounting principles.
Internal control over financial reporting cannot provide
absolute assurance of achieving financial reporting objectives
because of its inherent limitations. Internal control over
financial reporting is a process that involves human diligence
and compliance and is subject to lapses in judgment and
breakdowns resulting from human failures. Internal control over
financial reporting also can be circumvented by collusion or
improper management override. Because of such limitations, there
is a risk that material misstatements may not be prevented or
detected on a timely basis by internal control over financial
reporting. However, these inherent limitations are known
features of the financial reporting process. Therefore, it is
possible to design into the process safeguards to reduce, though
not eliminate, this risk.
Management has used the framework set forth in the report
entitled “Internal Control — Integrated
Framework” issued by the Committee of Sponsoring
Organizations of the Treadway Commission (“COSO”) to
evaluate the effectiveness of the internal control over
financial reporting. Based on that evaluation, management has
concluded that the internal control over financial reporting was
effective as of December 31, 2010.
Rene R. Joyce
Chief Executive Officer
(Principal Executive Officer)
Matthew J. Meloy
Senior Vice President, Chief Financial Officer and Treasurer
(Principal Financial Officer)
F-2
Report of
Independent Registered Public Accounting Firm
To the Board of Directors and Stockholders of Targa Resources
Corp.:
In our opinion, the accompanying consolidated balance sheets and
the related consolidated statements of operations, of
comprehensive income (loss), of changes in owners’ equity
and of cash flows present fairly, in all material respects, the
financial position of Targa Resources Corp. and its subsidiaries
(the “Company”) at December 31, 2010 and 2009,
and the results of their operations and their cash flows for
each of the three years in the period ended December 31,
2010 in conformity with accounting principles generally accepted
in the United States of America. These financial statements are
the responsibility of the Company’s management. Our
responsibility is to express an opinion on these financial
statements based on our audits. We conducted our audits of these
statements in accordance with the standards of the Public
Company Accounting Oversight Board (United States). Those
standards require that we plan and perform the audit to obtain
reasonable assurance about whether the financial statements are
free of material misstatement. An audit includes examining, on a
test basis, evidence supporting the amounts and disclosures in
the financial statements, assessing the accounting principles
used and significant estimates made by management, and
evaluating the overall financial statement presentation. We
believe that our audits provide a reasonable basis for our
opinion.
/s/ PricewaterhouseCoopers
LLP
Houston, Texas
February 25, 2011
F-3
TARGA RESOURCES
CORP.
| |
|
|
|
|
|
|
|
|
|
|
|
December 31,
|
|
|
|
|
2010
|
|
|
2009
|
|
|
|
|
(In millions)
|
|
|
|
|
ASSETS
|
|
Current assets:
|
|
|
|
|
|
|
|
|
|
Cash and cash equivalents
|
|
$
|
188.4
|
|
|
$
|
252.4
|
|
|
Trade receivables, net of allowances of $7.9 million and
$8.0 million
|
|
|
466.6
|
|
|
|
404.3
|
|
|
Inventory
|
|
|
50.4
|
|
|
|
39.4
|
|
|
Deferred income taxes
|
|
|
3.6
|
|
|
|
—
|
|
|
Assets from risk management activities
|
|
|
25.2
|
|
|
|
32.9
|
|
|
Other current assets
|
|
|
16.3
|
|
|
|
16.0
|
|
|
|
|
|
|
|
|
|
|
|
|
Total current assets
|
|
|
750.5
|
|
|
|
745.0
|
|
|
|
|
|
|
|
|
|
|
|
|
Property, plant and equipment, at cost
|
|
|
3,331.4
|
|
|
|
3,193.3
|
|
|
Accumulated depreciation
|
|
|
(822.4
|
)
|
|
|
(645.2
|
)
|
|
|
|
|
|
|
|
|
|
|
|
Property, plant and equipment, net
|
|
|
2,509.0
|
|
|
|
2,548.1
|
|
|
Long-term assets from risk management activities
|
|
|
18.9
|
|
|
|
13.8
|
|
|
Other long-term assets
|
|
|
115.4
|
|
|
|
60.6
|
|
|
|
|
|
|
|
|
|
|
|
|
Total assets
|
|
$
|
3,393.8
|
|
|
$
|
3,367.5
|
|
|
|
|
|
|
|
|
|
|
|
|
|
|
LIABILITIES AND OWNERS’ EQUITY
|
|
Current liabilities:
|
|
|
|
|
|
|
|
|
|
Accounts payable
|
|
$
|
254.2
|
|
|
$
|
206.4
|
|
|
Accrued liabilities
|
|
|
335.8
|
|
|
|
304.3
|
|
|
Current maturities of debt
|
|
|
—
|
|
|
|
12.5
|
|
|
Deferred income taxes
|
|
|
—
|
|
|
|
1.4
|
|
|
Liabilities from risk management activities
|
|
|
34.2
|
|
|
|
29.2
|
|
|
|
|
|
|
|
|
|
|
|
|
Total current liabilities
|
|
|
624.2
|
|
|
|
553.8
|
|
|
|
|
|
|
|
|
|
|
|
|
Long-term debt, less current maturities
|
|
|
1,534.7
|
|
|
|
1,593.5
|
|
|
Long-term liabilities from risk management activities
|
|
|
32.8
|
|
|
|
43.8
|
|
|
Deferred income taxes
|
|
|
111.6
|
|
|
|
50.0
|
|
|
Other long-term liabilities
|
|
|
54.4
|
|
|
|
63.1
|
|
|
Commitments and contingencies (see Note 16)
|
|
|
|
|
|
|
|
|
|
Convertible cumulative participating series B preferred
stock
|
|
|
|
|
|
|
|
|
|
(100.0 million shares authorized, none and 6.4 million
shares issued and
|
|
|
|
|
|
|
|
|
|
outstanding at December 31, 2010 and December 31, 2009)
|
|
|
—
|
|
|
|
308.4
|
|
|
Owners’ equity:
|
|
|
|
|
|
|
|
|
|
Targa Resources Corp. stockholders’ equity:
|
|
|
|
|
|
|
|
|
|
Common stock
|
|
|
|
|
|
|
|
|
|
($0.001 par value, 300.0 million shares authorized,
42.3 million and 3.9 million shares issued and
outstanding at December 31, 2010 and December 31, 2009)
|
|
|
—
|
|
|
|
—
|
|
|
Additional paid-in capital
|
|
|
244.5
|
|
|
|
194.0
|
|
|
Accumulated deficit
|
|
|
(100.8
|
)
|
|
|
(85.8
|
)
|
|
Accumulated other comprehensive income (loss)
|
|
|
0.6
|
|
|
|
(20.3
|
)
|
|
Treasury stock, at cost
|
|
|
—
|
|
|
|
(0.5
|
)
|
|
|
|
|
|
|
|
|
|
|
|
Total Targa Resources Corp. stockholders’ equity
|
|
|
144.3
|
|
|
|
87.4
|
|
|
Noncontrolling interests in subsidiaries
|
|
|
891.8
|
|
|
|
667.5
|
|
|
|
|
|
|
|
|
|
|
|
|
Total owners’ equity
|
|
|
1,036.1
|
|
|
|
754.9
|
|
|
|
|
|
|
|
|
|
|
|
|
Total liabilities and owners’ equity
|
|
$
|
3,393.8
|
|
|
$
|
3,367.5
|
|
|
|
|
|
|
|
|
|
|
|
See notes to consolidated financial statements
F-4
TARGA RESOURCES
CORP.
| |
|
|
|
|
|
|
|
|
|
|
|
|
|
|
|
Year Ended December 31,
|
|
|
|
|
2010
|
|
|
2009
|
|
|
2008
|
|
|
|
|
(In millions, except per share amounts)
|
|
|
|
|
Revenues
|
|
$
|
5,469.2
|
|
|
$
|
4,536.0
|
|
|
$
|
7,998.9
|
|
|
Costs and expenses:
|
|
|
|
|
|
|
|
|
|
|
|
|
|
Product purchases
|
|
|
4,687.7
|
|
|
|
3,791.1
|
|
|
|
7,218.5
|
|
|
Operating expenses
|
|
|
260.2
|
|
|
|
235.0
|
|
|
|
275.2
|
|
|
Depreciation and amortization expenses
|
|
|
185.5
|
|
|
|
170.3
|
|
|
|
160.9
|
|
|
General and administrative expenses
|
|
|
144.4
|
|
|
|
120.4
|
|
|
|
96.4
|
|
|
Other
|
|
|
(4.7
|
)
|
|
|
2.0
|
|
|
|
13.4
|
|
|
|
|
|
|
|
|
|
|
|
|
|
|
|
|
|
|
|
5,273.1
|
|
|
|
4,318.8
|
|
|
|
7,764.4
|
|
|
|
|
|
|
|
|
|
|
|
|
|
|
|
|
Income from operations
|
|
|
196.1
|
|
|
|
217.2
|
|
|
|
234.5
|
|
|
Other income (expense):
|
|
|
|
|
|
|
|
|
|
|
|
|
|
Interest expense, net
|
|
|
(110.9
|
)
|
|
|
(132.1
|
)
|
|
|
(141.2
|
)
|
|
Equity in earnings of unconsolidated investments
|
|
|
5.4
|
|
|
|
5.0
|
|
|
|
14.0
|
|
|
Gain (loss) on debt repurchases (see Note 9)
|
|
|
(17.4
|
)
|
|
|
(1.5
|
)
|
|
|
25.6
|
|
|
Gain on early debt extinguishment (see Note 9)
|
|
|
12.5
|
|
|
|
9.7
|
|
|
|
3.6
|
|
|
Gain on insurance claims (see Note 13)
|
|
|
—
|
|
|
|
—
|
|
|
|
18.5
|
|
|
Gain (loss) on
mark-to-market
derivative instruments
|
|
|
(0.4
|
)
|
|
|
0.3
|
|
|
|
(1.3
|
)
|
|
Other income
|
|
|
0.5
|
|
|
|
1.2
|
|
|
|
—
|
|
|
|
|
|
|
|
|
|
|
|
|
|
|
|
|
Income before income taxes
|
|
|
85.8
|
|
|
|
99.8
|
|
|
|
153.7
|
|
|
Income tax (expense) benefit:
|
|
|
|
|
|
|
|
|
|
|
|
|
|
Current
|
|
|
10.6
|
|
|
|
(1.6
|
)
|
|
|
(1.3
|
)
|
|
Deferred
|
|
|
(33.1
|
)
|
|
|
(19.1
|
)
|
|
|
(18.0
|
)
|
|
|
|
|
|
|
|
|
|
|
|
|
|
|
|
|
|
|
(22.5
|
)
|
|
|
(20.7
|
)
|
|
|
(19.3
|
)
|
|
|
|
|
|
|
|
|
|
|
|
|
|
|
|
Net income
|
|
|
63.3
|
|
|
|
79.1
|
|
|
|
134.4
|
|
|
Less: Net income attributable to noncontrolling interest
|
|
|
78.3
|
|
|
|
49.8
|
|
|
|
97.1
|
|
|
|
|
|
|
|
|
|
|
|
|
|
|
|
|
Net income (loss) attributable to Targa Resources Corp.
|
|
|
(15.0
|
)
|
|
|
29.3
|
|
|
|
37.3
|
|
|
Dividends on Series B preferred stock
|
|
|
(9.5
|
)
|
|
|
(17.8
|
)
|
|
|
(16.8
|
)
|
|
Undistributed earnings attributable to preferred shareholders
|
|
|
—
|
|
|
|
(11.5
|
)
|
|
|
(20.5
|
)
|
|
Dividends on common equivalents
|
|
|
(177.8
|
)
|
|
|
—
|
|
|
|
—
|
|
|
|
|
|
|
|
|
|
|
|
|
|
|
|
|
Net income (loss) available to common shareholders
|
|
|
(202.3
|
)
|
|
|
—
|
|
|
|
—
|
|
|
|
|
|
|
|
|
|
|
|
|
|
|
|
|
Net income (loss) available per common share
|
|
$
|
(30.94
|
)
|
|
$
|
—
|
|
|
$
|
—
|
|
|
|
|
|
|
|
|
|
|
|
|
|
|
|
|
Weighted average shares outstanding — basic and diluted
|
|
|
6.5
|
|
|
|
3.8
|
|
|
|
3.8
|
|
See notes to consolidated financial statements
F-5
TARGA RESOURCES
CORP.
| |
|
|
|
|
|
|
|
|
|
|
|
|
|
|
|
Year Ended December 31,
|
|
|
|
|
2010
|
|
|
2009
|
|
|
2008
|
|
|
|
|
(In millions)
|
|
|
|
|
Net income (loss) attributable to Targa Resources Corp.
|
|
$
|
(15.0
|
)
|
|
$
|
29.3
|
|
|
$
|
37.3
|
|
|
Other comprehensive income (loss) attributable to Targa
Resources Corp.
|
|
|
|
|
|
|
|
|
|
|
|
|
|
Commodity hedging contracts:
|
|
|
|
|
|
|
|
|
|
|
|
|
|
Change in fair value
|
|
|
38.0
|
|
|
|
(49.6
|
)
|
|
|
110.9
|
|
|
Reclassification adjustment for settled periods
|
|
|
(4.0
|
)
|
|
|
(39.5
|
)
|
|
|
40.4
|
|
|
Interest rate hedges:
|
|
|
|
|
|
|
|
|
|
|
|
|
|
Change in fair value
|
|
|
(1.9
|
)
|
|
|
(7.2
|
)
|
|
|
(5.0
|
)
|
|
Reclassification adjustment for settled periods
|
|
|
1.6
|
|
|
|
8.8
|
|
|
|
0.7
|
|
|
Foreign currency translation adjustment
|
|
|
—
|
|
|
|
—
|
|
|
|
(1.8
|
)
|
|
Related income taxes
|
|
|
(12.8
|
)
|
|
|
31.1
|
|
|
|
(52.8
|
)
|
|
|
|
|
|
|
|
|
|
|
|
|
|
|
|
Other comprehensive income (loss) attributable to Targa
Resources Corp.
|
|
|
20.9
|
|
|
|
(56.4
|
)
|
|
|
92.4
|
|
|
|
|
|
|
|
|
|
|
|
|
|
|
|
|
Comprehensive income (loss) attributable to Targa Resources
Corp.
|
|
|
5.9
|
|
|
|
(27.1
|
)
|
|
|
129.7
|
|
|
|
|
|
|
|
|
|
|
|
|
|
|
|
|
Net income attributable to noncontrolling interest
|
|
|
78.3
|
|
|
|
49.8
|
|
|
|
97.1
|
|
|
Other comprehensive income (loss) attributable to
|
|
|
|
|
|
|
|
|
|
|
|
|
|
noncontrolling interest:
|
|
|
|
|
|
|
|
|
|
|
|
|
|
Commodity hedging contracts:
|
|
|
|
|
|
|
|
|
|
|
|
|
|
Change in fair value
|
|
|
14.5
|
|
|
|
(54.7
|
)
|
|
|
95.5
|
|
|
Reclassification adjustment for settled periods
|
|
|
(4.4
|
)
|
|
|
(30.2
|
)
|
|
|
24.7
|
|
|
Interest rate swaps:
|
|
|
|
|
|
|
|
|
|
|
|
|
|
Change in fair value
|
|
|
(18.2
|
)
|
|
|
(0.1
|
)
|
|
|
(14.0
|
)
|
|
Reclassification adjustment for settled periods
|
|
|
7.7
|
|
|
|
6.9
|
|
|
|
2.0
|
|
|
|
|
|
|
|
|
|
|
|
|
|
|
|
|
Other comprehensive income (loss) attributable to noncontrolling
interest
|
|
|
(0.4
|
)
|
|
|
(78.1
|
)
|
|
|
108.2
|
|
|
|
|
|
|
|
|
|
|
|
|
|
|
|
|
Comprehensive income (loss) attributable to noncontrolling
interest
|
|
|
77.9
|
|
|
|
(28.3
|
)
|
|
|
205.3
|
|
|
|
|
|
|
|
|
|
|
|
|
|
|
|
|
Total comprehensive income (loss)
|
|
$
|
83.8
|
|
|
$
|
(55.4
|
)
|
|
$
|
335.0
|
|
|
|
|
|
|
|
|
|
|
|
|
|
|
|
See notes to consolidated financial statements
F-6
TARGA RESOURCES
CORP.
| |
|
|
|
|
|
|
|
|
|
|
|
|
|
|
|
|
|
|
|
|
|
|
|
|
|
|
|
|
|
|
|
|
|
|
|
|
|
|
|
|
|
|
|
|
|
|
|
|
|
|
|
Accumulated
|
|
|
|
|
|
|
|
|
|
|
|
|
|
|
|
|
|
|
|
|
|
|
Additional
|
|
|
|
|
|
Other
|
|
|
|
|
|
|
|
|
Non
|
|
|
|
|
|
|
|
Common Stock
|
|
|
Paid in
|
|
|
Accumulated
|
|
|
Comprehensive
|
|
|
Treasury Stock
|
|
|
Controlling
|
|
|
|
|
|
|
|
Shares
|
|
|
Amount
|
|
|
Capital
|
|
|
Deficit
|
|
|
Income (Loss)
|
|
|
Shares
|
|
|
Amount
|
|
|
Interest
|
|
|
Total
|
|
|
|
|
(In millions, except shares in thousands)
|
|
|
|
|
Balance, December 31, 2007
|
|
|
3,653
|
|
|
$
|
—
|
|
|
$
|
230.4
|
|
|
$
|
(152.4
|
)
|
|
$
|
(56.3
|
)
|
|
|
18
|
|
|
$
|
—
|
|
|
$
|
552.4
|
|
|
$
|
574.1
|
|
|
Option exercises
|
|
|
181
|
|
|
|
—
|
|
|
|
0.8
|
|
|
|
—
|
|
|
|
—
|
|
|
|
—
|
|
|
|
—
|
|
|
|
—
|
|
|
|
0.8
|
|
|
Forfeiture of non-vested common stock
|
|
|
(27
|
)
|
|
|
—
|
|
|
|
—
|
|
|
|
—
|
|
|
|
—
|
|
|
|
—
|
|
|
|
—
|
|
|
|
—
|
|
|
|
—
|
|
|
Repurchases of common stock
|
|
|
—
|
|
|
|
—
|
|
|
|
—
|
|
|
|
—
|
|
|
|
—
|
|
|
|
70
|
|
|
|
(0.5
|
)
|
|
|
—
|
|
|
|
(0.5
|
)
|
|
Dividends of Series B preferred stock
|
|
|
—
|
|
|
|
—
|
|
|
|
(16.8
|
)
|
|
|
—
|
|
|
|
—
|
|
|
|
—
|
|
|
|
—
|
|
|
|
—
|
|
|
|
(16.8
|
)
|
|
Impact of equity transactions of the Partnership
|
|
|
—
|
|
|
|
—
|
|
|
|
(0.4
|
)
|
|
|
—
|
|
|
|
—
|
|
|
|
—
|
|
|
|
—
|
|
|
|
0.4
|
|
|
|
—
|
|
|
VESCO Acquisition
|
|
|
—
|
|
|
|
—
|
|
|
|
—
|
|
|
|
—
|
|
|
|
—
|
|
|
|
—
|
|
|
|
—
|
|
|
|
41.9
|
|
|
|
41.9
|
|
|
Distribution of property
|
|
|
—
|
|
|
|
—
|
|
|
|
—
|
|
|
|
—
|
|
|
|
—
|
|
|
|
—
|
|
|
|
—
|
|
|
|
(14.8
|
)
|
|
|
(14.8
|
)
|
|
Contributions
|
|
|
—
|
|
|
|
—
|
|
|
|
—
|
|
|
|
—
|
|
|
|
—
|
|
|
|
—
|
|
|
|
—
|
|
|
|
0.3
|
|
|
|
0.3
|
|
|
Dividends
|
|
|
—
|
|
|
|
—
|
|
|
|
—
|
|
|
|
—
|
|
|
|
—
|
|
|
|
—
|
|
|
|
—
|
|
|
|
(98.5
|
)
|
|
|
(98.5
|
)
|
|
Amortization of equity awards
|
|
|
—
|
|
|
|
—
|
|
|
|
1.2
|
|
|
|
—
|
|
|
|
—
|
|
|
|
—
|
|
|
|
—
|
|
|
|
0.3
|
|
|
|
1.5
|
|
|
Tax expense on vesting of common stock
|
|
|
—
|
|
|
|
—
|
|
|
|
(1.0
|
)
|
|
|
—
|
|
|
|
—
|
|
|
|
—
|
|
|
|
—
|
|
|
|
—
|
|
|
|
(1.0
|
)
|
|
Other comprehensive income
|
|
|
—
|
|
|
|
—
|
|
|
|
—
|
|
|
|
—
|
|
|
|
92.4
|
|
|
|
—
|
|
|
|
—
|
|
|
|
108.2
|
|
|
|
200.6
|
|
|
Net income
|
|
|
—
|
|
|
|
—
|
|
|
|
—
|
|
|
|
37.3
|
|
|
|
—
|
|
|
|
—
|
|
|
|
—
|
|
|
|
97.1
|
|
|
|
134.4
|
|
|
|
|
|
|
|
|
|
|
|
|
|
|
|
|
|
|
|
|
|
|
|
|
|
|
|
|
|
|
|
|
|
|
|
|
|
|
|
|
Balance, December 31, 2008
|
|
|
3,807
|
|
|
|
—
|
|
|
|
214.2
|
|
|
|
(115.1
|
)
|
|
|
36.1
|
|
|
|
88
|
|
|
|
(0.5
|
)
|
|
|
687.3
|
|
|
|
822.0
|
|
|
Option exercises
|
|
|
106
|
|
|
|
—
|
|
|
|
0.3
|
|
|
|
—
|
|
|
|
—
|
|
|
|
—
|
|
|
|
—
|
|
|
|
—
|
|
|
|
0.3
|
|
|
Forfeiture of non-vested common stock
|
|
|
(3
|
)
|
|
|
—
|
|
|
|
—
|
|
|
|
—
|
|
|
|
—
|
|
|
|
—
|
|
|
|
—
|
|
|
|
—
|
|
|
|
—
|
|
|
Repurchases of common stock
|
|
|
—
|
|
|
|
—
|
|
|
|
—
|
|
|
|
—
|
|
|
|
—
|
|
|
|
9
|
|
|
|
—
|
|
|
|
—
|
|
|
|
—
|
|
|
Impact of equity transactions of the Partnership
|
|
|
—
|
|
|
|
—
|
|
|
|
(2.9
|
)
|
|
|
—
|
|
|
|
—
|
|
|
|
—
|
|
|
|
—
|
|
|
|
2.9
|
|
|
|
—
|
|
|
Contributions
|
|
|
—
|
|
|
|
—
|
|
|
|
—
|
|
|
|
—
|
|
|
|
—
|
|
|
|
—
|
|
|
|
—
|
|
|
|
103.8
|
|
|
|
103.8
|
|
|
Dividends
|
|
|
—
|
|
|
|
—
|
|
|
|
—
|
|
|
|
—
|
|
|
|
—
|
|
|
|
—
|
|
|
|
—
|
|
|
|
(98.5
|
)
|
|
|
(98.5
|
)
|
|
Dividends on Series B preferred stock
|
|
|
—
|
|
|
|
—
|
|
|
|
(17.8
|
)
|
|
|
—
|
|
|
|
—
|
|
|
|
—
|
|
|
|
—
|
|
|
|
—
|
|
|
|
(17.8
|
)
|
|
Amortization of equity awards
|
|
|
—
|
|
|
|
—
|
|
|
|
0.4
|
|
|
|
—
|
|
|
|
—
|
|
|
|
—
|
|
|
|
—
|
|
|
|
0.3
|
|
|
|
0.7
|
|
|
Tax expense on vesting of common stock
|
|
|
—
|
|
|
|
—
|
|
|
|
(0.2
|
)
|
|
|
—
|
|
|
|
—
|
|
|
|
—
|
|
|
|
—
|
|
|
|
—
|
|
|
|
(0.2
|
)
|
|
Other comprehensive income (loss)
|
|
|
—
|
|
|
|
—
|
|
|
|
—
|
|
|
|
—
|
|
|
|
(56.4
|
)
|
|
|
—
|
|
|
|
—
|
|
|
|
(78.1
|
)
|
|
|
(134.5
|
)
|
|
Net income
|
|
|
—
|
|
|
|
—
|
|
|
|
—
|
|
|
|
29.3
|
|
|
|
—
|
|
|
|
—
|
|
|
|
—
|
|
|
|
49.8
|
|
|
|
79.1
|
|
|
|
|
|
|
|
|
|
|
|
|
|
|
|
|
|
|
|
|
|
|
|
|
|
|
|
|
|
|
|
|
|
|
|
|
|
|
|
|
Balance, December 31, 2009
|
|
|
3,910
|
|
|
|
—
|
|
|
|
194.0
|
|
|
|
(85.8
|
)
|
|
|
(20.3
|
)
|
|
|
97
|
|
|
|
(0.5
|
)
|
|
|
667.5
|
|
|
|
754.9
|
|
|
Option exercises
|
|
|
1,161
|
|
|
|
—
|
|
|
|
0.6
|
|
|
|
—
|
|
|
|
—
|
|
|
|
(69
|
)
|
|
|
0.3
|
|
|
|
—
|
|
|
|
0.9
|
|
|
Compensation on equity grants
|
|
|
1,906
|
|
|
|
—
|
|
|
|
13.8
|
|
|
|
—
|
|
|
|
—
|
|
|
|
—
|
|
|
|
—
|
|
|
|
—
|
|
|
|
13.8
|
|
|
Repurchases of common stock
|
|
|
—
|
|
|
|
—
|
|
|
|
—
|
|
|
|
—
|
|
|
|
—
|
|
|
|
13
|
|
|
|
(0.1
|
)
|
|
|
—
|
|
|
|
(0.1
|
)
|
|
Proceeds from sale of limited partner
|
|
|
|
|
|
|
|
|
|
|
|
|
|
|
|
|
|
|
|
|
|
|
|
|
|
|
|
|
|
|
|
|
|
|
|
|
|
interests in the Partnership
|
|
|
—
|
|
|
|
—
|
|
|
|
—
|
|
|
|
—
|
|
|
|
—
|
|
|
|
—
|
|
|
|
—
|
|
|
|
224.4
|
|
|
|
224.4
|
|
|
Impact of equity transactions of the Partnership
|
|
|
—
|
|
|
|
—
|
|
|
|
258.9
|
|
|
|
—
|
|
|
|
—
|
|
|
|
—
|
|
|
|
—
|
|
|
|
(258.9
|
)
|
|
|
—
|
|
|
Tax impact of equity offerings
|
|
|
—
|
|
|
|
—
|
|
|
|
(79.6
|
)
|
|
|
—
|
|
|
|
—
|
|
|
|
—
|
|
|
|
—
|
|
|
|
—
|
|
|
|
(79.6
|
)
|
|
Proceeds from Partnership Equity offerings
|
|
|
—
|
|
|
|
—
|
|
|
|
—
|
|
|
|
—
|
|
|
|
—
|
|
|
|
—
|
|
|
|
—
|
|
|
|
317.8
|
|
|
|
317.8
|
|
|
Dividends to noncontrolling interests
|
|
|
—
|
|
|
|
—
|
|
|
|
—
|
|
|
|
—
|
|
|
|
—
|
|
|
|
—
|
|
|
|
—
|
|
|
|
(136.9
|
)
|
|
|
(136.9
|
)
|
|
Dividends to common and common equivalents
|
|
|
—
|
|
|
|
—
|
|
|
|
(213.3
|
)
|
|
|
—
|
|
|
|
—
|
|
|
|
—
|
|
|
|
—
|
|
|
|
—
|
|
|
|
(213.3
|
)
|
|
Dividends on Series B preferred stock
|
|
|
—
|
|
|
|
—
|
|
|
|
(9.5
|
)
|
|
|
—
|
|
|
|
—
|
|
|
|
—
|
|
|
|
—
|
|
|
|
—
|
|
|
|
(9.5
|
)
|
|
Series B Preferred Conversion
|
|
|
35,356
|
|
|
|
—
|
|
|
|
79.9
|
|
|
|
—
|
|
|
|
—
|
|
|
|
—
|
|
|
|
—
|
|
|
|
—
|
|
|
|
79.9
|
|
|
Other comprehensive income
|
|
|
—
|
|
|
|
—
|
|
|
|
—
|
|
|
|
—
|
|
|
|
20.9
|
|
|
|
—
|
|
|
|
—
|
|
|
|
(0.4
|
)
|
|
|
20.5
|
|
|
Treasury shares retired
|
|
|
(41
|
)
|
|
|
—
|
|
|
|
(0.3
|
)
|
|
|
—
|
|
|
|
—
|
|
|
|
(41
|
)
|
|
|
0.3
|
|
|
|
—
|
|
|
|
—
|
|
|
Net income (loss)
|
|
|
—
|
|
|
|
—
|
|
|
|
—
|
|
|
|
(15.0
|
)
|
|
|
—
|
|
|
|
—
|
|
|
|
—
|
|
|
|
78.3
|
|
|
|
63.3
|
|
|
|
|
|
|
|
|
|
|
|
|
|
|
|
|
|
|
|
|
|
|
|
|
|
|
|
|
|
|
|
|
|
|
|
|
|
|
|
|
Balance, December 31, 2010
|
|
|
42,292
|
|
|
$
|
—
|
|
|
$
|
244.5
|
|
|
$
|
(100.8
|
)
|
|
$
|
0.6
|
|
|
|
—
|
|
|
$
|
—
|
|
|
$
|
891.8
|
|
|
$
|
1,036.1
|
|
|
|
|
|
|
|
|
|
|
|
|
|
|
|
|
|
|
|
|
|
|
|
|
|
|
|
|
|
|
|
|
|
|
|
|
|
|
|
See notes to consolidated financial statements
F-7
TARGA RESOURCES
CORP.
| |
|
|
|
|
|
|
|
|
|
|
|
|
|
|
|
Year Ended December 31,
|
|
|
|
|
2010
|
|
|
2009
|
|
|
2008
|
|
|
|
|
(In millions)
|
|
|
|
|
Cash flows from operating activities
|
|
|
|
|
|
|
|
|
|
|
|
|
|
Net income (loss)
|
|
$
|
63.3
|
|
|
$
|
79.1
|
|
|
$
|
134.4
|
|
|
Adjustments to reconcile net income (loss) to net cash provided
by operating activities:
|
|
|
|
|
|
|
|
|
|
|
|
|
|
Amortization in interest expense
|
|
|
9.4
|
|
|
|
10.2
|
|
|
|
9.6
|
|
|
Paid-in-kind
interest expense
|
|
|
10.9
|
|
|
|
25.9
|
|
|
|
38.2
|
|
|
Compensation on equity grants
|
|
|
13.4
|
|
|
|
0.7
|
|
|
|
1.5
|
|
|
Depreciation and amortization expense
|
|
|
174.7
|
|
|
|
168.8
|
|
|
|
160.9
|
|
|
Asset impairment charges
|
|
|
10.8
|
|
|
|
1.5
|
|
|
|
—
|
|
|
Accretion of asset retirement obligations
|
|
|
3.3
|
|
|
|
2.9
|
|
|
|
1.9
|
|
|
Deferred income tax expense
|
|
|
33.1
|
|
|
|
19.1
|
|
|
|
18.0
|
|
|
Equity in earnings of unconsolidated investments, net of
distributions
|
|
|
3.4
|
|
|
|
—
|
|
|
|
(9.4
|
)
|
|
Risk management activities
|
|
|
29.9
|
|
|
|
40.3
|
|
|
|
(64.5
|
)
|
|
Loss (gain) on sale of assets
|
|
|
(1.5
|
)
|
|
|
0.1
|
|
|
|
(5.9
|
)
|
|
Loss (gain) on debt repurchases
|
|
|
17.4
|
|
|
|
1.5
|
|
|
|
(25.6
|
)
|
|
Loss (gain) on early debt extinguishment
|
|
|
(12.5
|
)
|
|
|
(9.7
|
)
|
|
|
(3.6
|
)
|
|
Gain on property damage insurance settlement (See Note 13)
|
|
|
—
|
|
|
|
—
|
|
|
|
(18.5
|
)
|
|
Repayments of interest of Holdco loan facility
|
|
|
(0.9
|
)
|
|
|
(6.0
|
)
|
|
|
(4.3
|
)
|
|
Changes in operating assets and liabilities:
|
|
|
|
|
|
|
|
|
|
|
|
|
|
Accounts receivable and other assets
|
|
|
(119.2
|
)
|
|
|
(140.1
|
)
|
|
|
600.7
|
|
|
Inventory
|
|
|
(11.4
|
)
|
|
|
19.3
|
|
|
|
72.8
|
|
|
Accounts payable and other liabilities
|
|
|
(15.6
|
)
|
|
|
122.2
|
|
|
|
(515.5
|
)
|
|
|
|
|
|
|
|
|
|
|
|
|
|
|
|
Net cash provided by operating activities
|
|
|
208.5
|
|
|
|
335.8
|
|
|
|
390.7
|
|
|
|
|
|
|
|
|
|
|
|
|
|
|
|
|
Cash flows from investing activities
|
|
|
|
|
|
|
|
|
|
|
|
|
|
Outlays for property, plant and equipment
|
|
|
(139.3
|
)
|
|
|
(99.4
|
)
|
|
|
(132.3
|
)
|
|
Acquisitions, net of cash acquired
|
|
|
—
|
|
|
|
—
|
|
|
|
(124.9
|
)
|
|
Proceeds from property insurance
|
|
|
3.5
|
|
|
|
38.8
|
|
|
|
48.3
|
|
|
Other
|
|
|
1.2
|
|
|
|
1.3
|
|
|
|
2.2
|
|
|
|
|
|
|
|
|
|
|
|
|
|
|
|
|
Net cash used in investing activities
|
|
|
(134.6
|
)
|
|
|
(59.3
|
)
|
|
|
(206.7
|
)
|
|
|
|
|
|
|
|
|
|
|
|
|
|
|
|
Cash flows from financing activities
|
|
|
|
|
|
|
|
|
|
|
|
|
|
Loan Facilities of Targa:
|
|
|
|
|
|
|
|
|
|
|
|
|
|
Borrowings
|
|
|
495.0
|
|
|
|
—
|
|
|
|
95.9
|
|
|
Repayments
|
|
|
(1,087.4
|
)
|
|
|
(589.2
|
)
|
|
|
(74.6
|
)
|
|
Loan Facilities of the Partnership:
|
|
|
|
|
|
|
|
|
|
|
|
|
|
Borrowings
|
|
|
1,593.1
|
|
|
|
806.6
|
|
|
|
435.3
|
|
|
Repayments
|
|
|
(1,057.0
|
)
|
|
|
(596.6
|
)
|
|
|
(350.6
|
)
|
|
Dividends to noncontrolling interest
|
|
|
(136.9
|
)
|
|
|
(98.5
|
)
|
|
|
(98.5
|
)
|
|
Proceeds from secondary offering of interests in the Partnership
|
|
|
224.4
|
|
|
|
—
|
|
|
|
—
|
|
|
Proceeds from Partnership equity offerings
|
|
|
317.8
|
|
|
|
103.8
|
|
|
|
0.3
|
|
|
Issuance of common stock
|
|
|
0.9
|
|
|
|
0.3
|
|
|
|
0.8
|
|
|
Repurchases of common stock
|
|
|
(0.1
|
)
|
|
|
—
|
|
|
|
(0.5
|
)
|
|
Dividends to common and common equivalent shareholders
|
|
|
(210.1
|
)
|
|
|
—
|
|
|
|
—
|
|
|
Dividends to preferred shareholders
|
|
|
(238.0
|
)
|
|
|
—
|
|
|
|
—
|
|
|
Costs incurred in connection with financing arrangements
|
|
|
(39.6
|
)
|
|
|
(13.3
|
)
|
|
|
(7.2
|
)
|
|
|
|
|
|
|
|
|
|
|
|
|
|
|
|
Net cash provided by (used in) financing activities
|
|
|
(137.9
|
)
|
|
|
(386.9
|
)
|
|
|
0.9
|
|
|
|
|
|
|
|
|
|
|
|
|
|
|
|
|
Net change in cash and cash equivalents
|
|
|
(64.0
|
)
|
|
|
(110.4
|
)
|
|
|
184.9
|
|
|
Cash and cash equivalents, beginning of period
|
|
|
252.4
|
|
|
|
362.8
|
|
|
|
177.9
|
|
|
|
|
|
|
|
|
|
|
|
|
|
|
|
|
Cash and cash equivalents, end of period
|
|
$
|
188.4
|
|
|
$
|
252.4
|
|
|
$
|
362.8
|
|
|
|
|
|
|
|
|
|
|
|
|
|
|
|
|
|
|
|
|
|
|
|
|
|
|
|
|
|
See notes to consolidated financial statements
F-8
TARGA RESOURCES
CORP.
Except as noted within the context of each footnote
disclosure, the dollar amounts presented in the tabular data
within these footnote disclosures are stated in millions of
dollars.
Note 1—Organization
and Operations
Targa Resources Corp., formerly Targa Resources Investments Inc.
(“TRC”), is a Delaware corporation formed on
October 27, 2005. Unless the context requires otherwise,
references to “we,” “us,” “our,”
“the Company” or “Targa” are intended to
mean our consolidated business and operations.
Note 2—Basis
of Presentation
The accompanying financial statements and related notes present
our consolidated financial position as of December 31, 2010
and 2009, and the results of our operations, comprehensive
income, cash flows and changes in owners’ equity for the
years ended December 31, 2010, 2009 and 2008.
We have prepared our consolidated financial statements in
accordance with accounting principles generally accepted in the
United States of America (“GAAP”). All significant
intercompany balances and transactions have been eliminated.
We are the sole member of Targa Resources GP LLC, the managing
general partner of Targa Resources Partners LP (“the
Partnership”). Because we control the General Partner of
the Partnership, under generally accepted accounting principles,
we must reflect our ownership interest in the Partnership on a
consolidated basis. Accordingly, our financial results are
combined with the Partnership’s financial results in our
consolidated financial statements even though the distribution
or transfer of Partnership assets are limited by the terms of
the partnership agreement, as well as restrictive covenants in
the Partnership’s lending agreements. The limited partner
interests in the Partnership not owned by controlling affiliates
of us are reflected in our results of operations as net income
attributable to non-controlling interests and in our balance
sheet equity section as noncontrolling interests in
subsidiaries. Throughout these footnotes, we make a distinction
where relevant between financial results of the Partnership
versus those of a standalone parent and its non-partnership
subsidiaries.
As of December 31, 2010, our interests in the Partnership
consist of the following:
|
|
|
| |
•
|
a 2% general partner interest, which we hold through our 100%
ownership interest in the general partner of the Partnership;
|
| |
| |
•
|
all Incentive Distribution Rights (IDRs); and
|
| |
| |
•
|
11,645,659 common units of the Partnership, representing a 15.4%
limited partnership interest.
|
In preparing the accompanying consolidated financial statements,
we have reviewed events that have occurred after
December 31, 2010, up until the issuance of the financial
statements. See Notes 9, 11, 12and 24.
Note 3—Out
of Period Adjustment
During 2009, we recorded adjustments related to prior periods
which decreased our income before income taxes for 2009 by
$5.4 million. The adjustments consisted of
$7.2 million related to debt issue costs that should have
been expensed during 2007 and $1.8 million of revenue which
should have been recorded during 2006.
Had these adjustments been previously recorded in their
appropriate periods, net income attributable to Targa for the
year ended December 31, 2009 would have increased by
$3.4 million.
After evaluating the quantitative and qualitative aspects of
these errors, we concluded that our previously issued financial
statements were not materially misstated and the effect of
recognizing these
F-9
adjustments in 2009 financial statements was not material to the
2009 or 2007 results of operations, financial position or cash
flows.
Note 4—Significant
Accounting Policies
Consolidation Policy. Our consolidated
financial statements include our accounts and those of our
subsidiaries in which we have a controlling interest. We hold
varying undivided interests in various gas processing facilities
in which we are responsible for our proportionate share of the
costs and expenses of the facilities. Our consolidated financial
statements reflect our proportionate share of the revenues,
expenses, assets and liabilities of these undivided interests.
We follow the equity method of accounting if our ownership
interest is between 20% and 50% and we exercise significant
influence over the operating and financial policies of the
investee.
Cash and Cash Equivalents. Cash and cash
equivalents include all cash on hand, demand deposits, and
investments with original maturities of three months or less. We
consider cash equivalents to include short-term, highly liquid
investments that are readily convertible to known amounts of
cash and which are subject to an insignificant risk of changes
in value.
Comprehensive Income. Comprehensive income
includes net income and other comprehensive income
(“OCI”), which includes unrealized gains and losses on
derivative instruments that are designated as hedges and
currency translation adjustments.
Allowance for Doubtful Accounts. Estimated
losses on accounts receivable are provided through an allowance
for doubtful accounts. In evaluating the level of established
reserves, we make judgments regarding each party’s ability
to make required payments, economic events and other factors. As
the financial condition of any party changes, circumstances
develop or additional information becomes available, adjustments
to an allowance for doubtful accounts may be required.
Inventory. Our product inventories consist
primarily of NGLs. Most product inventories turn over monthly,
but some inventory, primarily propane, is acquired and held
during the year to meet anticipated heating season requirements
of our customers. Product inventories are valued at the lower of
cost or market using the average cost method.
Product Exchanges. Exchanges of NGL products
are executed to satisfy timing and logistical needs of the
exchange parties. Volumes received and delivered under exchange
agreements are recorded as inventory. If the locations of
receipt and delivery are in different markets, a price
differential may be billed or owed. The price differential is
recorded as either accounts receivable or accrued liabilities.
Gas Processing Imbalances. Quantities of
natural gas
and/or NGLs
over-delivered or under-delivered related to certain gas plant
operational balancing agreements are recorded monthly as
inventory or as a payable using the weighted average price at
the time the imbalance was created. Inventory imbalances
receivable are valued at the lower of cost or market; inventory
imbalances payable are valued at replacement cost. These
imbalances are settled either by current cash-out settlements or
by adjusting future receipts or deliveries of natural gas or
NGLs.
Derivative Instruments. We employ derivative
instruments to manage the volatility of cash flows due to
fluctuating energy prices and interest rates. All derivative
instruments not qualifying for the normal purchase and normal
sale exception are recorded on the balance sheets at fair value.
The treatment of the periodic changes in fair value will depend
on whether the derivative is designated and effective as a hedge
for accounting purposes. We have designated certain Downstream
liquids marketing contracts that meet the definition of a
derivative as normal purchases and normal sales which, under
GAAP, are not accounted for as derivatives.
If a derivative qualifies for hedge accounting and is designated
as a cash flow hedge, the effective portion of the unrealized
gain or loss on the derivative is deferred in Accumulated Other
Comprehensive Income (“AOCI”), a component of
owners’ equity, and reclassified to earnings when the
forecasted transaction occurs. Cash flows from a derivative
instrument designated as a hedge are classified in the
F-10
same category as the cash flows from the item being hedged. As
such, we include the cash flows from commodity derivative
instruments in revenues and from interest rate derivative
instruments in interest expense.
If a derivative does not qualify as a hedge or is not designated
as a hedge, the gain or loss on the derivative is recognized
currently in earnings. The ultimate gain or loss on the
derivative transaction upon settlement is also recognized as a
component of other income and expense.
We formally document all relationships between hedging
instruments and hedged items, as well as our risk management
objectives and strategy for undertaking the hedge. This
documentation includes the specific identification of the
hedging instrument and the hedged item, the nature of the risk
being hedged and the manner in which the hedging
instrument’s effectiveness will be assessed. At the
inception of the hedge, and on an ongoing basis, we assess
whether the derivatives used in hedging transactions are highly
effective in offsetting changes in cash flows of hedged items.
The relationship between the hedging instrument and the hedged
item must be highly effective in achieving the offset of changes
in cash flows attributable to the hedged risk both at the
inception of the contract and on an ongoing basis. We measure
hedge ineffectiveness on a quarterly basis and reclassify any
ineffective portion of the unrealized gain or loss to earnings
in the current period.
We will discontinue hedge accounting on a prospective basis when
a hedge instrument is terminated or ceases to be highly
effective. Gains and losses deferred in AOCI related to cash
flow hedges for which hedge accounting has been discontinued
remain deferred until the forecasted transaction occurs. If it
is no longer probable that a hedged forecasted transaction will
occur, deferred gains or losses on the hedging instrument are
reclassified to earnings immediately.
For balance sheet classification purposes, we analyze the fair
values of the derivative contracts on a deal by deal basis.
Property, Plant and Equipment. Property, plant
and equipment are stated at cost less accumulated depreciation.
Depreciation is computed using the straight-line method over the
estimated useful lives of the assets.
Expenditures for maintenance and repairs are expensed as
incurred. Expenditures to refurbish assets that extend the
useful lives or prevent environmental contamination are
capitalized and depreciated over the remaining useful life of
the asset or major asset component.
Our determination of the useful lives of property, plant and
equipment requires us to make various assumptions, including the
supply of and demand for hydrocarbons in the markets served by
our assets, normal wear and tear of the facilities, and the
extent and frequency of maintenance programs.
We capitalize certain costs directly related to the construction
of assets, including internal labor costs, interest and
engineering costs. Upon disposition or retirement of property,
plant and equipment, any gain or loss is charged to operations.
We evaluate the recoverability of our property, plant and
equipment when events or circumstances such as economic
obsolescence, the business climate, legal and other factors
indicate we may not recover the carrying amount of the assets.
Asset recoverability is measured by comparing the carrying value
of the asset with the asset’s expected future undiscounted
cash flows. These cash flow estimates require us to make
projections and assumptions for many years into the future for
pricing, demand, competition, operating cost and other factors.
If the carrying amount exceeds the expected future undiscounted
cash flows we recognize an impairment loss to write down the
carrying amount of the asset to its fair value as determined by
quoted market prices in active markets or present value
techniques if quotes are unavailable. The determination of the
fair value using present value techniques requires us to make
projections and assumptions regarding the probability of a range
of outcomes and the rates of interest used in the present value
calculations. Any changes we make to these projections and
assumptions could result in significant revisions to our
evaluation of recoverability of our property, plant and
equipment and the recognition of an impairment loss in our
consolidated statements of operations. See Note 6.
F-11
Asset Retirement Obligations
(“AROs”). AROs are legal
obligations associated with the retirement of tangible
long-lived assets that result from the asset’s acquisition,
construction, development
and/or
normal operation. An ARO is initially measured at its estimated
fair value. Upon initial recognition of an ARO, we record an
increase to the carrying amount of the related long-lived asset
and an offsetting ARO liability. The consolidated cost of the
asset and the capitalized asset retirement obligation is
depreciated using the straight-line method over the period
during which the long-lived asset is expected to provide
benefits. After the initial period of ARO recognition, the ARO
will change as a result of either the passage of time or
revisions to the original estimates of either the amounts of
estimated cash flows or their timing.
Changes due to the passage of time increase the carrying amount
of the liability because there are fewer periods remaining from
the initial measurement date until the settlement date;
therefore, the present values of the discounted future
settlement amount increases. These changes are recorded as a
period cost called accretion expense. Changes resulting from
revisions to the timing or the amount of the original estimate
of undiscounted cash flows shall be recognized as an increase or
a decrease in the carrying amount of the liability for an asset
retirement obligation and the related asset retirement cost
capitalized as part of the carrying amount of the related
long-lived asset. Upon settlement, AROs will be extinguished by
us at either the recorded amount or we will recognize a gain or
loss on the difference between the recorded amount and the
actual settlement cost. See Note 7.
Debt Issue Costs. Costs incurred in connection
with the issuance of long-term debt are deferred and charged to
interest expense over the term of the related debt. Gains or
losses on debt repurchases and debt extinguishments include any
associated unamortized debt issue costs.
Environmental Liabilities. Liabilities for
loss contingencies, including environmental remediation costs
arising from claims, assessments, litigation, fines, and
penalties and other sources are charged to expense when it is
probable that a liability has been incurred and the amount of
the assessment
and/or
remediation can be reasonably estimated. See Note 16.
Income Taxes. We account for income taxes
using the asset and liability method of accounting for deferred
income taxes and provide deferred income taxes for all
significant temporary differences.
As part of the process of preparing our consolidated financial
statements, we are required to estimate our income taxes in each
of the jurisdictions in which we operate. This process involves
estimating our actual current tax payable and related tax
expense together with assessing temporary differences resulting
from differing treatment of certain items, such as depreciation,
for tax and accounting purposes. These differences can result in
deferred tax assets and liabilities, which are included within
our consolidated balance sheets.
We must then assess the likelihood that our deferred tax assets
will be recovered from future taxable income and, to the extent
we believe that it is more likely than not (a likelihood of more
than 50%) that some portion or all of the deferred tax assets
will not be realized, we establish a valuation allowance. Any
change in the valuation allowance would impact our income tax
provision and net income in the period in which such a
determination is made. We consider all available evidence, both
positive and negative, to determine whether, based on the weight
of the evidence, a valuation allowance is needed. Evidence used
includes information about our current financial position and
our results of operations for the current and preceding years,
as well as all currently available information about future
years, including our anticipated future performance, the
reversal of deferred tax liabilities and tax planning strategies.
We believe future sources of taxable income, reversing temporary
differences and other tax planning strategies will be sufficient
to realize assets for which no reserve has been established.
Non-controlling Interest. Non-controlling
interest represents third party ownership in the net assets of
our consolidated subsidiaries. For financial reporting purposes,
the assets and liabilities of our majority owned subsidiaries
are consolidated with any third party investors’ interest
shown as non-controlling interest within the equity section of
the balance sheet. In the statements of operations,
non-controlling interest reflects the allocation of earnings to
third party investors. We account for the difference between the
carrying amount of our investment in the Partnership and the
underlying book value arising
F-12
from issuance of common units by the Partnership, where we
maintain control, as an equity transaction. If the Partnership
issues common units at a price different than our carrying value
per unit, we account for the premium or deficiency as an
adjustment to paid-in capital.
Revenue Recognition. Our primary types of
sales and service activities reported as operating revenues
include:
|
|
|
| |
•
|
sales of natural gas, NGLs and condensate;
|
| |
| |
•
|
natural gas processing, from which we generate revenues through
the compression, gathering, treating, and processing of natural
gas; and
|
| |
| |
•
|
NGL fractionation, terminalling and storage, transportation and
treating.
|
We recognize revenues when all of the following criteria are
met: (1) persuasive evidence of an exchange arrangement
exists, if applicable, (2) delivery has occurred or
services have been rendered, (3) the price is fixed or
determinable and (4) collectability is reasonably assured.
For processing services, we receive either fees or a percentage
of commodities as payment for these services, depending on the
type of contract. Under fee-based contracts, we receive a fee
based on throughput volumes. Under
percent-of-proceeds
contracts, we receive either an agreed upon percentage of the
actual proceeds that we receive from our sales of the residue
natural gas and NGLs or an agreed upon percentage based on index
related prices for the natural gas and NGLs.
Percent-of-value
and
percent-of-liquids
contracts are variations on this arrangement. Under keep-whole
contracts, we keep the NGLs extracted and return the processed
natural gas or value of the natural gas to the producer. A
significant portion of our Straddle plant processing contracts
are hybrid contracts under which settlements are made on a
percent-of-liquids
basis or a fee basis, depending on market conditions. Natural
gas or NGLs that we receive for services or purchase for resale
are in turn sold and recognized in accordance with the criteria
outlined above.
We generally report revenues gross in our consolidated
statements of operations. Except for fee-based contracts, we act
as the principal in the transactions where we receive
commodities, take title to the natural gas and NGLs, and incur
the risks and rewards of ownership.
Share-Based Compensation. We award share-based
compensation to employees and directors in the form of
restricted stock, stock options and performance unit awards.
Compensation expense on restricted stock and stock options is
measured by the fair value of the award as determined by
management at the date of grant. Compensation expense on
performance unit awards that qualify as liability arrangements
is initially measured by the fair value of the award at the date
of grant, and re-measured subsequently at each reporting date
through the settlement period. Compensation expense is
recognized in general and administrative expense over the
requisite service period of each award. See Note 24.
Earnings per share. We account for earnings
per share (EPS) in accordance with ASC 260—Earnings
per Share. Diluted EPS reflects the potential dilution that
could occur if securities or other contracts to issue common
stock were exercised or converted into common stock or resulted
in the issuance of common stock so long as it does not have an
anti-dilutive effect on EPS. Securities that meet the definition
of a participating security are required to be considered for
inclusion in the computation of basic earnings per unit using
the two-class method. Prior to the conversion of the
Series B Preferred Stock on December 10, 2010, we used
the two-class method of allocating earnings between our common
and preferred class of stock outstanding for the purposes of
presenting net income per share. See Note 12.
Use of Estimates. When preparing financial
statements in conformity with accounting principles generally
accepted in the United States of America, management must make
estimates and assumptions based on information available at the
time. These estimates and assumptions affect the reported
amounts of assets, liabilities, revenues and expenses, as well
as the disclosures of contingent assets and liabilities as of
the date of the financial statements. Estimates and judgments
are based on information available at the time such estimates
and judgments are made. Adjustments made with respect to the use
of these estimates and judgments often relate to information not
previously available. Uncertainties with respect
F-13
to such estimates and judgments are inherent in the preparation
of financial statements. Estimates and judgments are used in,
among other things, (1) estimating unbilled revenues,
product purchases and operating and general and administrative
costs, (2) developing fair value assumptions, including
estimates of future cash flows and discount rates,
(3) analyzing long-lived assets for possible impairment,
(4) estimating the useful lives of assets and
(5) determining amounts to accrue for contingencies,
guarantees and indemnifications. Actual results, therefore,
could differ materially from estimated amounts.
Accounting
Pronouncements Recently Adopted
Fair Value
Measurements
In January 2010, FASB issued guidance that requires additional
disclosures about fair value measurements including transfers in
and out of Levels 1 and 2 and increased disclosure of
different types of financial instruments. For the reconciliation
of Level 3 fair value measurements, information about
purchases, sales, issuances and settlements should be presented
separately. This guidance is effective for annual and interim
reporting periods beginning after December 15, 2009 for
most of the new disclosures and for periods beginning after
December 15, 2010 for the new Level 3 disclosures.
Comparative disclosures are not required in the first year the
disclosures are required. Our adoption did not have a material
impact on our consolidated financial statements.
Note 5—Inventory
Due to fluctuating commodity prices for natural gas liquids, we
occasionally recognize lower of cost or market adjustments when
the carrying values of our inventories exceeds their net
realizable value. These non-cash adjustments are charged to
product purchases in the period they are recognized, with the
related cash impact in the subsequent period of sale. For 2010
and 2009, we did not recognize an adjustment to the carrying
value of our NGL inventory. At December 31, 2008, we
recognized $6.0 million to reduce the carrying value of NGL
inventory to its net realizable value.
Note 6—Property,
Plant and Equipment
| |
|
|
|
|
|
|
|
|
|
|
|
|
|
|
|
|
|
|
|
|
|
|
|
|
|
|
|
|
|
|
|
December 31,
|
|
|
|
|
|
|
|
2010
|
|
|
2009
|
|
|
|
|
|
|
|
|
|
|
|
|
|
Targa
|
|
|
|
|
|
|
|
|
Targa
|
|
|
|
|
|
|
|
Targa
|
|
|
|
|
|
Resources
|
|
|
Targa
|
|
|
|
|
|
Resources
|
|
|
|
|
|
|
|
Resources
|
|
|
TRC-Non-
|
|
|
Corp-
|
|
|
Resources
|
|
|
TRC-Non-
|
|
|
Corp-
|
|
|
Range of
|
|
|
|
|
Partners LP
|
|
|
Partnership
|
|
|
Consolidated
|
|
|
Partners LP
|
|
|
Partnership
|
|
|
Consolidated
|
|
|
Years
|
|
|
|
|
Natural gas gathering systems
|
|
$
|
1,630.9
|
|
|
$
|
—
|
|
|
|
1,630.9
|
|
|
$
|
1,578.0
|
|
|
$
|
—
|
|
|
$
|
1,578.0
|
|
|
|
5 to 20
|
|
|
Processing and fractionation facilities
|
|
|
961.9
|
|
|
|
6.6
|
|
|
|
968.5
|
|
|
|
949.8
|
|
|
|
6.2
|
|
|
|
956.0
|
|
|
|
5 to 25
|
|
|
Terminalling and natural gas liquids storage facilities
|
|
|
244.7
|
|
|
|
—
|
|
|
|
244.7
|
|
|
|
238.6
|
|
|
|
8.0
|
|
|
|
246.6
|
|
|
|
5 to 25
|
|
|
Transportation assets
|
|
|
275.6
|
|
|
|
—
|
|
|
|
275.6
|
|
|
|
271.6
|
|
|
|
—
|
|
|
|
271.6
|
|
|
|
10 to 25
|
|
|
Other property, plant and equipment
|
|
|
46.8
|
|
|
|
22.6
|
|
|
|
69.4
|
|
|
|
45.3
|
|
|
|
20.9
|
|
|
|
66.2
|
|
|
|
3 to 25
|
|
|
Land
|
|
|
51.2
|
|
|
|
—
|
|
|
|
51.2
|
|
|
|
50.9
|
|
|
|
1.8
|
|
|
|
52.7
|
|
|
|
—
|
|
|
Construction in progress
|
|
|
88.4
|
|
|
|
2.7
|
|
|
|
91.1
|
|
|
|
21.3
|
|
|
|
0.9
|
|
|
|
22.2
|
|
|
|
—
|
|
|
|
|
|
|
|
|
|
|
|
|
|
|
|
|
|
|
|
|
|
|
|
|
|
|
|
|
|
|
|
|
|
|
$
|
3,299.5
|
|
|
$
|
31.9
|
|
|
|
3,331.4
|
|
|
$
|
3,155.5
|
|
|
$
|
37.8
|
|
|
$
|
3,193.3
|
|
|
|
|
|
|
|
|
|
|
|
|
|
|
|
|
|
|
|
|
|
|
|
|
|
|
|
|
|
|
|
|
|
|
|
F-14
Note 7—Asset
Retirement Obligations
Our asset retirement obligations primarily relate to certain of
the Partnership’s gas-gathering pipeline and processing
facilities and are included in our consolidated balance sheets
as a component of other long-term liabilities. The changes in
our aggregate asset retirement obligations are as follows:
| |
|
|
|
|
|
|
|
|
|
|
|
|
|
|
|
Year Ended December 31,
|
|
|
|
|
2010
|
|
|
2009
|
|
|
2008
|
|
|
|
|
Beginning of period
|
|
$
|
34.1
|
|
|
$
|
34.0
|
|
|
$
|
12.6
|
|
|
Liabilities
incurred(1)
|
|
|
—
|
|
|
|
—
|
|
|
|
16.9
|
|
|
Liabilities settled
|
|
|
—
|
|
|
|
—
|
|
|
|
(0.2
|
)
|
|
Change in cash flow
estimate(2)
|
|
|
0.3
|
|
|
|
(2.8
|
)
|
|
|
2.8
|
|
|
Accretion expense
|
|
|
3.3
|
|
|
|
2.9
|
|
|
|
1.9
|
|
|
|
|
|
|
|
|
|
|
|
|
|
|
|
|
End of period
|
|
$
|
37.7
|
|
|
$
|
34.1
|
|
|
$
|
34.0
|
|
|
|
|
|
|
|
|
|
|
|
|
|
|
|
|
|
|
|
(1) |
|
The 2008 amount relates to our consolidation of Venice Energy
Services Company, LLC (“VESCO”). See Note 8. |
| |
|
(2) |
|
The change in cash flow estimate is primarily from a
reassessment of abandonment cost estimates for our offshore
gathering systems. |
Note 8—Investment
in Unconsolidated Affiliates
As of December 31, 2010 and 2009, the Partnership’s
unconsolidated investment consisted of a 38.8% ownership
interest in Gulf Coast Fractionators LP (“GCF), included in
Other long-term assets on the consolidated balance sheet.
Prior to July 31, 2008 our unconsolidated investments also
included a 22.9% ownership interest in VESCO. On July 31,
2008, we acquired an additional 53.9% interest, giving us
effective control under the terms of the operating agreement;
therefore, we have consolidated the operations of VESCO in our
financial results effective August 1, 2008.
The following table shows the activity related to our
unconsolidated investments for the years indicated:
| |
|
|
|
|
|
|
|
|
|
|
|
|
|
|
|
December 31,
|
|
|
|
|
2010
|
|
|
2009
|
|
|
2008
|
|
|
|
|
Equity in earnings of
|
|
|
|
|
|
|
|
|
|
|
|
|
|
VESCO(1)(2)
|
|
$
|
—
|
|
|
$
|
—
|
|
|
$
|
10.1
|
|
|
GCF
|
|
|
5.4
|
|
|
|
5.0
|
|
|
|
3.9
|
|
|
|
|
|
|
|
|
|
|
|
|
|
|
|
|
|
|
$
|
5.4
|
|
|
$
|
5.0
|
|
|
$
|
14.0
|
|
|
|
|
|
|
|
|
|
|
|
|
|
|
|
|
Cash Distributions:
|
|
|
|
|
|
|
|
|
|
|
|
|
|
GCF
|
|
$
|
8.8
|
|
|
$
|
5.0
|
|
|
$
|
4.6
|
|
|
|
|
|
|
|
|
|
|
|
|
|
|
|
|
|
|
|
1) |
|
Includes our equity earnings through July 31, 2008. |
| |
|
2) |
|
Includes business interruption insurance claims of
$4.1 million for 2008. |
The allocated cost basis of GCF at the date of its acquisition
date was less than our partnership equity balance by
approximately $5.2 million. This basis difference is being
amortized over the estimated useful life of the underlying
fractionating assets (25 years) on a straight-line basis
and is included as a component of the Partnership’s equity
in earnings of unconsolidated investments.
F-15
Note 9—Debt
Obligations
Our consolidated debt obligations include our obligations, the
obligations of TRI Resources, Inc. (“TRI”) and the
Partnership’s obligations.
| |
|
|
|
|
|
|
|
|
|
|
|
December 31,
|
|
|
December 31,
|
|
|
|
|
2010
|
|
|
2009
|
|
|
|
|
Long-term debt:
|
|
|
|
|
|
|
|
|
|
Obligations of Targa:
|
|
|
|
|
|
|
|
|
|
TRC Holdco loan facility, variable rate, due February
2015(1)
|
|
$
|
89.3
|
|
|
$
|
385.4
|
|
|
TRI Senior secured revolving credit facility, variable rate, due
July
2014(2)
|
|
|
—
|
|
|
|
—
|
|
|
TRI Senior secured term loan facility, variable rate, due
October 2012
|
|
|
—
|
|
|
|
62.2
|
|
|
TRI Senior unsecured notes,
81/2%
fixed rate, due November 2013
|
|
|
—
|
|
|
|
250.0
|
|
|
Obligations of the
Partnership:(3)
|
|
|
|
|
|
|
|
|
|
Senior secured revolving credit facility, variable rate, due
July
2015(4)
|
|
|
765.3
|
|
|
|
—
|
|
|
Senior secured revolving credit facility, variable rate, due
February 2012
|
|
|
—
|
|
|
|
479.2
|
|
|
Senior unsecured notes,
81/4%
fixed rate, due July 2016
|
|
|
209.1
|
|
|
|
209.1
|
|
|
Senior unsecured notes,
111/4%
fixed rate, due July 2017
|
|
|
231.3
|
|
|
|
231.3
|
|
|
Unamortized discounts, net of premiums
|
|
|
(10.3
|
)
|
|
|
(11.2
|
)
|
|
Senior unsecured notes,
77/8%
fixed rate, due October 2018
|
|
|
250.0
|
|
|
|
—
|
|
|
|
|
|
|
|
|
|
|
|
|
Total debt
|
|
|
1,534.7
|
|
|
|
1,606.0
|
|
|
Current maturities of TRI debt
|
|
|
—
|
|
|
|
(12.5
|
)
|
|
|
|
|
|
|
|
|
|
|
|
Total long-term debt
|
|
$
|
1,534.7
|
|
|
$
|
1,593.5
|
|
|
|
|
|
|
|
|
|
|
|
|
Irrevocable standby letters of credit:
|
|
|
|
|
|
|
|
|
|
Letters of credit outstanding under the TRI senior secured
synthetic letter of credit facilities
|
|
$
|
—
|
|
|
$
|
9.5
|
|
|
Letters of credit outstanding under senior secured revolving
credit facilities of the Partnership
|
|
|
101.3
|
|
|
|
108.4
|
|
|
|
|
|
|
|
|
|
|
|
|
|
|
$
|
101.3
|
|
|
$
|
117.9
|
|
|
|
|
|
|
|
|
|
|
|
|
|
|
|
(1) |
|
Quarterly, we make an election to pay interest when due or
refinance the interest as part of our long-term debt. |
| |
|
(2) |
|
As of December 31, 2010, availability under TRI’s
senior secured revolving credit facility was $75.0 million. |
| |
|
(3) |
|
While we consolidate the debt of the Partnership in our
financial statements, we do not have the obligation to make
interest payments or debt payments with respect to the debt of
the Partnership. |
| |
|
(4) |
|
As of December 31, 2010, availability under the
Partnership’s senior secured revolving credit facility was
$233.4 million. |
F-16
The following table shows the range of interest rates paid and
weighted average interest rate paid on our variable-rate debt
obligations during the year ended December 31, 2010:
| |
|
|
|
|
|
|
|
|
|
|
|
Range of
|
|
Weighted
|
|
|
|
Interest Rates
|
|
Average Interest
|
|
|
|
Paid
|
|
Rate Paid
|
|
|
|
TRC Holdco loan facility
|
|
|
3.3
|
% to 5.4%
|
|
|
5.0
|
%
|
|
Senior secured term loan facility of TRI, due 2014
|
|
|
5.8
|
% to 6.0%
|
|
|
5.9
|
%
|
|
Senior secured revolving credit facility of the Partnership
|
|
|
1.2
|
% to 5.0%
|
|
|
2.3
|
%
|
Compliance
with Debt Covenants
As of December 31, 2010, both we and the Partnership were
in compliance with the covenants contained in our various debt
agreements.
TRC Holdco Loan
Facility
During the year ended December 31, 2010, we completed
transactions that have been recognized in our consolidated
financial statements as a debt extinguishment, and recognized a
pretax gain of $36.8 million. The transactions, executed by
us, were payments of $269.3 million to acquire
$306.1 million of outstanding borrowings (including accrued
interest of $23.1 million) under our Holdco credit
agreement (“Holdco debt”) and write offs of associated
debt issue costs totaling $2.0 million. After this
transaction, we removed all of the debt covenants associated
with the TRC Holdco Loan Facility, as we have cumulatively
repurchased over 50% of the original principal of the Holdco
debt.
On November 3, 2010, we amended our Holdco agreement to
name our wholly-owned subsidiary, Targa Resources Inc.
(“TRI”), as guarantor to our obligations under the
credit agreement. The operations and assets of the Partnership
continue to be excluded as guarantors of the Holdco debt.
During the year ended December 31, 2009, we completed a
transaction that has been recognized in our consolidated
financial statements as a debt extinguishment, and recognized a
pretax gain of $24.5 million, net of debt issue costs of
$0.7 million. The transactions, executed by TRI, were
payments of $39.3 million to acquire $64.5 million of
outstanding borrowings (including accrued interest of
$6.0 million) under our Holdco debt. We wrote-off
$0.7 million of associated debt issuance costs.
Interest on borrowings are payable, at our option, either
(i) entirely in cash, (ii) entirely by increasing the
principal amount of the outstanding borrowings or (iii) 50%
cash and 50% by increasing the principal amount of the
outstanding borrowings.
Borrowings outstanding under the credit facility bear interest
at a rate equal to an applicable rate plus, at our option,
either (i) a base rate determined by reference to the
higher of (1) the prime rate of Credit Suisse or
(2) the federal funds rate plus 0.5% or (ii) LIBOR as
determined by reference to the costs of funds for dollar
deposits for the interest period relevant to such borrowing
adjusted for certain statutory reserves. At December 31,
2010, the applicable rate for borrowings under the credit
facility was 4% with respect to base rate borrowings and 5% with
respect to LIBOR borrowings.
Principal amounts outstanding under the credit facility are due
and payable in February 2015. We may prepay all of part of the
principal amount outstanding, at our option, at 101% of the
principal amount outstanding until August 9, 2011, then at
100% of the principal amount outstanding.
TRI Senior
Secured Credit Agreement
On January 5, 2010 TRI entered into a senior secured credit
agreement (the “credit agreement”) providing senior
secured financing of $600.0 million, consisting of:
|
|
|
| |
•
|
$500.0 million senior secured term loan facility; and
|
| |
| |
•
|
$100.0 million senior secured revolving credit facility
(the “credit facility”).
|
F-17
The entire amount of our credit facility is available for
letters of credit and includes a limited borrowing capacity for
borrowings on
same-day
notice referred to as swing line loans. Our available capacity
under this facility is currently $75 million. TRI is the
borrower under this facility.
Borrowings under the credit agreement bear interest at a rate
equal to an applicable margin, plus at our option, either
(a) a base rate determined by reference to the higher of
(1) the prime rate of Deutsche Bank, (2) the federal
funds rate plus 0.5%, and (3) solely in the case of term
loans, 3%, or (b) LIBOR as determined by reference to the
higher of (1) the British Bankers Association LIBOR Rate
and (2) solely in the case of term loans, 2%.
In addition to paying interest on outstanding principal under
the senior secured credit facilities, TRI is required to pay
other fees. TRI is required to pay a commitment fee equal to
0.5% of the current unutilized commitments. The commitment fee
rate may fluctuate based upon TRI’s leverage ratios. TRI is
also required to pay a fronting fee equal to 0.25% on
outstanding letters of credit.
The credit agreement requires TRI to prepay loans outstanding
under the senior secured term loan facility, subject to certain
exceptions, with:
|
|
|
| |
•
|
50% of our annual excess cash flow (which percentage will be
reduced to 25% if our total leverage ratio is no more than 3.00
to 1.00 and to 0% if our total leverage ratio is no more than
2.50 to 1.00);
|
| |
| |
•
|
up to 100% of the net cash proceeds of all non-ordinary course
asset sales, transfers or other dispositions of property,
subject to our consolidated leverage ratio; and
|
| |
| |
•
|
100% of the net cash proceeds of any incurrence of debt, other
than debt permitted under the credit agreement.
|
During the year ended December 31, 2010, our term loan
facility was paid in full, the available capacity of the
revolving credit facility was reduced to $75.0 million and
the full amount is available for borrowing as of
December 31, 2010.
All obligations under the credit agreement and certain secured
hedging arrangements are unconditionally guaranteed, subject to
certain exceptions, by each of TRI’s existing and future
domestic restricted subsidiaries, referred to, collectively, as
the guarantors. TRI has pledged the following assets, subject to
certain exceptions, as collateral:
|
|
|
| |
•
|
the capital stock and other equity interests held by TRI or any
guarantor; and
|
| |
| |
•
|
a security interest in, and mortgages on, TRI’s and its
guarantors’ tangible and intangible assets.
|
The credit agreement contains a number of covenants that, among
other things, restrict, subject to certain exceptions,
TRI’s ability to incur additional indebtedness (including
guarantees and hedging obligations); create liens on assets;
enter into sale and leaseback transactions; engage in mergers or
consolidations; sell assets; pay dividends and make
distributions or repurchase capital stock and other equity
interests; make investments, loans or advances; make capital
expenditures; repay, redeem or repurchase certain indebtedness;
make certain acquisitions; engage in certain transactions with
affiliates; amend certain debt and other material agreements;
change TRI’s lines of business; and impose certain
restrictions on restricted subsidiaries that are not guarantors,
including restrictions on the ability of such subsidiaries that
are not guarantors to pay dividends.
The credit agreement requires TRI to maintain certain specified
maximum total leverage ratios and certain specified minimum
interest coverage ratios. In each case we are required to comply
with certain limitations, including minimum cash consideration
requirements.
F-18
On January 5, 2010, concurrent with the execution of the
credit agreement, TRI borrowed $500.0 million on the term
loan facility net of a $5.0 million discount. There was no
initial funding on the revolving credit line. The proceeds from
the term loan were used to:
|
|
|
| |
•
|
complete the cash tender offer and consent solicitation for all
$250.0 million of TRI’s outstanding
81/2% senior
notes due 2013;
|
| |
| |
•
|
repay the outstanding balance of $62.2 million on
TRI’s existing senior secured term loan due 2012;
|
| |
| |
•
|
purchase $164.2 million in face value of the Holdco Notes
for $131.4 million ; and
|
| |
| |
•
|
fund working capital and pay fees and expenses under the credit
agreement.
|
During the year ended December 31, 2010, TRI incurred a
gain on early debt extinguishments of $12.5 million from
the write-off of debt issue costs related to the repayments of
TRI’s term loan, and the purchase of the Holdco Notes as
discussed above.
During 2009, TRI repaid substantially all of its senior secured
term loan facility and recognized a $14.8 million loss on
early debt extinguishment consisting of the write-off of debt
issue costs related to the facility.
During 2009, TRI also incurred a loss on debt repurchases of
$17.4 million comprising $10.9 million of premiums
paid and $6.5 million from the write-off of debt issue
costs related to the repurchase of TRI’s
81/2%
senior notes discussed above. The premiums paid were included as
a cash outflow from a financing activity in the Statement of
Cash Flows.
Senior Secured
Credit Facility of the Partnership
On July 19, 2010, the Partnership entered into an Amended
and Restated Credit Agreement that replaced the
Partnership’s existing variable rate Senior Secured Credit
Facility with a new variable rate Senior Secured Credit Facility
due July 2015. The amended and restated Senior Secured Credit
Facility increases available commitments to the Partnership to
$1.1 billion from $958.5 million and allows the
Partnership to request increases in commitments up to an
additional $300 million.
The Partnership incurred a charge of $0.8 million related
to a partial write-off of debt issue costs associated with this
amended and restated credit facility related to a change in
syndicate members. The remaining balance in debt issue costs of
$4.7 million is being amortized over the life of the
amended and restated credit facility.
The Partnership’s amended and restated credit facility
bears interest at LIBOR plus an applicable margin ranging from
2.25% to 3.5% dependent on the Partnership’s consolidated
funded indebtedness to consolidated adjusted EBITDA ratio. The
Partnership’s new credit facility is secured by
substantially all of the Partnership’s assets. As of
December 31, 2010, availability under the
Partnership’s Senior Secured Revolving Credit Facility was
$233.4 million, after giving effect to $101.3 million
in outstanding letters of credit.
The Partnership’s senior secured credit facility restricts
its ability to make distributions of available cash to
unitholders if a default or an event of default (as defined in
its senior secured credit agreement) has occurred and is
continuing. The senior secured credit facility requires the
Partnership to maintain a consolidated funded indebtedness to
consolidated adjusted EBITDA of less than or equal to 5.50 to
1.00. The Partnership’s senior secured credit facility also
requires it to maintain an interest coverage ratio (the ratio of
its consolidated EBITDA to its consolidated interest expense, as
defined in its senior secured credit agreement) of greater than
or equal to 2.25 to 1.00 determined as of the last day of each
quarter for the four-fiscal quarter period ending on the date of
determination, as well as upon the occurrence of certain events,
including the incurrence of additional permitted indebtedness.
F-19
Senior
Unsecured Notes of the Partnership
The Partnership has three issues of unsecured senior notes. On
June 18, 2008, the Partnership privately placed
$250 million in aggregate principal amount of
81/4% senior
notes due 2016 (the
“81/4% Notes”).
On July 6, 2009, the Partnership privately placed
$250 million in aggregate principal amount of
111/4% senior
notes due 2017 (the
“111/4% Notes”).
The
111/4% Notes
were issued at 94.973% of the face amount, resulting in gross
proceeds of $237.4 million. On August 13, 2010 the
Partnership privately placed $250 million in aggregate
principal amount of
77/8% senior
notes due 2018 (the
“77/8% Notes”).
These notes are unsecured senior obligations that rank pari
passu in right of payment with existing and future senior
indebtedness, including indebtedness under our credit facility.
They are senior in right of payment to any of our future
subordinated indebtedness and are unconditionally guaranteed by
the Partnership. These notes are effectively subordinated to all
secured indebtedness under our credit agreement, which is
secured by substantially all of our assets, to the extent of the
value of the collateral securing that indebtedness.
Interest on the
81/4% Notes
accrues at the rate of
81/4%
per annum and is payable semi-annually in arrears on January 1
and July 1. Interest on the
111/4% Notes
accrues at the rate of
111/4%
per annum and is payable semi-annually in arrears on January 15
and July 15. Interest on the
77/8% Notes
accrues at the rate of
77/8%
per annum and is payable semi-annually in arrears on April 15
and October 15, commencing on April 15, 2011.
The Partnership may redeem up to 35% of the aggregate principal
amount each of our series of notes, at any time prior to
July 1, 2011 for the
81/4% Notes
(July 15, 2012 for the
111/4% Notes,
and October 15, 2013 for the
77/8% Notes),
with the net cash proceeds of one or more equity offerings. The
Partnership must pay a redemption price of 108.25% of the
principal amount for the
81/4% Notes
(111.25% for the
111/4% Notes,
and 107.875% for the
77/8
Notes), plus accrued and unpaid interest and liquidated damages,
if any, to the redemption date provided that:
(1) at least 65% of the aggregate principal amount of each
of the notes (excluding notes held by us) remains outstanding
immediately after the occurrence of such redemption; and
(2) the redemption occurs within 90 days of the date
of the closing of such equity offering.
The Partnership may also redeem all or a part of each of the
series of notes, on or after July 1, 2012 for the
81/4% Notes
(July 15, 2013 for the
111/4% Notes,
October 15, 2014 for the
77/8
Notes) at the redemption prices set forth below (expressed as
percentages of principal amount) plus accrued and unpaid
interest and liquidated damages, if any, on the notes redeemed,
if redeemed during the twelve-month period beginning on July 1
for the
81/4% Notes
(July 15 for the
111/4% Notes,
October 15 for the
77/8% Notes)
of each year indicated below:
| |
|
|
|
|
|
|
|
|
|
|
|
|
|
|
|
|
|
81/4% Notes
|
|
111/4% Notes
|
|
77/8% Notes
|
|
Year
|
|
Redemption %
|
|
Year
|
|
Redemption %
|
|
Year
|
|
Redemption %
|
|
|
|
2012
|
|
|
104.125
|
%
|
|
2013
|
|
|
105.625
|
%
|
|
2014
|
|
|
103.938
|
%
|
|
2013
|
|
|
102.063
|
%
|
|
2014
|
|
|
102.813
|
%
|
|
2015
|
|
|
101.969
|
%
|
|
2014 and thereafter
|
|
|
100.000
|
%
|
|
2015 and thereafter
|
|
|
100.000
|
%
|
|
2016 and thereafter
|
|
|
100.000
|
%
|
During 2008, the Partnership repurchased $40.9 million face
value of our outstanding
81/4% Notes
in open market transactions at an aggregate purchase price of
$28.3 million, including $1.5 million of accrued
interest. The Partnership recognized a gain on the debt
repurchases of $13.1 million associated with the purchased
notes. The repurchased
81/4% Notes
were retired and are not eligible for re-issue at a later date.
During 2009, the Partnership repurchased $18.7 million face
value ($17.8 million carrying value) of the outstanding
111/4% Notes
in open market transactions at an aggregated purchase price of
$18.9 million plus accrued interest of $0.3 million.
The Partnership recognized a loss on the debt repurchases of
F-20
$1.5 million, including $0.4 million in debt issue
costs associated with the repurchased notes. The repurchased
111/4% Notes
were retired and are not eligible for re-issue at a later date.
Subsequent Events. On February 2, 2011,
the Partnership closed on a private placement of
$325 million in aggregate principal amount of
67/8% Senior
Notes due 2021 (“the
67/8% Notes”)
resulting in net proceeds of $319.3 million.
On February 4, 2011 the Partnership exchanged
$158.6 million under an exchange offer to holders of its
111/4% Notes
due 2017 for $158.6 million principal amount
67/8% Notes
due 2021. In conjunction with the exchange the Partnership paid
a premium in cash of $28.6 million. The debt covenants
related to the remaining $72.7 million of face value
111/4% Notes
due 2017 were removed as the Partnership received sufficient
consents in connection with the exchange offer to amend the
indenture.
Note 10—Convertible
Participating Preferred Stock
The holders of the Series B stock accrued dividends at an
annual rate of 6% of the accreted value of the stock (purchase
price plus unpaid dividends, compounded quarterly) until
December 10, 2010, at which time we completed our IPO and
all of our Series B stock converted to common stock based
(a) a conversion ratio of one share of our Series B
stock to 4.92 shares of our Common Stock plus (b) the
accreted value per share of the Series B stock divided by
the IPO price after deducting underwriter discounts and
commissions.
Cash dividends on the Series B stock were payable when
declared by our Board of Directors, subject to restrictions
under our debt agreements. During the year ended 2010, we paid
dividends of $238 million to the Series B preferred
shareholders and an additional $177.8 million to common
equivalent shareholders. The common equivalent shareholders are
the holders of the Series B stock that participate ratably
in such common dividend in proportion to the number of shares of
common stock that were issuable upon the conversion of the
shares of Series B stock.
Note 11—Partnership
Units and Related Matters
On January 19, 2010, the Partnership completed a public
offering of 5,500,000 common units representing limited partner
interests in the Partnership (“common units”) under
its existing shelf registration statement on
Form S-3
(“Registration Statement”) at a price of $23.14 per
common unit ($22.17 per common unit, net of underwriting
discounts), providing net proceeds of $121.9 million.
Pursuant to the exercise of the underwriters’ overallotment
option, the Partnership sold an additional 825,000 common units,
providing net proceeds of $18.3 million. In addition, we
contributed $3.0 million for 129,082 general partner units
to maintain our 2% general partner interest. The Partnership
used the net proceeds from the offering for general partnership
purposes, which included reducing borrowings under its senior
secured credit facility.
On April 14, 2010, Targa LP Inc., a wholly-owned subsidiary
of ours, closed on a secondary public offering of 8,500,000
common units of the Partnership at $27.50 per common unit.
Proceeds from this offering, after underwriting discounts and
commission were $224.4 million before expenses associated
with the offering. This offering also triggered a mandatory
prepayment on our senior secured credit agreement of
$3.2 million related to TRI’s senior secured revolving
credit facility and $105.6 million on TRI’s senior
secured term loan facility.
On April 27, 2010, we completed the sale of our interests
in the Permian Business and Straddle Assets to the Partnership
for $420.0 million, effective April 1, 2010. This sale
triggered a mandatory prepayment on TRI’s senior secured
credit agreement of $152.5 million, which was paid on
April 27, 2010. As part of the closing of the sale of our
Permian Business and Straddle Assets, we amended our Omnibus
Agreement with the Partnership, to continue to provide general
and administrative and other services to the Partnership through
April 2013.
On August 13, 2010, the Partnership completed an offering
of 6,500,000 of its common units under the Registration
Statement at a price of $24.80 per common unit ($23.82 per
common unit, net of underwriting discounts) providing net
proceeds to the Partnership of approximately
$154.8 million.
F-21
Pursuant to the exercise of the underwriters’ overallotment
option, the Partnership sold an additional 975,000 common units,
providing net proceeds of approximately $23.2 million. In
addition, we contributed $3.8 million for 152,551 general
partner units to maintain a 2% general partner interest. The
Partnership used the net proceeds from this offering to reduce
borrowings under its senior secured credit facility.
On August 25, 2010, we completed the sale to the
Partnership of our 63% equity interest in Versado, effective
August 1, 2010, for $247.2 million in the form of
$244.7 million in cash and $2.5 million in partnership
interests represented by 89,813 common units and 1,833 general
partner units. The sale triggered a mandatory prepayment of
$91.3 million under TRI’s senior secured credit
facility. Under the terms of the Versado Purchase and Sale
Agreement, Targa will reimburse the Partnership for future
maintenance capital expenditures required pursuant to our New
Mexico Environmental Department settlement agreement, of which
our share is currently estimated at $19.0 million, to be
incurred through 2011.
On September 28, 2010, we completed the sale to the
Partnership of our Venice Operations, which includes
Targa’s 76.8% interest in Venice Energy Services Company,
L.L.C. (“VESCO”), for aggregate consideration of
$175.6 million, effective September 1, 2010. The sale
triggered a mandatory prepayment of $73.5 million under
TRI’s senior secured credit facility.
The net impact of our sale of assets to the Partnership resulted
in an increase to additional paid-in capital of
$243 million and a corresponding reduction of the
non-controlling interest in these assets.
The following table lists the Partnership’s distributions
declared and paid in the years ended December 31, 2010 and
2009:
| |
|
|
|
|
|
|
|
|
|
|
|
|
|
|
|
|
|
|
|
|
|
|
|
|
|
|
|
|
|
|
|
Distributions Paid
|
|
Distributions
|
|
|
|
For the Three
|
|
Limited Partners
|
|
General Partner
|
|
|
|
per Limited
|
|
Date Paid
|
|
Months Ended
|
|
Common
|
|
Subordinated
|
|
Incentive
|
|
2%
|
|
Total
|
|
Partner Unit
|
|
|
|
|
|
(In millions, except per unit amounts)
|
|
|
|
2010
|
|
|
|
|
|
|
|
|
|
|
|
|
|
|
|
|
|
|
|
|
|
|
|
|
|
|
|
November 12, 2010
|
|
September 30, 2010
|
|
$
|
40.6
|
|
|
$
|
—
|
|
|
$
|
4.6
|
|
|
$
|
0.9
|
|
|
$
|
46.1
|
|
|
$
|
0.5375
|
|
|
August 13, 2010
|
|
June 30, 2010
|
|
|
35.9
|
|
|
|
—
|
|
|
|
3.5
|
|
|
|
0.8
|
|
|
|
40.2
|
|
|
|
0.5275
|
|
|
May 14, 2010
|
|
March 31, 2010
|
|
|
35.2
|
|
|
|
—
|
|
|
|
2.8
|
|
|
|
0.8
|
|
|
|
38.8
|
|
|
|
0.5175
|
|
|
February 12, 2010
|
|
December 31, 2009
|
|
|
35.2
|
|
|
|
—
|
|
|
|
2.8
|
|
|
|
0.8
|
|
|
|
38.8
|
|
|
|
0.5175
|
|
|
|
|
|
|
|
|
|
|
|
|
|
|
|
|
|
|
|
|
|
|
|
|
|
|
|
|
|
|
2009
|
|
|
|
|
|
|
|
|
|
|
|
|
|
|
|
|
|
|
|
|
|
|
|
|
|
|
|
November 14, 2009
|
|
September 30, 2009
|
|
$
|
31.9
|
|
|
$
|
—
|
|
|
$
|
2.6
|
|
|
$
|
0.7
|
|
|
$
|
35.2
|
|
|
$
|
0.5175
|
|
|
August 14, 2009
|
|
June 30, 2009
|
|
|
23.9
|
|
|
|
—
|
|
|
|
2.0
|
|
|
|
0.5
|
|
|
|
26.4
|
|
|
|
0.5175
|
|
|
May 15, 2009
|
|
March 31, 2009
|
|
|
18.0
|
|
|
|
5.9
|
|
|
|
1.9
|
|
|
|
0.5
|
|
|
|
26.3
|
|
|
|
0.5175
|
|
|
February 13, 2009
|
|
December 31, 2008
|
|
|
18.0
|
|
|
|
6.0
|
|
|
|
1.9
|
|
|
|
0.5
|
|
|
|
26.4
|
|
|
|
0.5175
|
|
As part of our sale of the Downstream Business to the
Partnership in 2009, we agreed to provide distribution support
to the Partnership through the fourth quarter of 2011, in the
form of a reduction in the reimbursement for general and
administrative expense that we allocate to the Partnership if
necessary for a 1.0 times distribution coverage, at a
distribution level of the Partnership’s at the time of the
sale of the Downstream Business of $0.5175 per limited partner
unit, subject to a maximum support of $8.0 million in any
quarter. No distribution support has been necessary through the
fourth quarter of 2010.
Subsequent Events. On January 24, 2011,
the Partnership completed a public offering of 8,000,000 common
units representing limited partner interests in the Partnership
(“common units”) under an existing shelf registration
statement on
Form S-3
at a price of $33.67 per common unit ($32.41 per common unit,
net of underwriting discounts), providing net proceeds of
$259.3 million. Pursuant to the exercise of the
underwriters’ overallotment option, the Partnership sold an
additional 1,200,000 common units, providing net proceeds of
$38.9 million. In addition, we contributed
$6.3 million for 187,755 general partner units to maintain
our 2% interest in the Partnership.
F-22
On February 14, 2011, the Partnership paid a cash
distribution of $0.5475 per common unit on our outstanding
common units. The total distribution paid was
$53.5 million, with $40.0 million paid to the
Partnership’s non-affiliated common unitholders and
$6.4 million, $1.1 million and $6.0 million paid
to us for our common unit ownership, general partner interest
and incentive distribution rights.
Note 12—Earnings
per Share
Basic earnings per share are computed using the weighted average
number of common shares outstanding during the period. Diluted
earnings per share are computed using the weighted average
shares outstanding during the period, but also include the
dilutive effect of restricted stock awards and stock options.
Diluted EPS also includes the assumed conversion of the
Series B Convertible Participating Preferred Stock for
periods prior to December 10, 2010.
Prior to the conversion of the Series B Preferred Stock to
common stock on December 10, 2010, net income after the
impact of preferred dividends was allocated according to the
preferred stock agreement. The terms of the preferred stock
agreement stipulated that common shareholders are not entitled
to any dividends, unless approved with written consent of a
majority of the outstanding preferred stockholders, until the
preferred holders recapture the carrying value of their
preferred securities which includes accreted dividends. For 2008
and 2009, there was no net income available to common
shareholders as the preferred shareholders are entitled to all
undistributed earnings. As such, there were no earnings per
share to our common shareholders during 2008 and 2009. For 2010,
there was no allocation to preferred shareholders as the Company
was in a loss position and the preferred shareholders do not
participate in losses under the terms of the preferred stock
agreement.
For each of the periods presented below, all of the potentially
dilutive securities were excluded from the calculation of
diluted EPS as they were anti-dilutive.
The following table reflects the weighted average of outstanding
securities that were excluded from the diluted calculation of
net income (loss) available to common shareholders as the effect
of including such securities would have been anti-dilutive (in
thousands).
| |
|
|
|
|
|
|
|
|
|
|
|
|
|
|
|
Years Ended December 31,
|
|
|
|
2010
|
|
2009
|
|
2008
|
|
|
|
(In thousands)
|
|
|
|
Restricted Stock—2010 Stock Incentive
Plan(1)
|
|
|
1,350.0
|
|
|
|
—
|
|
|
|
—
|
|
|
Restricted Stock—2005 Incentive Compensation
Plan(2)
|
|
|
10.6
|
|
|
|
488.9
|
|
|
|
1,518.6
|
|
|
Stock Options—2005 Incentive Compensation
Plan(3)
|
|
|
1,470.0
|
|
|
|
2,313.1
|
|
|
|
2,341.5
|
|
|
Conversion of Series B Preferred
Stock(4)
|
|
|
33,322.5
|
|
|
|
31,515.3
|
|
|
|
31,515.3
|
|
|
|
|
|
(1) |
|
In connection with the IPO in December 2010, the Company issued
1,350,000 shares of restricted stock under the 2010 Stock
Incentive Plan to employees. At December 31, 2010, all of
these shares were unvested. |
| |
|
(2) |
|
Amounts represent the weighted average number of unvested shares
outstanding for each year. |
| |
|
(3) |
|
Amounts represent the weighted average number of unexercised
stock options outstanding for each year. Prior to the closing of
the IPO in December 2010, all outstanding options were either
exercised or cashed out. As of December 31, 2010, there are
no outstanding stock options. |
| |
|
(4) |
|
Amounts in 2009 and 2008 represent the assumed conversion of the
Series B Preferred Stock into common shares as of January 1
for each year. During 2010, in connection with the closing of
the IPO, 6,409,697 shares of Series B Convertible
Participating Preferred Stock, plus accreted value, were
converted into 35,356,698 shares of common stock. Beginning
on December 10, 2010, these shares are included in the
calculation of weighted average shares outstanding—basic
and diluted. The amount included in the table above for 2010
represents the weighted average shares for the period from
January 1, 2010 through December 9, 2010 (based on the
actual number of shares converted on December 10, 2010). |
F-23
Subsequent event. On February 21, 2011,
we paid a cash dividend of $0.0616 per share of our outstanding
common stock. The total dividend paid was $2.6 million.
This dividend was pro-rated to give effect to a partial quarter
following our IPO.
Note 13—Insurance
Claims
Hurricanes
Katrina and Rita
Hurricanes Katrina and Rita affected certain Gulf Coast
facilities in 2005. The final purchase price allocation of our
acquisition from Dynegy in October 2005 included an
$81.1 million receivable for insurance claims related to
property damage caused by Hurricanes Katrina and Rita. The
insurance claim process was completed with respect to Hurricanes
Katrina and Rita for property damage and business interruption
insurance, which resulted in an $18.5 million gain recorded
in 2008. This amount was reported in the other income line in
the other income (expense) section of our Consolidated Statement
of Operations.
Hurricanes Gustav
and Ike
Certain Louisiana and Texas facilities sustained damage and had
disruption to their operations during the 2008 hurricane season
from two Gulf Coast hurricanes—Gustav and Ike. As of
December 31, 2008, we recorded a $19.3 million loss
provision (net of estimated insurance reimbursements) related to
the hurricanes. During 2010 and 2009, the estimate was reduced
by $3.3 million and $3.7 million to give effect to
higher insurance recoveries and lower out of pocket costs. These
amounts were reported in the Other line in the costs and
expenses section of our Consolidated Statements of Operations.
During the year ended December 31, 2010, expenditures
related to the hurricanes were $0.3 million. During the
year ended December 31, 2009, expenditures related to the
hurricanes included $35.9 million for repairs and
$7.6 million capitalized as improvements.
Total business interruption proceeds related to Hurricanes
Gustav and Ike recorded as revenues during 2010 and 2009 were
$5.5 million and $19.5 million, respectively. No
hurricane-related business interruption proceeds were received
during 2008. We were entitled to receive all post dropdown
insurance proceeds under the terms of the Purchase and Sale
Agreements with the Partnership. These amounts were reported in
the revenues line on our Consolidated Statements of Operations.
Note 14—Derivative
Instruments and Hedging Activities
Commodity
Hedges
In an effort to reduce the variability of cash flows, the
Partnership has hedged the commodity price associated with a
portion of our expected natural gas, NGL and condensate equity
volumes through 2014 by entering into derivative financial
instruments including swaps and purchased puts (floors).
The hedges generally match the NGL product composition and the
NGL and natural gas delivery points to those of our physical
equity volumes. The NGL hedges cover baskets of ethane, propane,
normal butane, iso-butane and natural gasoline based upon our
expected equity NGL composition, as well as specific NGL hedges
of ethane and propane. This strategy avoids uncorrelated risks
resulting from employing hedges on crude oil or other petroleum
products as “proxy” hedges of NGL prices.
Additionally, the NGL hedges are based on published index prices
for delivery at Mont Belvieu and the natural gas hedges are
based on published index prices for delivery at Mid-Continent,
WAHA and Permian Basin (El Paso), which closely approximate
our actual NGL and natural gas delivery points.
The Partnership hedges a portion of its condensate sales using
crude oil hedges that are based on the NYMEX futures contracts
for West Texas Intermediate light, sweet crude, which
approximates the prices received for condensate. This
necessarily exposes the Partnership to a market differential
risk if the NYMEX futures do not move in exact parity with the
sales price of our underlying West Texas condensate equity
volumes.
Hedge ineffectiveness has been immaterial for all periods.
F-24
At December 31, 2010, the notional volumes of our commodity
hedges were:
| |
|
|
|
|
|
|
|
|
|
|
|
|
|
|
|
|
|
|
|
|
|
|
|
|
|
Commodity
|
|
Instrument
|
|
Unit
|
|
2011
|
|
2012
|
|
2013
|
|
2014
|
|
|
|
Natural Gas
|
|
|
Swaps
|
|
|
|
MMBtu/d
|
|
|
|
30,100
|
|
|
|
23,100
|
|
|
|
8,000
|
|
|
|
—
|
|
|
NGL
|
|
|
Swaps
|
|
|
|
Bbl/d
|
|
|
|
8,550
|
|
|
|
6,700
|
|
|
|
3,400
|
|
|
|
—
|
|
|
NGL
|
|
|
Floors
|
|
|
|
Bbl/d
|
|
|
|
253
|
|
|
|
294
|
|
|
|
—
|
|
|
|
—
|
|
|
Condensate
|
|
|
Swaps
|
|
|
|
Bbl/d
|
|
|
|
1,100
|
|
|
|
950
|
|
|
|
800
|
|
|
|
700
|
|
Interest Rate
Swaps
As of December 31, 2010, the Partnership had
$765.3 million outstanding under its credit facility, with
interest accruing at a base rate plus an applicable margin. In
order to mitigate the risk of changes in cash flows attributable
to changes in market interest rates the Partnership has entered
into interest rate swaps and interest rate basis swaps that
effectively fix the base rate on $300 million in borrowings
as shown below:
| |
|
|
|
|
|
|
|
|
|
|
|
|
|
|
|
|
|
|
|
|
|
Notional
|
|
Fair
|
|
|
|
|
|
|
|
Amount
|
|
Value
|
|
|
|
|
|
|
|
Notional
|
|
Fair
|
|
|
|
Period
|
|
Fixed Rate
|
|
Amount
|
|
Value
|
|
|
|
|
|
($ in millions)
|
|
|
|
2011
|
|
|
3.52
|
%
|
|
$
|
300
|
|
|
$
|
(7.8
|
)
|
|
|
|
|
|
2012
|
|
|
3.40
|
%
|
|
|
300
|
|
|
|
(7.5
|
)
|
|
|
|
|
|
2013
|
|
|
3.39
|
%
|
|
|
300
|
|
|
|
(4.0
|
)
|
|
|
|
|
|
2014
|
|
|
3.39
|
%
|
|
|
300
|
|
|
|
(0.8
|
)
|
|
|
|
|
|
|
|
|
|
|
|
|
|
|
|
|
|
|
|
|
|
|
|
|
|
|
|
|
|
|
|
|
|
$
|
(20.1
|
)
|
|
|
|
|
|
|
|
|
|
|
|
|
|
|
|
|
|
|
|
|
|
|
All interest rate swaps and interest rate basis swaps have been
designated as cash flow hedges of variable rate interest
payments on borrowings under the Partnership’s credit
facility.
The following schedules reflect the fair values of derivative
instruments in our financial statements:
| |
|
|
|
|
|
|
|
|
|
|
|
|
|
|
|
|
|
|
|
|
|
|
|
Asset Derivatives
|
|
|
Liability Derivatives
|
|
|
|
|
Balance
|
|
Fair Value as of
|
|
|
Balance
|
|
Fair Value as of
|
|
|
|
|
Sheet
|
|
December 31,
|
|
|
Sheet
|
|
December 31,
|
|
|
|
|
Location
|
|
2010
|
|
|
2009
|
|
|
Location
|
|
2010
|
|
|
2009
|
|
|
|
|
Derivatives designated as hedging instruments
|
|
|
|
|
|
|
|
|
|
|
|
|
|
|
|
|
|
|
|
Commodity contracts
|
|
Current assets
|
|
$
|
24.8
|
|
|
$
|
31.6
|
|
|
Current liabilities
|
|
$
|
25.5
|
|
|
$
|
20.7
|
|
|
|
|
Long-term assets
|
|
|
18.9
|
|
|
|
11.7
|
|
|
Long-term liabilities
|
|
|
20.5
|
|
|
|
39.1
|
|
|
Interest rate contracts
|
|
Current assets
|
|
|
—
|
|
|
|
0.2
|
|
|
Current liabilities
|
|
|
7.8
|
|
|
|
8.0
|
|
|
|
|
|
|
|
|
|
|
|
|
|
|
Long-term
|
|
|
|
|
|
|
|
|
|
|
|
Long-term assets
|
|
|
—
|
|
|
|
1.9
|
|
|
liabilities
|
|
|
12.3
|
|
|
|
4.7
|
|
|
|
|
|
|
|
|
|
|
|
|
|
|
|
|
|
|
|
|
|
|
|
|
Total derivatives designated as hedging instruments
|
|
|
|
$
|
43.7
|
|
|
$
|
45.4
|
|
|
|
|
$
|
66.1
|
|
|
$
|
72.5
|
|
|
|
|
|
|
|
|
|
|
|
|
|
|
|
|
|
|
|
|
|
|
|
|
Derivatives not designated as hedging instruments
|
|
|
|
|
|
|
|
|
|
|
|
|
|
|
|
|
|
|
|
|
|
Commodity contracts
|
|
Current assets
|
|
$
|
0.4
|
|
|
$
|
1.1
|
|
|
Current liabilities
|
|
$
|
0.9
|
|
|
$
|
0.5
|
|
|
|
|
Long-term assets
|
|
|
—
|
|
|
|
0.2
|
|
|
Long-term liabilities
|
|
|
—
|
|
|
|
—
|
|
|
|
|
|
|
|
|
|
|
|
|
|
|
|
|
|
|
|
|
|
|
|
|
Total derivatives not designated as hedging instruments
|
|
|
|
$
|
0.4
|
|
|
$
|
1.3
|
|
|
|
|
$
|
0.9
|
|
|
$
|
0.5
|
|
|
|
|
|
|
|
|
|
|
|
|
|
|
|
|
|
|
|
|
|
|
|
|
Total derivatives
|
|
|
|
$
|
44.1
|
|
|
$
|
46.7
|
|
|
|
|
$
|
67.0
|
|
|
$
|
73.0
|
|
|
|
|
|
|
|
|
|
|
|
|
|
|
|
|
|
|
|
|
|
|
|
The fair value of derivative instruments, depending on the type
of instrument, was determined by the use of present value
methods or standard option valuation models with assumptions
about commodity prices based on those observed in underlying
markets.
F-25
The following tables reflect amounts recorded in OCI and amounts
reclassified from OCI to revenue and expense:
| |
|
|
|
|
|
|
|
|
|
|
|
|
|
|
|
Gain (Loss)
|
|
|
|
|
Recognized in OCI on
|
|
|
|
|
Derivatives (Effective Portion)
|
|
|
|
|
Year Ended December 31,
|
|
|
Derivatives in Cash Flow Hedging Relationships
|
|
2010
|
|
|
2009
|
|
|
2008
|
|
|
|
|
Interest rate contracts
|
|
$
|
(20.1
|
)
|
|
$
|
(7.3
|
)
|
|
$
|
(19.0
|
)
|
|
Commodity contracts
|
|
|
52.5
|
|
|
|
(104.3
|
)
|
|
|
206.4
|
|
|
|
|
|
|
|
|
|
|
|
|
|
|
|
|
|
|
$
|
32.4
|
|
|
$
|
(111.6
|
)
|
|
$
|
187.4
|
|
|
|
|
|
|
|
|
|
|
|
|
|
|
|
| |
|
|
|
|
|
|
|
|
|
|
|
|
|
|
|
Gain (Loss)
|
|
|
|
|
Reclassified from OCI into
|
|
|
|
|
Income (Effective Portion)
|
|
|
|
|
Year Ended December 31,
|
|
|
Location of Gain (Loss) Reclassified from OCI into Income
|
|
2010
|
|
|
2009
|
|
|
2008
|
|
|
|
|
Interest expense, net
|
|
$
|
(9.3
|
)
|
|
$
|
(15.7
|
)
|
|
$
|
(2.7
|
)
|
|
Revenues
|
|
|
8.4
|
|
|
|
69.7
|
|
|
|
(65.1
|
)
|
|
|
|
|
|
|
|
|
|
|
|
|
|
|
|
|
|
$
|
(0.9
|
)
|
|
$
|
54.0
|
|
|
$
|
(67.8
|
)
|
|
|
|
|
|
|
|
|
|
|
|
|
|
|
Our earnings are also affected by the use of the
mark-to-market
method of accounting for our derivative financial instruments
that do not qualify for hedge accounting or that have not been
designated as hedges. The changes in fair value of these
instruments are recorded on the balance sheets and through
earnings (i.e., using the
“mark-to-market”
method) rather than being deferred until the anticipated
transaction affects earnings. The use of
mark-to-market
accounting for financial instruments can cause non-cash earnings
volatility due to changes in the underlying commodity price
indices. During 2010, 2009 and 2008, we recorded the following
mark-to-market
gains (losses):
| |
|
|
|
|
|
|
|
|
|
|
|
|
|
|
|
|
|
|
|
Amount of Gain (Loss) Recognized
|
|
|
|
|
|
in Income on Derivatives
|
|
|
|
Location of Gain (Loss)
|
|
Year Ended
|
|
|
|
Recognized in Income
|
|
December 31,
|
|
Derivatives Not Designated as Hedging Instruments
|
|
on Derivatives
|
|
2010
|
|
2009
|
|
2008
|
|
|
|
Commodity contracts
|
|
Other income (expense)
|
|
$
|
(0.4
|
)
|
|
$
|
0.3
|
|
|
$
|
(1.3
|
)
|
The following table shows the unrealized gains (losses) included
in OCI:
| |
|
|
|
|
|
|
|
|
|
|
|
|
|
|
|
Year Ended December 31,
|
|
|
|
2010
|
|
2009
|
|
2008
|
|
|
|
Unrealized gain (loss) on commodity hedges, before tax
|
|
$
|
4.5
|
|
|
$
|
(29.4
|
)
|
|
$
|
59.6
|
|
|
Unrealized gain (loss) on commodity hedges, net of tax
|
|
|
2.7
|
|
|
|
(18.3
|
)
|
|
|
39.3
|
|
|
Unrealized gain (loss) on interest rate swaps, before tax
|
|
|
(3.4
|
)
|
|
|
(3.1
|
)
|
|
|
(4.7
|
)
|
|
Unrealized gain (loss) on interest rate swaps, net of tax
|
|
|
(2.1
|
)
|
|
|
(1.9
|
)
|
|
|
(3.1
|
)
|
As of December 31, 2010, deferred net losses of
$3.9 million on commodity hedges and $7.5 million on
interest rate swaps recorded in OCI are expected to be
reclassified to revenue and interest expense, respectively,
during the next twelve months.
In July 2008, we paid $87.4 million to terminate certain
out-of-the-money
natural gas and NGL commodity swaps. Prior to the terminations,
these swaps were designated as hedges. During the years ended
December 31, 2010, 2009 and 2008 deferred net losses of
$29.6 million, $40.0 million and $20.8 million
were reclassified from OCI as a non-cash reduction of revenue.
In May 2008 we entered into certain NGL derivative contracts
with Lehman Brothers Commodity Services, Inc., a subsidiary of
Lehman Brothers Holdings Inc. (“Lehman”). Due to
Lehman’s bankruptcy
F-26
filing, it is unlikely that we will receive full or partial
payment of any amounts that may become owed to us under these
contracts. Accordingly, we discontinued hedge accounting
treatment for these contracts in July 2008. Deferred losses of
$0.2 million and $0.3 million will be reclassified to
revenues during 2011 and 2012 when the forecasted transactions
related to these contracts are expected to occur. During 2008,
we recognized a non-cash
mark-to-market
loss on derivatives of $1.3 million to adjust the fair
value of the Lehman derivative contracts to zero. In October
2008, we terminated the Lehman derivative contracts.
See Note 15, Note 17 and Note 23 for additional
disclosures related to derivative instruments and hedging
activity.
|
|
|
Note 15—
|
Related
Party Transactions
|
Relationship
with Warburg Pincus LLC
Chansoo Joung and Peter Kagan, two of our directors, are
Managing Directors of Warburg Pincus LLC and are also directors
of Broad Oak Energy, Inc. (“Broad Oak”) from whom we
buy natural gas and NGL products. Affiliates of Warburg Pincus
LLC own a controlling interest in Broad Oak. During 2010, 2009
and 2008, we purchased $41.5 million, $9.7 million and
$4.8 million of product from Broad Oak.
Peter Kagan is also a director of Antero Resources Corporation
(“Antero”) from whom we buy natural gas and NGL
products. Affiliates of Warburg Pincus LLC own a controlling
interest in Antero. We purchased $0.1 million,
$0.5 million, and $64.4 million of product from Antero
during the year ended December 31, 2010, 2009, and 2008.
These transactions were at market prices consistent with similar
transactions with other nonaffiliated entities.
Relationships
with Bank of America (“BofA”)
Equity. Prior to December 10, 2010, BofA
was considered a beneficial owner of more than 5% of our common
stock. Upon our initial public offering, BofA was reduced its
ownership below 5%.
Financial Services. An affiliate of BofA is a
lender and an agent under the Partnership’s senior credit
facility with commitments of $72 million. BofA and its
affiliates have engaged, and may in the future engage, in other
commercial and investment banking transactions with us or the
Partnership in the ordinary course of their business. They have
received, and expect to receive, customary compensation and
expense reimbursement for these commercial and investment
banking transactions.
Commodity Hedges. The Partnership has
previously entered into various commodity derivative
transactions with BofA. As of December 31, 2010, the
Partnership has no open positions with BofA. During 2010, 2009
and 2008, the Partnership received from (paid to) BofA
$1.9 million, $24.2 million and ($30.5) million
in commodity derivative settlements.
Commercial Relationships. The
Partnership’s product sales and product purchases with BofA
were:
| |
|
|
|
|
|
|
|
|
|
|
|
|
|
|
|
Year Ended
|
|
|
|
December 31,
|
|
|
|
2010
|
|
2009
|
|
2008
|
|
|
|
Included in revenues
|
|
$
|
26.0
|
|
|
$
|
36.7
|
|
|
$
|
97.0
|
|
|
Included in costs and expenses
|
|
|
3.7
|
|
|
|
1.0
|
|
|
|
5.1
|
|
F-27
Relationships
with Sequent Energy Management, EOG Resources Inc., and
Intercontinental Exchange, Inc.
Charles Crisp, one our directors, is also a director of AGL
Resources Inc. (“AGL”), EOG Resources Inc.
(“EOG”) and Intercontinental Exchange Inc.
(“Intercontinental”). Sequent Energy Management
(“Sequent”) is a subsidiary of AGL. The following
schedule shows the transactions with each of these related
parties.
| |
|
|
|
|
|
|
|
|
|
|
|
|
|
|
|
|
|
|
|
|
|
|
|
|
|
Sales
|
|
Purchases
|
|
|
|
Year Ended, December 31,
|
|
Year Ended, December 31,
|
|
|
|
2010
|
|
2009
|
|
2008
|
|
2010
|
|
2009
|
|
2008
|
|
|
|
Sequent
|
|
$
|
14.3
|
|
|
$
|
11.7
|
|
|
$—
|
|
$
|
27.4
|
|
|
$
|
5.0
|
|
|
$
|
—
|
|
|
EOG
|
|
|
(1
|
)
|
|
|
(1
|
)
|
|
—
|
|
|
10.0
|
|
|
|
5.6
|
|
|
|
13.1
|
|
|
Intercontinental
|
|
|
—
|
|
|
|
—
|
|
|
—
|
|
|
0.2
|
|
|
|
0.2
|
|
|
|
0.2
|
|
|
|
|
|
(1) |
|
Less than $0.1 million |
These transactions were at market prices consistent with similar
transactions with other nonaffiliated entities.
Transactions
with Unconsolidated Affiliates
For the years indicated, our natural gas and NGL sales and
purchases with our unconsolidated affiliates were:
| |
|
|
|
|
|
|
|
|
|
|
|
|
|
|
|
December 31,
|
|
|
|
|
2010
|
|
|
2009
|
|
|
2008
|
|
|
|
|
Included in revenues
|
|
|
|
|
|
|
|
|
|
|
|
|
|
GCF
|
|
$
|
0.3
|
|
|
$
|
0.2
|
|
|
$
|
0.5
|
|
|
VESCO(1)
|
|
|
—
|
|
|
|
—
|
|
|
|
0.7
|
|
|
|
|
|
|
|
|
|
|
|
|
|
|
|
|
|
|
$
|
0.3
|
|
|
$
|
0.2
|
|
|
$
|
1.2
|
|
|
|
|
|
|
|
|
|
|
|
|
|
|
|
|
Included in costs and expenses
|
|
|
|
|
|
|
|
|
|
|
|
|
|
GCF
|
|
$
|
1.1
|
|
|
$
|
1.4
|
|
|
$
|
3.5
|
|
|
VESCO(1)
|
|
|
—
|
|
|
|
—
|
|
|
|
178.1
|
|
|
|
|
|
|
|
|
|
|
|
|
|
|
|
|
|
|
$
|
1.1
|
|
|
$
|
1.4
|
|
|
$
|
181.6
|
|
|
|
|
|
|
|
|
|
|
|
|
|
|
|
|
|
|
|
(1) |
|
For 2008, our commercial transactions with VESCO are reflected
through July 31, 2008. As a result of acquiring an
additional ownership in VESCO, and we have consolidated the
operations of VESCO in our financial results from August 1,
2008. |
|
|
|
Note 16—
|
Commitments
and Contingencies
|
Certain property and equipment is leased under non-cancelable
leases that require fixed monthly rental payments and expire at
various dates through 2099. Transportation contracts require us
to make payments for capacity and expire at various dates
through 2013. Surface and underground access for gathering,
processing, and distribution assets that are located on property
not owned by us is obtained through
right-of-way
agreements, which require annual rental payments and expire at
various dates
F-28
through 2099. Future non-cancelable commitments related to
certain contractual obligations are presented below:
| |
|
|
|
|
|
|
|
|
|
|
|
|
|
|
|
|
|
|
|
|
|
|
|
|
|
|
|
|
|
|
|
Payment Due by Period
|
|
|
|
|
Total
|
|
|
2011
|
|
|
2012
|
|
|
2013
|
|
|
2014
|
|
|
2015
|
|
|
Thereafter
|
|
|
|
|
Partnership:
|
|
|
|
|
|
|
|
|
|
|
|
|
|
|
|
|
|
|
|
|
|
|
|
|
|
|
|
|
|
Operating lease and service
contract(1)
|
|
$
|
36.7
|
|
|
$
|
10.6
|
|
|
$
|
8.4
|
|
|
$
|
3.8
|
|
|
$
|
2.7
|
|
|
$
|
2.6
|
|
|
$
|
8.6
|
|
|
Capacity and terminalling
payments(2)
|
|
|
12.9
|
|
|
|
6.6
|
|
|
|
4.7
|
|
|
|
1.6
|
|
|
|
—
|
|
|
|
—
|
|
|
|
—
|
|
|
Land site lease and
right-of-way(3)
|
|
|
20.4
|
|
|
|
1.3
|
|
|
|
1.2
|
|
|
|
1.2
|
|
|
|
1.1
|
|
|
|
1.0
|
|
|
|
14.6
|
|
|
TRC:
|
|
|
|
|
|
|
|
|
|
|
|
|
|
|
|
|
|
|
|
|
|
|
|
|
|
|
|
|
|
Operating
leases(4)
|
|
|
15.3
|
|
|
|
2.5
|
|
|
|
2.1
|
|
|
|
2.2
|
|
|
|
2.2
|
|
|
|
2.2
|
|
|
|
4.1
|
|
|
|
|
|
|
|
|
|
|
|
|
|
|
|
|
|
|
|
|
|
|
|
|
|
|
|
|
|
|
|
|
|
|
$
|
85.3
|
|
|
$
|
21.0
|
|
|
$
|
16.4
|
|
|
$
|
8.8
|
|
|
$
|
6.0
|
|
|
$
|
5.8
|
|
|
$
|
27.3
|
|
|
|
|
|
|
|
|
|
|
|
|
|
|
|
|
|
|
|
|
|
|
|
|
|
|
|
|
|
|
|
|
|
|
|
(1) |
|
Includes minimum lease payment obligations associated with gas
processing plant site leases, railcar leases, and office space
leases. |
| |
|
(2) |
|
Consists of capacity payments for firm transportation contracts. |
| |
|
(3) |
|
Provides for surface and underground access for gathering,
processing, and distribution assets that are located on property
not owned by us; agreements expire at various dates through 2099. |
| |
|
(4) |
|
Includes minimum lease payment obligations associated with
corporate operations. |
The following table shows the above mentioned expenses of the
Partnership:
| |
|
|
|
|
|
|
|
|
|
|
|
|
|
|
|
Year Ended December 31,
|
|
|
|
2010
|
|
2009
|
|
2008
|
|
|
|
Operating leases
|
|
$
|
13.5
|
|
|
$
|
13.7
|
|
|
$
|
14.7
|
|
|
Capacity payments
|
|
|
8.6
|
|
|
|
9.6
|
|
|
|
6.7
|
|
|
Land site lease and
right-of-way
|
|
|
2.8
|
|
|
|
2.3
|
|
|
|
4.0
|
|
Environmental
For environmental matters, we record liabilities when remedial
efforts are probable and the costs can be reasonably estimated.
Environmental reserves do not reflect management’s
assessment of any insurance coverage that may be applicable to
the matters at issue. Management has assessed each of the
matters based on current information and made a judgment
concerning its potential outcome, considering the nature of the
claim, the amount and nature of damages sought and the
probability of success.
Our environmental liability at December 31, 2010 and
December 31, 2009 was $1.6 million and
$3.2 million. Our December 31, 2010 liability
consisted of $0.2 million for gathering system leaks and
$1.4 million for ground water assessment and remediation.
In May 2007, the New Mexico Environmental Department
(“NMED”) alleged air emissions violations at the
Eunice, Monument and Saunders gas processing plants operated by
Targa Midstream Services Limited Partnership and owned by
Versado Gas Processors, LLC (“Versado”), which were
identified in the course of an inspection of the Eunice plant
conducted by the NMED in August 2005.
In January 2010, Versado settled the alleged violations with
NMED for a penalty of approximately $1.5 million. As part
of the settlement, Versado agreed to install two acid gas
injection wells, additional emission control equipment and
monitoring equipment. We estimate the total cost to complete
these projects to be approximately $33.4 million, of which
$4.0 million has already been paid. The Partnership is
responsible for its 63% pro-rata ownership percentage of the
total costs of the projects. Under the terms of the Versado
Purchase and Sale Agreement, we must reimburse the Partnership
for the cost of these compliance investments.
F-29
Legal
Proceedings
We are a party to various legal proceedings
and/or
regulatory proceedings and certain claims, suits and complaints
arising in the ordinary course of business that have been filed
or are pending against us. We believe all such matters are
without merit or involve amounts which, if resolved unfavorably,
would not have a material effect on our financial position,
results of operations, or cash flows, except for the items more
fully described below.
On December 8, 2005, WTG Gas Processing, L.P.
(“WTG”) filed suit in the 333rd District Court of
Harris County, Texas against several defendants, including Targa
and two other Targa entities and private equity funds affiliated
with Warburg Pincus LLC, seeking damages from the defendants.
The suit alleges that Targa and private equity funds affiliated
with Warburg Pincus, along with ConocoPhillips Company
(“ConocoPhillips”) and Morgan Stanley, tortiously
interfered with (i) a contract WTG claims to have had to
purchase SAOU from ConocoPhillips and (ii) prospective
business relations of WTG. WTG claims the alleged interference
resulted from Targa’s competition to purchase the
ConocoPhillips’ assets and its successful acquisition of
those assets in 2004. In October 2007, the District Court
granted defendants’ motions for summary judgment on all of
WTG’s claims. In February 2010, the 14th Court of
Appeals affirmed the District Court’s final judgment in
favor of defendants in its entirety. In January 2011, the Texas
Supreme Court denied the WTG’s petition for review of the
lower courts’ judgment and WTG filed a motion for rehearing
with the Texas Supreme Court requesting the court reconsider its
denial to review WTG’s appeal. We have agreed to indemnify
the Partnership for any claim or liability arising out of the
WTG suit.
Except as provided above, neither we nor the Partnership is a
party to any other legal proceedings other than legal
proceedings arising in the ordinary course of our business. The
Partnership is a party to various administrative and regulatory
proceedings that have arisen in the ordinary course of our
business.
|
|
|
Note 17—
|
Fair
Value Measurements
|
We categorize the inputs to the fair value of our financial
assets and liabilities using a three-tier fair value hierarchy
that prioritizes the significant inputs used in measuring fair
value:
|
|
|
| |
•
|
Level 1—observable inputs such as quoted prices
in active markets;
|
| |
| |
•
|
Level 2—inputs other than quoted prices in
active markets that are either directly or indirectly
observable; and
|
| |
| |
•
|
Level 3—unobservable inputs in which little or
no market data exists, therefore requiring an entity to develop
its own assumptions.
|
Our derivative instruments consist of financially settled
commodity and interest rate swap and option contracts and fixed
price commodity contracts with certain counterparties. We
determine the value of our derivative contracts utilizing a
discounted cash flow model for swaps and a standard option
pricing model for options, based on inputs that are readily
available in public markets. We have consistently applied these
valuation techniques in all periods presented and believe we
have obtained the most accurate information available for the
types of derivative contracts we hold.
F-30
The following tables present the fair value of our financial
assets and liabilities according to the fair value hierarchy.
These financial assets and liabilities are classified in their
entirety based on the lowest level of input that is significant
to the fair value measurement. Our assessment of the
significance of a particular input to the fair value measurement
requires judgment, and may affect the valuation of the fair
value assets and liabilities and their placement within the fair
value hierarchy levels.
| |
|
|
|
|
|
|
|
|
|
|
|
|
|
|
|
|
|
December 31, 2010
|
|
Total
|
|
|
Level 1
|
|
|
Level 2
|
|
|
Level 3
|
|
|
|
|
Assets from commodity derivative contracts
|
|
$
|
44.1
|
|
|
$
|
—
|
|
|
$
|
43.9
|
|
|
$
|
0.2
|
|
|
Assets from interest rate derivatives
|
|
|
—
|
|
|
|
—
|
|
|
|
—
|
|
|
|
—
|
|
|
|
|
|
|
|
|
|
|
|
|
|
|
|
|
|
|
|
|
Total assets
|
|
$
|
44.1
|
|
|
$
|
—
|
|
|
$
|
43.9
|
|
|
$
|
0.2
|
|
|
|
|
|
|
|
|
|
|
|
|
|
|
|
|
|
|
|
|
Liabilities from commodity derivative contracts
|
|
$
|
46.9
|
|
|
$
|
—
|
|
|
$
|
35.1
|
|
|
$
|
11.8
|
|
|
Liabilities from interest rate derivatives
|
|
|
20.1
|
|
|
|
—
|
|
|
|
20.1
|
|
|
|
—
|
|
|
|
|
|
|
|
|
|
|
|
|
|
|
|
|
|
|
|
|
Total liabilities
|
|
$
|
67.0
|
|
|
$
|
—
|
|
|
$
|
55.2
|
|
|
$
|
11.8
|
|
|
|
|
|
|
|
|
|
|
|
|
|
|
|
|
|
|
|
| |
|
|
|
|
|
|
|
|
|
|
|
|
|
|
|
|
|
December 31, 2009
|
|
Total
|
|
|
Level 1
|
|
|
Level 2
|
|
|
Level 3
|
|
|
|
|
Assets from commodity derivative contracts
|
|
$
|
44.6
|
|
|
$
|
—
|
|
|
$
|
44.6
|
|
|
$
|
—
|
|
|
Assets from interest rate derivatives
|
|
|
2.1
|
|
|
|
—
|
|
|
|
2.1
|
|
|
|
—
|
|
|
|
|
|
|
|
|
|
|
|
|
|
|
|
|
|
|
|
|
Total assets
|
|
$
|
46.7
|
|
|
$
|
—
|
|
|
$
|
46.7
|
|
|
$
|
—
|
|
|
|
|
|
|
|
|
|
|
|
|
|
|
|
|
|
|
|
|
Liabilities from commodity derivative contracts
|
|
$
|
60.3
|
|
|
$
|
—
|
|
|
$
|
46.6
|
|
|
$
|
13.7
|
|
|
Liabilities from interest rate derivatives
|
|
|
12.7
|
|
|
|
—
|
|
|
|
12.7
|
|
|
|
|
|
|
|
|
|
|
|
|
|
|
|
|
|
|
|
|
|
|
|
|
Total liabilities
|
|
$
|
73.0
|
|
|
$
|
—
|
|
|
$
|
59.3
|
|
|
$
|
13.7
|
|
|
|
|
|
|
|
|
|
|
|
|
|
|
|
|
|
|
|
The following table sets forth a reconciliation of the changes
in the fair value of our financial instruments classified as
Level 3 in the fair value hierarchy:
| |
|
|
|
|
|
|
|
|
|
|
|
|
|
|
|
Commodity Derivative Contracts
|
|
|
|
|
2010
|
|
|
2009
|
|
|
2008
|
|
|
|
|
Balance at January 1
|
|
$
|
(13.7
|
)
|
|
$
|
148.2
|
|
|
$
|
(124.2
|
)
|
|
Unrealized gains included in OCI
|
|
|
2.6
|
|
|
|
(57.1
|
)
|
|
|
149.6
|
|
|
Purchases
|
|
|
—
|
|
|
|
—
|
|
|
|
81.1
|
|
|
Settlements included in Income
|
|
|
(0.5
|
)
|
|
|
(35.0
|
)
|
|
|
41.7
|
|
|
Transfers out of
Level 3(1)
|
|
|
—
|
|
|
|
(69.8
|
)
|
|
|
—
|
|
|
|
|
|
|
|
|
|
|
|
|
|
|
|
|
Balance at December 31
|
|
$
|
(11.6
|
)
|
|
$
|
(13.7
|
)
|
|
$
|
148.2
|
|
|
|
|
|
|
|
|
|
|
|
|
|
|
|
|
|
|
|
(1) |
|
During 2009, we reclassified certain of our NGL derivative
contracts from Level 3 (unobservable inputs in which little
or no market data exists) to Level 2 as we were able to
obtain directly observable inputs other than quoted prices in
active markets. |
For all periods indicated in the above table, all Level 3
derivative instruments were designated as cash flow hedges, and,
as such, all changes in their fair value are reflected in Other
Comprehensive Income. Therefore, there are no unrealized gains
or losses reflected in revenues or other income (expense) with
respect to Level 3 derivative instruments.
F-31
Our provisions for income taxes for the periods indicated are as
follows:
| |
|
|
|
|
|
|
|
|
|
|
|
|
|
|
|
Year Ended December 31,
|
|
|
|
|
2010
|
|
|
2009
|
|
|
2008
|
|
|
|
|
Current expense (benefit)
|
|
$
|
(10.6
|
)
|
|
$
|
1.6
|
|
|
$
|
1.3
|
|
|
Deferred expense
|
|
|
33.1
|
|
|
|
19.1
|
|
|
|
18.0
|
|
|
|
|
|
|
|
|
|
|
|
|
|
|
|
|
|
|
$
|
22.5
|
|
|
$
|
20.7
|
|
|
$
|
19.3
|
|
|
|
|
|
|
|
|
|
|
|
|
|
|
|
Our deferred income tax assets and liabilities at
December 31, 2010 and 2009 consist of differences related
to the timing of recognition of certain types of costs as
follows:
| |
|
|
|
|
|
|
|
|
|
|
|
December 31,
|
|
|
|
|
2010
|
|
|
2009
|
|
|
|
|
Deferred tax assets:
|
|
|
|
|
|
|
|
|
|
Net operating loss
|
|
$
|
—
|
|
|
$
|
60.1
|
|
|
Property, Plant and Equipment
|
|
|
—
|
|
|
|
6.3
|
|
|
Risk management contracts
|
|
|
48.3
|
|
|
|
—
|
|
|
Other
|
|
|
13.1
|
|
|
|
3.6
|
|
|
Tax credits
|
|
|
—
|
|
|
|
16.8
|
|
|
|
|
|
|
|
|
|
|
|
|
Deferred tax assets before valuation allowance
|
|
|
61.4
|
|
|
|
86.8
|
|
|
|
|
|
|
|
|
|
|
|
|
Valuation allowance
|
|
|
(3.5
|
)
|
|
|
—
|
|
|
|
|
|
|
|
|
|
|
|
|
|
|
|
57.9
|
|
|
|
86.8
|
|
|
Deferred tax liabilities:
|
|
|
|
|
|
|
|
|
|
Investments(1)
|
|
|
(145.8
|
)
|
|
|
(132.8
|
)
|
|
Risk management contracts
|
|
|
—
|
|
|
|
(5.4
|
)
|
|
Property, Plant and Equipment
|
|
|
(23.6
|
)
|
|
|
—
|
|
|
|
|
|
|
|
|
|
|
|
|
|
|
|
(169.4
|
)
|
|
|
(138.2
|
)
|
|
|
|
|
|
|
|
|
|
|
|
Net deferred tax liability
|
|
$
|
(111.5
|
)
|
|
$
|
(51.4
|
)
|
|
|
|
|
|
|
|
|
|
|
|
Federal
|
|
$
|
(106.6
|
)
|
|
$
|
(60.2
|
)
|
|
Foreign
|
|
|
0.5
|
|
|
|
0.5
|
|
|
State
|
|
|
(5.4
|
)
|
|
|
8.3
|
|
|
|
|
|
|
|
|
|
|
|
|
|
|
$
|
(111.5
|
)
|
|
$
|
(51.4
|
)
|
|
|
|
|
|
|
|
|
|
|
|
Balance sheet classification of deferred tax assets
(liabilities):
|
|
|
|
|
|
|
|
|
|
Current asset
|
|
$
|
3.6
|
|
|
$
|
—
|
|
|
Long-term asset (valuation allowance)
|
|
|
(3.5
|
)
|
|
|
|
|
|
Current liability
|
|
|
—
|
|
|
|
(1.4
|
)
|
|
Long-term liability
|
|
|
(111.6
|
)
|
|
|
(50.0
|
)
|
|
|
|
|
|
|
|
|
|
|
|
|
|
$
|
(111.5
|
)
|
|
$
|
(51.4
|
)
|
|
|
|
|
|
|
|
|
|
|
|
|
|
|
(1) |
|
Our deferred tax liability attributable to investments reflects
the differences between the book and tax carrying values of the
assets and liabilities of our wholly-owned partnerships and
equity method investments. |
As a result of dropdown transactions in 2009 and 2010,
differences related to the date of income recognition for book
and tax occurred. While these are temporary differences, the
reversal of these differences will not be recognized until we
sell the units of the Partnership. Therefore, the tax effect of
F-32
these differences is recorded as a valuation allowance of
$3.5 million in deferred taxes, as a component of other
long term assets for 2010.
As of December 31, 2010, for federal income tax purposes,
both regular tax net operating losses (“NOLs”) and
alternative minimum tax NOLs were fully utilized.
Set forth below is reconciliation between our income tax
provision (benefit) computed at the United States statutory rate
on income before income taxes and the income tax provision in
the accompanying consolidated statements of operations for the
periods indicated:
| |
|
|
|
|
|
|
|
|
|
|
|
|
|
|
|
Years Ending December 31,
|
|
|
|
|
2010
|
|
|
2009
|
|
|
2008
|
|
|
|
|
Income tax reconciliation:
|
|
|
|
|
|
|
|
|
|
|
|
|
|
Income before income taxes
|
|
$
|
85.8
|
|
|
$
|
99.8
|
|
|
$
|
153.7
|
|
|
Less: Net income attributable to noncontrolling interest
|
|
|
(78.3
|
)
|
|
|
(49.8
|
)
|
|
|
(97.1
|
)
|
|
|
|
|
|
|
|
|
|
|
|
|
|
|
|
Income attributable to TRC before income taxes
|
|
|
7.5
|
|
|
|
50.0
|
|
|
|
56.6
|
|
|
Federal statutory income tax rate
|
|
|
35
|
%
|
|
|
35
|
%
|
|
|
35
|
%
|
|
|
|
|
|
|
|
|
|
|
|
|
|
|
|
U.S. federal income tax provision at statutory rate
|
|
|
2.6
|
|
|
|
17.5
|
|
|
|
19.8
|
|
|
State income taxes, net of federal tax
benefit(1)
|
|
|
13.4
|
|
|
|
1.8
|
|
|
|
1.2
|
|
|
Valuation allowance
|
|
|
3.0
|
|
|
|
—
|
|
|
|
—
|
|
|
Other, net
|
|
|
3.5
|
|
|
|
1.4
|
|
|
|
(1.7
|
)
|
|
|
|
|
|
|
|
|
|
|
|
|
|
|
|
Income Tax Provision
|
|
$
|
22.5
|
|
|
$
|
20.7
|
|
|
$
|
19.3
|
|
|
|
|
|
|
|
|
|
|
|
|
|
|
|
|
|
|
|
(1) |
|
For 2010, primarily consists of the write-off of an
$11.9 million Texas margin tax credit. |
We have not identified any uncertain tax positions. We believe
that our income tax filing positions and deductions will be
sustained on audit and do not anticipate any adjustments that
will result in a material adverse effect on our financial
condition, results of operations or cash flow. Therefore, no
reserves for uncertain income tax positions have been recorded.
On April 14, 2010, we closed on a secondary public offering
of 8,500,000 common units of the Partnership. The direct tax
effect of the change in ownership interest in the Partnership as
a result of the secondary public offering was recorded as a
reduction in shareholders’ equity of $79.1 million, an
increase in current tax liability of $41.9 million and an
increase in deferred tax liability of $37.2 million. There
was no tax impact on consolidated net income as a result of the
secondary public offering.
On April 27, 2010, we sold our interests in the Permian and
Straddle Systems to the Partnership. On September 28, 2010,
we sold our interests in the Venice Operations to the
Partnership. Under applicable accounting principles, the tax
consequences of transactions with common control entities are
not to be reflected in pre-tax income. Consequently, there was
no tax impact on consolidated pre-tax net income as a result of
the sale of the Permian and Straddle Systems and the Venice
Operations. The tax effect of these sales was recorded as an
increase in other long term assets of $64.7 million, to be
amortized over the remaining life of the underlying assets, an
increase in current tax liability of $94.9 million, a
decrease in deferred tax liability of $27.5 million and an
increase in current tax expense of $2.7 million.
|
|
|
Note 19—
|
Fair
Value of Financial Instruments
|
We have determined the estimated fair values of assets and
liabilities classified as financial instruments using available
market information and valuation methodologies described below.
We apply considerable judgment when interpreting market data to
develop the estimates of fair value. The use of different market
assumptions or valuation methodologies may have a material
effect on the estimated fair value amounts.
F-33
The carrying value of the senior secured revolving credit
facility approximates its fair value, as its interest rate is
based on prevailing market rates. The fair value of the senior
unsecured notes is based on quoted market prices based on trades
of such debt.
The carrying values of items comprising current assets and
current liabilities approximate fair values due to the
short-term maturities of these instruments. Derivative financial
instruments included in our financial statements are stated at
fair value.
The carrying amounts and fair values of our other financial
instruments are as follows as of the dates indicated:
| |
|
|
|
|
|
|
|
|
|
|
|
|
|
|
|
|
|
|
|
December 31, 2010
|
|
December 31, 2009
|
|
|
|
Carrying
|
|
Fair
|
|
Carrying
|
|
Fair
|
|
|
|
Amount
|
|
Value
|
|
Amount
|
|
Value
|
|
|
|
Holdco loan
facility(1)
|
|
$
|
89.3
|
|
|
$
|
86.8
|
|
|
$
|
385.4
|
|
|
$
|
278.9
|
|
|
Senior secured term loan facility, due
2012(2)
|
|
|
—
|
|
|
|
—
|
|
|
|
62.2
|
|
|
|
61.9
|
|
|
Senior unsecured notes,
81/2%
fixed
rate(3)
|
|
|
—
|
|
|
|
—
|
|
|
|
250.0
|
|
|
|
259.2
|
|
|
Senior unsecured notes of the Partnership,
81/4%
fixed rate
|
|
|
209.1
|
|
|
|
219.4
|
|
|
|
209.1
|
|
|
|
206.5
|
|
|
Senior unsecured notes of the Partnership,
111/4%
fixed rate
|
|
|
231.3
|
|
|
|
265.0
|
|
|
|
231.3
|
|
|
|
253.5
|
|
|
Senior unsecured notes of the Partnership,
77/8%
fixed rate
|
|
|
250.0
|
|
|
|
259.7
|
|
|
|
—
|
|
|
|
—
|
|
|
|
|
|
(1) |
|
For the fair value of the Holdco loan facility, since we cannot
obtain an indicative quote from external sources, we are using
the value of the November 2010 purchases that we made at 97.18%
of face value. |
| |
|
(2) |
|
The carrying amount of the debt as of December 31, 2009
approximates the fair value as the variable rate is periodically
reset to prevailing market rates. |
| |
|
(3) |
|
The fair value as of December 31, 2009 represents the value
of the last trade of the year which occurred on December 9,
2009. On January 5, 2010 we paid $264.7 million to
complete a cash tender offer for all outstanding aggregate
principal amount plus accrued interest of $3.8 million. |
|
|
|
Note 20—
|
Supplemental
Cash Flow Information
|
Supplemental cash flow information was as follows for the
periods indicated:
| |
|
|
|
|
|
|
|
|
|
|
|
|
|
|
|
Year Ended December 31,
|
|
|
|
2010
|
|
2009
|
|
2008
|
|
|
|
Cash:
|
|
|
|
|
|
|
|
|
|
|
|
|
|
Interest paid
|
|
$
|
90.8
|
|
|
$
|
82.4
|
|
|
$
|
94.2
|
|
|
Income taxes
paid(1)
|
|
|
92.6
|
|
|
|
6.5
|
|
|
|
1.6
|
|
|
Non-cash
|
|
|
|
|
|
|
|
|
|
|
|
|
|
Inventory line-fill transferred to property, plant and equipment
|
|
|
0.4
|
|
|
|
9.8
|
|
|
|
—
|
|
|
Like-kind exchange of property, plant and equipment
|
|
|
—
|
|
|
|
—
|
|
|
|
5.8
|
|
|
Paid-in-kind
interest refinanced to Holdco principal
|
|
|
10.9
|
|
|
|
25.9
|
|
|
|
38.2
|
|
|
Conversion of series B preferred stock (accretive value)
|
|
|
79.9
|
|
|
|
—
|
|
|
|
—
|
|
|
Settlement of Partnership notes
|
|
|
—
|
|
|
|
—
|
|
|
|
14.1
|
|
|
Distribution of property to noncontrolling interest
|
|
|
—
|
|
|
|
—
|
|
|
|
14.8
|
|
|
Distribution of property to common shareholders
|
|
|
3.2
|
|
|
|
—
|
|
|
|
—
|
|
|
|
|
|
(1) |
|
During 2010, cash tax payments of $92.6 million were made
to the Internal Revenue Service and various states in connection
with taxable gains recognized upon Targa’s sale of the
Permian Business and Straddle Assets, its interests in the
Venice Operations and its secondary public offering of 8,500,000
common units of the Partnership. Under applicable accounting
principles, the income tax consequences of these transactions
are generally deferred and recognized over time. For income tax
purposes, the tax consequences must be recognized in 2010 when
the dispositions were completed. |
F-34
Note 21—Segment
Information
The Partnership’s operations are presented under four
segments: (1) Field Gathering and Processing,
(2) Coastal Gathering and Processing, (3) Logistics
Assets and (4) Marketing and Distribution. The financial
results of our hedging activities are reported in Other.
The Natural Gas Gathering and Processing division includes
assets used in the gathering of natural gas produced from oil
and gas wells and processing this raw natural gas into
merchantable natural gas by extracting natural gas liquids and
removing impurities. The Field Gathering and Processing segment
assets are located in North Texas and the Permian Basin of Texas
and New Mexico and the Coastal Gathering and Processing segment
assets are located in the onshore and near offshore region of
the Louisiana Gulf Coast and the Gulf of Mexico.
The NGL Logistics and Marketing division is also referred to as
our Downstream Business. It includes all the activities
necessary to convert raw natural gas liquids into NGL products,
market the finished products and provide certain value added
services.
The Logistics Assets segment is involved in transporting and
storing mixed NGLs and fractionating, storing, and transporting
finished NGLs. These assets are generally connected to and
supplied, in part, by our Gathering and Processing segments and
are predominantly located in Mont Belvieu, Texas and
Southwestern Louisiana.
The Marketing and Distribution segment covers all activities
required to distribute and market raw and finished natural gas
liquids and all natural gas marketing activities. It includes
(1) marketing our own natural gas liquids production and
purchasing natural gas liquids products in selected United
States markets; (2) providing liquefied petroleum gas
balancing services to refinery customers; (3) transporting,
storing and selling propane and providing related propane
logistics services to multi-state retailers, independent
retailers and other end users; and (4) marketing natural
gas available to us from our Gathering and Processing segments
and the purchase and resale of natural gas in selected United
States markets.
Other contains the results of our derivatives and hedging
transactions. Eliminations of inter-segment transactions are
reflected in the eliminations column.
Our segment information is shown in the following tables. With
the conveyance of all of our remaining operating assets to the
Partnership in September 2010, all operating assets are now
owned by the Partnership. We have segregated the following
segment information between Partnership and Non-partnership
activities. Partnership activities have been presented on a
common control accounting basis which reflects the dropdown
transactions as if they occurred in prior periods similar to a
pooling of interests. The Non-Partnership results include
activities related to certain assets and liabilities
contractually excluded from the dropdown transactions and
certain historical hedge activities that could not be reflected
under GAAP in the Partnership common control results.
| |
|
|
|
|
|
|
|
|
|
|
|
|
|
|
|
|
|
|
|
|
|
|
|
|
|
|
|
|
|
|
|
|
|
|
|
Year Ended December 31, 2010
|
|
|
|
|
Partnership
|
|
|
|
|
|
|
|
|
|
|
Field
|
|
|
Coastal
|
|
|
|
|
|
|
|
|
|
|
|
|
|
|
|
|
|
|
|
|
|
|
Gathering
|
|
|
Gathering
|
|
|
|
|
|
Marketing
|
|
|
|
|
|
Corporate
|
|
|
|
|
|
|
|
|
|
|
and
|
|
|
and
|
|
|
Logistics
|
|
|
and
|
|
|
|
|
|
and
|
|
|
TRC Non-
|
|
|
|
|
|
|
|
Processing
|
|
|
Processing
|
|
|
Assets
|
|
|
Distribution
|
|
|
Other
|
|
|
Eliminations
|
|
|
Partnership
|
|
|
Consolidated
|
|
|
|
|
Revenues
|
|
$
|
211.6
|
|
|
$
|
446.6
|
|
|
$
|
84.5
|
|
|
$
|
4,713.5
|
|
|
$
|
4.0
|
|
|
$
|
—
|
|
|
$
|
9.0
|
|
|
$
|
5,469.2
|
|
|
Intersegment revenues
|
|
|
1,084.4
|
|
|
|
755.7
|
|
|
|
88.0
|
|
|
|
494.8
|
|
|
|
—
|
|
|
|
(2,422.9
|
)
|
|
|
—
|
|
|
|
—
|
|
|
|
|
|
|
|
|
|
|
|
|
|
|
|
|
|
|
|
|
|
|
|
|
|
|
|
|
|
|
|
|
|
|
|
|
Revenues
|
|
$
|
1,296.0
|
|
|
$
|
1,202.3
|
|
|
$
|
172.5
|
|
|
$
|
5,208.3
|
|
|
$
|
4.0
|
|
|
$
|
(2,422.9
|
)
|
|
$
|
9.0
|
|
|
$
|
5,469.2
|
|
|
|
|
|
|
|
|
|
|
|
|
|
|
|
|
|
|
|
|
|
|
|
|
|
|
|
|
|
|
|
|
|
|
|
|
Operating margin
|
|
$
|
236.6
|
|
|
$
|
107.8
|
|
|
$
|
83.8
|
|
|
$
|
80.5
|
|
|
$
|
4.0
|
|
|
$
|
—
|
|
|
$
|
8.6
|
|
|
$
|
521.3
|
|
|
|
|
|
|
|
|
|
|
|
|
|
|
|
|
|
|
|
|
|
|
|
|
|
|
|
|
|
|
|
|
|
|
|
|
Other financial information:
|
|
|
|
|
|
|
|
|
|
|
|
|
|
|
|
|
|
|
|
|
|
|
|
|
|
|
|
|
|
|
|
|
|
Total assets
|
|
$
|
1,623.4
|
|
|
$
|
451.5
|
|
|
$
|
471.9
|
|
|
$
|
519.9
|
|
|
$
|
44.1
|
|
|
$
|
75.6
|
|
|
$
|
207.4
|
|
|
$
|
3,393.8
|
|
|
Capital expenditure
|
|
$
|
67.8
|
|
|
$
|
6.9
|
|
|
$
|
66.3
|
|
|
$
|
2.7
|
|
|
$
|
—
|
|
|
$
|
—
|
|
|
$
|
3.5
|
|
|
$
|
147.2
|
|
F-35
| |
|
|
|
|
|
|
|
|
|
|
|
|
|
|
|
|
|
|
|
|
|
|
|
|
|
|
|
|
|
|
|
|
|
|
|
Year Ended December 31, 2009
|
|
|
|
|
Partnership
|
|
|
|
|
|
|
|
|
|
|
Field
|
|
|
Coastal
|
|
|
|
|
|
|
|
|
|
|
|
|
|
|
|
|
|
|
|
|
|
|
Gathering
|
|
|
Gathering
|
|
|
|
|
|
Marketing
|
|
|
|
|
|
Corporate
|
|
|
|
|
|
|
|
|
|
|
and
|
|
|
and
|
|
|
Logistics
|
|
|
and
|
|
|
|
|
|
and
|
|
|
TRC Non-
|
|
|
|
|
|
|
|
Processing
|
|
|
Processing
|
|
|
Assets
|
|
|
Distribution
|
|
|
Other
|
|
|
Eliminations
|
|
|
Partnership
|
|
|
Consolidated
|
|
|
|
|
Revenues
|
|
$
|
191.7
|
|
|
$
|
392.0
|
|
|
$
|
76.7
|
|
|
$
|
3,797.1
|
|
|
$
|
46.3
|
|
|
$
|
—
|
|
|
$
|
32.2
|
|
|
$
|
4,536.0
|
|
|
Intersegment revenues
|
|
|
780.1
|
|
|
|
525.0
|
|
|
|
79.5
|
|
|
|
337.4
|
|
|
|
—
|
|
|
|
(1,722.0
|
)
|
|
|
—
|
|
|
|
—
|
|
|
|
|
|
|
|
|
|
|
|
|
|
|
|
|
|
|
|
|
|
|
|
|
|
|
|
|
|
|
|
|
|
|
|
|
Revenues
|
|
$
|
971.8
|
|
|
$
|
917.0
|
|
|
$
|
156.2
|
|
|
$
|
4,134.5
|
|
|
$
|
46.3
|
|
|
$
|
(1,722.0
|
)
|
|
$
|
32.2
|
|
|
$
|
4,536.0
|
|
|
|
|
|
|
|
|
|
|
|
|
|
|
|
|
|
|
|
|
|
|
|
|
|
|
|
|
|
|
|
|
|
|
|
|
Operating margin
|
|
$
|
183.2
|
|
|
$
|
89.7
|
|
|
$
|
74.3
|
|
|
$
|
83.0
|
|
|
$
|
46.3
|
|
|
$
|
—
|
|
|
$
|
33.4
|
|
|
$
|
509.9
|
|
|
|
|
|
|
|
|
|
|
|
|
|
|
|
|
|
|
|
|
|
|
|
|
|
|
|
|
|
|
|
|
|
|
|
|
Other financial information:
|
|
|
|
|
|
|
|
|
|
|
|
|
|
|
|
|
|
|
|
|
|
|
|
|
|
|
|
|
|
|
|
|
|
Total assets
|
|
$
|
1,668.2
|
|
|
$
|
489.0
|
|
|
$
|
414.4
|
|
|
$
|
442.3
|
|
|
$
|
46.8
|
|
|
$
|
92.0
|
|
|
$
|
214.8
|
|
|
$
|
3,367.5
|
|
|
Capital expenditure
|
|
$
|
53.4
|
|
|
$
|
14.0
|
|
|
$
|
15.8
|
|
|
$
|
16.0
|
|
|
$
|
—
|
|
|
$
|
—
|
|
|
$
|
2.7
|
|
|
$
|
101.9
|
|
| |
|
|
|
|
|
|
|
|
|
|
|
|
|
|
|
|
|
|
|
|
|
|
|
|
|
|
|
|
|
|
|
|
|
|
|
Year Ended December 31, 2008
|
|
|
|
|
Partnership
|
|
|
|
|
|
|
|
|
|
|
Field
|
|
|
Coastal
|
|
|
|
|
|
|
|
|
|
|
|
|
|
|
|
|
|
|
|
|
|
|
Gathering
|
|
|
Gathering
|
|
|
|
|
|
Marketing
|
|
|
|
|
|
Corporate
|
|
|
|
|
|
|
|
|
|
|
and
|
|
|
and
|
|
|
Logistics
|
|
|
and
|
|
|
|
|
|
and
|
|
|
TRC Non-
|
|
|
|
|
|
|
|
Processing
|
|
|
Processing
|
|
|
Assets
|
|
|
Distribution
|
|
|
Other
|
|
|
Eliminations
|
|
|
Partnership
|
|
|
Consolidated
|
|
|
|
|
Revenues
|
|
$
|
415.9
|
|
|
$
|
781.2
|
|
|
$
|
69.1
|
|
|
$
|
6,797.5
|
|
|
$
|
(33.6
|
)
|
|
$
|
—
|
|
|
$
|
(31.2
|
)
|
|
$
|
7,998.9
|
|
|
Intersegment revenues
|
|
|
1,530.8
|
|
|
|
736.4
|
|
|
|
103.4
|
|
|
|
619.5
|
|
|
|
—
|
|
|
|
(2,990.1
|
)
|
|
|
—
|
|
|
|
—
|
|
|
|
|
|
|
|
|
|
|
|
|
|
|
|
|
|
|
|
|
|
|
|
|
|
|
|
|
|
|
|
|
|
|
|
|
Revenues
|
|
$
|
1,946.7
|
|
|
$
|
1,517.6
|
|
|
$
|
172.5
|
|
|
$
|
7,417.0
|
|
|
$
|
(33.6
|
)
|
|
$
|
(2,990.1
|
)
|
|
$
|
(31.2
|
)
|
|
$
|
7,998.9
|
|
|
|
|
|
|
|
|
|
|
|
|
|
|
|
|
|
|
|
|
|
|
|
|
|
|
|
|
|
|
|
|
|
|
|
|
Operating margin
|
|
$
|
385.4
|
|
|
$
|
105.4
|
|
|
$
|
40.1
|
|
|
$
|
41.3
|
|
|
$
|
(33.6
|
)
|
|
$
|
—
|
|
|
$
|
(33.4
|
)
|
|
$
|
505.2
|
|
|
|
|
|
|
|
|
|
|
|
|
|
|
|
|
|
|
|
|
|
|
|
|
|
|
|
|
|
|
|
|
|
|
|
|
Other financial information:
|
|
|
|
|
|
|
|
|
|
|
|
|
|
|
|
|
|
|
|
|
|
|
|
|
|
|
|
|
|
|
|
|
|
Total assets
|
|
|
1,725.7
|
|
|
$
|
522.4
|
|
|
$
|
421.5
|
|
|
$
|
356.9
|
|
|
$
|
202.1
|
|
|
$
|
120.0
|
|
|
$
|
293.2
|
|
|
$
|
3,641.8
|
|
|
Capital expenditure
|
|
|
82.7
|
|
|
|
13.1
|
|
|
|
37.2
|
|
|
|
4.2
|
|
|
|
—
|
|
|
|
—
|
|
|
|
8.3
|
|
|
|
145.5
|
|
The following table shows our revenues by product and service
for each period presented:
| |
|
|
|
|
|
|
|
|
|
|
|
|
|
|
|
Year Ended December 31,
|
|
|
|
|
2010
|
|
|
2009
|
|
|
2008
|
|
|
|
|
Natural gas sales
|
|
$
|
1,076.5
|
|
|
$
|
809.4
|
|
|
$
|
1,590.3
|
|
|
NGL sales
|
|
|
4,115.3
|
|
|
|
3,365.3
|
|
|
|
6,148.4
|
|
|
Condensate sales
|
|
|
95.1
|
|
|
|
95.5
|
|
|
|
131.5
|
|
|
Fractionating and treating fees
|
|
|
55.8
|
|
|
|
61.2
|
|
|
|
66.8
|
|
|
Storage and terminalling fees
|
|
|
40.1
|
|
|
|
41.0
|
|
|
|
33.0
|
|
|
Transportation fees
|
|
|
33.8
|
|
|
|
43.4
|
|
|
|
39.2
|
|
|
Gas processing fees
|
|
|
32.1
|
|
|
|
24.0
|
|
|
|
22.0
|
|
|
Hedge settlements
|
|
|
9.1
|
|
|
|
69.7
|
|
|
|
(65.1
|
)
|
|
Business interruption insurance
|
|
|
6.0
|
|
|
|
21.5
|
|
|
|
32.9
|
|
|
Other
|
|
|
5.4
|
|
|
|
4.6
|
|
|
|
(0.1
|
)
|
|
|
|
|
|
|
|
|
|
|
|
|
|
|
|
|
|
$
|
5,469.2
|
|
|
$
|
4,536.0
|
|
|
$
|
7,998.9
|
|
|
|
|
|
|
|
|
|
|
|
|
|
|
|
F-36
The following table is a reconciliation of operating margin to
net income for each period presented:
| |
|
|
|
|
|
|
|
|
|
|
|
|
|
|
|
Year Ended December 31,
|
|
|
|
|
2010
|
|
|
2009
|
|
|
2008
|
|
|
|
|
Reconciliation of operating margin to net income
|
|
|
|
|
|
|
|
|
|
|
|
|
|
Operating margin
|
|
$
|
521.3
|
|
|
$
|
509.9
|
|
|
$
|
505.2
|
|
|
Depreciation and amortization expense
|
|
|
(185.5
|
)
|
|
|
(170.3
|
)
|
|
|
(160.9
|
)
|
|
General and administrative expense
|
|
|
(144.4
|
)
|
|
|
(120.4
|
)
|
|
|
(96.4
|
)
|
|
Interest expense, net
|
|
|
(110.9
|
)
|
|
|
(132.1
|
)
|
|
|
(141.2
|
)
|
|
Income tax expense
|
|
|
(22.5
|
)
|
|
|
(20.7
|
)
|
|
|
(19.3
|
)
|
|
Other, net
|
|
|
5.3
|
|
|
|
12.7
|
|
|
|
47.0
|
|
|
|
|
|
|
|
|
|
|
|
|
|
|
|
|
Net income
|
|
$
|
63.3
|
|
|
$
|
79.1
|
|
|
$
|
134.4
|
|
|
|
|
|
|
|
|
|
|
|
|
|
|
|
|
|
|
Note 22—
|
Other
Operating Income
|
Our other operating (income) expense consists of the following
items for the periods indicated:
| |
|
|
|
|
|
|
|
|
|
|
|
|
|
|
|
Year Ended December 31,
|
|
|
|
|
2010
|
|
|
2009
|
|
|
2008
|
|
|
|
|
Abandoned project costs
|
|
$
|
0.1
|
|
|
$
|
5.5
|
|
|
$
|
—
|
|
|
Casualty loss (gain) adjustment (see Note 13)
|
|
|
(3.3
|
)
|
|
|
(3.6
|
)
|
|
|
19.3
|
|
|
Loss (gain) on sale of
assets(1)
|
|
|
(1.5
|
)
|
|
|
0.1
|
|
|
|
(5.9
|
)
|
|
|
|
|
|
|
|
|
|
|
|
|
|
|
|
|
|
$
|
(4.7
|
)
|
|
$
|
2.0
|
|
|
$
|
13.4
|
|
|
|
|
|
|
|
|
|
|
|
|
|
|
|
|
|
|
|
(1) |
|
For 2008, $5.8 million gain on sale of assets was due to a
like-kind exchange. See Note 20. |
|
|
|
Note 23—
|
Significant
Risks and Uncertainties
|
Our primary business objective is to increase our available cash
for dividends to our stockholders by assisting the Partnership
in executing its business strategy. We may facilitate the
Partnership’s growth through various forms of financial
support, including, but not limited to, modifying the
Partnership’s IDRs, exercising the Partnership’s IDR
reset provision contained in its partnership agreement, making
loans, making capital contributions in exchange for yielding or
non-yielding equity interests or providing other financial
support to the Partnership, if needed, to support its ability to
make distributions. In addition, we may acquire assets that
could be candidates for acquisition by the Partnership,
potentially after operational or commercial improvement or
further development.
Nature of the
Partnership’s Operations in Midstream Energy
Industry
The Partnership operates in the midstream energy industry. Its
business activities include gathering, transporting, processing,
fractionating and storage of natural gas, NGLs and crude oil.
The Partnership’s results of operations, cash flows and
financial condition may be affected by (i) changes in the
commodity prices of these hydrocarbon products and
(ii) changes in the relative price levels among these
hydrocarbon products. In general, the prices of natural gas,
NGLs, condensate and other hydrocarbon products are subject to
fluctuations in response to changes in supply, market
uncertainty and a variety of additional factors that are beyond
our control.
The Partnership’s profitability could be impacted by a
decline in the volume of natural gas, NGLs and condensate
transported, gathered or processed at our facilities. A material
decrease in natural gas or condensate production or condensate
refining, as a result of depressed commodity prices, a decrease
in exploration and development activities or otherwise, could
result in a decline in the volume of natural gas, NGLs and
condensate handled by our facilities.
F-37
A reduction in demand for NGL products by the petrochemical,
refining or heating industries, whether because of
(i) general economic conditions, (ii) reduced demand
by consumers for the end products made with NGL products,
(iii) increased competition from petroleum-based products
due to the pricing differences, (iv) adverse weather
conditions, (v) government regulations affecting commodity
prices and production levels of hydrocarbons or the content of
motor gasoline or (vi) other reasons, could also adversely
affect the Partnership’s results of operations, cash flows
and financial position.
The principal market risks are exposure to changes in commodity
prices, particularly to the prices of natural gas and NGLs, as
well as changes in interest rates. The fair value of commodity
and interest rate derivative instruments, depending on the type
of instrument, was determined by the use of present value
methods or standard option valuation models with assumptions
about commodity prices based on those observed in underlying
markets. These contracts may expose the Partnership to the risk
of financial loss in certain circumstances. The
Partnership’s hedging arrangements provide it protection on
its hedged volumes if prices decline below the prices at which
these hedges are set. If prices rise above the prices at which
they are hedged, the Partnership will receive less revenue on
the hedged volumes than it would receive in the absence of
hedges.
Commodity Price Risk. A majority of the
revenues from the natural gas gathering and processing business
are derived from
percent-of-proceeds
contracts under which the Partnership receives a portion of the
natural gas
and/or NGLs
or equity volumes, as payment for services. The prices of
natural gas and NGLs are subject to market fluctuations in
response to changes in supply, demand, market uncertainty and a
variety of additional factors beyond our control. The
Partnership monitors these risks and enters into commodity
derivative transactions designed to mitigate the impact of
commodity price fluctuations on its business. Cash flows from a
derivative instrument designated as a hedge are classified in
the same category as the cash flows from the item being hedged.
In an effort to reduce the variability of our cash flows the
Partnership has hedged the commodity price associated with a
significant portion of our expected natural gas, NGL and
condensate equity volumes for the years 2010 through 2014 by
entering into derivative financial instruments including swaps
and purchased puts (or floors). The percentages of expected
equity volumes that are hedged decrease over time. With swaps,
the Partnership typically receives an agreed upon fixed price
for a specified notional quantity of natural gas or NGL and pays
the hedge counterparty a floating price for that same quantity
based upon published index prices. Since the Partnership
receives from its customers substantially the same floating
index price from the sale of the underlying physical commodity,
these transactions are designed to effectively lock-in the
agreed fixed price in advance for the volumes hedged. In order
to avoid having a greater volume hedged than actual equity
volumes, the Partnership typically limits its use of swaps to
hedge the prices of less than its expected natural gas and NGL
equity volumes. The Partnership utilizes purchased puts (or
floors) to hedge additional expected equity commodity volumes
without creating volumetric risk. The Partnership’s
commodity hedges may expose it to the risk of financial loss in
certain circumstances. Hedging arrangements provide it
protection on the hedged volumes if market prices decline below
the prices at which these hedges are set. If market prices rise
above the prices at which we have hedged, we will receive less
revenue on the hedged volumes than we would receive in the
absence of hedges. See Note 14.
Interest Rate Risk. The Partnership is exposed
to changes in interest rates, primarily as a result of variable
rate borrowings under its credit facility. In an effort to
reduce the variability of its cash flows, the Partnership has
entered into several interest rate swap and interest rate basis
swap agreements. Under these agreements, which are accounted for
as cash flow hedges, the base interest rate on the specified
notional amount of variable rate debt is effectively fixed for
the term of each agreement. See Note 14.
F-38
Counterparty
Risk — Credit and Concentration
Derivative
Counterparty Risk
Where the Partnership is exposed to credit risk in our financial
instrument transactions, management analyzes the
counterparty’s financial condition prior to entering into
an agreement, establishes credit
and/or
margin limits and monitors the appropriateness of these limits
on an ongoing basis. Generally, management does not require
collateral and does not anticipate nonperformance by our
counterparties.
The Partnership has master netting agreements with most of its
hedge counterparties. These netting arrangements allow it to net
settle asset and liability positions with the same
counterparties. As of December 31, 2010, the Partnership
had $25.8 million in liabilities to offset the default risk
of counterparties with which it also had asset positions of
$38.4 million as of that date.
The credit exposure related to commodity derivative instruments
is represented by the fair value of contracts with a net
positive fair value to the Partnership at the reporting date. At
such times, these outstanding instruments expose it to credit
loss in the event of nonperformance by the counterparties to the
agreements. Should the creditworthiness of one or more of the
counterparties decline, the ability to mitigate nonperformance
risk is limited to a counterparty agreeing to either a voluntary
termination and subsequent cash settlement or a novation of the
derivative contract to a third party. In the event of a
counterparty default, the Partnership may sustain a loss and its
cash receipts could be negatively impacted.
As of December 31, 2010, affiliates of Barclays, Credit
Suisse and British Petroleum (“BP”) accounted for 62%,
13% and 12%, respectively, of the Partnership’s net
counterparty credit exposure related to commodity derivative
instruments. Barclays, Credit Suisse and BP are major financial
institutions or corporations each possessing investment grade
credit ratings based upon minimum credit ratings assigned by
Standard & Poor’s Ratings Services.
Customer Credit
Risk
We extend credit to customers and other parties in the normal
course of business. We have established various procedures to
manage our credit exposure, including initial credit approvals,
credit limits and terms, letters of credit, and rights of
offset. We also use prepayments and guarantees to limit credit
risk to ensure that our established credit criteria are met. The
following table summarizes the activity affecting our allowance
for bad debts:
| |
|
|
|
|
|
|
|
|
|
|
|
|
|
|
|
Year Ended December 31,
|
|
|
|
|
2010
|
|
|
2009
|
|
|
2008
|
|
|
|
|
Balance at beginning of year
|
|
$
|
8.0
|
|
|
$
|
9.2
|
|
|
$
|
0.9
|
|
|
Additions
|
|
|
—
|
|
|
|
—
|
|
|
|
8.3
|
|
|
Deductions
|
|
|
(0.1
|
)
|
|
|
(1.2
|
)
|
|
|
—
|
|
|
|
|
|
|
|
|
|
|
|
|
|
|
|
|
Balance at end of year
|
|
$
|
7.9
|
|
|
$
|
8.0
|
|
|
$
|
9.2
|
|
|
|
|
|
|
|
|
|
|
|
|
|
|
|
Significant
Commercial Relationships
We are exposed to concentration risk when a significant customer
or supplier accounts for a significant portion of our business
activity. The following table lists the percentage of our
consolidated sales or purchases with customers and suppliers
which accounted for more than 10% of our consolidated revenues
and consolidated product purchases for the periods indicated:
| |
|
|
|
|
|
|
|
|
|
|
|
|
|
|
|
Year Ended December 31,
|
|
|
|
2010
|
|
2009
|
|
2008
|
|
|
|
% of consolidated revenues
|
|
|
|
|
|
|
|
|
|
|
|
|
|
Chevron Phillips Chemical Company LLC
|
|
|
10
|
%
|
|
|
15
|
%
|
|
|
19
|
%
|
|
% of product purchases
|
|
|
|
|
|
|
|
|
|
|
|
|
|
Louis Dreyfus Energy Services L.P.
|
|
|
10
|
%
|
|
|
11
|
%
|
|
|
9
|
%
|
F-39
All transactions in the above table were associated with the
Marketing and Distribution segment.
Casualty or
Other Risks
Targa maintains coverage in various insurance programs, which
provides us with property damage, business interruption and
other coverages which are customary for the nature and scope of
our operations. The financial impact of storm events such as
Hurricanes Katrina and Rita, and more recently Hurricanes Gustav
and Ike, as well as the current economic environment, have
affected many insurance carriers, and may affect their ability
to meet their obligation or trigger limitations in certain
insurance coverages. At present, there is no indication of any
of our insurance carriers being unable or unwilling to meet
their coverage obligations.
Management believes that Targa has adequate insurance coverage,
although insurance will not cover every type of interruption
that might occur. As a result of insurance market conditions,
premiums and deductibles for certain insurance policies have
increased substantially, and in some instances, certain
insurance may become unavailable, or available for only reduced
amounts of coverage. As a result, we may not be able to renew
existing insurance policies or procure other desirable insurance
on commercially reasonable terms, if at all.
If we were to incur a significant liability for which we were
not fully insured, it could have a material impact on our
consolidated financial position and results of operations. In
addition, the proceeds of any such insurance may not be paid in
a timely manner and may be insufficient if such an event were to
occur. Any event that interrupts the revenues generated by us,
or which causes us to make significant expenditures not covered
by insurance, could reduce our ability to meet our obligations.
|
|
|
Note 24—
|
Stock
and Other Compensation Plans
|
2005 Incentive
Compensation Plan
Stock Option
Plans
Under Targa’s 2005 Incentive Compensation Plan (“the
Plan”), options to purchase a fixed number of shares of its
stock may be granted to our employees, directors and
consultants. Generally, options granted under the Plan have a
vesting period of four years and remain exercisable for ten
years from the date of grant.
The fair value of each option granted was estimated on the date
of grant using a Black-Scholes option pricing model, which
incorporates various assumptions for 2010, 2009 and 2008,
including (i) expected term of the options of ten years,
(ii) a risk-free interest rate of 3.9% for 2010 and 3.6%
for 2009 and 2008, (iii) expected dividend yield of 0%, and
(iv) expected stock price volatility on TRC’s common
stock of 39.4% for 2010 and 25.5% for 2009 and 2008. Our
selection of the risk-free interest rate was based on published
yields for United States government securities with comparable
terms. Because TRC was a non-public company until
December 10, 2010, its expected stock price volatility was
estimated based upon the historical price volatility of the Dow
Jones U.S. Pipelines Index over a period equal to the
expected average term of the options granted. The calculated
fair value of options granted during the year ended
December 31, 2010, and 2008 was $4.09, and $3.01 per share.
There were no options granted in 2009.
We recognized compensation expense associated with stock options
of $0.2 million, $0.1 million and $0.2 million
during 2010, 2009 and 2008.
F-40
The following table shows stock option activity for the periods
indicated:
| |
|
|
|
|
|
|
|
|
|
|
|
Number of
|
|
|
Weighted Average
|
|
|
|
|
Options(1)
|
|
|
Exercise
Price(2)
|
|
|
|
|
Outstanding at December 31, 2009
|
|
|
2,215,442
|
|
|
$
|
17.04
|
|
|
Granted
|
|
|
46,018
|
|
|
|
7.22
|
|
|
Exercised
|
|
|
(1,189,863
|
)
|
|
|
0.67
|
|
|
Rescinded
|
|
|
(987,629
|
)
|
|
|
24.87
|
|
|
Cashed out
|
|
|
(59,002
|
)
|
|
|
1.90
|
|
|
Forfeited
|
|
|
(24,966
|
)
|
|
|
25.51
|
|
|
|
|
|
|
|
|
|
|
|
|
Outstanding at December 31, 2010
|
|
|
—
|
|
|
|
|
|
|
|
|
|
|
|
|
|
|
|
|
|
|
|
(1) |
|
The number of options was adjusted to reflect the IPO reverse
stock split with the conversion rate of 2.03. |
| |
|
(2) |
|
The weighted average prices were adjusted to reflect the IPO
reverse stock split with the conversion rate of 2.03. |
The aggregated intrinsic value of stock options exercised in
2010, 2009 and 2008 was $3.4 million, $0.2 million,
and $0.5 million.
Concurrent with the IPO, unexercised
in-the-money
stock options were cashed out, resulting in $1.2 million of
additional compensation expense in 2010. Unexercised
out-of-the-money
stock options were rescinded. As such, there are no outstanding
stock options at December 31, 2010.
In connection with our extraordinary special distribution of
dividends to our common and common equivalent shareholders
(Note 10), in April 2010, we reduced the strike price on
all of our outstanding options by $5.63. All unvested options
were deemed to have immediately vested in May 2010. The weighted
average exercise prices in the table above were adjusted to
reflect the IPO reverse stock split with the conversion rate of
2.03, and the reduced strike prices for options exercised,
rescinded, and cashed out after the strike price was reduced in
May 2010. There were no options granted or forfeited after May
2010. This reduction is considered an award modification for
accounting purposes; therefore, we re-determined the fair value
of the options immediately following the reduction. The
modification did not result in any additional compensation
expense.
Non-vested
(Restricted) Common Stock
Restricted stock awards entitle recipients to exchange
restricted common shares for unrestricted common shares (at no
cost to them) once the defined vesting period expires, subject
to certain forfeiture provisions. The restrictions on the
non-vested shares generally lapse four years from the date of
grant.
Conversion of
Vested Restricted Common Stock
Concurrent with the IPO in December 2010, all vested restricted
common shares converted to unrestricted common stock in the
Company. The following table provides a summary of our
non-vested restricted common stock awards for the periods
indicated:
| |
|
|
|
|
|
|
|
|
|
|
|
Year Ended
|
|
|
Weighted Average
|
|
|
|
|
December 31,
2010(1)
|
|
|
Grant-Date Fair
Value(2)
|
|
|
|
|
Outstanding at beginning of period
|
|
|
25,091
|
|
|
$
|
3.40
|
|
|
Granted
|
|
|
30,198
|
|
|
|
7.22
|
|
|
Vested
|
|
|
(55,289
|
)
|
|
|
5.49
|
|
|
|
|
|
|
|
|
|
|
|
|
Outstanding at end of period
|
|
|
—
|
|
|
|
|
|
|
|
|
|
|
|
|
|
|
|
F-41
|
|
|
|
(1) |
|
The number of restricted stock was adjusted to reflect the IPO
reverse stock split with the conversion rate of 2.03. |
| |
|
(2) |
|
The weighted average prices were adjusted to reflect the IPO
reverse stock split with the conversion rate of 2.03. |
The following table presents weighted average fair value of
shares granted and total fair value of shares vested during the
periods indicated.
| |
|
|
|
|
|
|
|
|
|
|
|
|
|
|
|
Year Ended December 31,
|
|
|
|
2010
|
|
2009
|
|
2008
|
|
|
|
Weighted average fair value of shares granted (per
share)(1)
|
|
$
|
7.22
|
|
|
$
|
—
|
|
|
$
|
7.02
|
|
|
Total fair value of shares vested (in millions)
|
|
|
0.3
|
|
|
|
2.4
|
|
|
|
16.6
|
|
|
|
|
|
(1) |
|
The weighted average prices were adjusted to reflect the IPO
reverse stock split with the conversion rate of 2.03. |
During 2010, 2009 and 2008, we recognized $0.2 million,
$0.3 million and $1.0 million of compensation expense
associated with the vesting of restricted stock.
2010 TRC Stock
Incentive Plan
In connection with our IPO in December 2010, we adopted the
Targa Resources Corp. 2010 Stock Incentive Plan (“TRC
Plan”) for employees, consultants and non-employee
directors of the Company. The TRC Plan allows for the grant of
(i) incentive stock options qualified as such under
U.S. federal income tax laws (“Incentive
Options”), (ii) stock options that do not qualify as
incentive options (“Non-statutory Options,” and
together with Incentive Options, “Options”),
(iii) stock appreciation rights (“SARs”) granted
in conjunction with Options or Phantom Stock Awards,
(iv) restricted stock awards (“Restricted Stock
Awards”), (v) phantom stock awards (“Phantom
Stock Awards”), (vi) bonus stock awards,
(vii) performance awards, or (viii) any combination of
such awards (collectively referred to a “Awards”).
On December 6, 2010, we awarded 556,514 bonus stock awards
to our executive management team which vested upon the closing
of our IPO on December 10, 2010. Total compensation expense
associated with these awards in 2010 was $12.2 million. The
compensation expense was calculated based on the fair value of
the stock of $22 per share at grant date.
On December 6, 2010, we granted to executive management and
certain employees 1,350,000 Restricted Stock Awards. These
awards vest over a three year period at 60% in 24 months
and the remaining 40% in 36 months.
There are no restrictions on the shares once the vesting
requirement is met. Total compensation expense associated with
these awards in 2010 was $1.1 million. We expect to incur
an additional $28.6 million of expense related to the
restricted awards over the next three years. The compensation
expense was calculated based on the fair value of the stock of
$22 per share at grant date.
Subsequent Event. In February 2011, our
Compensation Committee (the “Committee”) made awards
to our executive management for the 2011 compensation cycle of
33,140 restricted common shares under TRC’s Plan that will
vest three years from the grant date and 68,030 equity-settled
performance units under the Partnership’s LTIP that will
vest in June 2014. The settlement value of these performance
unit awards will be determined using the formula adopted for the
performance unit awards granted in December 2009.
Non-Employee
Director Grants and Incentive Plan related to the
Partnership’s Common Units
In connection with the Partnership’s IPO in February 2007,
we adopted a long-term incentive plan (“LTIP”) for
employees, consultants and directors of the Partnership or its
affiliates who perform services for
F-42
us or our affiliates. The LTIP provides for the grant of
cash-settled performance units which are linked to the
performance of the Partnership’s common units and may
include distribution equivalent rights (“DERs”). The
LTIP is administered by the compensation committee of our board
of directors. Subject to applicable vesting criteria, a DER
entitles the grantee to a cash payment equal to cash
distributions paid on an outstanding common unit.
Each vested performance unit will entitle the grantee to a cash
payment equal to the then value of a Partnership common unit,
including DERs. The amount vesting under such awards is based on
the total return per common unit of the Partnership through the
end of the performance period multiplied by the vesting
percentage determined from the Partnership’s ranking in a
defined peer group.
The following table summarizes the LTIP units for the year ended
2010:
| |
|
|
|
|
|
|
|
|
|
|
|
|
|
|
|
|
|
|
|
|
|
|
|
Program Year
|
|
|
|
|
|
|
|
2007 Plan
|
|
|
2008 Plan
|
|
|
2009 Plan
|
|
|
2010 Plan
|
|
|
Total
|
|
|
|
|
Unit outstanding January 1, 2010
|
|
|
275,400
|
|
|
|
135,800
|
|
|
|
534,900
|
|
|
|
90,403
|
|
|
|
1,036,503
|
|
|
Granted
|
|
|
—
|
|
|
|
—
|
|
|
|
—
|
|
|
|
219,597
|
|
|
|
219,597
|
|
|
Vested and paid
|
|
|
(275,400
|
)
|
|
|
—
|
|
|
|
—
|
|
|
|
—
|
|
|
|
(275,400
|
)
|
|
Forfeited
|
|
|
—
|
|
|
|
(2,000
|
)
|
|
|
(7,400
|
)
|
|
|
(3,000
|
)
|
|
|
(12,400
|
)
|
|
|
|
|
|
|
|
|
|
|
|
|
|
|
|
|
|
|
|
|
|
|
|
Units outstanding December 31, 2010
|
|
|
—
|
|
|
|
133,800
|
|
|
|
527,500
|
|
|
|
307,000
|
|
|
|
968,300
|
|
|
|
|
|
|
|
|
|
|
|
|
|
|
|
|
|
|
|
|
|
|
|
|
Calculated fair market value as of December 31, 2010
|
|
|
|
|
|
$
|
5,176,263
|
|
|
$
|
20,113,575
|
|
|
$
|
13,621,590
|
|
|
$
|
38,911,428
|
|
|
|
|
|
|
|
|
|
|
|
|
|
|
|
|
|
|
|
|
|
|
|
|
Liabilities recognized as of December 31, 2010:
|
|
|
|
|
|
|
|
|
|
|
|
|
|
|
|
|
|
|
|
|
|
Current
|
|
|
|
|
|
$
|
4,276,430
|
|
|
$
|
—
|
|
|
$
|
—
|
|
|
$
|
4,276,430
|
|
|
Long-term
|
|
|
|
|
|
|
—
|
|
|
|
10,145,414
|
|
|
|
3,434,471
|
|
|
|
13,579,885
|
|
|
To be recognized in future periods
|
|
|
|
|
|
|
899,833
|
|
|
|
9,968,161
|
|
|
|
10,187,119
|
|
|
|
21,055,113
|
|
|
Vesting date
|
|
|
|
|
|
|
June 2011
|
|
|
|
June 2012
|
|
|
|
June 2013
|
|
|
|
|
|
Because the performance units require cash settlement, they have
been accounted for as liabilities in our financial statements.
During 2010, we paid $9.1 million for vested LTIP units.
During 2010, we changed the fair value measurement model from a
Black-Scholes option pricing model to a Monte Carlo simulation
model. We considered the Monte Carlo simulation model to be more
appropriate for LTIP valuation purposes than our previous method
because it directly incorporates the peer group ranking market
conditions.
Prior to the change, the fair value of a performance unit was
the sum of: (i) the closing price of one of our common
units on the reporting date; (ii) the fair value of an
at-the-money
call option on a performance unit with a grant date equal to the
reporting date and an expiration date equal to the last day of
the performance period; and (iii) estimated DERs. The fair
value of the call options was estimated using a Black-Scholes
option pricing model. The market condition was indirectly
incorporated into the valuation based on our
point-in-time
ranking versus peers at the measurement date.
With the Monte Carlo simulation model, the fair value of a
performance unit is the sum of: (i) the simulated share
price of multiple correlated assets incorporated with peer
ranking; and (ii) the estimated value of expected DERs. The
simulated stock price was estimated using the Monte Carlo
simulation with discount rate of 7.17% and expected volatility
of 33.8%.
The remaining weighted average recognition period for the
unrecognized compensation cost is approximately two years.
During 2010, 2009 and 2008 we recognized compensation expense of
$13.9 million, $10.5 million and $0.1 million
related to the performance units.
Director
Grants
During 2010 and 2009, Targa Resources GP LLC, the
Partnership’s general partner, also made equity-based
awards of 15,750 and 32,000 of the Partnership’s restricted
common units (2,250 and 4,000 of its restricted common units to
each of the Partnership’s and our non-management directors)
under its
F-43
Incentive Plan. The awards will settle with the delivery of
common units and are subject to three-year vesting, without a
performance condition, and will vest ratably on each anniversary
of the grant date. During 2010, 2009 and 2008, the Partnership
recognized compensation expense of $0.4 million,
$0.3 million and $0.3 million related to these awards
with an offset to common equity. The Partnership estimates that
the remaining fair value of $0.2 million will be recognized
in expense over approximately one year. As of December 31,
2010 there were 39,074 unvested restricted common units
outstanding under this plan.
The following table summarizes the Partnership’s unit-based
awards for each of the periods indicated (in units and dollars):
| |
|
|
|
|
|
|
|
|
|
|
|
Year Ended
|
|
|
Weighted-average
|
|
|
|
|
December 31, 2010
|
|
|
Grant-Date Fair Value
|
|
|
|
|
Outstanding at beginning of year
|
|
$
|
41,993
|
|
|
$
|
12.88
|
|
|
Granted
|
|
|
15,750
|
|
|
|
23.51
|
|
|
Vested
|
|
|
(18,669
|
)
|
|
|
15.06
|
|
|
|
|
|
|
|
|
|
|
|
|
Outstanding at end of year
|
|
|
39,074
|
|
|
|
16.12
|
|
|
|
|
|
|
|
|
|
|
|
The weighted average grant-date fair value of the unit-based
awards for the years ended 2010, 2009 and 2008 were $16.12,
$12.88 and $22.12.
Subsequent event. On February 14, 2011,
the Partnership’s general partner made equity based awards
of 10,600 of the Partnership’s restricted common units
(2,120 restricted common units under to each of the
Partnership’s non-management directors) under its Incentive
Plan. The awards will settle with the delivery of common units
and are subject to three-year vesting, without a performance
condition, and will vest ratably on each anniversary of the
grant date.
Other
Compensation Plans
We have a 401(k) plan whereby we match 100% of up to 5% of an
employee’s contribution (subject to certain limitations in
the plan). We also contribute an amount equal to 3% of each
employee’s eligible compensation to the plan as a
retirement contribution and may make additional contributions at
our sole discretion. All Targa contributions are made 100% in
cash. We made contributions to the 401(k) plan totaling
$7.2 million, $6.6 million, and $8.4 million
during 2010, 2009, and 2008.
F-44
|
|
|
Note 25—
|
Selected
Quarterly Financial Data
(Unaudited)
|
Our results of operations by quarter for the years ended
December 31, 2010 and 2009 were as follows:
| |
|
|
|
|
|
|
|
|
|
|
|
|
|
|
|
|
|
|
|
|
|
|
|
First
|
|
|
Second
|
|
|
Third
|
|
|
Fourth
|
|
|
|
|
|
|
|
Quarter
|
|
|
Quarter
|
|
|
Quarter
|
|
|
Quarter
|
|
|
Total
|
|
|
|
|
(In millions, except per share amounts)
|
|
|
|
|
Year Ended December 31, 2010:
|
|
|
|
|
|
|
|
|
|
|
|
|
|
|
|
|
|
|
|
|
|
Revenues
|
|
$
|
1,483.6
|
|
|
$
|
1,240.0
|
|
|
$
|
1,218.3
|
|
|
$
|
1,527.3
|
|
|
$
|
5,469.2
|
|
|
Gross margin
|
|
|
185.9
|
|
|
|
182.3
|
|
|
|
186.2
|
|
|
|
227.1
|
|
|
|
781.5
|
|
|
Operating income
|
|
|
54.8
|
|
|
|
48.5
|
|
|
|
43.2
|
|
|
|
49.6
|
|
|
|
196.1
|
|
|
Net income (loss)
|
|
|
35.9
|
|
|
|
7.4
|
|
|
|
(4.2
|
)
|
|
|
24.2
|
|
|
|
63.3
|
|
|
Net income (loss) attributable to Targa Resources Corp.
|
|
|
21.9
|
|
|
|
(11.5
|
)
|
|
|
(17.4
|
)
|
|
|
(8.0
|
)
|
|
|
(15.0
|
)
|
|
Net income (loss) available to common
shareholders(1)
|
|
$
|
—
|
|
|
$
|
(191.8
|
)
|
|
$
|
(19.0
|
)
|
|
$
|
(9.0
|
)
|
|
$
|
(202.3
|
)
|
|
Net income (loss) per common
share — basic and diluted
|
|
$
|
—
|
|
|
$
|
(48.10
|
)
|
|
$
|
(3.77
|
)
|
|
$
|
(0.68
|
)
|
|
$
|
(30.94
|
)
|
|
Year Ended December 31, 2009:
|
|
|
|
|
|
|
|
|
|
|
|
|
|
|
|
|
|
|
|
|
|
Revenues
|
|
$
|
1,005.6
|
|
|
$
|
1,013.8
|
|
|
$
|
1,125.7
|
|
|
$
|
1,390.9
|
|
|
$
|
4,536.0
|
|
|
Gross margin
|
|
|
155.9
|
|
|
|
174.9
|
|
|
|
189.4
|
|
|
|
224.7
|
|
|
|
744.9
|
|
|
Operating income
|
|
|
25.4
|
|
|
|
48.5
|
|
|
|
50.1
|
|
|
|
93.2
|
|
|
|
217.2
|
|
|
Net income (loss)
|
|
|
(0.4
|
)
|
|
|
20.5
|
|
|
|
10.5
|
|
|
|
48.5
|
|
|
|
79.1
|
|
|
Net income (loss) attributable to Targa Resources Corp.
|
|
|
1.3
|
|
|
|
12.2
|
|
|
|
(0.5
|
)
|
|
|
16.3
|
|
|
|
29.3
|
|
|
Net income (loss) available to common shareholders
|
|
$
|
(3.0
|
)
|
|
$
|
—
|
|
|
$
|
(5.1
|
)
|
|
$
|
—
|
|
|
$
|
—
|
|
|
Net income (loss) per common
share — basic and diluted
|
|
$
|
(0.81
|
)
|
|
$
|
—
|
|
|
$
|
(3.77
|
)
|
|
$
|
—
|
|
|
$
|
—
|
|
|
|
|
|
(1) |
|
We paid dividends of $177.8 million to Series B
Preferred shareholders during the second quarter of 2010, which
reduces the net income available to common shares. |
F-45
SCHEDULE 1
CONDENSED
FINANCIAL INFORMATION OF REGISTRANT
Report of
Independent Registered Public Accounting Firm on Financial
Statement Schedule
To the Board of Directors and Stockholders of Targa Resources
Corp:
Our audits of the consolidated financial statements referred to
in our report dated February 25, 2011 appearing in the
Form 10-K
of Targa Resources Corp. (which report and consolidated
financial statements are included in a Form 10-K/A of Targa
Resources Corp.) also included an audit of the financial
statement schedule listed in Item 15(a)(2) of such
Form 10-K/A. In our opinion, this financial statement
schedule presents fairly, in all material respects, the
information set forth therein when read in conjunction with the
related consolidated financial statements.
/s/ PricewaterhouseCoopers LLP
Houston, Texas
February 25, 2011
F-46
| |
|
|
|
|
|
|
|
|
|
|
|
December 31,
|
|
|
|
|
2010
|
|
|
2009
|
|
|
|
|
(In millions)
|
|
|
|
|
ASSETS
|
|
Current assets
|
|
$
|
—
|
|
|
$
|
—
|
|
|
Long-term debt issue costs
|
|
|
0.6
|
|
|
|
2.8
|
|
|
Deferred income taxes
|
|
|
12.5
|
|
|
|
16.0
|
|
|
Investment in consolidated subsidiaries
|
|
|
223.2
|
|
|
|
762.4
|
|
|
|
|
|
|
|
|
|
|
|
|
Total assets
|
|
$
|
236.3
|
|
|
$
|
781.2
|
|
|
|
|
|
|
|
|
|
|
|
|
|
|
LIABILITIES AND STOCKHOLDERS’ EQUITY
|
|
Accrued current liabilities
|
|
$
|
2.7
|
|
|
$
|
—
|
|
|
Long-term debt
|
|
|
89.3
|
|
|
|
385.4
|
|
|
Commitments and contingencies
|
|
|
|
|
|
|
|
|
|
Convertible cumulative participating series B preferred
stock
|
|
|
—
|
|
|
|
308.4
|
|
|
Targa Resources Corp. stockholders’ equity
|
|
|
144.3
|
|
|
|
87.4
|
|
|
|
|
|
|
|
|
|
|
|
|
Total liabilities and stockholders’ equity
|
|
$
|
236.3
|
|
|
$
|
781.2
|
|
|
|
|
|
|
|
|
|
|
|
See accompanying note to condensed financial statements
F-47
| |
|
|
|
|
|
|
|
|
|
|
|
|
|
|
|
Year Ended December 31,
|
|
|
|
|
2010
|
|
|
2009
|
|
|
2008
|
|
|
|
|
(In millions, except per share amounts)
|
|
|
|
|
Equity in net income (loss) of consolidated subsidiaries
|
|
$
|
(16.3
|
)
|
|
$
|
30.9
|
|
|
$
|
51.8
|
|
|
General and administrative expenses
|
|
|
(20.5
|
)
|
|
|
(0.2
|
)
|
|
|
(0.5
|
)
|
|
Gain on sale of assets
|
|
|
1.1
|
|
|
|
|
|
|
|
|
|
|
|
|
|
|
|
|
|
|
|
|
|
|
|
|
Income (loss) from operations
|
|
|
(35.7
|
)
|
|
|
30.7
|
|
|
|
51.3
|
|
|
Other income (expense):
|
|
|
|
|
|
|
|
|
|
|
|
|
|
Gain on debt extinguishment
|
|
|
35.2
|
|
|
|
24.5
|
|
|
|
16.1
|
|
|
Interest expense
|
|
|
(11.2
|
)
|
|
|
(26.6
|
)
|
|
|
(37.9
|
)
|
|
|
|
|
|
|
|
|
|
|
|
|
|
|
|
Income (loss) before income taxes
|
|
|
(11.7
|
)
|
|
|
28.6
|
|
|
|
29.5
|
|
|
Deferred income tax (expense) benefit
|
|
|
(3.3
|
)
|
|
|
0.7
|
|
|
|
7.8
|
|
|
|
|
|
|
|
|
|
|
|
|
|
|
|
|
Net income (loss) attributable to Targa Resources Corp.
|
|
|
(15.0
|
)
|
|
|
29.3
|
|
|
|
37.3
|
|
|
Dividends on Series B preferred stock
|
|
|
(9.5
|
)
|
|
|
(17.8
|
)
|
|
|
(16.8
|
)
|
|
Undistributed earnings attributable to preferred shareholders
|
|
|
—
|
|
|
|
(11.5
|
)
|
|
|
(20.5
|
)
|
|
Dividends on common equivalents
|
|
|
(177.8
|
)
|
|
|
—
|
|
|
|
—
|
|
|
|
|
|
|
|
|
|
|
|
|
|
|
|
|
Net income (loss) available to common shareholders
|
|
$
|
(202.3
|
)
|
|
$
|
—
|
|
|
$
|
—
|
|
|
|
|
|
|
|
|
|
|
|
|
|
|
|
|
Net income (loss) available per common share
|
|
$
|
(30.94
|
)
|
|
$
|
—
|
|
|
$
|
—
|
|
|
Weighted average shares outstanding — basic and diluted
|
|
|
6.5
|
|
|
|
3.8
|
|
|
|
3.8
|
|
See accompanying note to condensed financial statements
F-48
TARGA RESOURCES
CORP.
PARENT ONLY
| |
|
|
|
|
|
|
|
|
|
|
|
|
|
|
|
Year Ended December 31,
|
|
|
|
|
2010
|
|
|
2009
|
|
|
2008
|
|
|
|
|
(In millions)
|
|
|
|
|
Net cash used in operating activities
|
|
$
|
(4.4
|
)
|
|
$
|
(6.2
|
)
|
|
$
|
(7.5
|
)
|
|
Investing activities
|
|
|
|
|
|
|
|
|
|
|
|
|
|
Distribution and return of advances from consolidated
subsidiaries
|
|
|
721.0
|
|
|
|
39.2
|
|
|
|
69.3
|
|
|
|
|
|
|
|
|
|
|
|
|
|
|
|
|
Net cash provided by investing activities
|
|
|
721.0
|
|
|
|
39.2
|
|
|
|
69.3
|
|
|
Financing activities:
|
|
|
|
|
|
|
|
|
|
|
|
|
|
Issuance of common stock
|
|
|
0.9
|
|
|
|
0.3
|
|
|
|
0.8
|
|
|
Repurchase of common stock
|
|
|
(0.1
|
)
|
|
|
—
|
|
|
|
(0.5
|
)
|
|
Repurchase of long-term debt
|
|
|
(269.3
|
)
|
|
|
(33.3
|
)
|
|
|
(62.1
|
)
|
|
Dividends to preferred shareholders
|
|
|
(210.1
|
)
|
|
|
—
|
|
|
|
—
|
|
|
Dividends to common and common equivalent shareholders
|
|
|
(238.0
|
)
|
|
|
—
|
|
|
|
—
|
|
|
|
|
|
|
|
|
|
|
|
|
|
|
|
|
Net cash used in financing activities
|
|
|
(716.6
|
)
|
|
|
(33.0
|
)
|
|
|
(61.8
|
)
|
|
Net increase (decrease) in cash and cash equivalents
|
|
|
—
|
|
|
|
—
|
|
|
|
—
|
|
|
Cash and cash equivalents — beginning of year
|
|
|
—
|
|
|
|
—
|
|
|
|
—
|
|
|
|
|
|
|
|
|
|
|
|
|
|
|
|
|
Cash and cash equivalents — end of year
|
|
$
|
—
|
|
|
$
|
—
|
|
|
$
|
—
|
|
|
|
|
|
|
|
|
|
|
|
|
|
|
|
See accompanying note to condensed financial statements
F-49
SCHEDULE I —
CONDENSED FINANCIAL INFORMATION OF REGISTRANT —
TARGA RESOURCES CORP.
NOTE TO CONDENSED FINANCIAL STATEMENTS
Note 1 —
Basis of Presentation
The condensed financial statements represent the financial
information required by
Rule 5-04
of the Securities and Exchange Commission
Regulation S-X
for Targa Resources Corp.
In the condensed financial statements, Targa’s investments
in consolidated subsidiaries are presented under the equity
method of accounting. Under this method, the assets and
liabilities of affiliates are not consolidated. The investments
in net assets of the consolidated subsidiaries are recorded in
the balance sheets. The income (loss) from operations of the
consolidated subsidiaries is reported as equity in income (loss)
of consolidated subsidiaries.
A substantial amount of Targa’s operating, investing and
financing activities are conducted by its affiliates. The
condensed financial statements should be read in conjunction
with Targa’s consolidated financial statements, which begin
on
page F-3
of this Prospectus.
F-50
APPENDIX A
GLOSSARY OF
SELECTED TERMS
As generally used in the energy industry and in this
registration statement, the identified terms have the following
meanings:
| |
|
|
|
Abbreviation
|
|
Term
|
|
|
|
Bbl
|
|
Barrels (equal to 42 gallons)
|
|
BBtu
|
|
Billion British thermal units
|
|
/d
|
|
Per day
|
|
gal
|
|
Gallons
|
|
MBbl
|
|
Thousand barrels
|
|
Mcf
|
|
Thousand cubic feet
|
|
MMBbl
|
|
Million barrels
|
|
MMBtu
|
|
Million British thermal units
|
|
MMcf
|
|
Million cubic feet
|
A-1
5,650,000 Shares
Targa Resources Corp.
Common Stock
Prospectus
, 2011
Barclays Capital
Morgan Stanley
BofA Merrill Lynch
Citi
Deutsche Bank Securities
Credit Suisse
J.P. Morgan
Wells Fargo Securities
Raymond James
RBC Capital Markets
UBS Investment Bank
Baird
ING
PART II
INFORMATION NOT
REQUIRED IN PROSPECTUS
|
|
|
Item 13.
|
Other Expenses
of Issuance and Distribution
|
Set forth below are the expenses (other than underwriting
discounts and commissions) expected to be incurred in connection
with the issuance and distribution of the securities registered
hereby. With the exception of the SEC Registration Fee and the
FINRA Filing Fee the amounts set forth below are estimates. The
selling stockholders will not bear any portion of such expenses.
| |
|
|
|
|
|
|
|
|
|
SEC Registration Fee
|
|
$
|
26,888
|
|
|
|
|
|
|
FINRA Filing Fee
|
|
|
23,660
|
|
|
|
|
|
|
Accountants’ fees and expenses
|
|
|
75,000
|
|
|
|
|
|
|
Legal fees and expenses
|
|
|
250,000
|
|
|
|
|
|
|
Printing and engraving expenses
|
|
|
350,000
|
|
|
|
|
|
|
Transfer agent and registrar fees
|
|
|
5,000
|
|
|
|
|
|
|
Miscellaneous
|
|
|
20,000
|
|
|
|
|
|
|
|
|
|
|
|
|
|
|
|
|
Total
|
|
$
|
750,548
|
|
|
|
|
|
|
|
|
|
|
|
|
|
|
|
|
|
|
Item 14.
|
Indemnification
of Directors and Officers
|
Our bylaws provide that a director will not be liable to the
corporation or its stockholders for monetary damages for breach
of fiduciary duty as a director, except for liability
(1) for any breach of the director’s duty of loyalty
to the corporation or its stockholders, (2) for acts or
omissions not in good faith or which involved intentional
misconduct or a knowing violation of the law, (3) under
section 174 of the DGCL for unlawful payment of dividends
or improper redemption of stock or (4) for any transaction
from which the director derived an improper personal benefit. In
addition, if the DGCL is amended to authorize the further
elimination or limitation of the liability of directors, then
the liability of a director of the corporation, in addition to
the limitation on personal liability provided for in our
certificate of incorporation, will be limited to the fullest
extent permitted by the amended DGCL. Our bylaws further provide
that the corporation will indemnify, and advance expenses to,
any officer or director to the fullest extent authorized by the
DGCL.
Section 145 of the DGCL provides that a corporation may
indemnify directors and officers as well as other employees and
individuals against expenses, including attorneys’ fees,
judgments, fines and amounts paid in settlement in connection
with specified actions, suits and proceedings whether civil,
criminal, administrative, or investigative, other than a
derivative action by or in the right of the corporation, if they
acted in good faith and in a manner they reasonably believed to
be in or not opposed to the best interests of the corporation
and, with respect to any criminal action or proceeding, had no
reasonable cause to believe their conduct was unlawful. A
similar standard is applicable in the case of derivative
actions, except that indemnification extends only to expenses,
including attorneys’ fees, incurred in connection with the
defense or settlement of such action and the statute requires
court approval before there can be any indemnification where the
person seeking indemnification has been found liable to the
corporation. The statute provides that it is not exclusive of
other indemnification that may be granted by a
corporation’s certificate of incorporation, bylaws,
disinterested director vote, stockholder vote, agreement or
otherwise.
Our certificate of incorporation also contains indemnification
rights for our directors and our officers. Specifically, our
certificate of incorporation provides that we shall indemnify
the personal liability of each director of the corporation for
monetary damages for breach of fiduciary duties as a director
shall be eliminated and limited to the full extent permitted by
the laws of the State of Delaware. Further, our bylaws provide
that we may maintain insurance on behalf of our officers and
directors against expense, liability or loss asserted incurred
by them in their capacities as officers and directors.
II-1
We have obtained directors’ and officers’ insurance to
cover our directors, officers and some of our employees for
certain liabilities.
We have entered into written indemnification agreements with our
directors and executive officers. Under these proposed
agreements, if an officer or director makes a claim of
indemnification to us, either a majority of the independent
directors or independent legal counsel selected by the
independent directors must review the relevant facts and make a
determination whether the officer or director has met the
standards of conduct under Delaware law that would permit (under
Delaware law) and require (under the indemnification agreement)
us to indemnify the officer or director.
|
|
|
Item 15.
|
Recent Sales
of Unregistered Securities
|
In April 2008, pursuant to our 2005 Stock Incentive Plan we
issued 20,000 shares of restricted stock and 170,000 stock
options with an exercise price of $3.45 to members of
management. In August 2008, also pursuant to our 2005 Stock
Incentive Plan, we issued 10,000 stock options with an exercise
price of $6.00 to members of management. In April 2010, also
pursuant to our 2005 Stock Incentive Plan, we issued
61,418 shares of restricted stock and 93,593 stock options
with an exercise price of $3.55 to members of our management.
None of these four transactions involved any underwriters or
public offerings, and we believe that each of these transactions
was exempt from the registration requirements pursuant to
Section 4(2) of the Securities Act.
|
|
|
Item 16.
|
Exhibits and
Financial Statement Schedules
|
(a) Exhibits
The following documents are filed as exhibits to this
registration:
| |
|
|
|
|
|
|
|
|
|
|
|
|
|
|
|
|
1
|
.1***
|
|
—
|
|
Form of Underwriting Agreement
|
|
|
|
|
|
|
|
|
|
|
2
|
.1**
|
|
—
|
|
Purchase and Sale Agreement, dated as of September 18,
2007, by and between Targa Resources Holdings LP and Targa
Resources Partners LP (incorporated by reference to
Exhibit 2.1 to Targa Resources Partners LP’s Current
Report on
Form 8-K
filed September 21, 2007 (File
No. 001-33303)).
|
|
|
|
|
|
|
|
|
|
|
2
|
.2
|
|
—
|
|
Amendment to Purchase and Sale Agreement, dated October 1,
2007, by and between Targa Resources Holdings LP and Targa
Resources Partners LP (incorporated by reference to
Exhibit 2.2 to Targa Resources Partners LP’s Current
Report on
Form 8-K
filed October 24, 2007 (File
No. 001-33303)).
|
|
|
|
|
|
|
|
|
|
|
2
|
.3
|
|
—
|
|
Purchase and Sale Agreement dated July 27, 2009, by and
between Targa Resources Partners LP, Targa GP Inc. and Targa LP
Inc. (incorporated by reference to Exhibit 2.1 to Targa
Resources Partners LP’s Current Report on
Form 8-K
filed July 29, 2009 (File
No. 001-33303)).
|
|
|
|
|
|
|
|
|
|
|
2
|
.4
|
|
—
|
|
Purchase and Sale Agreement, dated as of March 31, 2010, by
and among Targa Resources Partners LP, Targa LP Inc., Targa
Permian GP LLC and Targa Midstream Holdings LLC (incorporated by
reference to Exhibit 2.1 to Targa Resources Partners
LP’s Current Report on
Form 8-K
filed April 1, 2010 (File
No. 001-33303)).
|
|
|
|
|
|
|
|
|
|
|
2
|
.5
|
|
—
|
|
Purchase and Sale Agreement, dated as of August 6, 2010, by
and among Targa Resources Partners LP and Targa Versado Holdings
LP (incorporated by reference to Exhibit 2.1 to Targa
Resources Partners LP’s Current Report on
Form 8-K
filed August 9, 2010 (File
No. 001-33303)).
|
|
|
|
|
|
|
|
|
|
|
2
|
.6
|
|
—
|
|
Purchase and Sale Agreement, dated September 13, 2010, by
and between Targa Resources Partners LP and Targa Versado
Holdings LP (incorporated by reference to Exhibit 2.1 to
Targa Resources Partners LP’s Current Report on
Form 8-K
filed September 17, 2010 (File
No. 001-33303)).
|
II-2
| |
|
|
|
|
|
|
|
|
|
|
|
|
|
|
|
|
3
|
.1
|
|
—
|
|
Amended and Restated Certificate of Incorporation of Targa
Resources Corp. (incorporated by reference to Exhibit 3.1
to Targa Resources Corp.’s Current Report on
Form 8-K
filed December 16, 2010 (File
No. 001-34991)).
|
|
|
|
|
|
|
|
|
|
|
3
|
.2
|
|
—
|
|
Form of Amended and Restated Bylaws of Targa Resources Corp.
(incorporated by reference to Exhibit 3.1 to Targa
Resources Corp.’s Current Report on
Form 8-K
filed December 16, 2010 (File
No. 001-34991)).
|
|
|
|
|
|
|
|
|
|
|
3
|
.3
|
|
—
|
|
Certificate of Limited Partnership of Targa Resources Partners
LP (incorporated by reference to Exhibit 3.2 to Targa
Resources Partners LP’s Registration Statement on
Form S-1
filed November 16, 2006 (File
No. 333-138747)).
|
|
|
|
|
|
|
|
|
|
|
3
|
.4
|
|
—
|
|
Certificate of Formation of Targa Resources GP LLC (incorporated
by reference to Exhibit 3.3 to Targa Resources Partners
LP’s Registration Statement on
Form S-1/A
filed January 19, 2007 (File
No. 333-138747)).
|
|
|
|
|
|
|
|
|
|
|
3
|
.5
|
|
—
|
|
First Amended and Restated Agreement of Limited Partnership of
Targa Resources Partners LP (incorporated by reference to
Exhibit 3.1 to Targa Resources Partners LP’s current
report on
Form 8-K
filed February 16, 2007 (File
No. 001-33303)).
|
|
|
|
|
|
|
|
|
|
|
3
|
.6
|
|
—
|
|
Amendment No. 1 to First Amended and Restated Agreement of
Limited Partnership of Targa Resources Partners LP (incorporated
by reference to Exhibit 3.5 to Targa Resources Partners
LP’s Quarterly Report on
Form 10-Q
filed May 14, 2008 (File
No. 001-33303)).
|
|
|
|
|
|
|
|
|
|
|
3
|
.7
|
|
—
|
|
Limited Liability Company Agreement of Targa Resources GP LLC
(incorporated by reference to Exhibit 3.4 to Targa
Resources Partners LP’s Registration Statement on
Form S-1/A
filed January 19, 2007 (File
No. 333-138747)).
|
|
|
|
|
|
|
|
|
|
|
3
|
.8
|
|
—
|
|
Amended and Restated Certificate of Incorporation of Targa
Resources, Inc. (incorporated by reference to Exhibit 3.1
to Targa Resources, Inc.’s Registration Statement on
Form S-4
filed October 31, 2007 (File
No. 333-147066)).
|
|
|
|
|
|
|
|
|
|
|
3
|
.9
|
|
—
|
|
Amendment to Amended and Restated Certificate of Incorporation
of Targa Resources, Inc. (incorporated by reference to
Exhibit 3.9 of Targa Resources Corp.’s Annual Report
of
Form 10-K
filed February 28, 2011 (File
No. 001-34991)).
|
|
|
|
|
|
|
|
|
|
|
3
|
.10
|
|
—
|
|
Amended and Restated Bylaws of Targa Resources, Inc.
(incorporated by reference to Exhibit 3.2 to Targa
Resources, Inc.’s Registration Statement on
Form S-4
filed October 31, 2007 (File
No. 333-147066)).
|
|
|
|
|
|
|
|
|
|
|
4
|
.1
|
|
—
|
|
Specimen Common Stock Certificate (incorporated by reference to
Exhibit 4.1 to Targa Resources Corp.’s Registration
Statement on
Form S-1/A
filed November 12, 2010 (File
No. 333-169277)).
|
|
|
|
|
|
|
|
|
|
|
5
|
.1*
|
|
—
|
|
Opinion of Vinson & Elkins L.L.P. as to the legality
of the securities registered hereby.
|
|
|
|
|
|
|
|
|
|
|
10
|
.1
|
|
—
|
|
Credit Agreement, dated as of January 5, 2010 among Targa
Resources, Inc., as the borrower, Deutsche Bank
Trust Company Americas, as the administrative agent,
Deutsche Bank Securities Inc. and Credit Suisse Securities (USA)
LLC, as joint lead arrangers, Credit Suisse Securities (USA) LLC
and Citadel Securities LLC, as the co-syndication agents,
Deutsche Bank Securities Inc., Credit Suisse Securities (USA)
LLC, Citadel Securities LLC, Banc of America Securities LLC and
Barclays Capital, as joint book runners, Bank of America, N.A.,
Barclays Bank PLC and ING Capital LLC, as the co-documentation
agents and the other lenders party thereto (incorporated by
reference to Exhibit 4.1 to Targa Resources Corp.’s
Registration Statement on
Form S-1/A
filed November 12, 2010 (File
No. 333-169277)).
|
|
|
|
|
|
|
|
|
|
|
10
|
.2
|
|
—
|
|
Amendment No. 1 to Credit Agreement, dated
November 12, 2010 among TRI Resources Inc., as the
Borrower, Deutsche Bank Trust Company Americas, Credit
Suisse AG, Cayman Islands Branch, Bank of America, N.A., ING
Capital LLC and Barclays Bank PLC, as Lenders, and Deutsche Bank
Trust Company Americas, as Administrative Agent
(incorporated by reference to Exhibit 10.94 to Targa
Resources Corp.’s Registration Statement on
Form S-1/A
filed November 16, 2010 (File
No. 333-169277)).
|
II-3
| |
|
|
|
|
|
|
|
|
|
|
|
|
|
|
|
|
10
|
.3
|
|
—
|
|
Holdco Credit Agreement, dated as of August 9, 2007 among
Targa Resources Investments Inc., as the borrower, Credit
Suisse, as the administrative agent, Credit Suisse Securities
(USA) LLC and Deutsche Bank Securities Inc. and, as joint lead
arrangers, Deutsche Bank Securities Inc., as the syndication
agent, Credit Suisse Securities (USA) LLC, Deutsche Bank
Securities Inc., Lehman Brothers, Inc. and Merrill Lynch Capital
Corporation, as joint book runners, Lehman Commercial Paper Inc.
and Merrill Lynch Capital Corporation, as the co-documentation
agents and the other lenders party thereto (incorporated by
reference to Exhibit 4.1 to Targa Resources Corp.’s
Registration Statement on
Form S-1/A
filed November 12, 2010 (File
No. 333-169277)).
|
|
|
|
|
|
|
|
|
|
|
10
|
.4
|
|
—
|
|
Amendment No. 1 to Holdco Credit Agreement, dated
January 5, 2010 among Targa Resources Investments Inc., as
the Borrower, Targa Resources, Inc., as Lender, Targa Capital,
LLC, as Lender, and Credit Suisse AG, Cayman Islands Brach, as
Administrative Agent (incorporated by reference to
Exhibit 10.92 to Targa Resources Corp.’s Registration
Statement on
Form S-1/A
filed November 12, 2010 (File
No. 333-169277)).
|
|
|
|
|
|
|
|
|
|
|
10
|
.5
|
|
—
|
|
Amended and Restated Credit Agreement, dated July 19, 2010,
by and among Targa Resources Partners LP, as the borrower, Bank
of America, N.A., as the administrative agent, Wells Fargo Bank,
National Association and the Royal Bank of Scotland plc, as the
co-syndication agents, Deutsche Bank Securities Inc. and
Barclays Bank PLC, as the co-documentation agents, Banc of
America Securities LLC, Wells Fargo Securities, LLC and RBS
Securities Inc., as joint lead arrangers and co-book managers
and the other lenders part thereto (incorporated by reference to
Exhibit 10.1 to Targa Resources Partners LP’s
Form 8-K
filed on July 21, 2010 (File
No. 001-33303)).
|
|
|
|
|
|
|
|
|
|
|
10
|
.6
|
|
—
|
|
Targa Resources Investments Inc. Amended and Restated
Stockholders’ Agreement dated as of October 28, 2005
(incorporated by reference to Exhibit 10.2 to Targa
Resources Inc.’s Registration Statement on
Form S-4/A
filed December 18, 2007 (File
No. 333-147066)).
|
|
|
|
|
|
|
|
|
|
|
10
|
.7
|
|
—
|
|
First Amendment to Amended and Restated Stockholders’
Agreement, dated January 26, 2006 (incorporated by
reference to Exhibit 10.3 to Targa Resources Inc.’s
Registration Statement on
Form S-4/A
filed December 18, 2007 (File
No. 333-147066)).
|
|
|
|
|
|
|
|
|
|
|
10
|
.8
|
|
—
|
|
Second Amendment to Amended and Restated Stockholders’
Agreement, dated March 30, 2007 (incorporated by reference
to Exhibit 10.4 to Targa Resources Inc.’s Registration
Statement on
Form S-4/A
filed December 18, 2007 (File
No. 333-147066)).
|
|
|
|
|
|
|
|
|
|
|
10
|
.9
|
|
—
|
|
Third Amendment to Amended and Restated Stockholders’
Agreement, dated May 1, 2007 (incorporated by reference to
Exhibit 10.5 to Targa Resources Inc.’s Registration
Statement on
Form S-4/A
filed December 18, 2007 (File
No. 333-147066)).
|
|
|
|
|
|
|
|
|
|
|
10
|
.10
|
|
—
|
|
Fourth Amendment to Amended and Restated Stockholders’
Agreement, dated December 7, 2007 (incorporated by
reference to Exhibit 10.6 to Targa Resources Inc.’s
Registration Statement on
Form S-4/A
filed December 18, 2007 (File
No. 333-147066)).
|
|
|
|
|
|
|
|
|
|
|
10
|
.11
|
|
—
|
|
Fifth Amendment to Amended and Restated Stockholders’
Agreement, dated December 1, 2009 (incorporated by
reference to Exhibit 10.1 to Targa Resources, Inc.’s
Current Report on
Form 8-K
filed December 2, 2009 (File
No. 333-147066)).
|
|
|
|
|
|
|
|
|
|
|
10
|
.12
|
|
—
|
|
Form of Sixth Amendment to Amended and Restated
Stockholders’ Agreement (incorporated by reference to
Exhibit 10.11 to Targa Resources Corp.’s Registration
Statement on
Form S-1/A
filed November 12, 2010 (File
No. 333-169277)).
|
|
|
|
|
|
|
|
|
|
|
10
|
.13+
|
|
—
|
|
Targa Resources Investments Inc. 2005 Stock Incentive Plan
(incorporated by reference to Exhibit 10.10 to Targa
Resources Inc.’s Registration Statement on
Form S-4/A
filed December 18, 2007 (File
No. 333-147066)).
|
|
|
|
|
|
|
|
|
|
|
10
|
.14+
|
|
—
|
|
First Amendment to Targa Resources Investments Inc. 2005 Stock
Incentive Plan (incorporated by reference to Exhibit 10.11
to Targa Resources Inc.’s Registration Statement on
Form S-4/A
filed December 18, 2007 (File
No. 333-147066)).
|
II-4
| |
|
|
|
|
|
|
|
|
|
|
|
|
|
|
|
|
10
|
.15+
|
|
—
|
|
Second Amendment to Targa Resources Investments Inc. 2005 Stock
Incentive Plan (incorporated by reference to Exhibit 10.12
to Targa Resources Inc.’s Registration Statement on
Form S-4/A
filed December 18, 2007 (File
No. 333-147066)).
|
|
|
|
|
|
|
|
|
|
|
10
|
.16+
|
|
—
|
|
Form of Targa Resources Investments Inc. Nonstatutory Stock
Option Agreement (Non-Employee Directors) (incorporated by
reference to Exhibit 10.13 to Targa Resources Inc.’s
Registration Statement on
Form S-4/A
filed December 18, 2007 (File
No. 333-147066)).
|
|
|
|
|
|
|
|
|
|
|
10
|
.17+
|
|
—
|
|
Form of Targa Resources Investments Inc. Nonstatutory Stock
Option Agreement
(Non-Director
Management and Other Employees) (incorporated by reference to
Exhibit 10.14 to Targa Resources Inc.’s Registration
Statement on
Form S-4/A
filed December 18, 2007 (File
No. 333-147066)).
|
|
|
|
|
|
|
|
|
|
|
10
|
.18+
|
|
—
|
|
Form of Targa Resources Investments Inc. Incentive Stock Option
Agreement (incorporated by reference to Exhibit 10.15 to
Targa Resources Inc.’s Registration Statement on
Form S-4/A
filed December 18, 2007 (File
No. 333-147066)).
|
|
|
|
|
|
|
|
|
|
|
10
|
.19+
|
|
—
|
|
Form of Targa Resources Investments Inc. Restricted Stock
Agreement (incorporated by reference to Exhibit 10.16 to
Targa Resources Inc.’s Registration Statement on
Form S-4/A
filed December 18, 2007 (File
No. 333-147066)).
|
|
|
|
|
|
|
|
|
|
|
10
|
.20+
|
|
—
|
|
Form of Targa Resources Investments Inc. Restricted Stock
Agreement (relating to preferred stock option exchange for
directors) (incorporated by reference to Exhibit 10.17 to
Targa Resources Inc.’s Registration Statement on
Form S-4/A
filed December 18, 2007 (File
No. 333-147066)).
|
|
|
|
|
|
|
|
|
|
|
10
|
.21+
|
|
—
|
|
Form of Targa Resources Investments Inc. Restricted Stock
Agreement (relating to preferred stock option exchange for
employees) (incorporated by reference to Exhibit 10.18 to
Targa Resources Inc.’s Registration Statement on
Form S-4/A
filed December 18, 2007 (File
No. 333-147066)).
|
|
|
|
|
|
|
|
|
|
|
10
|
.22+
|
|
—
|
|
Targa Resources Corp. 2010 Stock Incentive Plan (incorporated by
reference to Exhibit 4.3 of Targa Resources Corp.’s
Registration Statement on
Form S-8
filed December 9, 2010 (File
No. 333-171082)).
|
|
|
|
|
|
|
|
|
|
|
10
|
.23+
|
|
—
|
|
Form of Targa Resources Corp. Restricted Stock
Agreement — 2010 (incorporated by reference to
Exhibit 4.4 of Targa Resources Corp.’s Registration
Statement on
Form S-8
filed December 9, 2010 (File
No. 333-171082)).
|
|
|
|
|
|
|
|
|
|
|
10
|
.24+
|
|
—
|
|
Form of Targa Resources Corp. 2011 Restricted Stock
Agreement — 2011 (incorporated by reference to
Exhibit 10.2 of Targa Resources Corp.’s Current Report
on
Form 8-K
filed February 18, 2011 (File
No. 001-34991)).
|
|
|
|
|
|
|
|
|
|
|
10
|
.25+
|
|
—
|
|
Targa Resources Investments Inc. Long-Term Incentive Plan
(incorporated by reference to Exhibit 10.27 to Targa
Resources Inc.’s Registration Statement on
Form S-4/A
filed December 18, 2007 (File
No. 333-147066)).
|
|
|
|
|
|
|
|
|
|
|
10
|
.26+
|
|
—
|
|
Targa Resources Investments Inc. 2008 Annual Incentive
Compensation Plan (incorporated by reference to
Exhibit 10.13 to Targa Resources Partners LP’s Annual
Report on
Form 10-K
filed February 27, 2009 (File
No. 001-33303)).
|
|
|
|
|
|
|
|
|
|
|
10
|
.27+
|
|
—
|
|
Targa Resources Investments Inc. 2009 Annual Incentive
Compensation Plan (incorporated by reference to
Exhibit 10.14 to Targa Resources Partners LP’s Annual
Report on
Form 10-K
filed February 27, 2009 (File
No. 001-33303)).
|
|
|
|
|
|
|
|
|
|
|
10
|
.28+
|
|
—
|
|
Targa Resources Investments Inc. 2010 Annual Incentive
Compensation Plan (incorporated by reference to
Exhibit 10.22 to Targa Resources Partners LP’s Annual
Report on
Form 10-K
filed March 4, 2010 (File
No. 001-33303)).
|
|
|
|
|
|
|
|
|
|
|
10
|
.29+
|
|
—
|
|
Targa Resources Corp. 2011 Annual Incentive Compensation Plan
(incorporated by reference to Exhibit 10.27 to Targa
Resources Partners LP’s Annual Report on
Form 10-K
filed February 25, 2011 (File
No. 001-33303)).
|
II-5
| |
|
|
|
|
|
|
|
|
|
|
|
|
|
|
|
|
10
|
.30+
|
|
—
|
|
Targa Resources Partners LP Long-Term Incentive Plan
(incorporated by reference to Exhibit 10.2 to Targa
Resources Partners LP’s Registration Statement on
Form S-1/A
filed February 1, 2007 (File
No. 333-138747)).
|
|
|
|
|
|
|
|
|
|
|
10
|
.31+
|
|
—
|
|
Form of Targa Resources Partners LP Restricted Unit Grant
Agreement — 2007 (incorporated by reference to
Exhibit 10.2 to Targa Resources Partners LP’s Current
Report on
Form 8-K
filed February 13, 2007 (File
No. 001-33303)).
|
|
|
|
|
|
|
|
|
|
|
10
|
.32+
|
|
—
|
|
Form of Targa Resources Partners LP Restricted Unit Grant
Agreement — 2010 (incorporated by reference to
Exhibit 10.15 to Targa Resources Partners LP’s
Form 10-K
filed March 4, 2010 (File
No. 001-33303)).
|
|
|
|
|
|
|
|
|
|
|
10
|
.33+
|
|
—
|
|
Form of Targa Resources Partners LP Performance Unit Grant
Agreement — 2007 (incorporated by reference to
Exhibit 10.3 to Targa Resources Partners LP’s Current
Report on
Form 8-K
filed with the SEC on February 13, 2007 (File
No. 001-33303)).
|
|
|
|
|
|
|
|
|
|
|
10
|
.34+
|
|
—
|
|
Form of Targa Resources Partners LP Performance Unit Grant
Agreement — 2008 (incorporated by reference to
Exhibit 10.2 to Targa Resources Partners LP’s Current
Report on
Form 8-K
filed January 22, 2008 (File
No. 001-33303)).
|
|
|
|
|
|
|
|
|
|
|
10
|
.35+
|
|
—
|
|
Form of Targa Resources Partners LP Performance Unit Grant
Agreement — 2009 (incorporated by reference to
Exhibit 10.2 to Targa Resources Partners LP’s Current
Report on
Form 8-K
filed January 28, 2009 (File
No. 001-33303)).
|
|
|
|
|
|
|
|
|
|
|
10
|
.36+
|
|
—
|
|
Form of Targa Resources Partners LP Performance Unit Grant
Agreement — 2010 (incorporated by reference to
Exhibit 10.2 to Targa Resources Partners LP’s Current
Report on
Form 8-K
filed December 7, 2009 (File
No. 001-33303)).
|
|
|
|
|
|
|
|
|
|
|
10
|
.37+
|
|
—
|
|
Form of Targa Resources Partners LP Performance Unit Grant
Agreement — 2011 (incorporated by reference to
Exhibit 10.2 to Targa Resources Partners LP’s Current
Report on
Form 8-K
filed February 18, 2011) (File
No. 001-33303)).
|
|
|
|
|
|
|
|
|
|
|
10
|
.38
|
|
—
|
|
Indenture dated June 18, 2008, among Targa Resources
Partners LP, Targa Resources Partners Finance Corporation, the
Guarantors named therein and U.S. Bank National Association
(incorporated by reference to Exhibit 4.1 to Targa
Resources, Inc.’s
Form 10-Q
filed August 11, 2008 (File
No. 333-147066)).
|
|
|
|
|
|
|
|
|
|
|
10
|
.39
|
|
—
|
|
Supplemental Indenture dated September 24, 2009 to
Indenture dated June 18, 2008, among Targa Downstream GP
LLC, a subsidiary of Targa Resources Partners LP, Targa
Resources Partners Finance Corporation, the other Subsidiary
Guarantors and U.S. Bank National Association (incorporated by
reference to Exhibit 4.3 to Targa Resources Partners
LP’s Quarterly Report on
Form 10-Q
filed November 9, 2009 (File
No. 001-33303)).
|
|
|
|
|
|
|
|
|
|
|
10
|
.40
|
|
—
|
|
Supplemental Indenture dated September 24, 2009 to
Indenture dated June 18, 2008, among Targa Downstream LP, a
subsidiary of Targa Resources Partners LP, Targa Resources
Partners Finance Corporation, the other Subsidiary Guarantors
and U.S. Bank National Association (incorporated by reference to
Exhibit 4.5 to Targa Resources Partners LP’s Quarterly
Report on
Form 10-Q
filed November 9, 2009 (File
No. 001-33303)).
|
|
|
|
|
|
|
|
|
|
|
10
|
.41
|
|
—
|
|
Supplemental Indenture dated September 24, 2009 to
Indenture dated June 18, 2008, among Targa LSNG GP LLC, a
subsidiary of Targa Resources Partners LP, Targa Resources
Partners Finance Corporation, the other Subsidiary Guarantors
and U.S. Bank National Association (incorporated by reference to
Exhibit 4.7 to Targa Resources Partners LP’s Quarterly
Report on
Form 10-Q
filed November 9, 2009 (File
No. 001-33303)).
|
|
|
|
|
|
|
|
|
|
|
10
|
.42
|
|
—
|
|
Supplemental Indenture dated September 24, 2009 to
Indenture dated June 18, 2008, among Targa LSNG LP, a
subsidiary of Targa Resources Partners LP, Targa Resources
Partners Finance Corporation, the other Subsidiary Guarantors
and U.S. Bank National Association (incorporated by reference to
Exhibit 4.9 to Targa Resources Partners LP’s Quarterly
Report on
Form 10-Q
filed November 9, 2009 (File
No. 001-33303)).
|
II-6
| |
|
|
|
|
|
|
|
|
|
|
|
|
|
|
|
|
10
|
.43
|
|
—
|
|
Supplemental Indenture dated September 24, 2009 to
Indenture dated June 18, 2008, among Targa Sparta LLC, a
subsidiary of Targa Resources Partners LP, Targa Resources
Partners Finance Corporation, the other Subsidiary Guarantors
and U.S. Bank National Association (incorporated by reference to
Exhibit 4.11 to Targa Resources Partners LP’s
Quarterly Report on
Form 10-Q
filed November 9, 2009 (File
No. 001-33303)).
|
|
|
|
|
|
|
|
|
|
|
10
|
.44
|
|
—
|
|
Supplemental Indenture dated September 24, 2009 to
Indenture dated June 18, 2008, among Midstream Barge
Company LLC, a subsidiary of Targa Resources Partners LP, Targa
Resources Partners Finance Corporation, the other Subsidiary
Guarantors and U.S. Bank National Association (incorporated by
reference to Exhibit 4.13 to Targa Resources Partners
LP’s Quarterly Report on
Form 10-Q
filed November 9, 2009 (File
No. 001-33303)).
|
|
|
|
|
|
|
|
|
|
|
10
|
.45
|
|
—
|
|
Supplemental Indenture dated September 24, 2009 to
Indenture dated June 18, 2008, among Targa Retail Electric
LLC, a subsidiary of Targa Resources Partners LP, Targa
Resources Partners Finance Corporation, the other Subsidiary
Guarantors and U.S. Bank National Association (incorporated by
reference to Exhibit 4.15 to Targa Resources Partners
LP’s Quarterly Report on
Form 10-Q
filed November 9, 2009 (File
No. 001-33303)).
|
|
|
|
|
|
|
|
|
|
|
10
|
.46
|
|
—
|
|
Supplemental Indenture dated September 24, 2009 to
Indenture dated June 18, 2008, among Targa NGL Pipeline
Company LLC, a subsidiary of Targa Resources Partners LP, Targa
Resources Partners Finance Corporation, the other Subsidiary
Guarantors and U.S. Bank National Association (incorporated by
reference to Exhibit 4.17 to Targa Resources Partners
LP’s Quarterly Report on
Form 10-Q
filed November 9, 2009 (File
No. 001-33303)).
|
|
|
|
|
|
|
|
|
|
|
10
|
.47
|
|
—
|
|
Supplemental Indenture dated September 24, 2009 to
Indenture dated June 18, 2008, among Targa Transport LLC, a
subsidiary of Targa Resources Partners LP, Targa Resources
Partners Finance Corporation, the other Subsidiary Guarantors
and U.S. Bank National Association (incorporated by reference to
Exhibit 4.19 to Targa Resources Partners LP’s
Quarterly Report on
Form 10-Q
filed November 9, 2009 (File
No. 001-33303)).
|
|
|
|
|
|
|
|
|
|
|
10
|
.48
|
|
—
|
|
Supplemental Indenture dated September 24, 2009 to
Indenture dated June 18, 2008, among Targa Co-Generation
LLC, a subsidiary of Targa Resources Partners LP, Targa
Resources Partners Finance Corporation, the other Subsidiary
Guarantors and U.S. Bank National Association (incorporated by
reference to Exhibit 4.21 to Targa Resources Partners
LP’s Quarterly Report on
Form 10-Q
filed November 9, 2009 (File
No. 001-33303)).
|
|
|
|
|
|
|
|
|
|
|
10
|
.49
|
|
—
|
|
Supplemental Indenture dated September 24, 2009 to
Indenture dated June 18, 2008, among Targa Liquids GP LLC,
a subsidiary of Targa Resources Partners LP, Targa Resources
Partners Finance Corporation, the other Subsidiary Guarantors
and U.S. Bank National Association (incorporated by reference to
Exhibit 4.23 to Targa Resources Partners LP’s
Quarterly Report on
Form 10-Q
filed November 9, 2009 (File
No. 001-33303)).
|
|
|
|
|
|
|
|
|
|
|
10
|
.50
|
|
—
|
|
Supplemental Indenture dated September 24, 2009 to
Indenture dated June 18, 2008, among Targa Liquids
Marketing and Trade, a subsidiary of Targa Resources Partners
LP, Targa Resources Partners Finance Corporation, the other
Subsidiary Guarantors and U.S. Bank National Association
(incorporated by reference to Exhibit 4.25 to Targa
Resources Partners LP’s Quarterly Report on
Form 10-Q
filed November 9, 2009 (File
No. 001-33303)).
|
|
|
|
|
|
|
|
|
|
|
10
|
.51
|
|
—
|
|
Supplemental Indenture dated April 27, 2010 to Indenture
dated June 18, 2008, among Targa Gas Marketing LLC, a
subsidiary of Targa Resources Partners LP, Targa Resources
Partners Finance Corporation, the other Subsidiary Guarantors
and U.S. Bank National Association (incorporated by reference to
Exhibit 4.1 to Targa Resources Partners LP’s Quarterly
Report on
Form 10-Q
filed May 6, 2010 (File
No. 001-33303)).
|
|
|
|
|
|
|
|
|
|
|
10
|
.52
|
|
—
|
|
Supplemental Indenture dated April 27, 2010 to Indenture
dated June 18, 2008, among Targa Midstream Services Limited
Partnership, a subsidiary of Targa Resources Partners LP, Targa
Resources Partners Finance Corporation, the other Subsidiary
Guarantors and U.S. Bank National Association (incorporated by
reference to Exhibit 4.3 to Targa Resources Partners
LP’s Quarterly Report on
Form 10-Q
filed May 6, 2010 (File
No. 001-33303)).
|
II-7
| |
|
|
|
|
|
|
|
|
|
|
|
|
|
|
|
|
10
|
.53
|
|
—
|
|
Supplemental Indenture dated April 27, 2010 to Indenture
dated June 18, 2008, among Targa Permian LP, a subsidiary
of Targa Resources Partners LP, Targa Resources Partners Finance
Corporation, the other Subsidiary Guarantors and U.S. Bank
National Association (incorporated by reference to
Exhibit 4.5 to Targa Resources Partners LP’s Quarterly
Report on
Form 10-Q
filed May 6, 2010 (File
No. 001-33303)).
|
|
|
|
|
|
|
|
|
|
|
10
|
.54
|
|
—
|
|
Supplemental Indenture dated April 27, 2010 to Indenture
dated June 18, 2008, among Targa Permian Intrastate LLC, a
subsidiary of Targa Resources Partners LP, Targa Resources
Partners Finance Corporation, the other Subsidiary Guarantors
and U.S. Bank National Association (incorporated by reference to
Exhibit 4.7 to Targa Resources Partners LP’s Quarterly
Report on
Form 10-Q
filed May 6, 2010 (File
No. 001-33303)).
|
|
|
|
|
|
|
|
|
|
|
10
|
.55
|
|
—
|
|
Supplemental Indenture dated April 27, 2010 to Indenture
dated June 18, 2008, among Targa Straddle LP, a subsidiary
of Targa Resources Partners LP, Targa Resources Partners Finance
Corporation, the other Subsidiary Guarantors and U.S. Bank
National Association (incorporated by reference to
Exhibit 4.9 to Targa Resources Partners LP’s Quarterly
Report on
Form 10-Q
filed May 6, 2010 (File
No. 001-33303)).
|
|
|
|
|
|
|
|
|
|
|
10
|
.56
|
|
—
|
|
Supplemental Indenture dated April 27, 2010 to Indenture
dated June 18, 2008, among Targa Straddle GP LLC, a
subsidiary of Targa Resources Partners LP, Targa Resources
Partners Finance Corporation, the other Subsidiary Guarantors
and U.S. Bank National Association (incorporated by reference to
Exhibit 4.11 to Targa Resources Partners LP’s
Quarterly Report on
Form 10-Q
filed May 6, 2010 (File
No. 001-33303)).
|
|
|
|
|
|
|
|
|
|
|
10
|
.57
|
|
—
|
|
Supplemental Indenture dated August 10, 2010 to Indenture
dated June 18, 2008, among Targa MLP Capital, a subsidiary
of Targa Resources Partners LP, Targa Resources Partners Finance
Corporation, the other Subsidiary Guarantors and U.S. Bank
National Association (incorporated by reference to
Exhibit 10.46 to Targa Resources Corp.’s Registration
Statement on
Form S-1/A
filed November 12, 2010 (File
No. 333-169277)).
|
|
|
|
|
|
|
|
|
|
|
10
|
.58
|
|
—
|
|
Supplemental Indenture dated September 20, 2010 to
Indenture dated June 18, 2008, among Targa Versado LP and
Targa Versado GP LLC, subsidiaries of Targa Resources Partners
LP, Targa Resources Partners Finance Corporation, the other
Subsidiary Guarantors and U.S. Bank National Association
(incorporated by reference to Exhibit 4.3 to Targa
Resources Partners LP’s Quarterly Report on
Form 10-Q
filed November 5, 2010 (File
No. 001-33303)).
|
|
|
|
|
|
|
|
|
|
|
10
|
.59
|
|
—
|
|
Supplemental Indenture dated October 25, 2010 to Indenture
dated June 18, 2008, among Targa Capital LLC, a subsidiary
of Targa Resources Partners LP, Targa Resources Partners Finance
Corporation, the other Subsidiary Guarantors and U.S. Bank
National Association (incorporated by reference to
Exhibit 4.6 to Targa Resources Partners LP’s Quarterly
Report on
Form 10-Q
filed November 5, 2010 (File
No. 001-33303)).
|
|
|
|
|
|
|
|
|
|
|
10
|
.60
|
|
—
|
|
Registration Rights Agreement dated July 6, 2009, among
Targa Resources Partners LP, Targa Resources Partners Finance
Corporation, the Guarantors named therein and the initial
purchasers named therein (incorporated by reference to
Exhibit 4.2 to Targa Resources Partners LP’s Current
Report on
Form 8-K
filed July 6, 2009 (File
No. 001-33303)).
|
|
|
|
|
|
|
|
|
|
|
10
|
.61
|
|
—
|
|
Indenture dated as of July 6, 2009, among Targa Resources
Partners LP, Targa Resources Partners Finance Corporation, the
Guarantors named therein and U.S. Bank National Association
(incorporated by reference to Exhibit 4.1 to Targa
Resources Partners LP’s Current Report on
Form 8-K
filed July 6, 2009 (File
No. 001-33303)).
|
|
|
|
|
|
|
|
|
|
|
10
|
.62
|
|
—
|
|
Supplemental Indenture dated September 24, 2009 to
Indenture dated July 6, 2009, among Targa Downstream GP
LLC, a subsidiary of Targa Resources Partners LP, Targa
Resources Partners Finance Corporation, the other Subsidiary
Guarantors and U.S. Bank National Association (incorporated by
reference to Exhibit 4.4 to Targa Resources Partners
LP’s Quarterly Report on
Form 10-Q
filed November 9, 2009 (File
No. 001-33303)).
|
II-8
| |
|
|
|
|
|
|
|
|
|
|
|
|
|
|
|
|
10
|
.63
|
|
—
|
|
Supplemental Indenture dated September 24, 2009 to
Indenture dated July 6, 2009, among Targa Downstream LP, a
subsidiary of Targa Resources Partners LP, Targa Resources
Partners Finance Corporation, the other Subsidiary Guarantors
and U.S. Bank National Association (incorporated by reference to
Exhibit 4.6 to Targa Resources Partners LP’s Quarterly
Report on
Form 10-Q
filed November 9, 2009 (File
No. 001-33303)).
|
|
|
|
|
|
|
|
|
|
|
10
|
.64
|
|
—
|
|
Supplemental Indenture dated September 24, 2009 to
Indenture dated July 6, 2009, among Targa LSNG GP LLC, a
subsidiary of Targa Resources Partners LP, Targa Resources
Partners Finance Corporation, the other Subsidiary Guarantors
and U.S. Bank National Association (incorporated by reference to
Exhibit 4.8 to Targa Resources Partners LP’s Quarterly
Report on
Form 10-Q
filed November 9, 2009 (File
No. 001-33303)).
|
|
|
|
|
|
|
|
|
|
|
10
|
.65
|
|
—
|
|
Supplemental Indenture dated September 24, 2009 to
Indenture dated July 6, 2009, among Targa LSNG LP, a
subsidiary of Targa Resources Partners LP, Targa Resources
Partners Finance Corporation, the other Subsidiary Guarantors
and U.S. Bank National Association (incorporated by reference to
Exhibit 4.10 to Targa Resources Partners LP’s
Quarterly Report on
Form 10-Q
filed November 9, 2009 (File
No. 001-33303)).
|
|
|
|
|
|
|
|
|
|
|
10
|
.66
|
|
—
|
|
Supplemental Indenture dated September 24, 2009 to
Indenture dated July 6, 2009, among Targa Sparta LLC, a
subsidiary of Targa Resources Partners LP, Targa Resources
Partners Finance Corporation, the other Subsidiary Guarantors
and U.S. Bank National Association (incorporated by reference to
Exhibit 4.12 to Targa Resources Partners LP’s
Quarterly Report on
Form 10-Q
filed November 9, 2009 (File
No. 001-33303)).
|
|
|
|
|
|
|
|
|
|
|
10
|
.67
|
|
—
|
|
Supplemental Indenture dated September 24, 2009 to
Indenture dated July 6, 2009, among Midstream Barge Company
LLC, a subsidiary of Targa Resources Partners LP, Targa
Resources Partners Finance Corporation, the other Subsidiary
Guarantors and U.S. Bank National Association (incorporated by
reference to Exhibit 4.14 to Targa Resources Partners
LP’s Quarterly Report on
Form 10-Q
filed November 9, 2009 (File
No. 001-33303)).
|
|
|
|
|
|
|
|
|
|
|
10
|
.68
|
|
—
|
|
Supplemental Indenture dated September 24, 2009 to
Indenture dated July 6, 2009, among Targa Retail Electric
LLC, a subsidiary of Targa Resources Partners LP, Targa
Resources Partners Finance Corporation, the other Subsidiary
Guarantors and U.S. Bank National Association (incorporated by
reference to Exhibit 4.16 to Targa Resources Partners
LP’s Quarterly Report on
Form 10-Q
filed November 9, 2009 (File
No. 001-33303)).
|
|
|
|
|
|
|
|
|
|
|
10
|
.69
|
|
—
|
|
Supplemental Indenture dated September 24, 2009 to
Indenture dated July 6, 2009, among Targa NGL Pipeline
Company LLC, a subsidiary of Targa Resources Partners LP, Targa
Resources Partners Finance Corporation, the other Subsidiary
Guarantors and U.S. Bank National Association (incorporated by
reference to Exhibit 4.18 to Targa Resources Partners
LP’s Quarterly Report on
Form 10-Q
filed November 9, 2009 (File
No. 001-33303)).
|
|
|
|
|
|
|
|
|
|
|
10
|
.70
|
|
—
|
|
Supplemental Indenture dated September 24, 2009 to
Indenture dated July 6, 2009, among Targa Transport LLC, a
subsidiary of Targa Resources Partners LP, Targa Resources
Partners Finance Corporation, the other Subsidiary Guarantors
and U.S. Bank National Association (incorporated by reference to
Exhibit 4.20 to Targa Resources Partners LP’s
Quarterly Report on
Form 10-Q
filed November 9, 2009 (File
No. 001-33303)).
|
|
|
|
|
|
|
|
|
|
|
10
|
.71
|
|
—
|
|
Supplemental Indenture dated September 24, 2009 to
Indenture dated July 6, 2009, among Targa Co-Generation
LLC, a subsidiary of Targa Resources Partners LP, Targa
Resources Partners Finance Corporation, the other Subsidiary
Guarantors and U.S. Bank National Association (incorporated by
reference to Exhibit 4.22 to Targa Resources Partners
LP’s Quarterly Report on
Form 10-Q
filed November 9, 2009 (File
No. 001-33303)).
|
|
|
|
|
|
|
|
|
|
|
10
|
.72
|
|
—
|
|
Supplemental Indenture dated September 24, 2009 to
Indenture dated July 6, 2009, among Targa Liquids GP LLC, a
subsidiary of Targa Resources Partners LP, Targa Resources
Partners Finance Corporation, the other Subsidiary Guarantors
and U.S. Bank National Association (incorporated by reference to
Exhibit 4.24 to Targa Resources Partners LP’s
Quarterly Report on
Form 10-Q
filed November 9, 2009 (File
No. 001-33303)).
|
II-9
| |
|
|
|
|
|
|
|
|
|
|
|
|
|
|
|
|
10
|
.73
|
|
—
|
|
Supplemental Indenture dated September 24, 2009 to
Indenture dated July 6, 2009, among Targa Liquids Marketing
and Trade, a subsidiary of Targa Resources Partners LP, Targa
Resources Partners Finance Corporation, the other Subsidiary
Guarantors and U.S. Bank National Association (incorporated by
reference to Exhibit 4.26 to Targa Resources Partners
LP’s Quarterly Report on
Form 10-Q
filed November 9, 2009 (File
No. 001-33303)).
|
|
|
|
|
|
|
|
|
|
|
10
|
.74
|
|
—
|
|
Supplemental Indenture dated April 27, 2010 to Indenture
dated July 6, 2009, among Targa Gas Marketing LLC, a
subsidiary of Targa Resources Partners LP, Targa Resources
Partners Finance Corporation, the other Subsidiary Guarantors
and U.S. Bank National Association (incorporated by reference to
Exhibit 4.2 to Targa Resources Partners LP’s Quarterly
Report on
Form 10-Q
filed May 6, 2010 (File
No. 001-33303)).
|
|
|
|
|
|
|
|
|
|
|
10
|
.75
|
|
—
|
|
Supplemental Indenture dated April 27, 2010 to Indenture
dated July 6, 2009, among Targa Midstream Services Limited
Partnership, a subsidiary of Targa Resources Partners LP, Targa
Resources Partners Finance Corporation, the other Subsidiary
Guarantors and U.S. Bank National Association (incorporated by
reference to Exhibit 4.4 to Targa Resources Partners
LP’s Quarterly Report on
Form 10-Q
filed May 6, 2010 (File
No. 001-33303)).
|
|
|
|
|
|
|
|
|
|
|
10
|
.76
|
|
—
|
|
Supplemental Indenture dated April 27, 2010 to Indenture
dated July 6, 2009, among Targa Permian LP, a subsidiary of
Targa Resources Partners LP, Targa Resources Partners Finance
Corporation, the other Subsidiary Guarantors and U.S. Bank
National Association (incorporated by reference to
Exhibit 4.6 to Targa Resources Partners LP’s Quarterly
Report on
Form 10-Q
filed May 6, 2010 (File
No. 001-33303)).
|
|
|
|
|
|
|
|
|
|
|
10
|
.77
|
|
—
|
|
Supplemental Indenture dated April 27, 2010 to Indenture
dated July 6, 2009, among Targa Permian Intrastate LLC, a
subsidiary of Targa Resources Partners LP, Targa Resources
Partners Finance Corporation, the other Subsidiary Guarantors
and U.S. Bank National Association (incorporated by reference to
Exhibit 4.8 to Targa Resources Partners LP’s Quarterly
Report on
Form 10-Q
filed May 6, 2010 (File
No. 001-33303)).
|
|
|
|
|
|
|
|
|
|
|
10
|
.78
|
|
—
|
|
Supplemental Indenture dated April 27, 2010 to Indenture
dated July 6, 2009, among Targa Straddle LP, a subsidiary
of Targa Resources Partners LP, Targa Resources Partners Finance
Corporation, the other Subsidiary Guarantors and U.S. Bank
National Association (incorporated by reference to
Exhibit 4.10 to Targa Resources Partners LP’s
Quarterly Report on
Form 10-Q
filed May 6, 2010 (File
No. 001-33303)).
|
|
|
|
|
|
|
|
|
|
|
10
|
.79
|
|
—
|
|
Supplemental Indenture dated April 27, 2010 to Indenture
dated July 6, 2009, among Targa Straddle GP LLC, a
subsidiary of Targa Resources Partners LP, Targa Resources
Partners Finance Corporation, the other Subsidiary Guarantors
and U.S. Bank National Association (incorporated by reference to
Exhibit 4.12 to Targa Resources Partners LP’s
Quarterly Report on
Form 10-Q
filed May 6, 2010 (File
No. 001-33303)).
|
|
|
|
|
|
|
|
|
|
|
10
|
.80
|
|
—
|
|
Supplemental Indenture dated August 10, 2010 to Indenture
dated July 6, 2009, among Targa MLP Capital, a subsidiary
of Targa Resources Partners LP, Targa Resources Partners Finance
Corporation, the other Subsidiary Guarantors and U.S. Bank
National Association (incorporated by reference to
Exhibit 10.66 to Targa Resources Corp.’s Registration
Statement on
Form S-1/A
filed November 12, 2010 (File
No. 333-169277)).
|
|
|
|
|
|
|
|
|
|
|
10
|
.81
|
|
—
|
|
Supplemental Indenture dated September 20, 2010 to
Indenture dated July 6, 2009, among Targa Versado LP and
Targa Versado GP LLC, subsidiaries of Targa Resources Partners
LP, Targa Resources Partners Finance Corporation, the other
Subsidiary Guarantors and U.S. Bank National Association
(incorporated by reference to Exhibit 4.4 to Targa
Resources Partners LP’s Quarterly Report on
Form 10-Q
filed November 5, 2010 (File
No. 001-33303)).
|
|
|
|
|
|
|
|
|
|
|
10
|
.82
|
|
—
|
|
Supplemental Indenture dated October 25, 2010 to Indenture
dated July 6, 2009, among Targa Capital LLC, a subsidiary
of Targa Resources Partners LP, Targa Resources Partners Finance
Corporation, the other Subsidiary Guarantors and U.S. Bank
National Association (incorporated by reference to
Exhibit 4.7 to Targa Resources Partners LP’s Quarterly
Report on
Form 10-Q
filed November 5, 2010 (File
No. 001-33303)).
|
II-10
| |
|
|
|
|
|
|
|
|
|
|
|
|
|
|
|
|
10
|
.83
|
|
—
|
|
First Supplemental Indenture dated February 2, 2011 to that
certain Indenture dated July 6, 2009 (incorporated by
reference to Exhibit 4.3 to Targa Resources Partners
LP’s Current Report on
Form 8-K
filed February 2, 2011 (File
No. 001-33303)).
|
|
|
|
|
|
|
|
|
|
|
10
|
.84
|
|
—
|
|
Registration Rights Agreement dated as of August 13, 2010
among the Issuers, the Guarantors and Banc of America Securities
LLC, as representative of the several initial purchasers
(incorporated by reference to Exhibit 4.2 to Targa
Resources Partners LP’s Current Report on
Form 8-K
filed August 16, 2010 (File
No. 001-33303)).
|
|
|
|
|
|
|
|
|
|
|
10
|
.85
|
|
—
|
|
Indenture dated as of August 13, 2010 among the Issuers and
the Guarantors and U.S. Bank National Association, as trustee
(incorporated by reference to Exhibit 4.1 to Targa
Resources Partners LP’s Current Report on
Form 8-K
filed August 16, 2010 (File
No. 001-33303)).
|
|
|
|
|
|
|
|
|
|
|
10
|
.86
|
|
—
|
|
Supplemental Indenture dated September 20, 2010 to
Indenture dated August 13, 2010, among Targa Versado LP and
Targa Versado GP LLC, subsidiaries of Targa Resources Partners
LP, Targa Resources Partners Finance Corporation, the other
Subsidiary Guarantors and U.S. Bank National Association
(incorporated by reference to Exhibit 4.5 to Targa
Resources Partners LP’s Quarterly Report on
Form 10-Q
filed November 5, 2010 (File
No. 001-
33303)).
|
|
|
|
|
|
|
|
|
|
|
10
|
.87
|
|
—
|
|
Supplemental Indenture dated October 25, 2010 to Indenture
dated August 13, 2010, among Targa Capital LLC, a
subsidiary of Targa Resources Partners LP, Targa Resources
Partners Finance Corporation, the other Subsidiary Guarantors
and U.S. Bank National Association (incorporated by reference to
Exhibit 4.8 to Targa Resources Partners LP’s Quarterly
Report on
Form 10-Q
filed November 5, 2010 (File
No. 001-33303)).
|
|
|
|
|
|
|
|
|
|
|
10
|
.88
|
|
—
|
|
Registration Rights Agreement dated February 2, 2011 among
the Issuers, the Guarantors, Deutsche Bank Securities Inc., as
representative of the several initial purchasers, and the Dealer
Managers (incorporated by reference to Exhibit 4.2 to Targa
Resources Partners LP’s Current Report on
Form 8-K
filed February 2, 2011 (File
No. 001-33303)).
|
|
|
|
|
|
|
|
|
|
|
10
|
.89
|
|
—
|
|
Indenture dated February 2, 2011 among the Issuers, the
Guarantors and U.S. Bank National Association, as trustee
thereto (incorporated by reference to Exhibit 4.1 to Targa
Resources Partners LP’s Current Report on
Form 8-K
filed February 2, 2011 (File
No. 001-33303)).
|
|
|
|
|
|
|
|
|
|
|
10
|
.90
|
|
—
|
|
Contribution, Conveyance and Assumption Agreement, dated
February 14, 2007, by and among Targa Resources Partners
LP, Targa Resources Operating LP, Targa Resources GP LLC, Targa
Resources Operating GP LLC, Targa GP Inc., Targa LP Inc., Targa
Regulated Holdings LLC, Targa North Texas GP LLC and Targa North
Texas LP (incorporated by reference to Exhibit 10.2 to
Targa Resources Partners LP’s Current Report on
Form 8-K
filed February 16, 2007 (File
No. 001-33303)).
|
|
|
|
|
|
|
|
|
|
|
10
|
.91
|
|
—
|
|
Contribution, Conveyance and Assumption Agreement, dated
October 24, 2007, by and among Targa Resources Partners LP,
Targa Resources Holdings LP, Targa TX LLC, Targa TX PS LP, Targa
LA LLC, Targa LA PS LP and Targa North Texas GP LLC
(incorporated by reference to Exhibit 10.4 to Targa
Resources Partners LP’s Current Report on
Form 8-K
filed October 24, 2007 (File
No. 001-33303)).
|
|
|
|
|
|
|
|
|
|
|
10
|
.92
|
|
—
|
|
Contribution, Conveyance and Assumption Agreement, dated
September 24, 2009, by and among Targa Resources Partners
LP, Targa GP Inc., Targa LP Inc., Targa Resources Operating LP
and Targa North Texas GP LLC (incorporated by reference to
Exhibit 10.1 to Targa Resources Partners LP’s Current
Report on
Form 8-K
filed September 24, 2009 (File
No. 001-33303)).
|
|
|
|
|
|
|
|
|
|
|
10
|
.93
|
|
—
|
|
Contribution, Conveyance and Assumption Agreement, dated
April 27, 2010, by and among Targa Resources Partners LP,
Targa LP Inc., Targa Permian GP LLC, Targa Midstream Holdings
LLC, Targa Resources Operating LP, Targa North Texas GP LLC and
Targa Resources Texas GP LLC (incorporated by reference to
Exhibit 10.1 to Targa Resources Partners LP’s Current
Report on
Form 8-K
filed April 29, 2010 (File
No. 001-33303)).
|
II-11
| |
|
|
|
|
|
|
|
|
|
|
|
|
|
|
|
|
10
|
.94
|
|
—
|
|
Contribution, Conveyance and Assumption Agreement, dated
August 25, 2010, by and among Targa Resources Partners LP,
Targa Versado Holdings LP and Targa North Texas GP LLC
(incorporated by reference to Exhibit 10.1 to Targa
Resources Partners LP’s Current Report on
Form 8-K
filed August 26, 2010 (File
No. 001-33303)).
|
|
|
|
|
|
|
|
|
|
|
10
|
.95
|
|
—
|
|
Contribution, Conveyance and Assumption Agreement, dated
September 28, 2010, by and among Targa Resources Partners
LP, Targa Versado Holdings LP and Targa North Texas GP LLC
(incorporated by reference to Exhibit 10.1 to Targa
Resources Partners LP’s Current Report on
Form 8-K
filed October 4, 2010 (file
No. 001-33303)).
|
|
|
|
|
|
|
|
|
|
|
10
|
.96
|
|
—
|
|
Second Amended and Restated Omnibus Agreement, dated
September 24, 2009, by and among Targa Resources Partners
LP, Targa Resources, Inc., Targa Resources LLC and Targa
Resources GP LLC (incorporated by reference to Exhibit 10.2
to Targa Resources Partners LP’s Current Report on
Form 8-K
filed September 24, 2009 (file
No. 001-33303)).
|
|
|
|
|
|
|
|
|
|
|
10
|
.97
|
|
—
|
|
First Amendment to Second Amended and Restated Omnibus
Agreement, dated April 27, 2010, by and among Targa
Resources Partners LP, Targa Resources, Inc., Targa Resources
LLC and Targa Resources GP LLC (incorporated by reference to
Exhibit 10.2 to Targa Resources Partners LP’s Current
Report on
Form 8-K
filed April 29, 2010 (File
No. 001-33303)).
|
|
|
|
|
|
|
|
|
|
|
10
|
.98+
|
|
—
|
|
Form of Indemnification Agreement between Targa Resources
Investments Inc. and each of the directors and officers thereof
(incorporated by reference to Exhibit 10.4 to Targa
Resources Corp.’s Registration Statement on
Form S-1/A
filed November 8, 2010 (File
No. 333-169277)).
|
|
|
|
|
|
|
|
|
|
|
10
|
.99+
|
|
—
|
|
Targa Resources Partners LP Indemnification Agreement for Barry
R. Pearl dated February 14, 2007 (incorporated by reference
to Exhibit 10.11 to Targa Resources Partners LP’s
Annual Report on
Form 10-K
filed April 2, 2007 (File
No. 001-33303)).
|
|
|
|
|
|
|
|
|
|
|
10
|
.100+
|
|
—
|
|
Targa Resources Partners LP Indemnification Agreement for Robert
B. Evans dated February 14, 2007 (incorporated by reference
to Exhibit 10.12 to Targa Resources Partners LP’s
Annual Report on
Form 10-K
filed April 2, 2007 (File
No. 001-33303)).
|
|
|
|
|
|
|
|
|
|
|
10
|
.101+
|
|
—
|
|
Targa Resources Partners LP Indemnification Agreement for
Williams D. Sullivan dated February 14, 2007 (incorporated
by reference to Exhibit 10.13 to Targa Resources Partners
LP’s Annual Report on
Form 10-K
filed April 2, 2007 (File
No. 001-33303)).
|
|
|
|
|
|
|
|
|
|
|
10
|
.102
|
|
—
|
|
Amended and Restated Registration Rights Agreement dated as of
October 31, 2005 (incorporated by reference to
Exhibit 10.1 to Targa Resources Corp.’s Registration
Statement on
Form S-1/A
filed November 12, 2010 (File
No. 333-169277)).
|
|
|
|
|
|
|
|
|
|
|
21
|
.1
|
|
—
|
|
List of Subsidiaries of Targa Resources Corp. (incorporated by
reference to Exhibit 21.1 to the Company’s Annual
Report on
Form 10-K
filed February 28, 2011 (File
No. 001-34991)).
|
|
|
|
|
|
|
|
|
|
|
23
|
.1*
|
|
|
|
Consent of PricewaterhouseCoopers LLP.
|
|
|
|
|
|
|
|
|
|
|
23
|
.2*
|
|
|
|
Consent of Vinson & Elkins L.L.P. (contained in
Exhibit 5.1).
|
|
|
|
|
|
|
|
|
|
|
24
|
.1***
|
|
|
|
Powers of Attorney.
|
|
|
|
|
*
|
|
Filed herewith
|
| |
|
**
|
|
Pursuant to Item 601(b)(2) of
Regulation S-K,
the Company agrees to furnish supplementally a copy of any
omitted exhibit or Schedule to the SEC upon request.
|
|
|
|
|
+
|
|
Management contract or compensatory
plan or arrangement
|
II-12
(b) Financial Statement Schedules
Schedule I — Condensed Financial Information of
Registrant — Parent Only (included as a schedule to
our Consolidated Financial Statements beginning on
page F-44
of the prospectus).
Insofar as indemnification for liabilities arising under the
Securities Act may be permitted to directors, officers and
controlling persons of the registrant pursuant to the foregoing
provisions, or otherwise, the registrant has been advised that
in the opinion of the Securities and Exchange Commission such
indemnification is against public policy as expressed in the
Securities Act and is, therefore, unenforceable. In the event
that a claim for indemnification against such liabilities (other
than the payment by the registrant of expenses incurred or paid
by a director, officer or controlling person of the registrant
in the successful defense of any action, suit or proceeding) is
asserted by such director, officer or controlling person in
connection with the securities being registered, the registrant
will, unless in the opinion of its counsel the matter has been
settled by controlling precedent, submit to a court of
appropriate jurisdiction the question whether such
indemnification by it is against public policy as expressed in
the Securities Act and will be governed by the final
adjudication of such issue.
The undersigned registrant hereby undertakes that:
(1) For purposes of determining any liability under the
Securities Act, the information omitted from the form of
prospectus filed as part of this registration statement in
reliance upon Rule 430A and contained in a form of
prospectus filed by the registrant pursuant to
Rule 424(b)(1) or (4) or 497(h) under the Securities
Act shall be deemed to be part of this registration statement as
of the time it was declared effective.
(2) For the purpose of determining any liability under the
Securities Act, each post-effective amendment that contains a
form of prospectus shall be deemed to be a new registration
statement relating to the securities offered therein, and the
offering of such securities at that time shall be deemed to be
the initial bona fide offering thereof.
(3) For the purpose of determining liability under the
Securities Act to any purchaser, each prospectus filed pursuant
to Rule 424(b) as part of a registration statement relating
to an offering, other than registration statements relying on
Rule 430B or other than prospectuses filed in reliance on
Rule 430A, shall be deemed to be part of and included in
the registration statement as of the date it is first used after
effectiveness. Provided, however, that no statement made in a
registration statement or prospectus that is part of the
registration statement or made in a document incorporated or
deemed incorporated by reference into the registration statement
or prospectus that is part of the registration statement will,
as to a purchaser with a time of contract of sale prior to such
first use, supersede or modify any statement that was made in
the registration statement or prospectus that was part of the
registration statement or made in any such document immediately
prior to such date of first use.
(4) For the purpose of determining liability of the
registrant under the Securities Act to any purchaser in the
initial distribution of the securities, the undersigned
registrant undertakes that in a primary offering of securities
of the undersigned registrant pursuant to this registration
statement, regardless of the underwriting method used to sell
the securities to the purchaser, if the securities are offered
or sold to such purchaser by means of any of the following
communications, the
II-13
undersigned registrant will be a seller to the purchaser and
will be considered to offer or sell such securities to such
purchaser:
(i) Any preliminary prospectus or prospectus of the
undersigned registrant relating to the offering required to be
filed pursuant to Rule 424;
(ii) Any free writing prospectus relating to the offering
prepared by or on behalf of the undersigned registrant or used
or referred to by the undersigned registrant;
(iii) The portion of any other free writing prospectus
relating to the offering containing material information about
the undersigned registrant or its securities provided by or on
behalf of the undersigned registrant; and
(iv) Any other communication that is an offer in the
offering made by the undersigned registrant to the purchaser.
II-14
SIGNATURES
Pursuant to the requirements of the Securities Act of 1933, the
registrant has duly caused this Registration Statement to be
signed on its behalf by the undersigned, thereunto duly
authorized, in the City of Houston, State of Texas, on
April 13, 2011.
TARGA RESOURCES CORP.
Name: Matthew J. Meloy
|
|
|
| |
Title:
|
Senior Vice President and
Chief Financial Officer
|
(Principal Financial Officer)
Pursuant to the requirements of the Securities Act of 1933, this
registration statement has been signed by the following persons
in the capacities indicated on the dates indicated:
| |
|
|
|
|
|
|
|
Signature
|
|
Title
|
|
Date
|
|
|
|
|
|
|
|
|
|
*
Rene
R. Joyce
|
|
Chief Executive Officer and Director (Principal Executive
Officer)
|
|
April 13, 2011
|
|
|
|
|
|
|
|
/s/ Matthew
J. Meloy
Matthew
J. Meloy
|
|
Senior Vice President and Chief
Financial Officer
(Principal Financial Officer)
|
|
April 13, 2011
|
|
|
|
|
|
|
|
*
John
Robert Sparger
|
|
Senior Vice President and Chief Accounting Officer
(Principal Accounting Officer)
|
|
April 13, 2011
|
|
|
|
|
|
|
|
*
James
W. Whalen
|
|
Director
|
|
April 13, 2011
|
|
|
|
|
|
|
|
*
Peter
R. Kagan
|
|
Director
|
|
April 13, 2011
|
|
|
|
|
|
|
|
*
Ershel
C. Redd Jr.
|
|
Director
|
|
April 13, 2011
|
|
|
|
|
|
|
|
*
Charles
R. Crisp
|
|
Director
|
|
April 13, 2011
|
|
|
|
|
|
|
|
*
Chris
Tong
|
|
Director
|
|
April 13, 2011
|
|
|
|
|
|
|
|
*
In
Seon Hwang
|
|
Director
|
|
April 13, 2011
|
|
|
|
|
|
|
|
|
|
*By:
|
|
/s/ Matthew
J. Meloy
Matthew
J. Meloy
Attorney-in-Fact
|
|
|
|
|
II-15
INDEX TO
EXHIBITS
| |
|
|
|
|
|
|
|
|
1
|
.1***
|
|
—
|
|
Form of Underwriting Agreement
|
|
|
2
|
.1**
|
|
—
|
|
Purchase and Sale Agreement, dated as of September 18,
2007, by and between Targa Resources Holdings LP and Targa
Resources Partners LP (incorporated by reference to
Exhibit 2.1 to Targa Resources Partners LP’s Current
Report on
Form 8-K
filed September 21, 2007 (File
No. 001-33303)).
|
|
|
2
|
.2
|
|
—
|
|
Amendment to Purchase and Sale Agreement, dated October 1,
2007, by and between Targa Resources Holdings LP and Targa
Resources Partners LP (incorporated by reference to
Exhibit 2.2 to Targa Resources Partners LP’s Current
Report on
Form 8-K
filed October 24, 2007 (File
No. 001-33303)).
|
|
|
2
|
.3
|
|
—
|
|
Purchase and Sale Agreement dated July 27, 2009, by and
between Targa Resources Partners LP, Targa GP Inc. and Targa LP
Inc. (incorporated by reference to Exhibit 2.1 to Targa
Resources Partners LP’s Current Report on
Form 8-K
filed July 29, 2009 (File
No. 001-33303)).
|
|
|
2
|
.4
|
|
—
|
|
Purchase and Sale Agreement, dated as of March 31, 2010, by
and among Targa Resources Partners LP, Targa LP Inc., Targa
Permian GP LLC and Targa Midstream Holdings LLC (incorporated by
reference to Exhibit 2.1 to Targa Resources Partners
LP’s Current Report on
Form 8-K
filed April 1, 2010 (File
No. 001-33303)).
|
|
|
2
|
.5
|
|
—
|
|
Purchase and Sale Agreement, dated as of August 6, 2010, by
and among Targa Resources Partners LP and Targa Versado Holdings
LP (incorporated by reference to Exhibit 2.1 to Targa
Resources Partners LP’s Current Report on
Form 8-K
filed August 9, 2010 (File
No. 001-33303)).
|
|
|
2
|
.6
|
|
—
|
|
Purchase and Sale Agreement, dated September 13, 2010, by
and between Targa Resources Partners LP and Targa Versado
Holdings LP (incorporated by reference to Exhibit 2.1 to
Targa Resources Partners LP’s Current Report on
Form 8-K
filed September 17, 2010 (File
No. 001-33303)).
|
|
|
3
|
.1
|
|
—
|
|
Amended and Restated Certificate of Incorporation of Targa
Resources Corp. (incorporated by reference to Exhibit 3.1
to Targa Resources Corp.’s Current Report on
Form 8-K
filed December 16, 2010 (File
No. 001-34991)).
|
|
|
3
|
.2
|
|
—
|
|
Form of Amended and Restated Bylaws of Targa Resources Corp.
(incorporated by reference to Exhibit 3.1 to Targa
Resources Corp.’s Current Report on
Form 8-K
filed December 16, 2010 (File
No. 001-34991)).
|
|
|
3
|
.3
|
|
—
|
|
Certificate of Limited Partnership of Targa Resources Partners
LP (incorporated by reference to Exhibit 3.2 to Targa
Resources Partners LP’s Registration Statement on
Form S-1
filed November 16, 2006 (File
No. 333-138747)).
|
|
|
3
|
.4
|
|
—
|
|
Certificate of Formation of Targa Resources GP LLC (incorporated
by reference to Exhibit 3.3 to Targa Resources Partners
LP’s Registration Statement on
Form S-1/A
filed January 19, 2007 (File
No. 333-138747)).
|
|
|
3
|
.5
|
|
—
|
|
First Amended and Restated Agreement of Limited Partnership of
Targa Resources Partners LP (incorporated by reference to
Exhibit 3.1 to Targa Resources Partners LP’s current
report on
Form 8-K
filed February 16, 2007 (File
No. 001-33303)).
|
|
|
3
|
.6
|
|
—
|
|
Amendment No. 1 to First Amended and Restated Agreement of
Limited Partnership of Targa Resources Partners LP (incorporated
by reference to Exhibit 3.5 to Targa Resources Partners
LP’s Quarterly Report on
Form 10-Q
filed May 14, 2008 (File
No. 001-33303)).
|
|
|
3
|
.7
|
|
—
|
|
Limited Liability Company Agreement of Targa Resources GP LLC
(incorporated by reference to Exhibit 3.4 to Targa
Resources Partners LP’s Registration Statement on
Form S-1/A
filed January 19, 2007 (File
No. 333-138747)).
|
|
|
3
|
.8
|
|
—
|
|
Amended and Restated Certificate of Incorporation of Targa
Resources, Inc. (incorporated by reference to Exhibit 3.1
to Targa Resources, Inc.’s Registration Statement on
Form S-4
filed October 31, 2007 (File
No. 333-147066)).
|
|
|
3
|
.9
|
|
—
|
|
Amendment to Amended and Restated Certificate of Incorporation
of Targa Resources, Inc. (incorporated by reference to
Exhibit 3.9 of Targa Resources Corp.’s Annual Report
of
Form 10-K
filed February 28, 2011 (File
No. 001-34991)).
|
II-17
| |
|
|
|
|
|
|
|
|
3
|
.10
|
|
—
|
|
Amended and Restated Bylaws of Targa Resources, Inc.
(incorporated by reference to Exhibit 3.2 to Targa
Resources, Inc.’s Registration Statement on
Form S-4
filed October 31, 2007 (File
No. 333-147066)).
|
|
|
4
|
.1
|
|
—
|
|
Specimen Common Stock Certificate (incorporated by reference to
Exhibit 4.1 to Targa Resources Corp.’s Registration
Statement on
Form S-1/A
filed November 12, 2010 (File
No. 333-169277)).
|
|
|
5
|
.1*
|
|
—
|
|
Opinion of Vinson & Elkins L.L.P. as to the legality
of the securities registered hereby.
|
|
|
10
|
.1
|
|
—
|
|
Credit Agreement, dated as of January 5, 2010 among Targa
Resources, Inc., as the borrower, Deutsche Bank
Trust Company Americas, as the administrative agent,
Deutsche Bank Securities Inc. and Credit Suisse Securities (USA)
LLC, as joint lead arrangers, Credit Suisse Securities (USA) LLC
and Citadel Securities LLC, as the co-syndication agents,
Deutsche Bank Securities Inc., Credit Suisse Securities (USA)
LLC, Citadel Securities LLC, Banc of America Securities LLC and
Barclays Capital, as joint book runners, Bank of America, N.A.,
Barclays Bank PLC and ING Capital LLC, as the co-documentation
agents and the other lenders party thereto (incorporated by
reference to Exhibit 4.1 to Targa Resources Corp.’s
Registration Statement on
Form S-1/A
filed November 12, 2010 (File
No. 333-169277)).
|
|
|
10
|
.2
|
|
—
|
|
Amendment No. 1 to Credit Agreement, dated
November 12, 2010 among TRI Resources Inc., as the
Borrower, Deutsche Bank Trust Company Americas, Credit
Suisse AG, Cayman Islands Branch, Bank of America, N.A., ING
Capital LLC and Barclays Bank PLC, as Lenders, and Deutsche Bank
Trust Company Americas, as Administrative Agent
(incorporated by reference to Exhibit 10.94 to Targa
Resources Corp.’s Registration Statement on
Form S-1/A
filed November 16, 2010 (File
No. 333-169277)).
|
|
|
10
|
.3
|
|
—
|
|
Holdco Credit Agreement, dated as of August 9, 2007 among
Targa Resources Investments Inc., as the borrower, Credit
Suisse, as the administrative agent, Credit Suisse Securities
(USA) LLC and Deutsche Bank Securities Inc. and, as joint lead
arrangers, Deutsche Bank Securities Inc., as the syndication
agent, Credit Suisse Securities (USA) LLC, Deutsche Bank
Securities Inc., Lehman Brothers, Inc. and Merrill Lynch Capital
Corporation, as joint book runners, Lehman Commercial Paper Inc.
and Merrill Lynch Capital Corporation, as the co-documentation
agents and the other lenders party thereto (incorporated by
reference to Exhibit 4.1 to Targa Resources Corp.’s
Registration Statement on
Form S-1/A
filed November 12, 2010 (File
No. 333-169277)).
|
|
|
10
|
.4
|
|
—
|
|
Amendment No. 1 to Holdco Credit Agreement, dated
January 5, 2010 among Targa Resources Investments Inc., as
the Borrower, Targa Resources, Inc., as Lender, Targa Capital,
LLC, as Lender, and Credit Suisse AG, Cayman Islands Brach, as
Administrative Agent (incorporated by reference to
Exhibit 10.92 to Targa Resources Corp.’s Registration
Statement on
Form S-1/A
filed November 12, 2010 (File
No. 333-169277)).
|
|
|
10
|
.5
|
|
—
|
|
Amended and Restated Credit Agreement, dated July 19, 2010,
by and among Targa Resources Partners LP, as the borrower, Bank
of America, N.A., as the administrative agent, Wells Fargo Bank,
National Association and the Royal Bank of Scotland plc, as the
co-syndication agents, Deutsche Bank Securities Inc. and
Barclays Bank PLC, as the co-documentation agents, Banc of
America Securities LLC, Wells Fargo Securities, LLC and RBS
Securities Inc., as joint lead arrangers and co-book managers
and the other lenders part thereto (incorporated by reference to
Exhibit 10.1 to Targa Resources Partners LP’s
Form 8-K
filed on July 21, 2010 (File
No. 001-33303)).
|
|
|
10
|
.6
|
|
—
|
|
Targa Resources Investments Inc. Amended and Restated
Stockholders’ Agreement dated as of October 28, 2005
(incorporated by reference to Exhibit 10.2 to Targa
Resources Inc.’s Registration Statement on
Form S-4/A
filed December 18, 2007 (File
No. 333-147066)).
|
|
|
10
|
.7
|
|
—
|
|
First Amendment to Amended and Restated Stockholders’
Agreement, dated January 26, 2006 (incorporated by
reference to Exhibit 10.3 to Targa Resources Inc.’s
Registration Statement on
Form S-4/A
filed December 18, 2007 (File
No. 333-147066)).
|
|
|
10
|
.8
|
|
—
|
|
Second Amendment to Amended and Restated Stockholders’
Agreement, dated March 30, 2007 (incorporated by reference
to Exhibit 10.4 to Targa Resources Inc.’s Registration
Statement on
Form S-4/A
filed December 18, 2007 (File
No. 333-147066)).
|
II-18
| |
|
|
|
|
|
|
|
|
10
|
.9
|
|
—
|
|
Third Amendment to Amended and Restated Stockholders’
Agreement, dated May 1, 2007 (incorporated by reference to
Exhibit 10.5 to Targa Resources Inc.’s Registration
Statement on
Form S-4/A
filed December 18, 2007 (File
No. 333-147066)).
|
|
|
10
|
.10
|
|
—
|
|
Fourth Amendment to Amended and Restated Stockholders’
Agreement, dated December 7, 2007 (incorporated by
reference to Exhibit 10.6 to Targa Resources Inc.’s
Registration Statement on
Form S-4/A
filed December 18, 2007 (File
No. 333-147066)).
|
|
|
10
|
.11
|
|
—
|
|
Fifth Amendment to Amended and Restated Stockholders’
Agreement, dated December 1, 2009 (incorporated by
reference to Exhibit 10.1 to Targa Resources, Inc.’s
Current Report on
Form 8-K
filed December 2, 2009 (File
No. 333-147066)).
|
|
|
10
|
.12
|
|
—
|
|
Form of Sixth Amendment to Amended and Restated
Stockholders’ Agreement (incorporated by reference to
Exhibit 10.11 to Targa Resources Corp.’s Registration
Statement on
Form S-1/A
filed November 12, 2010 (File
No. 333-169277)).
|
|
|
10
|
.13+
|
|
—
|
|
Targa Resources Investments Inc. 2005 Stock Incentive Plan
(incorporated by reference to Exhibit 10.10 to Targa
Resources Inc.’s Registration Statement on
Form S-4/A
filed December 18, 2007 (File
No. 333-147066)).
|
|
|
10
|
.14+
|
|
—
|
|
First Amendment to Targa Resources Investments Inc. 2005 Stock
Incentive Plan (incorporated by reference to Exhibit 10.11
to Targa Resources Inc.’s Registration Statement on
Form S-4/A
filed December 18, 2007 (File
No. 333-147066)).
|
|
|
10
|
.15+
|
|
—
|
|
Second Amendment to Targa Resources Investments Inc. 2005 Stock
Incentive Plan (incorporated by reference to Exhibit 10.12
to Targa Resources Inc.’s Registration Statement on
Form S-4/A
filed December 18, 2007 (File
No. 333-147066)).
|
|
|
10
|
.16+
|
|
—
|
|
Form of Targa Resources Investments Inc. Nonstatutory Stock
Option Agreement (Non-Employee Directors) (incorporated by
reference to Exhibit 10.13 to Targa Resources Inc.’s
Registration Statement on
Form S-4/A
filed December 18, 2007 (File
No. 333-147066)).
|
|
|
10
|
.17+
|
|
—
|
|
Form of Targa Resources Investments Inc. Nonstatutory Stock
Option Agreement
(Non-Director
Management and Other Employees) (incorporated by reference to
Exhibit 10.14 to Targa Resources Inc.’s Registration
Statement on
Form S-4/A
filed December 18, 2007 (File
No. 333-147066)).
|
|
|
10
|
.18+
|
|
—
|
|
Form of Targa Resources Investments Inc. Incentive Stock Option
Agreement (incorporated by reference to Exhibit 10.15 to
Targa Resources Inc.’s Registration Statement on
Form S-4/A
filed December 18, 2007 (File
No. 333-147066)).
|
|
|
10
|
.19+
|
|
—
|
|
Form of Targa Resources Investments Inc. Restricted Stock
Agreement (incorporated by reference to Exhibit 10.16 to
Targa Resources Inc.’s Registration Statement on
Form S-4/A
filed December 18, 2007 (File
No. 333-147066)).
|
|
|
10
|
.20+
|
|
—
|
|
Form of Targa Resources Investments Inc. Restricted Stock
Agreement (relating to preferred stock option exchange for
directors) (incorporated by reference to Exhibit 10.17 to
Targa Resources Inc.’s Registration Statement on
Form S-4/A
filed December 18, 2007 (File
No. 333-147066)).
|
|
|
10
|
.21+
|
|
—
|
|
Form of Targa Resources Investments Inc. Restricted Stock
Agreement (relating to preferred stock option exchange for
employees) (incorporated by reference to Exhibit 10.18 to
Targa Resources Inc.’s Registration Statement on
Form S-4/A
filed December 18, 2007 (File
No. 333-147066)).
|
|
|
10
|
.22+
|
|
—
|
|
Targa Resources Corp. 2010 Stock Incentive Plan (incorporated by
reference to Exhibit 4.3 of Targa Resources Corp.’s
Registration Statement on
Form S-8
filed December 9, 2010 (File
No. 333-171082)).
|
|
|
10
|
.23+
|
|
—
|
|
Form of Targa Resources Corp. Restricted Stock
Agreement — 2010 (incorporated by reference to
Exhibit 4.4 of Targa Resources Corp.’s Registration
Statement on
Form S-8
filed December 9, 2010 (File
No. 333-171082)).
|
|
|
10
|
.24+
|
|
—
|
|
Form of Targa Resources Corp. 2011 Restricted Stock
Agreement — 2011 (incorporated by reference to
Exhibit 10.2 of Targa Resources Corp.’s Current Report
on
Form 8-K
filed February 18, 2011 (File
No. 001-34991)).
|
II-19
| |
|
|
|
|
|
|
|
|
10
|
.25+
|
|
—
|
|
Targa Resources Investments Inc. Long-Term Incentive Plan
(incorporated by reference to Exhibit 10.27 to Targa
Resources Inc.’s Registration Statement on
Form S-4/A
filed December 18, 2007 (File
No. 333-147066)).
|
|
|
10
|
.26+
|
|
—
|
|
Targa Resources Investments Inc. 2008 Annual Incentive
Compensation Plan (incorporated by reference to
Exhibit 10.13 to Targa Resources Partners LP’s Annual
Report on
Form 10-K
filed February 27, 2009 (File
No. 001-33303)).
|
|
|
10
|
.27+
|
|
—
|
|
Targa Resources Investments Inc. 2009 Annual Incentive
Compensation Plan (incorporated by reference to
Exhibit 10.14 to Targa Resources Partners LP’s Annual
Report on
Form 10-K
filed February 27, 2009 (File
No. 001-33303)).
|
|
|
10
|
.28+
|
|
—
|
|
Targa Resources Investments Inc. 2010 Annual Incentive
Compensation Plan (incorporated by reference to
Exhibit 10.22 to Targa Resources Partners LP’s Annual
Report on
Form 10-K
filed March 4, 2010 (File
No. 001-33303)).
|
|
|
10
|
.29+
|
|
—
|
|
Targa Resources Corp. 2011 Annual Incentive Compensation Plan
(incorporated by reference to Exhibit 10.27 to Targa
Resources Partners LP’s Annual Report on
Form 10-K
filed February 25, 2011 (File
No. 001-33303)).
|
|
|
10
|
.30+
|
|
—
|
|
Targa Resources Partners LP Long-Term Incentive Plan
(incorporated by reference to Exhibit 10.2 to Targa
Resources Partners LP’s Registration Statement on
Form S-1/A
filed February 1, 2007 (File
No. 333-138747)).
|
|
|
10
|
.31+
|
|
—
|
|
Form of Targa Resources Partners LP Restricted Unit Grant
Agreement — 2007 (incorporated by reference to
Exhibit 10.2 to Targa Resources Partners LP’s Current
Report on
Form 8-K
filed February 13, 2007 (File
No. 001-33303)).
|
|
|
10
|
.32+
|
|
—
|
|
Form of Targa Resources Partners LP Restricted Unit Grant
Agreement — 2010 (incorporated by reference to
Exhibit 10.15 to Targa Resources Partners LP’s
Form 10-K
filed March 4, 2010 (File
No. 001-33303)).
|
|
|
10
|
.33+
|
|
—
|
|
Form of Targa Resources Partners LP Performance Unit Grant
Agreement — 2007 (incorporated by reference to
Exhibit 10.3 to Targa Resources Partners LP’s Current
Report on
Form 8-K
filed with the SEC on February 13, 2007 (File
No. 001-33303)).
|
|
|
10
|
.34+
|
|
—
|
|
Form of Targa Resources Partners LP Performance Unit Grant
Agreement — 2008 (incorporated by reference to
Exhibit 10.2 to Targa Resources Partners LP’s Current
Report on
Form 8-K
filed January 22, 2008 (File
No. 001-33303)).
|
|
|
10
|
.35+
|
|
—
|
|
Form of Targa Resources Partners LP Performance Unit Grant
Agreement — 2009 (incorporated by reference to
Exhibit 10.2 to Targa Resources Partners LP’s Current
Report on
Form 8-K
filed January 28, 2009 (File
No. 001-33303)).
|
|
|
10
|
.36+
|
|
—
|
|
Form of Targa Resources Partners LP Performance Unit Grant
Agreement — 2010 (incorporated by reference to
Exhibit 10.2 to Targa Resources Partners LP’s Current
Report on
Form 8-K
filed December 7, 2009 (File
No. 001-33303)).
|
|
|
10
|
.37+
|
|
—
|
|
Form of Targa Resources Partners LP Performance Unit Grant
Agreement — 2011 (incorporated by reference to
Exhibit 10.2 to Targa Resources Partners LP’s Current
Report on
Form 8-K
filed February 18, 2011) (File
No. 001-33303)).
|
|
|
10
|
.38
|
|
—
|
|
Indenture dated June 18, 2008, among Targa Resources
Partners LP, Targa Resources Partners Finance Corporation, the
Guarantors named therein and U.S. Bank National Association
(incorporated by reference to Exhibit 4.1 to Targa
Resources, Inc.’s
Form 10-Q
filed August 11, 2008 (File
No. 333-147066)).
|
|
|
10
|
.39
|
|
—
|
|
Supplemental Indenture dated September 24, 2009 to
Indenture dated June 18, 2008, among Targa Downstream GP
LLC, a subsidiary of Targa Resources Partners LP, Targa
Resources Partners Finance Corporation, the other Subsidiary
Guarantors and U.S. Bank National Association (incorporated by
reference to Exhibit 4.3 to Targa Resources Partners
LP’s Quarterly Report on
Form 10-Q
filed November 9, 2009 (File
No. 001-33303)).
|
|
|
10
|
.40
|
|
—
|
|
Supplemental Indenture dated September 24, 2009 to
Indenture dated June 18, 2008, among Targa Downstream LP, a
subsidiary of Targa Resources Partners LP, Targa Resources
Partners Finance Corporation, the other Subsidiary Guarantors
and U.S. Bank National Association (incorporated by reference to
Exhibit 4.5 to Targa Resources Partners LP’s Quarterly
Report on
Form 10-Q
filed November 9, 2009 (File
No. 001-33303)).
|
II-20
| |
|
|
|
|
|
|
|
|
10
|
.41
|
|
—
|
|
Supplemental Indenture dated September 24, 2009 to
Indenture dated June 18, 2008, among Targa LSNG GP LLC, a
subsidiary of Targa Resources Partners LP, Targa Resources
Partners Finance Corporation, the other Subsidiary Guarantors
and U.S. Bank National Association (incorporated by reference to
Exhibit 4.7 to Targa Resources Partners LP’s Quarterly
Report on
Form 10-Q
filed November 9, 2009 (File
No. 001-33303)).
|
|
|
10
|
.42
|
|
—
|
|
Supplemental Indenture dated September 24, 2009 to
Indenture dated June 18, 2008, among Targa LSNG LP, a
subsidiary of Targa Resources Partners LP, Targa Resources
Partners Finance Corporation, the other Subsidiary Guarantors
and U.S. Bank National Association (incorporated by reference to
Exhibit 4.9 to Targa Resources Partners LP’s Quarterly
Report on
Form 10-Q
filed November 9, 2009 (File
No. 001-33303)).
|
|
|
10
|
.43
|
|
—
|
|
Supplemental Indenture dated September 24, 2009 to
Indenture dated June 18, 2008, among Targa Sparta LLC, a
subsidiary of Targa Resources Partners LP, Targa Resources
Partners Finance Corporation, the other Subsidiary Guarantors
and U.S. Bank National Association (incorporated by reference to
Exhibit 4.11 to Targa Resources Partners LP’s
Quarterly Report on
Form 10-Q
filed November 9, 2009 (File
No. 001-33303)).
|
|
|
10
|
.44
|
|
—
|
|
Supplemental Indenture dated September 24, 2009 to
Indenture dated June 18, 2008, among Midstream Barge
Company LLC, a subsidiary of Targa Resources Partners LP, Targa
Resources Partners Finance Corporation, the other Subsidiary
Guarantors and U.S. Bank National Association (incorporated by
reference to Exhibit 4.13 to Targa Resources Partners
LP’s Quarterly Report on
Form 10-Q
filed November 9, 2009 (File
No. 001-33303)).
|
|
|
10
|
.45
|
|
—
|
|
Supplemental Indenture dated September 24, 2009 to
Indenture dated June 18, 2008, among Targa Retail Electric
LLC, a subsidiary of Targa Resources Partners LP, Targa
Resources Partners Finance Corporation, the other Subsidiary
Guarantors and U.S. Bank National Association (incorporated by
reference to Exhibit 4.15 to Targa Resources Partners
LP’s Quarterly Report on
Form 10-Q
filed November 9, 2009 (File
No. 001-33303)).
|
|
|
10
|
.46
|
|
—
|
|
Supplemental Indenture dated September 24, 2009 to
Indenture dated June 18, 2008, among Targa NGL Pipeline
Company LLC, a subsidiary of Targa Resources Partners LP, Targa
Resources Partners Finance Corporation, the other Subsidiary
Guarantors and U.S. Bank National Association (incorporated by
reference to Exhibit 4.17 to Targa Resources Partners
LP’s Quarterly Report on
Form 10-Q
filed November 9, 2009 (File
No. 001-33303)).
|
|
|
10
|
.47
|
|
—
|
|
Supplemental Indenture dated September 24, 2009 to
Indenture dated June 18, 2008, among Targa Transport LLC, a
subsidiary of Targa Resources Partners LP, Targa Resources
Partners Finance Corporation, the other Subsidiary Guarantors
and U.S. Bank National Association (incorporated by reference to
Exhibit 4.19 to Targa Resources Partners LP’s
Quarterly Report on
Form 10-Q
filed November 9, 2009 (File
No. 001-33303)).
|
|
|
10
|
.48
|
|
—
|
|
Supplemental Indenture dated September 24, 2009 to
Indenture dated June 18, 2008, among Targa Co-Generation
LLC, a subsidiary of Targa Resources Partners LP, Targa
Resources Partners Finance Corporation, the other Subsidiary
Guarantors and U.S. Bank National Association (incorporated by
reference to Exhibit 4.21 to Targa Resources Partners
LP’s Quarterly Report on
Form 10-Q
filed November 9, 2009 (File
No. 001-33303)).
|
|
|
10
|
.49
|
|
—
|
|
Supplemental Indenture dated September 24, 2009 to
Indenture dated June 18, 2008, among Targa Liquids GP LLC,
a subsidiary of Targa Resources Partners LP, Targa Resources
Partners Finance Corporation, the other Subsidiary Guarantors
and U.S. Bank National Association (incorporated by reference to
Exhibit 4.23 to Targa Resources Partners LP’s
Quarterly Report on
Form 10-Q
filed November 9, 2009 (File
No. 001-33303)).
|
|
|
10
|
.50
|
|
—
|
|
Supplemental Indenture dated September 24, 2009 to
Indenture dated June 18, 2008, among Targa Liquids
Marketing and Trade, a subsidiary of Targa Resources Partners
LP, Targa Resources Partners Finance Corporation, the other
Subsidiary Guarantors and U.S. Bank National Association
(incorporated by reference to Exhibit 4.25 to Targa
Resources Partners LP’s Quarterly Report on
Form 10-Q
filed November 9, 2009 (File
No. 001-33303)).
|
|
|
10
|
.51
|
|
—
|
|
Supplemental Indenture dated April 27, 2010 to Indenture
dated June 18, 2008, among Targa Gas Marketing LLC, a
subsidiary of Targa Resources Partners LP, Targa Resources
Partners Finance Corporation, the other Subsidiary Guarantors
and U.S. Bank National Association (incorporated by reference to
Exhibit 4.1 to Targa Resources Partners LP’s Quarterly
Report on
Form 10-Q
filed May 6, 2010 (File
No. 001-33303)).
|
II-21
| |
|
|
|
|
|
|
|
|
10
|
.52
|
|
—
|
|
Supplemental Indenture dated April 27, 2010 to Indenture
dated June 18, 2008, among Targa Midstream Services Limited
Partnership, a subsidiary of Targa Resources Partners LP, Targa
Resources Partners Finance Corporation, the other Subsidiary
Guarantors and U.S. Bank National Association (incorporated by
reference to Exhibit 4.3 to Targa Resources Partners
LP’s Quarterly Report on
Form 10-Q
filed May 6, 2010 (File
No. 001-33303)).
|
|
|
10
|
.53
|
|
—
|
|
Supplemental Indenture dated April 27, 2010 to Indenture
dated June 18, 2008, among Targa Permian LP, a subsidiary
of Targa Resources Partners LP, Targa Resources Partners Finance
Corporation, the other Subsidiary Guarantors and U.S. Bank
National Association (incorporated by reference to
Exhibit 4.5 to Targa Resources Partners LP’s Quarterly
Report on
Form 10-Q
filed May 6, 2010 (File
No. 001-33303)).
|
|
|
10
|
.54
|
|
—
|
|
Supplemental Indenture dated April 27, 2010 to Indenture
dated June 18, 2008, among Targa Permian Intrastate LLC, a
subsidiary of Targa Resources Partners LP, Targa Resources
Partners Finance Corporation, the other Subsidiary Guarantors
and U.S. Bank National Association (incorporated by reference to
Exhibit 4.7 to Targa Resources Partners LP’s Quarterly
Report on
Form 10-Q
filed May 6, 2010 (File
No. 001-33303)).
|
|
|
10
|
.55
|
|
—
|
|
Supplemental Indenture dated April 27, 2010 to Indenture
dated June 18, 2008, among Targa Straddle LP, a subsidiary
of Targa Resources Partners LP, Targa Resources Partners Finance
Corporation, the other Subsidiary Guarantors and U.S. Bank
National Association (incorporated by reference to
Exhibit 4.9 to Targa Resources Partners LP’s Quarterly
Report on
Form 10-Q
filed May 6, 2010 (File
No. 001-33303)).
|
|
|
10
|
.56
|
|
—
|
|
Supplemental Indenture dated April 27, 2010 to Indenture
dated June 18, 2008, among Targa Straddle GP LLC, a
subsidiary of Targa Resources Partners LP, Targa Resources
Partners Finance Corporation, the other Subsidiary Guarantors
and U.S. Bank National Association (incorporated by reference to
Exhibit 4.11 to Targa Resources Partners LP’s
Quarterly Report on
Form 10-Q
filed May 6, 2010 (File
No. 001-33303)).
|
|
|
10
|
.57
|
|
—
|
|
Supplemental Indenture dated August 10, 2010 to Indenture
dated June 18, 2008, among Targa MLP Capital, a subsidiary
of Targa Resources Partners LP, Targa Resources Partners Finance
Corporation, the other Subsidiary Guarantors and U.S. Bank
National Association (incorporated by reference to
Exhibit 10.46 to Targa Resources Corp.’s Registration
Statement on
Form S-1/A
filed November 12, 2010 (File
No. 333-169277)).
|
|
|
10
|
.58
|
|
—
|
|
Supplemental Indenture dated September 20, 2010 to
Indenture dated June 18, 2008, among Targa Versado LP and
Targa Versado GP LLC, subsidiaries of Targa Resources Partners
LP, Targa Resources Partners Finance Corporation, the other
Subsidiary Guarantors and U.S. Bank National Association
(incorporated by reference to Exhibit 4.3 to Targa
Resources Partners LP’s Quarterly Report on
Form 10-Q
filed November 5, 2010 (File
No. 001-33303)).
|
|
|
10
|
.59
|
|
—
|
|
Supplemental Indenture dated October 25, 2010 to Indenture
dated June 18, 2008, among Targa Capital LLC, a subsidiary
of Targa Resources Partners LP, Targa Resources Partners Finance
Corporation, the other Subsidiary Guarantors and U.S. Bank
National Association (incorporated by reference to
Exhibit 4.6 to Targa Resources Partners LP’s Quarterly
Report on
Form 10-Q
filed November 5, 2010 (File
No. 001-33303)).
|
|
|
10
|
.60
|
|
—
|
|
Registration Rights Agreement dated July 6, 2009, among
Targa Resources Partners LP, Targa Resources Partners Finance
Corporation, the Guarantors named therein and the initial
purchasers named therein (incorporated by reference to
Exhibit 4.2 to Targa Resources Partners LP’s Current
Report on
Form 8-K
filed July 6, 2009 (File
No. 001-33303)).
|
|
|
10
|
.61
|
|
—
|
|
Indenture dated as of July 6, 2009, among Targa Resources
Partners LP, Targa Resources Partners Finance Corporation, the
Guarantors named therein and U.S. Bank National Association
(incorporated by reference to Exhibit 4.1 to Targa
Resources Partners LP’s Current Report on
Form 8-K
filed July 6, 2009 (File
No. 001-33303)).
|
|
|
10
|
.62
|
|
—
|
|
Supplemental Indenture dated September 24, 2009 to
Indenture dated July 6, 2009, among Targa Downstream GP
LLC, a subsidiary of Targa Resources Partners LP, Targa
Resources Partners Finance Corporation, the other Subsidiary
Guarantors and U.S. Bank National Association (incorporated by
reference to Exhibit 4.4 to Targa Resources Partners
LP’s Quarterly Report on
Form 10-Q
filed November 9, 2009 (File
No. 001-33303)).
|
II-22
| |
|
|
|
|
|
|
|
|
10
|
.63
|
|
—
|
|
Supplemental Indenture dated September 24, 2009 to
Indenture dated July 6, 2009, among Targa Downstream LP, a
subsidiary of Targa Resources Partners LP, Targa Resources
Partners Finance Corporation, the other Subsidiary Guarantors
and U.S. Bank National Association (incorporated by reference to
Exhibit 4.6 to Targa Resources Partners LP’s Quarterly
Report on
Form 10-Q
filed November 9, 2009 (File
No. 001-33303)).
|
|
|
10
|
.64
|
|
—
|
|
Supplemental Indenture dated September 24, 2009 to
Indenture dated July 6, 2009, among Targa LSNG GP LLC, a
subsidiary of Targa Resources Partners LP, Targa Resources
Partners Finance Corporation, the other Subsidiary Guarantors
and U.S. Bank National Association (incorporated by reference to
Exhibit 4.8 to Targa Resources Partners LP’s Quarterly
Report on
Form 10-Q
filed November 9, 2009 (File
No. 001-33303)).
|
|
|
10
|
.65
|
|
—
|
|
Supplemental Indenture dated September 24, 2009 to
Indenture dated July 6, 2009, among Targa LSNG LP, a
subsidiary of Targa Resources Partners LP, Targa Resources
Partners Finance Corporation, the other Subsidiary Guarantors
and U.S. Bank National Association (incorporated by reference to
Exhibit 4.10 to Targa Resources Partners LP’s
Quarterly Report on
Form 10-Q
filed November 9, 2009 (File
No. 001-33303)).
|
|
|
10
|
.66
|
|
—
|
|
Supplemental Indenture dated September 24, 2009 to
Indenture dated July 6, 2009, among Targa Sparta LLC, a
subsidiary of Targa Resources Partners LP, Targa Resources
Partners Finance Corporation, the other Subsidiary Guarantors
and U.S. Bank National Association (incorporated by reference to
Exhibit 4.12 to Targa Resources Partners LP’s
Quarterly Report on
Form 10-Q
filed November 9, 2009 (File
No. 001-33303)).
|
|
|
10
|
.67
|
|
—
|
|
Supplemental Indenture dated September 24, 2009 to
Indenture dated July 6, 2009, among Midstream Barge Company
LLC, a subsidiary of Targa Resources Partners LP, Targa
Resources Partners Finance Corporation, the other Subsidiary
Guarantors and U.S. Bank National Association (incorporated by
reference to Exhibit 4.14 to Targa Resources Partners
LP’s Quarterly Report on
Form 10-Q
filed November 9, 2009 (File
No. 001-33303)).
|
|
|
10
|
.68
|
|
—
|
|
Supplemental Indenture dated September 24, 2009 to
Indenture dated July 6, 2009, among Targa Retail Electric
LLC, a subsidiary of Targa Resources Partners LP, Targa
Resources Partners Finance Corporation, the other Subsidiary
Guarantors and U.S. Bank National Association (incorporated by
reference to Exhibit 4.16 to Targa Resources Partners
LP’s Quarterly Report on
Form 10-Q
filed November 9, 2009 (File
No. 001-33303)).
|
|
|
10
|
.69
|
|
—
|
|
Supplemental Indenture dated September 24, 2009 to
Indenture dated July 6, 2009, among Targa NGL Pipeline
Company LLC, a subsidiary of Targa Resources Partners LP, Targa
Resources Partners Finance Corporation, the other Subsidiary
Guarantors and U.S. Bank National Association (incorporated by
reference to Exhibit 4.18 to Targa Resources Partners
LP’s Quarterly Report on
Form 10-Q
filed November 9, 2009 (File
No. 001-33303)).
|
|
|
10
|
.70
|
|
—
|
|
Supplemental Indenture dated September 24, 2009 to
Indenture dated July 6, 2009, among Targa Transport LLC, a
subsidiary of Targa Resources Partners LP, Targa Resources
Partners Finance Corporation, the other Subsidiary Guarantors
and U.S. Bank National Association (incorporated by reference to
Exhibit 4.20 to Targa Resources Partners LP’s
Quarterly Report on
Form 10-Q
filed November 9, 2009 (File
No. 001-33303)).
|
|
|
10
|
.71
|
|
—
|
|
Supplemental Indenture dated September 24, 2009 to
Indenture dated July 6, 2009, among Targa Co-Generation
LLC, a subsidiary of Targa Resources Partners LP, Targa
Resources Partners Finance Corporation, the other Subsidiary
Guarantors and U.S. Bank National Association (incorporated by
reference to Exhibit 4.22 to Targa Resources Partners
LP’s Quarterly Report on
Form 10-Q
filed November 9, 2009 (File
No. 001-33303)).
|
|
|
10
|
.72
|
|
—
|
|
Supplemental Indenture dated September 24, 2009 to
Indenture dated July 6, 2009, among Targa Liquids GP LLC, a
subsidiary of Targa Resources Partners LP, Targa Resources
Partners Finance Corporation, the other Subsidiary Guarantors
and U.S. Bank National Association (incorporated by reference to
Exhibit 4.24 to Targa Resources Partners LP’s
Quarterly Report on
Form 10-Q
filed November 9, 2009 (File
No. 001-33303)).
|
|
|
10
|
.73
|
|
—
|
|
Supplemental Indenture dated September 24, 2009 to
Indenture dated July 6, 2009, among Targa Liquids Marketing
and Trade, a subsidiary of Targa Resources Partners LP, Targa
Resources Partners Finance Corporation, the other Subsidiary
Guarantors and U.S. Bank National Association (incorporated by
reference to Exhibit 4.26 to Targa Resources Partners
LP’s Quarterly Report on
Form 10-Q
filed November 9, 2009 (File
No. 001-33303)).
|
II-23
| |
|
|
|
|
|
|
|
|
10
|
.74
|
|
—
|
|
Supplemental Indenture dated April 27, 2010 to Indenture
dated July 6, 2009, among Targa Gas Marketing LLC, a
subsidiary of Targa Resources Partners LP, Targa Resources
Partners Finance Corporation, the other Subsidiary Guarantors
and U.S. Bank National Association (incorporated by reference to
Exhibit 4.2 to Targa Resources Partners LP’s Quarterly
Report on
Form 10-Q
filed May 6, 2010 (File
No. 001-33303)).
|
|
|
10
|
.75
|
|
—
|
|
Supplemental Indenture dated April 27, 2010 to Indenture
dated July 6, 2009, among Targa Midstream Services Limited
Partnership, a subsidiary of Targa Resources Partners LP, Targa
Resources Partners Finance Corporation, the other Subsidiary
Guarantors and U.S. Bank National Association (incorporated by
reference to Exhibit 4.4 to Targa Resources Partners
LP’s Quarterly Report on
Form 10-Q
filed May 6, 2010 (File
No. 001-33303)).
|
|
|
10
|
.76
|
|
—
|
|
Supplemental Indenture dated April 27, 2010 to Indenture
dated July 6, 2009, among Targa Permian LP, a subsidiary of
Targa Resources Partners LP, Targa Resources Partners Finance
Corporation, the other Subsidiary Guarantors and U.S. Bank
National Association (incorporated by reference to
Exhibit 4.6 to Targa Resources Partners LP’s Quarterly
Report on
Form 10-Q
filed May 6, 2010 (File
No. 001-33303)).
|
|
|
10
|
.77
|
|
—
|
|
Supplemental Indenture dated April 27, 2010 to Indenture
dated July 6, 2009, among Targa Permian Intrastate LLC, a
subsidiary of Targa Resources Partners LP, Targa Resources
Partners Finance Corporation, the other Subsidiary Guarantors
and U.S. Bank National Association (incorporated by reference to
Exhibit 4.8 to Targa Resources Partners LP’s Quarterly
Report on
Form 10-Q
filed May 6, 2010 (File
No. 001-33303)).
|
|
|
10
|
.78
|
|
—
|
|
Supplemental Indenture dated April 27, 2010 to Indenture
dated July 6, 2009, among Targa Straddle LP, a subsidiary
of Targa Resources Partners LP, Targa Resources Partners Finance
Corporation, the other Subsidiary Guarantors and U.S. Bank
National Association (incorporated by reference to
Exhibit 4.10 to Targa Resources Partners LP’s
Quarterly Report on
Form 10-Q
filed May 6, 2010 (File
No. 001-33303)).
|
|
|
10
|
.79
|
|
—
|
|
Supplemental Indenture dated April 27, 2010 to Indenture
dated July 6, 2009, among Targa Straddle GP LLC, a
subsidiary of Targa Resources Partners LP, Targa Resources
Partners Finance Corporation, the other Subsidiary Guarantors
and U.S. Bank National Association (incorporated by reference to
Exhibit 4.12 to Targa Resources Partners LP’s
Quarterly Report on
Form 10-Q
filed May 6, 2010 (File
No. 001-33303)).
|
|
|
10
|
.80
|
|
—
|
|
Supplemental Indenture dated August 10, 2010 to Indenture
dated July 6, 2009, among Targa MLP Capital, a subsidiary
of Targa Resources Partners LP, Targa Resources Partners Finance
Corporation, the other Subsidiary Guarantors and U.S. Bank
National Association (incorporated by reference to
Exhibit 10.66 to Targa Resources Corp.’s Registration
Statement on
Form S-1/A
filed November 12, 2010 (File
No. 333-169277)).
|
|
|
10
|
.81
|
|
—
|
|
Supplemental Indenture dated September 20, 2010 to
Indenture dated July 6, 2009, among Targa Versado LP and
Targa Versado GP LLC, subsidiaries of Targa Resources Partners
LP, Targa Resources Partners Finance Corporation, the other
Subsidiary Guarantors and U.S. Bank National Association
(incorporated by reference to Exhibit 4.4 to Targa
Resources Partners LP’s Quarterly Report on
Form 10-Q
filed November 5, 2010 (File
No. 001-33303)).
|
|
|
10
|
.82
|
|
—
|
|
Supplemental Indenture dated October 25, 2010 to Indenture
dated July 6, 2009, among Targa Capital LLC, a subsidiary
of Targa Resources Partners LP, Targa Resources Partners Finance
Corporation, the other Subsidiary Guarantors and U.S. Bank
National Association (incorporated by reference to
Exhibit 4.7 to Targa Resources Partners LP’s Quarterly
Report on
Form 10-Q
filed November 5, 2010 (File
No. 001-33303)).
|
|
|
10
|
.83
|
|
—
|
|
First Supplemental Indenture dated February 2, 2011 to that
certain Indenture dated July 6, 2009 (incorporated by
reference to Exhibit 4.3 to Targa Resources Partners
LP’s Current Report on
Form 8-K
filed February 2, 2011 (File
No. 001-33303)).
|
|
|
10
|
.84
|
|
—
|
|
Registration Rights Agreement dated as of August 13, 2010
among the Issuers, the Guarantors and Banc of America Securities
LLC, as representative of the several initial purchasers
(incorporated by reference to Exhibit 4.2 to Targa
Resources Partners LP’s Current Report on
Form 8-K
filed August 16, 2010 (File
No. 001-33303)).
|
II-24
| |
|
|
|
|
|
|
|
|
10
|
.85
|
|
—
|
|
Indenture dated as of August 13, 2010 among the Issuers and
the Guarantors and U.S. Bank National Association, as trustee
(incorporated by reference to Exhibit 4.1 to Targa
Resources Partners LP’s Current Report on
Form 8-K
filed August 16, 2010 (File
No. 001-33303)).
|
|
|
10
|
.86
|
|
—
|
|
Supplemental Indenture dated September 20, 2010 to
Indenture dated August 13, 2010, among Targa Versado LP and
Targa Versado GP LLC, subsidiaries of Targa Resources Partners
LP, Targa Resources Partners Finance Corporation, the other
Subsidiary Guarantors and U.S. Bank National Association
(incorporated by reference to Exhibit 4.5 to Targa
Resources Partners LP’s Quarterly Report on
Form 10-Q
filed November 5, 2010 (File
No. 001-
33303)).
|
|
|
10
|
.87
|
|
—
|
|
Supplemental Indenture dated October 25, 2010 to Indenture
dated August 13, 2010, among Targa Capital LLC, a
subsidiary of Targa Resources Partners LP, Targa Resources
Partners Finance Corporation, the other Subsidiary Guarantors
and U.S. Bank National Association (incorporated by reference to
Exhibit 4.8 to Targa Resources Partners LP’s Quarterly
Report on
Form 10-Q
filed November 5, 2010 (File
No. 001-33303)).
|
|
|
10
|
.88
|
|
—
|
|
Registration Rights Agreement dated February 2, 2011 among
the Issuers, the Guarantors, Deutsche Bank Securities Inc., as
representative of the several initial purchasers, and the Dealer
Managers (incorporated by reference to Exhibit 4.2 to Targa
Resources Partners LP’s Current Report on
Form 8-K
filed February 2, 2011 (File
No. 001-33303)).
|
|
|
10
|
.89
|
|
—
|
|
Indenture dated February 2, 2011 among the Issuers, the
Guarantors and U.S. Bank National Association, as trustee
thereto (incorporated by reference to Exhibit 4.1 to Targa
Resources Partners LP’s Current Report on
Form 8-K
filed February 2, 2011 (File
No. 001-33303)).
|
|
|
10
|
.90
|
|
—
|
|
Contribution, Conveyance and Assumption Agreement, dated
February 14, 2007, by and among Targa Resources Partners
LP, Targa Resources Operating LP, Targa Resources GP LLC, Targa
Resources Operating GP LLC, Targa GP Inc., Targa LP Inc., Targa
Regulated Holdings LLC, Targa North Texas GP LLC and Targa North
Texas LP (incorporated by reference to Exhibit 10.2 to
Targa Resources Partners LP’s Current Report on
Form 8-K
filed February 16, 2007 (File
No. 001-33303)).
|
|
|
10
|
.91
|
|
—
|
|
Contribution, Conveyance and Assumption Agreement, dated
October 24, 2007, by and among Targa Resources Partners LP,
Targa Resources Holdings LP, Targa TX LLC, Targa TX PS LP, Targa
LA LLC, Targa LA PS LP and Targa North Texas GP LLC
(incorporated by reference to Exhibit 10.4 to Targa
Resources Partners LP’s Current Report on
Form 8-K
filed October 24, 2007 (File
No. 001-33303)).
|
|
|
10
|
.92
|
|
—
|
|
Contribution, Conveyance and Assumption Agreement, dated
September 24, 2009, by and among Targa Resources Partners
LP, Targa GP Inc., Targa LP Inc., Targa Resources Operating LP
and Targa North Texas GP LLC (incorporated by reference to
Exhibit 10.1 to Targa Resources Partners LP’s Current
Report on
Form 8-K
filed September 24, 2009 (File
No. 001-33303)).
|
|
|
10
|
.93
|
|
—
|
|
Contribution, Conveyance and Assumption Agreement, dated
April 27, 2010, by and among Targa Resources Partners LP,
Targa LP Inc., Targa Permian GP LLC, Targa Midstream Holdings
LLC, Targa Resources Operating LP, Targa North Texas GP LLC and
Targa Resources Texas GP LLC (incorporated by reference to
Exhibit 10.1 to Targa Resources Partners LP’s Current
Report on
Form 8-K
filed April 29, 2010 (File
No. 001-33303)).
|
|
|
10
|
.94
|
|
—
|
|
Contribution, Conveyance and Assumption Agreement, dated
August 25, 2010, by and among Targa Resources Partners LP,
Targa Versado Holdings LP and Targa North Texas GP LLC
(incorporated by reference to Exhibit 10.1 to Targa
Resources Partners LP’s Current Report on
Form 8-K
filed August 26, 2010 (File
No. 001-33303)).
|
|
|
10
|
.95
|
|
—
|
|
Contribution, Conveyance and Assumption Agreement, dated
September 28, 2010, by and among Targa Resources Partners
LP, Targa Versado Holdings LP and Targa North Texas GP LLC
(incorporated by reference to Exhibit 10.1 to Targa
Resources Partners LP’s Current Report on
Form 8-K
filed October 4, 2010 (file
No. 001-33303)).
|
|
|
10
|
.96
|
|
—
|
|
Second Amended and Restated Omnibus Agreement, dated
September 24, 2009, by and among Targa Resources Partners
LP, Targa Resources, Inc., Targa Resources LLC and Targa
Resources GP LLC (incorporated by reference to Exhibit 10.2
to Targa Resources Partners LP’s Current Report on
Form 8-K
filed September 24, 2009 (file
No. 001-33303)).
|
II-25
| |
|
|
|
|
|
|
|
|
10
|
.97
|
|
—
|
|
First Amendment to Second Amended and Restated Omnibus
Agreement, dated April 27, 2010, by and among Targa
Resources Partners LP, Targa Resources, Inc., Targa Resources
LLC and Targa Resources GP LLC (incorporated by reference to
Exhibit 10.2 to Targa Resources Partners LP’s Current
Report on
Form 8-K
filed April 29, 2010 (File
No. 001-33303)).
|
|
|
10
|
.98+
|
|
—
|
|
Form of Indemnification Agreement between Targa Resources
Investments Inc. and each of the directors and officers thereof
(incorporated by reference to Exhibit 10.4 to Targa
Resources Corp.’s Registration Statement on
Form S-1/A
filed November 8, 2010 (File
No. 333-169277)).
|
|
|
10
|
.99+
|
|
—
|
|
Targa Resources Partners LP Indemnification Agreement for Barry
R. Pearl dated February 14, 2007 (incorporated by reference
to Exhibit 10.11 to Targa Resources Partners LP’s
Annual Report on
Form 10-K
filed April 2, 2007 (File
No. 001-33303)).
|
|
|
10
|
.100+
|
|
—
|
|
Targa Resources Partners LP Indemnification Agreement for Robert
B. Evans dated February 14, 2007 (incorporated by reference
to Exhibit 10.12 to Targa Resources Partners LP’s
Annual Report on
Form 10-K
filed April 2, 2007 (File
No. 001-33303)).
|
|
|
10
|
.101+
|
|
—
|
|
Targa Resources Partners LP Indemnification Agreement for
Williams D. Sullivan dated February 14, 2007 (incorporated
by reference to Exhibit 10.13 to Targa Resources Partners
LP’s Annual Report on
Form 10-K
filed April 2, 2007 (File
No. 001-33303)).
|
|
|
10
|
.102
|
|
—
|
|
Amended and Restated Registration Rights Agreement dated as of
October 31, 2005 (incorporated by reference to
Exhibit 10.1 to Targa Resources Corp.’s Registration
Statement on
Form S-1/A
filed November 12, 2010 (File
No. 333-169277)).
|
|
|
21
|
.1
|
|
—
|
|
List of Subsidiaries of Targa Resources Corp. (incorporated by
reference to Exhibit 21.1 to the Company’s Annual
Report on
Form 10-K
filed February 28, 2011 (File
No. 001-34991)).
|
|
|
23
|
.1*
|
|
|
|
Consent of PricewaterhouseCoopers LLP.
|
|
|
23
|
.2*
|
|
|
|
Consent of Vinson & Elkins L.L.P. (contained in
Exhibit 5.1).
|
|
|
24
|
.1***
|
|
|
|
Powers of Attorney.
|
|
|
|
|
*
|
|
Filed herewith
|
| |
|
**
|
|
Pursuant to Item 601(b)(2) of
Regulation S-K,
the Company agrees to furnish supplementally a copy of any
omitted exhibit or Schedule to the SEC upon request.
|
|
|
|
|
+
|
|
Management contract or compensatory
plan or arrangement
|
II-26