Attached files
| file | filename |
|---|---|
| EX-31.1 - TOP FLIGHT GAMEBIRDS, INC. | v218247_ex31-1.htm |
| EX-31.2 - TOP FLIGHT GAMEBIRDS, INC. | v218247_ex31-2.htm |
| EX-32.2 - TOP FLIGHT GAMEBIRDS, INC. | v218247_ex32-2.htm |
| EX-32.1 - TOP FLIGHT GAMEBIRDS, INC. | v218247_ex32-1.htm |
SECURITIES AND EXCHANGE COMMISSION
Washington, D.C. 20-549
FORM 10-Q/A
Amendment No. 1
(Mark One)
|
x
|
QUARTERLY REPORT PURSUANT TO SECTION 13 OR 15(d) OF THE SECURITIES EXCHANGE ACT OF 1934
|
For the quarterly period ended September 30, 2010
or
|
o
|
TRANSITION REPORT UNDER SECTION 13 OR 15(d) OF THE EXCHANGE ACT
|
For the transition period from ______________ to _____________
Commission file number: 333-152286
GLOBAL PHARM HOLDINGS GROUP, INC.
(Exact name of registrant as specified in its charter)
|
Delaware
(State or other jurisdiction of incorporation or
organization)
|
20-8767223
(I.R.S. Employer Identification No.)
|
|
|
25/F New World Center, No. 6009 Yitian Road, Futian District,
Shenzhen,
People’s Republic of China
(Address of principal executive offices)
|
518026
(Zip Code)
|
86-755-83230226
(Registrant’s telephone number, including area ccode)
Top Flight Gamebirds, Inc.
4746 Lewis Drive, Bartlesville, OK 74006
February 28
(Former name, former address and former fiscal year, if changed since last report)
Indicate by check mark whether the registrant (1) has filed reports required to be filed by Section 13 or 15(d) of the Securities Exchange Act of 1934 during the preceding 12 months (or for such shorter period that the registrant was required to file such reports), and (2) has been subject to such filing requirements for the past 90 days. Yes x No ¨
Indicate by check mark whether the registrant has submitted electronically and posted on its corporate Web site, if any, every Interactive Data File required to be submitted and posted pursuant to Rule 405 of Regulation S-T (§232.405 of this chapter) during the preceding 12 months (or for such shorter period that the registrant was required to submit and post such files).
Yes ¨ No ¨
Indicate by check mark whether the registrant is a large accelerated filer, an accelerated filer, a non-accelerated filer or a smaller reporting company. See the definitions of “large accelerated filer,” “accelerated filer” and “smaller reporting company” in Rule 12b-2 of the Exchange Act.
|
Large accelerated filer ¨
|
Accelerated filer ¨
|
|
Non-accelerated filer ¨
|
Smaller reporting company x
|
Indicate by check mark whether the registrant is a shell company (as defined in Rule 12b-2 of the Exchange Act).
Yes ¨ No x
APPLICABLE ONLY TO ISSUERS INVOLVED IN BANKRUPTCY
PROCEEDINGS DURING THE PRECEDING FIVE YEARS
Indicate by check mark whether the registrant has filed all documents and reports required to be filed by Sections 12, 13, or 15(d) of the Securities Exchange Act of 1934 subsequent to the distribution of securities under a plan confirmed by a court. Yes ¨ No ¨
APPLICABLE ONLY TO CORPORATE ISSUERS
Indicate the number of shares outstanding of each of the issuer’s classes of common equity, as of the latest practicable date:
As of April 13, 2011, there are 26,000,000 of $0.001 par value common stock issued and outstanding.
2
EXPLANATORY NOTE
This Amendment No. 1 to the Quarterly Report on Form 10-Q (this “Amended 10-Q”) of Global Pharm Holdings Group, Inc. (the “Company”) amends and restates, in its entirety, the Company’s Quarterly Report on Form 10-Q for the quarterly period ended September 30, 2010 that was filed with the Securities and Exchange Commission (the “SEC”) on November 15, 2010 (the “Original 10-Q”).
As stated in our Current Report on Form 8-K, filed with the SEC on March 29, 2011, in connection with the year end financial statement close process, the Company determined that it should recognize a compensation expense for the right to acquire shares issued to 20 members of the Company’s management pursuant to an Earn-in Agreement dated June 29, 2010, as thereafter amended, and as defined and described in further detail in this Amended 10-Q. As a result thereof, the Company’s board of directors has concluded that the Original 10-Q (including the Consolidated Financial Statements of the Company for the period indicated therein) did not properly account for the compensation expense in accordance with accounting principles generally accepted in the United States and, as a result, cannot be relied upon and must be restated.
This Amended 10-Q restates, in its entirety, the Original 10-Q and supersedes such prior filing.
3
FORM 10-Q/A
GLOBAL PHARM HOLDINGS GROUP, INC.
INDEX
|
Page
|
|||||
|
PART I
|
FINANCIAL INFORMATION
|
5
|
|||
|
Item 1. Consolidated Financial Statements
|
|
||||
|
Balance Sheets
|
F-2
|
||||
|
Statements of Income and Comprehensive Income
|
F-3
|
||||
|
Statements of Shareholders’ Equity
|
F-4
|
||||
|
Statements of Cash Flows
|
F-5
|
||||
|
Notes to Financial Statements
|
F-6 –F26
|
||||
|
Item 2. Management’s Discussion and Analysis of Financial Condition or Plan of Operation
|
6
|
||||
|
Item 3. Quantitative and Qualitative Disclosures About Market Risk.
|
18
|
||||
|
Item 4. Controls and Procedures.
|
18
|
||||
|
PART II
|
OTHER INFORMATION
|
19
|
|||
|
Item 1. Legal Proceedings.
|
19
|
||||
|
Item 1A. Risk Factors.
|
19
|
||||
|
Item 2. Unregistered Sales of Equity Securities and Use of Proceeds.
|
19
|
||||
|
Item 3. Defaults Upon Senior Securities.
|
19
|
||||
|
Item 4. (Removed and Reserved).
|
19
|
||||
|
Item 5. Other Information.
|
19
|
||||
|
Item 6. Exhibits.
|
20
|
4
CONTENTS
|
Independent Auditors' Review Report
|
||||
|
Consolidated Financial Statements
|
||||
|
Balance Sheets
|
F-2
|
|||
|
Statements of Income and Comprehensive Income
|
F-3
|
|||
|
Statements of Stockholders’ Equity
|
F-4
|
|||
|
Statements of Cash Flows
|
F-5
|
|||
|
Notes to Financial Statements
|
F-6 - F-26
|
5
ACSB Acquavella, Chiarelli, Shuster, Berkower & Co., LLP
|
517 Route One
|
Certified Public Accountants and Advisors
|
330 7th Avenue
|
|
Iselin, New Jersey 08830
|
Suite 202
|
|
|
732. 855.9600
|
New York, NY 10001
|
|
|
Fax:732.855.9559
|
212.867.1319
|
|
|
www.acsbco.com
|
INDEPENDENT AUDITORS’ REPORT
To the Board of Directors and Stockholder of
Global Pharm Holdings Group, Inc.
We have reviewed the accompanying consolidated balance sheet and statement of stockholders’ equity of Global Pharm Holdings, Group Inc. at September 30, 2010, and the related consolidated statements of income and comprehensive income, for the three and nine months ended September 30, 2010 and 2009 and cash flows, for the nine months ended September 30, 2010 and 2009, in accordance with Statements on Standards for Accounting and Review Services issued by the American Institute of Certified Public Accountants. All information included in these financial statements is the representation of the management of Global Pharm Holdings Group, Inc.
A review consists principally of inquiries of Company personnel and analytical procedures applied to financial data. It is substantially less in scope than an audit in accordance with generally accepted auditing standards, the objective of which is the expression of an opinion regarding the financial statements taken as a whole. Accordingly, we do not express such an opinion.
Based on our review, we are not aware of any material modifications that should be made to the accompanying financial statements in order for them to be in conformity with generally accepted accounting principles.
We have previously audited, in accordance with auditing standards of the Public Company Accounting Oversight Board (United States), the consolidated balance sheet of the Company as of December 31, 2009 and the related consolidated statements of income and comprehensive income, stockholders’ equity and cash flows for the year then ended; and in our report dated August 2, 2010, we expressed an unqualified opinion on those financial statements. In our opinion, the information set forth in the accompanying consolidated balance sheet as of December 31 2009, is fairly stated, in all material respects, in relation to the consolidated balance sheets from which they have been derived.
/S/ ACQUAVELLA, CHIARELLI, SHUSTER, BERKOWER & CO., LLP
New York, New York 10119
November 15, 2010
Except for Note 15 as to which the date is April 12, 2011
|
New York
|
·
|
New Jersey
|
·
|
San Francisco
|
·
|
Los Angeles
|
·
|
Cayman Islands
|
F-1
GLOBAL PHARM HOLDINGS GROUP, INC.
CONSOLIDATED BALANCE SHEETS
|
As of September 30,
|
As of December 31,
|
|||||||
|
2010
|
2009
|
|||||||
|
(Restated)
|
(Audited)
|
|||||||
|
ASSETS
|
||||||||
|
Current assets:
|
||||||||
|
Cash and cash equivalent
|
$ | 7,830,291 | $ | 7,455,147 | ||||
|
Accounts receivable
|
16,697,751 | 11,707,848 | ||||||
|
Inventories
|
24,015,405 | 9,373,762 | ||||||
|
Other receivable
|
41,608 | - | ||||||
|
Other current assets
|
162,359 | - | ||||||
|
Due from related parties
|
- | 74,568 | ||||||
|
Total current assets
|
48,747,414 | 28,611,325 | ||||||
|
Property, plant and equipment, net
|
203,491 | 229,587 | ||||||
|
Total assets
|
$ | 48,950,905 | $ | 28,840,912 | ||||
|
LIABILITIES AND STOCKHOLDERS' EQUITY
|
||||||||
|
Current liabilities:
|
||||||||
|
Short-term loans
|
$ | 597,184 | $ | 219,751 | ||||
|
Bank acceptance
|
20,875 | 219,751 | ||||||
|
Accounts payable
|
25,190,058 | 13,598,744 | ||||||
|
Accrued salary
|
57,176 | 218,546 | ||||||
|
Income taxes payable
|
1,559,056 | 944,143 | ||||||
|
Other taxes payable
|
265,890 | 552,560 | ||||||
|
Other accrued liabilities
|
207,870 | 161,825 | ||||||
|
Due to related party
|
10,813,711 | 2,665,768 | ||||||
|
Total current liabilities
|
38,711,820 | 18,581,088 | ||||||
|
Stockholders' equity:
|
||||||||
|
Common stock, par value, $ 0.001 per share, 100,000,000 shares authorized, 26,000,000 and 19,094,000 issued and outstanding in 2010 and 2009, respectively.
|
26,000 | 19,094 | ||||||
|
Additional paid-in capital
|
7,708,523 | 2,489,129 | ||||||
|
Statutory surplus reserves
|
1,310,701 | 1,310,701 | ||||||
|
Retained earnings
|
794,376 | 6,206,903 | ||||||
|
Accumulated other comprehensive income
|
399,485 | 233,997 | ||||||
|
Total stockholders' equity
|
10,239,085 | 10,259,824 | ||||||
|
Total liabilities and stockholders' equity
|
$ | 48,950,905 | $ | 28,840,912 | ||||
See accompanying notes to consolidated financial statements.
F-2
GLOBAL PHARM HOLDINGS GROUP, INC.
CONSOLIDATED STATEMENTS OF INCOME AND COMPREHENSIVE INCOME
|
Three months ended
September 30,
|
Nine months ended
September 30,
|
|||||||||||||||
|
2010
|
2009
|
2010
|
2009
|
|||||||||||||
|
(Restated)
|
(Restated)
|
|||||||||||||||
|
Revenues, net
|
$ | 30,617,820 | $ | 18,362,383 | $ | 90,176,505 | $ | 57,415,438 | ||||||||
|
Cost of goods sold
|
24,711,477 | 14,895,327 | 73,622,656 | 46,682,503 | ||||||||||||
|
Gross profit
|
5,906,343 | 3,467,056 | 16,553,849 | 10,732,935 | ||||||||||||
|
Expenses:
|
||||||||||||||||
|
Operating expenses
|
360,572 | 149,663 | 725,424 | 448,308 | ||||||||||||
|
General and administrative
|
4,436,082 | 307,600 | 6,531,617 | 823,457 | ||||||||||||
|
Income from operations
|
1,109,689 | 3,009,793 | 9,296,808 | 9,461,170 | ||||||||||||
|
Other income
|
||||||||||||||||
|
Interest income
|
2,842 | 7,312 | 21,048 | 21,343 | ||||||||||||
|
Miscellaneous expense
|
- | - | - | (1,023 | ) | |||||||||||
|
Income before income taxes
|
1,112,531 | 3,017,105 | 9,317,856 | 9,481,490 | ||||||||||||
|
Provision for income taxes
|
1,184,907 | 745,852 | 3,609,764 | 2,365,726 | ||||||||||||
|
Net (loss) income
|
(72,376 | ) | 2,271,253 | 5,708,092 | 7,115,764 | |||||||||||
|
Other comprehensive income
|
||||||||||||||||
|
Foreign currency translation adjustment
|
(174,718 | ) | 40,700 | (142,492 | ) | (1,584 | ) | |||||||||
|
Total comprehensive income
|
$ | (247,094 | ) | $ | 2,311,953 | $ | 5,565,600 | $ | 7,114,180 | |||||||
|
Earnings per share of common stock:
|
||||||||||||||||
|
Basic and diluted earnings per share
|
$ | (0.00 | ) | $ | 0.12 | $ | 0.22 | $ | 0.37 | |||||||
|
Basic and diluted weighted average shares
|
26,000,000 | 19,094,000 | 26,000,000 | 19,094,000 | ||||||||||||
See accompanying notes to consolidated financial statements.
F-3
GLOBAL PHARM HOLDINGS GROUP, INC.
CONSOLIDATED STATEMENTS OF STOCKHOLDERS' EQUITY
FOR THE PERIOD ENDED SEPTEMBER 30, 2010 (Restated)
|
Accumulated
|
||||||||||||||||||||||||||||
|
Additional
|
other
|
Total
|
||||||||||||||||||||||||||
|
Common Stock
|
paid-in
|
Retained
|
Statuary
|
comprehensive
|
stockholders'
|
|||||||||||||||||||||||
|
Shares
|
Amount
|
capital
|
earnings
|
reserve
|
income
|
equity
|
||||||||||||||||||||||
|
Balance, January 1, 2009
|
19,094,000 | $ | 19,094 | $ | 2,489,129 | $ | 3,121,166 | $ | 367,238 | $ | 276,245 | $ | 6,272,872 | |||||||||||||||
|
Net income
|
10,901,402 | 10,901,402 | ||||||||||||||||||||||||||
|
Dividend *
|
(6,872,202 | ) | (6,872,202 | ) | ||||||||||||||||||||||||
|
Transfer to statutory reserve
|
(943,463 | ) | 943,463 | - | ||||||||||||||||||||||||
|
Foreign currency translation adjustments
|
(42,248 | ) | (42,248 | ) | ||||||||||||||||||||||||
|
Balance, December 31, 2009
|
19,094,000 | 19,094 | 2,489,129 | 6,206,903 | 1,310,701 | 233,997 | 10,259,824 | |||||||||||||||||||||
|
Reverse merger transaction elimination of accumulated deficit
|
(21,621 | ) | (21,621 | ) | ||||||||||||||||||||||||
|
Previously issued Top Flight stock
|
5,106,000 | 5,106 | 16,515 | 21,621 | ||||||||||||||||||||||||
|
Shares issued in merger
|
1,800,000 | 1,800 | (1,800 | ) | - | |||||||||||||||||||||||
|
Net income
|
5,708,092 | 5,708,092 | ||||||||||||||||||||||||||
|
Stock-based compensation
|
4,476,300 | 4,476,300 | ||||||||||||||||||||||||||
|
Merger cost
|
750,000 | 750,000 | ||||||||||||||||||||||||||
|
Dividend *
|
(10,812,639 | ) | (11,120,619 | ) | ||||||||||||||||||||||||
|
Foreign currency translation adjustments
|
(142,492 | ) | 165,488 | |||||||||||||||||||||||||
|
Balance, September 30, 2010
|
26,000,000 | $ | 26,000 | $ | 7,708,523 | $ | 1,102,356 | $ | 1,310,701 | $ | 91,505 | $ | 10,239,085 | |||||||||||||||
* The dividend was paid to the private stockholders prior to the Reverse Merger
See accompanying notes to consolidated financial statements.
F-4
GLOBAL PHARM HOLDINGS GROUP, INC.
CONSOLIDATED STATEMENTS OF CASH FLOWS
|
Nine months ended September 30,
|
||||||||
|
2010
|
2009
|
|||||||
|
(Restated)
|
||||||||
|
Cash flows from operating activities
|
||||||||
|
Net income
|
$ | 5,708,092 | $ | 7,115,764 | ||||
|
Adjustments to reconcile net income to net cash provided by operating activities:
|
||||||||
|
Depreciation and amortization
|
51,993 | 62,071 | ||||||
|
Merger cost
|
750,000 | |||||||
|
Stock-based compensation
|
4,476,300 | - | ||||||
|
Changes in operating assets and liabilities:
|
||||||||
|
Accounts receivable
|
(4,683,793 | ) | 440,014 | |||||
|
Other receivables
|
(40,886 | ) | (17,824 | ) | ||||
|
Other current assets
|
(158,910 | ) | - | |||||
|
Inventories
|
(14,211,786 | ) | (9,106,310 | ) | ||||
|
Accounts payable
|
11,135,187 | 6,114,317 | ||||||
|
Accrued payroll
|
(162,667 | ) | (74,924 | ) | ||||
|
Other accrued liabilities
|
42,211 | 77,191 | ||||||
|
Income taxes payable
|
586,539 | 340,456 | ||||||
|
Other taxes payable
|
(292,054 | ) | (983,441 | ) | ||||
|
Net cash provided by operating activities
|
3,200,226 | 3,967,314 | ||||||
|
Cash flows from investing activities
|
||||||||
|
Purchases of property, plant and equipment
|
(22,044 | ) | (135,030 | ) | ||||
|
Net cash used in investing activities
|
(22,044 | ) | (135,030 | ) | ||||
|
Cash flows from financing activities:
|
||||||||
|
Short-term loan borrowing
|
366,763 | - | ||||||
|
Bank acceptance
|
(199,545 | ) | 438,436 | |||||
|
Due from related party
|
24,603 | |||||||
|
Cash received from related party
|
1,168,986 | 1,607,597 | ||||||
|
Cash paid to related party
|
- | |||||||
|
Dividend paid to the former shareholders
|
(4,309,377 | ) | (3,435,470 | ) | ||||
|
Net cash used in financing activities
|
(2,948,570 | ) | (1,389,437 | ) | ||||
|
Net increase in cash and cash equivalents
|
229,612 | 2,442,847 | ||||||
|
Effect of exchange rate changes on cash and cash equivalents
|
145,532 | (9,707 | ) | |||||
|
Cash and cash equivalent - beginning of year
|
7,455,147 | 5,188,587 | ||||||
|
Cash and cash equivalent - end of year
|
$ | 7,830,291 | $ | 7,621,727 | ||||
|
Major non-cash transaction:
|
||||||||
|
Shell purchase payment - paid by majority shareholder personally
|
$ | 450,000 | $ | - | ||||
|
Call rights consideration - paid by majority shareholder personally
|
$ | 300,000 | $ | - | ||||
|
Stock-based compensation
|
$ | 4,476,300 | $ | - | ||||
|
Supplemental disclosure of cash flow information:
|
||||||||
|
Cash paid for interest
|
$ | 20,655 | $ | - | ||||
|
Cash paid for income taxes
|
$ | 2,994,851 | $ | 2,025,270 | ||||
See accompanying notes to consolidated financial statements.
F-5
GLOBAL PHARM HOLDINGS GROUP, INC
NOTES TO CONSOLIDATED FINANCIAL STATEMENTS
SEPTEMBER 30, 2010 AND DECEMBER 31, 2009
1. Organization and Summary of Significant Accounting Policies
Nature of Operations
Global Pharm Holdings Group, Inc. (“Global Pharm” or the “Company”), formerly Top Flight Gamebirds, Inc. (“Top Flight”) was incorporated in Delaware on February 9, 2007, to enter the commercial game bird industry and establish a large-scale commercial game bird farm. From the time of incorporation to August 2010, the Company has no significant operation. On September 20, 2010, the Company changed its name from “Top Flight Gamebirds, Inc.” to “Global Pharm Holdings Group, Inc.” Prior to the Reverse Merger (as defined herein), our revenues had not been sufficient to cover our operating costs and to allow us to continue as a going concern.
On August 6, 2010, the Company’s then sole director and officer, Rhonda Heskett, entered into a share purchase agreement with Mei Li Tsai, pursuant to which Ms. Tsai acquired 19,094,000 of Ms. Heskett’s shares of the Company’s common stock for cash consideration of $450,000. The $450,000 was expensed and was charged to additional paid-in capital. Subsequently, Mei Li Tsai became the Company’s largest stockholder of approximately 78.9% of its then total issued and outstanding shares of stock. In addition, on August 6, 2010, the Company’s board of directors approved the appointment of Yunlu Yin as the new Chief Executive Officer and sole director, An Fu as the new Chief Financial Officer and Dan Li as the new Secretary while accepting the resignation of Rhonda Heskett as the director, President, Chief Executive Officer and Chief Financial Officer. As a result of the foregoing, there was a change in control of the Company on August 6, 2010.
On August 12, 2010, Top Flight entered into and consummated a Share Exchange Agreement with Mei Li Tsai, the then sole shareholder of Global Pharma Enterprise Group Limited (“Global Pharma”) and Global Pharma BVI to acquire all the issued and outstanding capital stock of Global Pharma,, in consideration for 1,800,000 newly issued restricted shares of the Company. The merger transaction has been accounted for as a “Reverse Merger” and recapitalization of the Company whereby Global Pharma BVI is deemed to be the accounting acquirer (legal acquiree) and the Company to be the accounting acquiree (legal acquirer). The historical financial statements for periods prior to August 13, 2010 are those of Global Pharma BVI except that the equity section and earnings per share have been retroactively restated to reflect the reverse acquisition. Immediately after the closing of the Reverse Merger, Mei Li Tsai, the Company’s then majority shareholder, owned 80.36% of the total of 26,000,000 issued and outstanding shares of common stock, of the Company, or 20,894,000 shares. As a result of the Reverse Merger, Global Pharma BVI is now the Company’s wholly owned subsidiary.
After Top Flight entered into the Share Exchange Agreement with Global Pharma BVI on August 12, 2010, pursuant to the Earn-In Agreement, as thereafter amended (and as further described below), the shareholders, including the beneficial owners of Anhui Xuelingxian Pharmaceutical Co. Ltd. (“Xuelingxian”), Tonghua Tongdetang Pharmaceutical and Medicinal Materials Co., Ltd. (“Tongdetang”) and Shandong Global Pharm Co., Ltd., formerly Shandong Yaoyuan Pharmaceutical Co., Ltd.(“Yaoyuan”), and the key management of Global Pharma BVI were given the right to purchase 20,894,000 shares of the Company at four different occurrence dates, contingent on various targets for total consideration of $300,000. The $300,000 was expensed and charged to additional paid-in capital. Targets include binding three years employment contracts with various members of management within six months of this agreements and target after tax net income (non-cash expenses need to be excluded from calculation of net income) of $3.6 million, $3.8 million and $15.2 million for the three months ended June 30, 2010 and September 30, 2010, and for the 12 months ending December 31, 2010, respectively. Pursuant to the Share Exchange Agreement, key management and the former shareholders, including beneficial owners of Xuelingxian, Tongdetang and Yaoyuan, acquired call rights to own 80.36% of Top Flight. On September 20, 2010, Top Flight changed its name to Global Pharm Holdings Group, Inc.
F-6
On June 29, 2010, Mei Li Tsai, the then sole Shareholder of Global Pharma BVI entered into an Earn-in Agreement, as thereafter amended (as described in Note 17, Subsequent Event), with the former shareholders, including the beneficial owners of Xuelingxian, Tongdetang and Yaoyuan, and the key management of the Company. Pursuant to the agreement, Global Pharma BVI agreed to enter into the Share Exchange Agreement, at a date subsequent to the agreement, with a United States domiciled shell company and at that time the former shareholders, including beneficial owners, would be entitled to call rights to acquire the controlling interest in the publicly held company. As described above, on August 12, 2010, Top Flight entered into and consummated the Share Exchange Agreement.
The Company has four reportable segments, consisting of (i) pharmaceutical products distribution, (ii) Traditional Chinese Medicine, or TCM, processing and distribution, (iii) herbs cultivation and sales and production and (iv) sales of flower tea bags in China. Currently, the Company does not have intersegment sales.
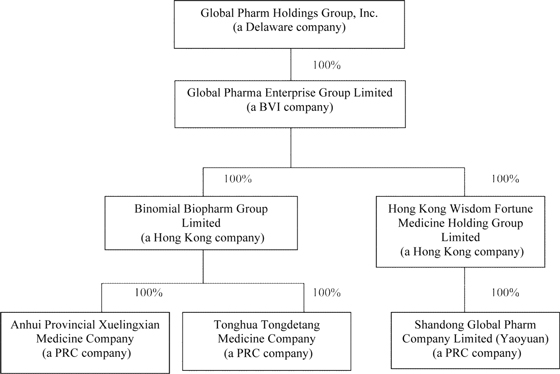
Global Pharma BVI was incorporated on June 14, 2010 under the laws of the British Virgin Island and is a holding company. Global Pharma BVI conducts the wholesale and distribution business of pharmaceuticals-related products, Chinese herbal cultivation and medicine raw materials preparations through its three operating subsidiaries located in China.
Prior to the Company’s acquisition of Global Pharma BVI on August 12, 2010, Global Pharma BVI entered into a series of agreements pursuant to which Global Pharma BVI acquired 100% of certain entities, which subsequently become wholly owned subsidiaries of Global Pharma BVI and, subsequent to the Reverse Merger, became wholly owned indirect subsidiaries of the Company. On June 29, 2010 Global Pharma BVI acquired all of the outstanding shares of Binomial Biopharm Group Limited (“Bionmial”), incorporated under the laws of Hong Kong on September 9, 2009, and Hong Kong Wisdom Fortune Medicine Holding Group Limited (“Wisdom Fortune”), formally Aecko Industrial Limited, incorporated under the laws of Hong Kong.
Tongdetang was incorporated on February 2, 2002, under the laws of the People’s Republic of China (“PRC”). Xuelingxian was incorporated on July 23, 2008, under the laws of the PRC. Shandong Global Pharm Co., Ltd. Yaoyuan was incorporated on November 1, 2005, under the laws of the PRC and, together with Tongdetang and Xuelingxian, are referred to as the PRC Subsidiaries.
F-7
On May 6, 2010 and May 8, 2010, Wisdom Fortune and Binomial, respectively, entered into Equity Transfer Agreements, with the shareholders of Yaoyuan, Xuelingxian and Tongdetang. Global Pharma BVI paid RMB 5,180,000 (approximately US$ 700,418), RMB 3,000,000 (approximately US $405,647), and RMB10,000,000 (approximately US$1,352,158) to the shareholders, including beneficial owners, of Xuelingxian, Tongdetang, and Yaoyuan, respectively, representing their registered capital at the time (referred to as the Equity Transfers).
As a result of the Equity Transfers, Binomial currently holds all the equity interests in Xuelingxian and Tongdetang. Tongdetang and Xuelingxian were incorporated on February 2, 2002 and on July 23, 2008, respectively, under the laws of the PRC. Prior to the Equity Transfer, the shareholders of Xuelingxian were Yunlu Yin, Dandan Wang, Shulan Li and Hong Zhang. The shareholders of Tongdetang were Yunlu Yin, Qingdong Zeng and Feng Jin. Mei Li Tsai was the sole shareholder of Binomial from its inception until Global Pharma BVI acquired Binomial on June 29, 2010.
In addition, as a result of the Equity Transfers, Wisdom Fortune currently holds all the equity interest in Yaoyuan. Yaoyuan was incorporated under the laws of the PRC on June 18, 2007. Prior to the Equity Transfer, the shareholders of Yaoyuan were Yunlu Yin, Shouqiang Han, Yanming Lv, Guojun Zhao, Junyan Su, Boliang Zhu and Chaobo Song. Mei Li Tsai was the sole shareholder of Wisdom Fortune from its inception until Global Pharma BVI acquired Wisdom Fortune on June 29, 2010.
On May 25, 2006 and April 15,2010, Yunlu Yin signed the Trust Agreements with Qinghui Zeng and Qingdong Zeng, respectively, documenting Yunlu Yin as the 62% of owner of Tongdetang and documenting each of Qinghui Zeng and Qingdong Zeng to act as the nominee owner of Tongdetang on behalf of Yunlu Yin. On May 31, 2008 and March 20, 2010 Yunlu Yin signed the Trust Agreements with Yanliang Song and Shouqiang Han, respectively, documenting Yunlu Yin as 80% of owner of Yaoyuan and documenting each of Yanliang Song and Shouqing Han to act as the nominee owner of Yaoyuan on behalf of Yunlu Yin. On September 5, 2009 and April 10, 2010, Yunlu Yin signed the Trust Agreements with Shunli Wang and Shulan Li and Hong Zhang, respectively, documenting Yunlu Yin as 65% of owner of Xuelingxian and documenting each of Shunli Wang and Shulan Li and Hong Zhang to act as the nominee owner of Xuelingxian on behalf of Yunlu Yin.
F-8
As part of these restructuring transactions, no new capital was introduced. As a result, no new basis in the net assets of the PRC Subsidiaries was established. During this restructuring, management continued to serve and continued to direct both the day-to-day operating and management of the PRC Subsidiaries, as well as their strategic direction. Because of this operating and management control and because the restructuring plan effectively resulted in the Company continuing to bear the residual risks and rewards related to the PRC Subsidiaries, the Company consolidated the PRC Subsidiaries during the restructuring. The Company’s acquisition of the PRC Subsidiaries, which represented the return to legal ownership of the PRC Subsidiaries by the Company, represented a transaction between related parties under common control and did not establish a new basis in the assets and liabilities of the PRC Subsidiaries. The Earn-In Agreement, as thereafter amended, enables former shareholders to regain ownership of the Company’s shares originally transferred by them to the Company as part of the restructuring arrangements and, accordingly, the Company does not consider the reacquisition of those shares to represent compensation cost to the Company. The Company accounted for the shares earned by management as share-based compensation and recognized $5,968,400 of compensation expense.
Basis of Presentation
The consolidated financial statements are prepared in accordance with accounting principles generally accepted in the United States of America ("U.S. GAAP"). In the opinion of management, the accompanying balance sheets, and statements of income and comprehensive income, stockholders’ equity and cash flows include all adjustments, consisting only of normal recurring items.
Principles of Consolidation
The consolidated financial statements include the accounts of Global Pharm Holdings Group, Inc. and its direct and indirect wholly owned subsidiaries. All significant intercompany accounts and transactions have been eliminated in consolidation
Foreign Currency Translation
The Company has its local currency, Renminbi (“RMB”), as its functional currency. The consolidated financial statements of the Company are translated from RMB into US$. Accordingly, all assets and liabilities are translated at the exchange rates prevailing at the balance sheet dates, all income and expenditure items are translated at the average rates for each of the periods and equity accounts, except for retained earnings, are translated at the rate at the transaction date. Retained earnings reflect the cumulative net income (loss) translated at the average rates for the respective periods since inception less dividends translated at the rate at the transaction date.
RMB is not a fully convertible currency. All foreign exchange transactions involving RMB must take place either through the People's Bank of China (the "PBOC") or other institutions authorized to buy and sell foreign exchange. The exchange rates adopted for the foreign exchange transactions are the rates of exchange quoted by the PBOC, which are determined largely by supply and demand. Translation of amounts from RMB into US$ has been made at the following exchange rates for the respective years:
|
Nine Months Ended September 30,
|
||||||||
|
2010
|
2009
|
|||||||
|
Assets and liabilities
|
1 US $ : 6.69810 RMB
|
1 US $ : 6.8259 RMB
|
||||||
|
Statement of income
|
1 US $ : 6.81640 RMB
|
1 US $ : 6.8307 RMB
|
||||||
The resulting translation adjustments are recorded as other comprehensive income in the consolidated statement of stockholders equity and comprehensive income and as a separate component of stockholders equity.
F-9
Commencing from July 21, 2005, China adopted a managed floating exchange rate regime based on market demand and supply with reference to a basket of currencies. Since then, the PBOC administers and regulates the exchange rate of US$ against RMB taking into account the demand and supply of RMB, as well as domestic and foreign economic and financial conditions.
Use of Estimates
The preparation of consolidated financial statements in conformity with U.S. GAAP requires us to make certain estimates and assumptions that affect the reported amounts of assets and liabilities and disclosure of contingent assets and liabilities at the date of the consolidated financial statements. The reported amounts of revenues and expenses during the reporting period may be affected by the estimates and assumptions we are required to make. Estimates that are critical to the accompanying consolidated financial statements relate primarily to returns, sales allowances and customer chargebacks, and the valuation of long-lived assets. Estimates and assumptions are reviewed periodically and the effects of revisions are reflected in the period that they are determined to be necessary. Actual results could differ from these estimates.
Comprehensive Income
The Company follows the Comprehensive Income Topic of the FASB Accounting Standard Codification (“ASC 220 Comprehensive Income”). Comprehensive income is a more inclusive financial reporting methodology that includes disclosure of certain financial information that historically has not been recognized in the calculation of net income.
The Company’s only component of other comprehensive income is foreign currency translation gains and losses. The foreign currency translation gains (losses) for the nine months ended September 30, 2010 and 2009 were $(142,492) and $(1,584), respectively. Accumulated other comprehensive income is recorded as a separate component of stockholders’ equity.
Cash and Cash Equivalents
Cash and cash equivalents comprise cash in banks and on hand, demand deposits with banks and other financial institutions, and short-term, highly liquid investments which are readily convertible into known amounts of cash and which are subject to an insignificant risk of changes in value, having been within three months of maturity at acquisition.
Restricted Cash
Restricted cash represents amounts held by a bank as security for bank acceptance notes and loan collateral and therefore is not available for the Company’s use in operations.
Accounts Receivable
The Company records accounts receivable, net of an allowance for doubtful accounts. The Company maintains allowances for doubtful accounts for estimated losses. The Company reviews the accounts receivable on a quarterly basis and makes general and specific allowances when there is doubt as to the collectability of individual balances. In evaluating the collectability of individual receivable balances, the Company considers many factors, including the age of the balance, customer's historical payment history, its current credit-worthiness and current economic trends. The amount of the provision, if any, is recognized in the consolidated statement of income within "General and administrative" Accounts are written off after exhaustive efforts at collection. There are no allowances for doubtful accounts as of September 30, 2010 and December 31, 2009, respectively.
F-10
Inventories
Inventories are stated at the lower of cost (determined on a weighted-average basis) or market value. Work-in-progress is composed of direct materials, direct labor, manufacturing overhead and an attributable portion of land rental cost that has been capitalized as a component of inventory. The capitalized land rental cost will be recorded in cost of goods sold at such time the goods are sold. An allowance is established when management determines that certain inventories may not be saleable. If inventory costs exceed expected market value due to obsolescence or quantities in excess of expected demand, the Company will record reserves for the difference between the cost and the market value. These reserves are recorded based on estimates and reflected in cost of sales. There are no inventory reserves as of September 30, 2010 and December 31, 2009, respectively.
Long-Lived Assets
The Company estimates the future undiscounted cash flows to be derived from an asset to assess whether or not a potential impairment exists when events or circumstances indicate the carrying value of a long-lived asset may be impaired. If the carrying value exceeds the Company’s estimate of future undiscounted cash flows, the Company then calculates the impairment as the excess of the carrying value of the asset over the Company’s estimate of its fair market value.
Lease Obligations
All non-cancellable leases with an initial term greater than one year are categorized as either capital leases or operating leases. Assets recorded under capital leases are amortized according to the methods employed for property and equipment or over the term of the related lease, if shorter.
Property, Plant and Equipment
Property, plant and equipment are stated at cost less accumulated depreciation and impairment losses. Depreciation of property, plant and equipment is computed using the straight-line method based on the following estimated useful lives:
|
Buildings
|
30 years
|
|
|
Furniture, fixtures and equipment
|
5 years
|
|
|
Motor vehicles
|
5 years
|
|
|
Office equipment
|
5 years
|
|
|
Plant and machinery
|
|
5 to 15 years
|
Leasehold improvements are amortized over the shorter of the lease term or the life of the improvements.
Revenue Recognition
The Company’s revenue recognition policies are in compliance with Staff Accounting Bulletin 104. Sales revenue is recognized when all of the following have occurred: (i) persuasive evidence of an arrangement exists, (ii) delivery has occurred or services have been rendered, (iii) the price is fixed or determinable and (iv) the ability to collect is reasonably assured. These criteria are generally satisfied at the time of shipment when risk of loss and title passes to the customer. The Company’s four segments have the same revenue recognition policy. Revenues are recorded net of value-added taxes.
F-11
Shipping and Handling Expense
Shipping and handling costs are expenses as incurred and are included in cost of goods sold.
Advertising Costs
Advertising costs are expensed in the period in which the advertisements are first run or over the life of the endorsement contract. Advertising expense for the nine months ended September 30, 2010 and 2009 were approximately $24,001 and $1,218, respectively. Advertising costs include advertising subsidy expense which is accrued based on the terms in effect with distributors and paid when all attaching conditions have been completed.
Income Taxes
The Company is subject to the Income Tax Law of the People’s Republic of China. Income taxes are accounted for under the asset and liability method. Deferred tax assets and liabilities are recognized for the future tax consequences attributable to temporary differences between the financial statements carrying amounts of existing assets and liabilities and their respective tax bases and tax loss carry forwards. Any deferred tax assets and liabilities would be measured using enacted tax rates expected to apply to taxable income in the years in which those temporary differences are expected to be recovered or settled. The statutory rate under the laws of the PRC is 25%. The Company’s herbal cultivation segment is subjected to zero income taxes and the per-share savings on this tax are:
|
Three Months Ended
September 30,
|
Nine Months Ended
September 30,
|
|||||||||||||||
|
2010
|
2009
|
2010
|
2009
|
|||||||||||||
|
Per-share saving on Herb Cultivation nil income tax
|
$
|
0.004
|
$
|
0.001
|
$
|
0.004
|
$
|
0.001
|
||||||||
Deferred tax assets and liabilities are recognized for the future tax consequences attributable to differences between the financial statement carrying amounts of existing assets and liabilities and their respective tax bases. Deferred tax assets and liabilities are measured using enacted tax rates applicable to taxable income in the years in which those temporary differences are expected to be recovered or settled. The effect on deferred tax assets and liabilities of a change in tax rates is recognized in income in the period that includes the enactment date.
The Company has not been subjected to income tax examinations by taxing authorities for the years ended December 31, 2010 and 2009. The Company is open to tax examination in the PRC for all years, as tax returns remain open to examination until notified by the taxing authorities, and the Company has not received any notifications to date. The Company records interest and penalties as other expense on the consolidated statements of income and other comprehensive income. During the years ended December 31, 2010 and 2009, the Company did not recognize any amount in interest and penalties.
F-12
Concentration of Credit Risk
Financial instruments that potentially subject the Company to concentrations of credit risk are cash and accounts receivable arising from its normal business activities. The Company places its cash in what it believes to be creditworthy financial institutions. The Company has a diversified customer base. The Company controls credit risk related to accounts receivable through credit approvals, credit limits and monitoring procedures. The Company routinely assesses the financial strength of its customers and, based upon factors surrounding the credit risk, establishes an allowance, if required, for uncollectible accounts and, as a consequence, believes that its accounts receivable credit risk exposure beyond such allowance is limited. As of September 30, 2010 and December 31, 2009, there was no allowance for uncollectible accounts as previously discussed.
Fair Value of Financial Instruments
The carrying amounts of the Company’s financial instruments, which principally include accounts receivable and accounts payable, approximate their fair values due to the relatively short maturity of such instruments.
The carrying amount of the Company’s short-term borrowings approximates their fair value based upon current rates and terms available to the Company for similar debt.
Basic and Diluted Earnings per Share
The Company reports earnings per share in accordance with FASB ASC-260, Earnings per Share. The Company’s basic earnings per share is computed using the weighted-average number of shares outstanding for the periods presented.
Diluted earnings per share is based on the assumption that any dilutive options, warrants or other instruments were converted or exercised. Dilution is computed by applying the treasury stock method. Under this method, the Company’s outstanding stock options are assumed to be exercised, and funds thus obtained were assumed to be used to purchase common stock at the average market price during the period. As of September 30, 2010 and December 31, 2009, the Company has no dilutive securities
Stock-Based Compensation
The Company uses the fair value recognition provision of ASC Topic 718, Compensation-Stock Compensation (formerly named as SFAS 123(R)), which requires the Company to expense the cost of employee services received in exchange for an award of equity instruments based on the grant date fair value of such instruments over the vesting period.
The Company records all share-based payments, including grants of common shares and stock options to employees, in the consolidated financial statements based on their fair values on date of grant. The grant is expensed over the required service period, which is generally equal to the vesting period.
Recent Accounting Pronouncements
In December 2010, the FASB issued ASU 2010-29 which addresses diversity in practice about the interpretation of the pro forma revenue and earnings disclosure requirements for business combinations (Topic 805). This ASU specifies that if a public entity presents comparative financial statements, the entity should disclose revenue and earnings of the combined entity as though the business combination(s) that occurred during the current year had occurred as of the beginning of the comparable prior annual reporting period only. This ASU also expands the supplemental pro forma disclosures under Topic 805 to include a description of the nature and amount of material, non-recurring pro forma adjustments directly attributable to the business combination included in the reported pro forma revenue and earnings. ASU 2010-29 is effective prospectively for business combinations for which the acquisition date is on or after the beginning of the first annual reporting period beginning on or after December 15, 2010. Early adoption is permitted. The Company is currently evaluating the impact of this ASU and expected the adoption of this ASU will have an impact on its future business combinations.
F-13
Reclassification
Certain items have been reclassified in the accompanying consolidated Financial Statements and Notes for prior periods to be comparable with the classification for the period ended September 30, 2010.
|
2.
|
Inventories
|
As of September 30, 2010, and December 31, 2009, inventories consisted of the following:
|
September 30,
|
December 31,
|
|||||||
|
2010
|
2009
|
|||||||
|
Raw materials (1)
|
$
|
1,154,795
|
$
|
1,401,865
|
||||
|
Work-in-progress (2)
|
11,654,901
|
-
|
||||||
|
Finished goods (3)
|
11,205,709
|
7,971,897
|
||||||
|
Total
|
$
|
24,015,405
|
$
|
9,373,762
|
||||
(1) Raw materials include the herbal material that will be used to produce the flower tea and the OEM product.
(2) Work-in-process is composed of direct materials, direct labor, an attributable portion of land lease cost that has been capitalized and an attributable portion of manufacturing overhead.
(3) Finished goods only consist of pharmaceutical products.
|
3.
|
Property, Plant and Equipment
|
At September 30, 2010 and December 31, 2009, Property, Plant and Equipment consists of the following:
|
September 30,
|
December 31,
|
|||||||
|
2010
|
2009
|
|||||||
|
Operating equipment
|
$
|
223,506
|
$
|
219,321
|
||||
|
Office equipment
|
93,942
|
73,382
|
||||||
|
Transportation equipment
|
10,463
|
10,267
|
||||||
|
Leasehold improvements
|
51,049
|
50,093
|
||||||
|
Sub-total
|
378,960
|
353,063
|
||||||
|
Less: Accumulated depreciation
|
(175,469
|
)
|
(123,476
|
)
|
||||
|
Property, plant and equipment, net
|
$
|
203,491
|
$
|
229,587
|
||||
Depreciation expense was $51,993 and $62,071 for the nine months ended September 30, 2010 and 2009, respectively.
F-14
4. Intangible Assets
The Company uses the “Yaoyuan” trademark for drug packaging that is owned by Yanliang Song, a former shareholder of Yaoyuan. The trademark was applied for on May 16, 2008 and approved on April 7, 2010 and was subsequently transferred to Yaoyuan without cost or value. The trademark will expire on April 6, 2020. The cost of the trademark for Yanliang Song is less than $200 and the Company is not required to pay Yanliang Song any license fee for the use of the trademark. The Company also believes this amount is immaterial.
The Company has the exclusive right to use the “Xuelingxian” trademark for pharmaceutical products, which is owned by Jingsheng Wang, a former shareholder of Xuelingxian, pursuant to a license agreement dated January 1, 2009 for a term from January 1, 2009 to January 1, 2014. The cost of the trademark for Jingsheng Wang is less than $200 and the Company does not have to pay Jingsheng Wang any license fee for the use of the trademark. The Company also believe this amount is immaterial.
5. Short-Term Loans
Yaoyuan entered into a short-term loan on December 23, 2009 with Shandong Qilu Bank. The loan amount was $223,944 and $219,751 at September 30, 2010 and December 31, 2009, respectively, and is due on December 21, 2010. The loan bears an interest at 7.434% annually and the interest is payable monthly.
The Company entered an entrustment guarantee contract with Kexin Fengda Investment Guarantee Co, Ltd (“Kexin Fengda”) whereby Kexin Fengda guarantees the payment of the note payable in the amount of RMB 1,500,000 to Shandong Qilu bank from December 9, 2009 to December 9, 2010. Kexin Fengda received payment of approximately $6,000 in consideration for this guarantee.
Yanliang Song, the general manager of Yaoyuan, provided counter-guarantee to Kexin Fengda using all his personal/family assets. Pursuant to the counter-guarantee, the chairman will guarantee the payment of the principal, interests, penalty interests, damages and all the costs incurred by Kexin Fengda to pay back the loan in the event that the Company defaults on the loan. The counter-guarantee is valid for two years from December 9, 2010.
Yaoyuan also entered into a short-term loan on March 22, 2010 with Shandong Qilu Bank. The loan amount was $223,944 at September 30, 2010 and is due on March 22, 2011. The loan bears an interest at 6.372% annually and the interest is payable monthly.
The Company entered a pledge agreement with Shandong Qilu Bank, which requested at least 6 million RMB of inventories to secure the loan. The pledge is valid from March 22, 2010 to March 22, 2011. Shandong Qilu Bank has authorized Shandong Woerde Guarantee Company to supervise the pledged inventories.
On May 7, 2010, the Company entered into a credit agreement with Construction Bank of China in the amount of $142,296. As part of the loan agreement, RMB 4,000,000 or $597,184 of property and land of two shareholders and Bozhou City Herb Research Institute guarantee the outstanding principal balance to the bank over the term of the loan.
The interest expenses were $20,655 and nil for the periods ended September 30, 2010 and 2009, respectively.
F-15
6. Bank Acceptance
The Company has a bank acceptance with Shandong Qilu Bank in the amount of $219,751 as of December 31, 2009. The bank acceptance has a six-month term and is non-interest bearing. On March 22, 2010 the Company renewed the bank acceptance with Qilu Bank for a one-year term and is non-interest bearing. The total balance at September 30, 2010 and December 31, 2009 was $20,875 and $219,751 respectively.
7. Other Tax Payable
As of September 30, 2010 and December 31, 2009, other tax payable consist of the following:
|
September 30,
2010
|
December 31,
2009
|
|||||||
|
Value-add-tax payable
|
|
$
|
244,215
|
|
|
$
|
513,957
|
|
|
City construction tax payable
|
|
|
17,095
|
|
|
|
35,977
|
|
|
Stamp duty payable
|
|
|
4,580
|
|
|
|
2,626
|
|
|
Total other tax payable
|
|
$
|
265,890
|
|
|
$
|
552,560
|
|
8. Income Taxes
United States
Global Pharm Holdings Group, Inc. was incorporated in the State of Delaware and is subject to the U.S. federal tax and state statutory tax rates up to 34% and nil, respectively.
Hong Kong
Binomial Biopharm Group Ltd and Wisdom Fortune Medicine Holding Group Ltd are incorporated in Hong Kong and are subject to Hong Kong profits tax on income arising in or derived from Hong Kong. No provision for Hong Kong profits tax was made in the consolidated financial statements as the Company derived no taxable income from Hong Kong for the nine months ended September 30, 2010 and 2009.
Peoples’ Republic of China
The Company’s PRC Subsidiaries are PRC operating companies and are subject to PRC Enterprise Income Tax. Pursuant to the PRC New Enterprise Income Tax Law, Enterprise Tax is generally imposed at a statutory rate of 25%. Each subsidiary files stand-alone tax returns and the Company does not file a consolidated tax return.
The provision for income taxes for the nine months ended September 30 2010 and 2009 were as follows:
|
|
September 30,
|
|||||||
|
2010
|
2009
|
|||||||
|
Provision for income tax
|
||||||||
|
Current tax provision - PRC
|
$ | 3,609,764 | $ | 2,365,726 | ||||
|
Deferred tax provision
|
- | - | ||||||
|
Total provision for income taxes
|
$ | 3,609,764 | $ | 2,365,726 | ||||
Global Pharm Holdings Group, Inc. was incorporated in the United States and has incurred aggregate net operating losses of approximately $271,148 and $10,586 for income tax purposes for the nine months ended September 30, 2010 and 2009, respectively. The net operating loss carried forward may be available to reduce taxable income in future years for taxable income generated in the United States. These carry-forwards will expire, if not utilized, through 2028 to 2030. Management believes that the realization of the benefits from these losses, which generally would generate a deferred tax asset if it can be expected to be utilized in the future, does not appear to be more than likely due to the Company’s limited operating history and continuing losses for United States income tax purposes.
Accordingly, the Company has provided a 100% valuation allowance on the deferred tax asset benefit to reduce the asset to zero. Management will review this valuation allowance periodically and make adjustments as warranted. A summary of the otherwise deductible (or taxable) deferred tax items is as follows:
|
|
September 30,
|
|||||||
|
|
2010
|
2009
|
||||||
|
Deferred tax assets - current
|
- | - | ||||||
|
Deferred tax assets – non current
|
||||||||
|
Net operating loss carryover for U.S. income tax purposes
|
(92,190 | ) | (3,599 | ) | ||||
|
Total deferred tax assets
|
(92,190 | ) | (3,599 | ) | ||||
|
Less: Valuation allowance
|
92,190 | (3,599 | ) | |||||
|
Net operating loss carryover for U.S. income tax purposes
|
- | - | ||||||
The following table reconciles the U.S. statutory rates to the Company's effective tax rate as:
|
|
September 30,
|
|||||||
|
|
2010
|
2009
|
||||||
|
U.S. statutory rate
|
34.0 | 34.0 | ||||||
|
Foreign income not recognized in the U.S.
|
(34.0 | ) | (34.0 | ) | ||||
|
PRC statutory income tax rate
|
25.0 | 25.0 | ||||||
|
Income not subject to tax
|
(1.2 | ) | (0.1 | ) | ||||
|
Change in valuation allowance
|
14.9 | - | ||||||
|
Effective income tax rate
|
38.7 | 24.9 | ||||||
For U.S. tax purposes, the Company has cumulative undistributed earnings of foreign subsidiaries of approximately $6,364,890 and $ 6,178,612 as of September 30, 2010 and December 31, 2009, respectively, which are included in consolidated retained earnings and will continue to be indefinitely reinvested in international operations. Accordingly, no provision has been made for U.S. deferred taxes related to future repatriation of these earnings, nor is it practicable to estimate the amount of income taxes that would have to be provided if we concluded that such earnings will be remitted to the U.S. in the future.
F-17
9. Related Party Transaction
Parties are considered to be related if one party has the ability, directly or indirectly, to control the other party or exercise significant influence over the other party in making financial and operational decisions. Parties are also considered to be related if they are subject to common control or common significant influence.
· Due from related parties – September 30, 2010 and December 31, 2009
Prior to the Reverse Merger, the Company advanced funds to certain officers. These advances were non-interest bearing, unsecured and payable/receivable on demand. Since August 12, 2010, the date of the Reverse Merger, the Company has not made any advances to officers or stockholders.
|
September 30,
|
December 31,
|
|||||||||
|
Related Party
|
Relationship
|
2010
|
2009
|
|||||||
|
Yanliang Song
|
Officer
|
|
$
|
-
|
|
|
$
|
24,568
|
|
|
|
Mei Li Tsai
|
Shareholder
|
|
$
|
-
|
|
|
$
|
50,000
|
|
|
|
Total
|
|
|
$
|
-
|
|
|
$
|
74,568
|
|
|
For the period ended September 30, 2010, the Chairman of the Company paid $298,688 business expenses personally. This amount is non-interest bearing and payable on demand.
The following table set forth the due to related party as of September 30, 2010 and December 31, 2009.
|
September 30,
|
December 31,
|
|||||||||
|
Related Party
|
Relationship
|
2010
|
2009
|
|||||||
|
Yunlu Yin
|
Director, Chairman, CEO
|
$ | 298,688 | - | ||||||
|
Shouqiang Han
|
Shareholder
|
2,127,315 | 370,006 | |||||||
|
Qinghui Zeng
|
Shareholder
|
1,411,634 | 1,427,408 | |||||||
|
Xianming Zeng
|
Shareholder
|
705,817 | 713,704 | |||||||
|
Shunli Wang
|
Shareholder
|
4,535,011 | 93,948 | |||||||
|
Jingsheng Wang
|
Shareholder
|
1,027,191 | 26,089 | |||||||
|
Fulan Li
|
Shareholder
|
596,090 | 15,140 | |||||||
|
Others
|
Shareholders
|
111,965 | 19,473 | |||||||
|
Total
|
|
$ | 10,813,711 | $ | 2,665,768 | |||||
|
|
·
|
On May 25, 2006 and April 15,2010, Yunlu Yin signed the Trust Agreements with Qinghui Zeng and Qingdong Zeng, respectively, documenting Yunlu Yin as the 62% of owner of Tongdetang and documenting each of Qinghui Zeng and Qingdong Zeng to act as the nominee owner of Tongdetang on behalf of Yunlu Yin. On May 31, 2008 and March 20, 2010 Yunlu Yin signed the Trust Agreements with Yanliang Song and Shouqiang Han, respectively, documenting Yunlu Yin as 80% of owner of Yaoyuan and documenting each of Yanliang Song and Shouqing Han to act as the nominee owner of Yaoyuan on behalf of Yunlu Yin. On September 5, 2009 and April 10, 2010, Yunlu Yin signed the Trust Agreements with Shunli Wang and Shulan Li and Hong Zhang, respectively, documenting Yunlu Yin as 65% of owner of Xuelingxian and documenting each of Shunli Wang and Shulan Li and Hong Zhang to act as the nominee owner of Xuelingxian on behalf of Yunlu Yin.
|
F-18
|
|
·
|
During each of the years ended February 28, 2010 and February 28, 2009, the former President, Chief Executive Officer, Chief Financial Officer, sole director and chairwoman, Rhonda Heskett contributed services and brooding facilities with a fair value of $6,000 and $2,400, respectively. These non-cash expenses totaling $8,400 in each of the years ended February 28, 2010 and 2009 were treated as contributed capital.
|
|
|
·
|
On July 23 and September 24, 2010, our former shareholder, Shunli Wang, lent RMB 5,000,000 and RMB 600,000 (totally, $836,058) respectively, to Xuelingxian as working capital and the balance are non-interest bearing and payable on demand. The balance was paid off on December 25, 2010.
|
|
|
·
|
As of August 6, 2010, Rhonda Heskett loaned us a total of $ $24,879.53 in exchange for a two 5% per annum promissory notes. Rhonda Heskett waived this payment on August 6, 2010 in full and the promissory notes were cancelled on that date.
|
|
|
·
|
As of September 30, 2010 and December 31, 2009, the Company had nil and $1,465,738, respectively, due from related parties. In 2009, Yanliang Song, former shareholder and officer of Yaoyuan, borrowed $24,568 from Yaoyuan and this balance was paid off in 2010. In 2008, Xianming Zeng and Qingdong Zeng, former stockholders of Tongdetang, borrowed RMB 6,000,000 and RMB 4,000,000 (totally, $1,465,738), respectively, from Tongdetang and such balance was offset in 2009 when Tongdetang declared dividends in the amount of RMB 6,000,000 and RMB 4,000,000, respectively, to Xianming Zeng and Qingdong Zeng.
|
|
|
·
|
The Company uses a trademark for drug packaging that is owned by Yanliang Song, a former shareholder of Yaoyuan,. The trademark was applied for on May 16, 2008 and approved April 7, 2010. It expires April 6, 2020. While all associated costs have been paid for by the shareholder, we use this trademark at no cost.
|
|
|
·
|
On August 6, 2010, the Company entered a share purchase agreement with the former President, Chief Executive Officer, Chief Financial Officer and sole director and chairwoman, Rhonda Heskett and Mei Li Tsai for the acquisition of 19,094,000 shares of common stock of the Company for a cash consideration of $450,000.
|
|
|
·
|
On August 12, 2010, Top Flight entered into and consummated a Share Exchange Agreement with Mei Li Tsai, the sole shareholder of Global Pharma BVI and Global Pharma BVI to acquire all the issued and outstanding capital stock of Global Pharma, in consideration for 1,800,000 newly issued restricted shares of Top Flight.
|
|
|
·
|
On June 29, 2010 the then sole shareholder (the “Seller”) of Global Pharma BVI entered into an Earn-In Agreement (the “Agreement”), as thereafter amended, with the former shareholders, including beneficial owners, of Xuelingxian, Tongdetang, and Yaoyuan (the “Buyers”). Pursuant to the Agreement, Global Pharma BVI agreed to enter into a share exchange agreement, at a date subsequent to the Agreement, with a United States domiciled shell company, and at that time the Buyers would be entitled to call rights to own the controlling interest in the publicly held company according to the following schedule:
|
F-19
a. At the time the Buyers enter into a binding employment agreement for a term of not less than three years with the public shell company and the operating companies to serve as the management team within six months after the date of this Agreement, the Buyers would have the call right to purchase 25% of the Seller’s shares, or 5,223,500 shares of common stock of the public shell company for a cash consideration of $75,000. On August 6, 2010, the Buyers, Yinlu Yin, An Fu and Dan Li entered into three-year employment agreements with the Company (as the public shell company) and Zhihao Pan, Zhengang Chi, Yanmin Song, Zhencheng Huang, Yiting Zhang, Yanming Lu, Yanliang Song, Yan Zhang, Xueye Jing, Xianming Zeng, Shunli Wang, Renyuan Su, Qingwei Meng, Nan Li, Naihua Hu, Li Li, Hong Li, Hanjun Liu, Fangyuan Song, Chaobo Song entered into three-year employment contracts with the Company’s operating companies. Because the employment agreements were entered into within six months after the date of the Agreement, the Buyers acquired the first call right to purchase 25% of the Seller’s shares.
b. At the time Global Pharma BVI and its subsidiaries achieve an after-tax net income of $3.6 million for the three months ended June 30, 2010, the Buyers shall have the call right to purchase another 25% of the Seller’s shares, or 5,223,500 shares of common stock of the Company, for a cash consideration of $75,000. The non-cash expenses would be excluded from the calculation of the net income. Global Pharma BVI and its subsidiaries achieved an after-tax, non-cash expenses excluded net income of 3.8 million for the three months ended June 30, 2010, which was disclosed in the Company’s Current Report on Form 8-K/A filed with the SEC on August 25, 2010 and which has been reviewed and approved by our auditor. Accordingly, the Buyers acquired the second call right to purchase the second 25% tranche of the Seller’s shares.
c. At the time Global Pharma BVI and its subsidiaries achieve an after-tax net income of $3.8 million for the three months ended September 30, 2010, the Buyers would have the call right to purchase another 25% of the Seller’s shares, or 5,223,500 shares of common stock of the Company, for a cash consideration of $75,000. The non-cash expenses would be excluded from the calculation of the net income. Global Pharma BVI and its subsidiaries achieved an after-tax, non-cash expenses excluded net income of $3.9 million for the three months ended September 30, 2010, which was disclosed in the Company’s Quarterly Report on Form 10-Q filed with the SEC on November 15, 2010 and has been reviewed and approved by the Company’s auditors. Therefore, the Buyers acquired the third call right to purchase the third 25% tranche of the Seller’s shares.
d. At the time Global Pharma BVI and its subsidiaries achieve an after-tax net income of $15.2 million for the year ended December 31, 2010 according to the financial statement prepared by the management,, the Buyers would have the call right to purchase the remaining 25% of the Seller’s shares. The non-cash expenses would be excluded from the calculation of the net income. Global Pharma BVI and its subsidiaries have achieved an after-tax, non-cash expenses excluded net income of $15.2 million. (See Note 17, Subsequent Event, relating to the Amendment to the Earn-In Agreement and the exercise of all call rights pursuant thereunder.)
10. Statutory Reserve
The laws and regulations of the PRC require that before a foreign invested enterprise can legally distribute profits, it must first satisfy all tax liabilities, provide for losses in previous years, and make allocations, in proportions determined at the discretion of the board of directors, to the statutory reserve. The statutory reserves include the surplus reserve fund.
The Company is required to transfer 10% of its net income, as determined in accordance with the PRC accounting rules and regulations, to a statutory surplus reserve fund until such reserve balance reaches 50% of the Company’s registered capital. The transfer to this reserve must be made before distribution of any dividends to shareholders. Transfers to the statutory surplus reserve fund were nil and $943,463 for the nine months ended September 30, 2010 and year ended December 31, 2009, respectively. As of September 30, 2010, the Company has fulfilled the reserve requirement.
The surplus reserve fund is non-distributable other than during liquidation and can be used to fund previous years’ losses, if any, and may be utilized for business expansion or converted into share capital by issuing new shares to existing shareholders in proportion to their shareholding or by increasing the par value of the shares currently held by them, provided that the remaining reserve balance after such issue is not less than 50% of the registered capital.
F-20
11. Common Stock
The Company is authorized to issue 100,000,000 shares of common stock, $.001 par value. As described in Note 1, the Company had 24,200,000 common shares outstanding prior to the Share Exchange Agreement of which 19,094,000 were held by Mei Li Tsai, the sole shareholder of Global Pharma BVI prior to the Reverse Merger. For accounting purposes the 19,094,000 shares held by Mei Li Tsai are assumed to have been outstanding on January 1, 2009 and the 5,106,000 held by existing shareholders of the Company prior to the execution of the Share Purchase Agreement on August 9, 2010 and the 1,800,000 shares issued in connection with the Share Exchange Agreement and Reverse Merger on August 12, 2010 are assumed to have been issued on those dates in exchange for the net assets of the Company.
On November 19, 2010, the former shareholders and the primary beneficiaries of the PRC subsidiaries exercised the first three call rights pursuant to the Earn-In Agreement, as thereafter amended, and purchased in the aggregate 15,584,300 shares from Mei Li Tsai. (See Note 17, Subsequent Event, relating to the exercise of the last call rights on March 29, 2011.)
At September 30, 2010, 26,000,000 common shares were issued and outstanding.
12. Stock Compensation
Pursuant to the Earn-In Agreement, as thereafter amended, the management team members have the rights to purchase 10.9% of ownership of the PRC Subsidiaries as part of the restructuring arrangements. The Company treated the shares earned by the management as share-based compensation. The fair value of these shares granted to the management is valued at the fair market value of the PRC Subsidiaries at the grant day, which accounted for $5,968,400 at June 29, 2010.
13. Commitments
The Company leases various facilities under lease agreements ranging from month-to-month to 15-year terms. The following table set forth the term, payment and purpose of the leased property.
F-21
|
No.
|
Lessor
|
Term
|
Rent (RMB)
|
Rent (US$)
|
Description
|
|||||
|
1
|
General Tobacco Group Co., Ltd.
|
July 1, 2009 – June 30, 2010
|
1,417,295 per year
|
211,597 per year
|
Used as distribution center, totaling 15,533 square meters
|
|||||
|
2
|
General Tobacco Group Co., Ltd.
|
March 1, 2010 -February 28, 2011
|
180,000 for the first year and increase at a rate of 5% per year thereafter
|
26,873 per year and increase at a rate of 5% per year thereafter
|
Used for parking, totaling 156,020 square meters
|
|||||
|
3
|
General Trading Co., Ltd.
|
March 1, 2010-March 28, 2011
|
30,000 for the first year and increase at a rate of 5% per year thereafter
|
4,479 for the first year and increase at a rate of 5% per year thereafter
|
Used as offices, totaling 1,160.46 square meters
|
|||||
|
4
|
General Tobacco Group Co., Ltd.
|
July 1, 2010 -June 30, 2011
|
1,335,334 per year
|
199,360 per year
|
Used as distribution center, totaling 13,937 square meters
|
|||||
|
5
|
General Tobacco Group Co., Ltd.
|
July 1, 2010 -June 30, 2011
|
390,898 per year
|
58,360 per year
|
Used as warehouse, totaling 2,677 square meters
|
|||||
|
6
|
Shujun Xu
|
November 1, 2006-October 31, 2011,
|
360,000 for the first year; 420,000 for the second year; 480,000 for the third year; 540,000 for the fourth year; 600,000 for the fifth year.
|
53,747 for the first year; 62,704 for the second year; 71,662for the third year; 80,620 for the fourth year; 89,578 for the fifth year.
|
Used as distribution center, totaling 2,449 square meters
|
|||||
|
7
|
Xiuying Hou
|
December 1, 2010-December 1, 2013
|
64,800 every year
|
9,674 every year
|
Used as distribution center, totaling 300 square meters
|
|||||
|
8
|
Anhui Province Bozhou City Fengyi Institute of Traditional Chinese Medicine
|
August 1 2008 –July 31, 2023 renewable annually
|
1,200,000 per year
|
179,155 per year
|
Used as warehouse, totaling 3,000 square meters
|
|||||
|
9
|
Mengwang Village Committee of Dayang County, Qiaocheng District, Bozhou City, Anhui Province, PRC
|
January 1, 2010-December 31, 2014 renewable annually
|
14,970,000 for 2010, 8,800,000 per year thereafter.
|
2,234,962 for 2010, 1,313,805 per year thereafter.
|
Used for herbal cultivation, totaling 1,318 acres
|
|||||
|
10
|
Mengwang Village Committee of Dayang County, Qiaocheng District, Bozhou City, Anhui Province, PRC
|
July 1, 2010 - December 31, 2015 renewable annually
|
31,450,367 for 2010, 16,939,939 for 2011, 10,468,500 per year thereafter.
|
4,695,416 for 2010, 2,529,066 for 2011, 1,562,906 per year thereafter
|
Used for herbal cultivation, totaling 1,642 acres.
|
|||||
|
11
|
25/F New World Center, 6009 Yitian Road, Futian District, Shenzhen, PRC
|
Dec 1, 2009 - Nov 30, 2012
|
606,000 per year
|
90,473 per year
|
Used as office
|
F-22
The future minimum obligations under the aforementioned agreements at September 30, 2010 are as follows:
|
2011
|
$ | 4,351,485 | ||
|
2012
|
3,164,068 | |||
|
2013
|
3,072,731 | |||
|
2014
|
3,055,866 | |||
|
2015
|
2,070,512 | |||
| 1,794,107 | ||||
|
Total
|
$ | 17,508,769 |
14. Concentrations
One vendor accounted for approximately 27% of the Company’s purchases for the nine months ended September 30, 2010 whereas one vendor accounted for approximately 13% of the Company’s purchases for the nine months ended September 30, 2009.
No vendors accounted for greater than 10% of accounts payable at September 30, 2010 whereas one vendor accounted for approximately 26% of the Company’s accounts payable at December 31, 2009.
One customer accounted for approximately 14% of accounts receivable at December 31, 2009. There were no customers who accounted for greater than 10% of accounts receivable at September 30, 2010.
15. Segment Reporting
FASB ASC 280-10 requires the use of the management approach model for segment reporting. The management approach model is based on how a company's management organizes segments within the company for making operating decisions and assessing performance. Reportable segments are based on products and services, geography, legal structure, management structure, or any other manner in which management disaggregates a company. Based on this model, the Company has determined that it has four segments. The Company’s principal businesses are pharmaceutical products distribution, TCM processing and distribution, herb cultivation and sales, flower tea bags,. All sales were to customers in PRC.
Based on the various operation activities, the Company’s reportable segments are as follows:
|
|
·
|
Pharmaceutical products distribution – the sale of healthcare products to hospitals and pharmacy shops.
|
|
|
·
|
TCM processing and distribution – rough processing and sale of TCM product.
|
|
|
·
|
Herb cultivation and sales – the planting, processing and selling herbs in China.
|
|
|
·
|
Flower tea bags – manufacture and sale of flower tea bags.
|
F-23
|
Three months ended September 30, 2010
|
||||||||||||||||||||||||
|
USD $
|
Pharmaceutical
products
distribution
|
TCM processing
and distribution
|
Herbal cultivation
and sales
|
Flower tea
bags
|
Corporate
|
Total
|
||||||||||||||||||
|
Revenue, net
|
24,810,775 | 3,710,548 | 1,341,110 | 755,387 | - | 30,617,820 | ||||||||||||||||||
|
Interest income
|
6,829 | 1,128 | 1,878 | 743 | - | 10,578 | ||||||||||||||||||
|
Interest (expense)
|
(7,736 | ) | - | - | - | - | (7,736 | ) | ||||||||||||||||
|
Depreciation
|
8,875 | 9,775 | 1,728 | 2,225 | - | 22,603 | ||||||||||||||||||
|
Income tax
|
1,033,610 | 126,150 | - | 25,147 | - | 1,184,907 | ||||||||||||||||||
|
Net income
|
3,034,340 | 278,413 | 419,097 | 204,073 | (4,008,299 | ) | (72,376 | ) | ||||||||||||||||
|
Total assets
|
31,189,024 | 5,049,149 | 11,654,901 | 1,055,192 | 2,639 | 48,950,905 | ||||||||||||||||||
|
Capital expenditure
|
6,173 | 6,993 | - | - | - | 13,166 | ||||||||||||||||||
|
Three months ended September 30, 2009
|
||||||||||||||||||||||||
|
USD $
|
Pharmaceutical
products
distribution
|
TCM processing
and distribution
|
Herbal cultivation
and sales
|
Flower tea
bags
|
Corporate
|
Total
|
||||||||||||||||||
|
Revenue, net
|
13,825,605 | 2,104,155 | 563,826 | 1,868,797 | - | 18,362,383 | ||||||||||||||||||
|
Interest income
|
4,731 | 1,501 | 450 | 630 | - | 7,312 | ||||||||||||||||||
|
Interest (expense)
|
- | - | - | - | - | - | ||||||||||||||||||
|
Depreciation
|
25,643 | 9,997 | 1,335 | 2,156 | - | 39,131 | ||||||||||||||||||
|
Income tax
|
529,623 | 118,698 | - | 97,531 | - | 745,852 | ||||||||||||||||||
|
Net income
|
1,593,275 | 209,230 | 67,217 | 401,531 | - | 2,271,253 | ||||||||||||||||||
|
Total assets
|
20,514,050 | 5,658,439 | 5,460,686 | 2,059,557 | - | 33,692,732 | ||||||||||||||||||
|
Capital expenditure
|
108,099 | - | - | - | - | 108,099 | ||||||||||||||||||
|
Nine months ended September 30, 2010
|
||||||||||||||||||||||||
|
USD $
|
Pharmaceutical
products
distribution
|
TCM processing
and distribution
|
Herbal cultivation
and sales
|
Flower tea
bags
|
Corporate
|
Total
|
||||||||||||||||||
|
Revenue, net
|
68,183,762 | 16,988,312 | 1,345,969 | 3,658,462 | - | 90,176,505 | ||||||||||||||||||
|
Interest income
|
25,647 | 9,049 | 1,885 | 5,123 | - | 41,704 | ||||||||||||||||||
|
Interest (expense)
|
(20,656 | ) | - | - | - | - | (20,656 | ) | ||||||||||||||||
|
Depreciation
|
26,201 | 17,388 | 1,735 | 6,669 | - | 51,993 | ||||||||||||||||||
|
Income tax
|
2,710,562 | 739,870 | - | 159,332 | - | 3,609,764 | ||||||||||||||||||
|
Net income
|
8,131,687 | 1,988,998 | 420,615 | 737,306 | (5,570,514 | ) | 5,708,092 | |||||||||||||||||
|
Total assets
|
31,189,024 | 5,049,149 | 11,654,901 | 1,055,192 | 2,639 | 48,950,905 | ||||||||||||||||||
|
Capital expenditure
|
13,259 | 6,993 | - | 1,792 | - | 22,044 | ||||||||||||||||||
F-24
|
Nine months ended September 30, 2009
|
||||||||||||||||||||||||
|
USD $
|
Pharmaceutical
products
distribution
|
TCM processing
and distribution
|
Herbal cultivation
and sales
|
Flower tea
bags
|
Corporate
|
Total
|
||||||||||||||||||
|
Revenue, net
|
43,639,470 | 9,690,222 | 558,701 | 3,527,045 | - | 57,415,438 | ||||||||||||||||||
|
Interest income
|
12,254 | 5,831 | 446 | 2,813 | - | 21,343 | ||||||||||||||||||
|
Interest (expense)
|
- | - | - | - | - | - | ||||||||||||||||||
|
Depreciation
|
39,445 | 17,176 | 1,322 | 4,128 | - | 62,071 | ||||||||||||||||||
|
Income tax
|
1,694,332 | 492,231 | - | 179,163 | - | 2,365,726 | ||||||||||||||||||
|
Net income
|
5,087,663 | 1,318,787 | 66,607 | 642,707 | - | 7,115,764 | ||||||||||||||||||
|
Total assets
|
20,514,050 | 5,658,439 | 5,460,686 | 2,059,557 | - | 33,692,732 | ||||||||||||||||||
|
Capital expenditure
|
25,053 | 75,524 | - | 34,453 | - | 135,030 | ||||||||||||||||||
16. Restatement
Subsequent to the issuance of our interim financial statements on Form 10-Q for the third quarter ended September 30, 2010, management discovered financial statement errors that caused an overstatement of the previously recorded net income for the third quarter ended September 30, 2010 by $3,734,200, or $0.14 per common share. For the nine-month period ended September 30, 2010, the previously reported net income was overstated by $5,226,300, or $0.17 per common share as a result of these errors. These errors have been corrected in the interim financial statements included in this Form 10-Q/A. The errors primarily related to the following:
|
|
·
|
Errors in the accounting for employee stock-based compensation and Reverse Merger cost. These expenses had previously not been recorded in the Company’s financial statements. The fair value of the shares granted to by the management team members was $5,968,400 at the grant date. The attributable portion of the stock-based compensation was $2,984,200 and $4,476,300 for the three months and nine months ended September 30, 2010, respectively. The $450,000 shell purchase payment and the $300,000 call rights consideration in connection with the Reverse Merger had previously not been recorded in the Company’s financial statements. The impact of this error had the effect of a increase in the general administrative expenses, decrease in net income.
|
|
|
·
|
Errors in the accounting for short-term loan. The $149,296 short-term loan had previously not been timely recorded in the Company’s financial statements. The impact of this error had no effect on net income and earning per common share.
|
The adjustment to net income (loss) for the three and nine months ended September 30, 2010 is summarized below:
|
Three months
|
Nine months
|
|||||||||||||||
|
ended September 30, 2010
|
ended September 30, 2010
|
|||||||||||||||
|
|
|
Earning per share
|
|
Earning per share
|
||||||||||||
|
Net Income, as previously reported
|
$ | 3,661,824 | $ | 0.14 | $ | 10,934,392 | $ | 0.42 | ||||||||
|
Adjustment (pre-tax):
|
||||||||||||||||
|
Stock-based compensation
|
(2,984,200 | ) | (0.11 | ) | (4,476,300 | ) | (0.17 | ) | ||||||||
|
Merger cost
|
(750,000 | ) | (0.03 | ) | (750,000 | ) | (0.03 | ) | ||||||||
|
Tax effect of restatement adjustment
|
- | - | - | - | ||||||||||||
|
Net (loss) income, as restated
|
$ | (72,376 | ) | $ | (0.00 | ) | $ | 5,708,092 | $ | 0.22 | ||||||
F-25
17. Subsequent Event
The Company has evaluated all events or transactions that occurred from October 1, 2010 through the filing with the SEC. We have recognized material subsequent events during this period as below:
On August 12, 2010, Global Pharma BVI entered into and consummated a Share Exchange Agreement with the Company. Pursuant to the Earn-In Agreement, as thereafter amended as described below, the shareholders, including the beneficial owners of Xuelingxian, Tongdetang and Yaoyuan, and the key management of Global Pharma BVI were given the right to purchase 20,894,000 shares at four different occurrence dates, contingent on various targets for total consideration of $300,000. As of March 29, 2011, the Company entered into an Agreement to Amend the Earn-In Agreement (the “Amendment”) with the former shareholders and the beneficial owners of Xuelingxian, Tongdetang and Yaoyuan and 20 individuals of its management who were parties to the original agreement. As of March 29, 2011, pursuant to the Amendment, all of the four earn-in targets have been achieved and the key management and former shareholders and the beneficial owners of Xuelingxian, Tongdetang and Yaoyuan hold, in the aggregate, 20,894,000 shares, or 80.36%, of the Company’s shares of stock.
F-26
MANAGEMENT’S DISCUSSION AND ANALYSIS OF FINANCIAL CONDITION AND RESULTS OF OPERATION
The following discussion should be read in conjunction with our consolidated financial statements and notes to those consolidated financial statements, included elsewhere in this Quarterly Report on Form 10-Q/A. This discussion contains forward-looking statements that involve risks and uncertainties. Our actual results and the timing of selected events could differ materially from those anticipated in these forward-looking statements as a result of various factors, including those set forth under “Risk Factors” contained in our Current Report on Form 8-K/A filed with the SEC on April 13, 2011 and our Annual Report on Form 10-K f/y/e 12/31/10, filed with the SEC on April 13, 2011 and elsewhere in this Report.
Critical Accounting Policies
Our management’s discussion and analysis of our financial condition and results of operations are based on our financial statements that have been prepared in accordance with accounting principles generally accepted in the United States. The preparation of these financial statements requires us to make estimates and assumptions that affect the reported amounts of assets and liabilities and the disclosure of contingent assets and liabilities at the date of the financial statements as well as the reported net sales and expenses during the reporting periods. On an ongoing basis, we evaluate our estimates and assumptions. We base our estimates on historical experience and on various other factors that we believe are reasonable under the circumstances, the results of which form the basis for making judgments about the carrying value of assets and liabilities that are not readily apparent from other sources. Actual results may differ from these estimates under different assumptions or conditions.
Our significant accounting policies are described in Note 1 to our consolidated financial statements. Our critical accounting policies are those where we have made the most difficult, subjective or complex judgments in making estimates, and/or where these estimates can significantly impact our financial results under different assumptions and conditions. Our critical accounting policies are:
Revenue Recognition
Our revenue recognition policies are in compliance with Staff Accounting Bulletin 104. Sales revenue is recognized when all of the following have occurred: (i) persuasive evidence of an arrangement exists, (ii) delivery has occurred or services have been rendered, (iii) the price is fixed or determinable and (iv) the ability to collect is reasonably assured. These criteria are generally satisfied at the time of shipment when risk of loss and title passes to the customer. The Company’s four segments have the same revenue recognition policy. Revenues are recorded net of value-added taxes.
Accounts Receivable
Accounts receivable, which are unsecured, are stated at the amount we expect to collect. We continuously monitor collections and payments from our customers and maintain a provision for estimated credit losses based upon historical experience and any specific customer collection issues that have been identified. Our credit losses have historically not been significant. As of September 30, 2010 and December 31, 2009, all of the trade receivable balances were aged less than one year and have been collected in full subsequent to the balance sheet date. Therefore, management concluded that no allowance for uncollectible amounts was required.
6
Income Taxes
We are subject to income taxes, primarily in the PRC. We believe we have adequately provided for all taxes due but amounts asserted by tax authorities could be greater or less than the amounts we have accrued. We have concluded all PRC corporate income tax matters through the period ended September 30, 2010 and do not anticipate adjustments as a result of any tax audits within the next twelve months.
Segments
Segments are defined as components of our business for which separate financial information is available that is evaluated by our chief operating decision-maker (our CEO) in deciding how to allocate resources and assess performance. We presently have four operating segments, consisting of (i) pharmaceutical products distribution, (ii) Traditional Chinese Medicine, or TCM, processing and distribution, (iii) herbal cultivation and sales and (iv) flower tea bags. Currently, we do not have intersegment sales.
Overview
We were incorporated in Delaware on February 9, 2007, under the name “Top Flight Gamebirds, Inc,” or Top Flight. Our principal executive offices are located at Room 2503-2505, New World Center, No.6009 Yitian Road, Futian District, Shenzhen, Guangdong 518026, People’s Republic of China. On September 20, 2010, we changed our name to Global Pharm Holdings Group, Inc. From the time of inception until August 6, 2010, we had entered the commercial game bird industry and had no significant operation. Prior to the Reverse Merger (as defined herein), our revenues had not been sufficient to cover our operating costs and to allow us to continue as a going concern.
On August 6, 2010, our then sole director and officer, Rhonda Heskett, entered into a share purchase agreement with Mei Li Tsai, pursuant to which Ms. Tsai acquired 19,094,000 of Ms. Heskett’s shares of our common stock for cash consideration of $450,000. The $450,000 was expensed and charged to additional paid-in capital. Subsequently, Mei Li Tsai became our largest stockholder of approximately 78.9% of our then total issued and outstanding shares of stock. In addition, on August 6, 2010, our board of directors approved the appointment of Yunlu Yin as our new Chief Executive Officer and sole director, An Fu as our new Chief Financial Officer and Dan Li as our new Secretary while accepting the resignation of Rhonda Heskett as our director, President, Chief Executive Officer and Chief Financial Officer. As a result of the foregoing, there was a change in control of the Company on August 6, 2010.
On August 12, 2010, Top Flight entered into and consummated a Share Exchange Agreement with Mei Li Tsai, the then sole shareholder of Global Pharma BVI Enterprise Group Limited, a BVI company (referred to as Global Pharma), and Global Pharma BVI to acquire all the issued and outstanding capital stock of Global Pharma, in consideration for 1,800,000 newly issued restricted shares of Top Flight (referred to as the Reverse Merger). The Reverse Merger was approved by the board of directors on August 12, 2010. Immediately after the closing of the Reverse Merger, we had a total of 26,000,000 issued and outstanding shares of common stock and Mei Li Tsai was our then single largest shareholder of 20,894,000 shares of common stock, or approximately 80.36% of our total issued and outstanding 26,000,000 common shares. As a result of the Reverse Merger, Global Pharma BVI is now our wholly owned subsidiary.
Global Pharma BVI is a holding company incorporated in British Virgin Islands and mainly conducts the wholesale and distribution business of pharmaceutical-related products in China through its three indirectly wholly owned Chinese subsidiaries including Tonghua Tongdetang Pharmaceutical Co., Ltd. (referred to as Tongdetang), Anhui Xuelingxian Pharmaceutical Co., Ltd. (referred to as Xuelingxian) and Shandong Global Pharm Co., Ltd. (referred to as Yaoyuan and, together with Xuelingxian and Tongdetang, referred to as the PRC Subsidiaries). Global Pharm holds all of the shares of Hong Kong Wisdom Fortune Medicine Holding Group Limited, a Hong Kong company (referred to as Wisdom Fortune) and Binomial Biopharm Group Limited, a Hong Kong company (referred to as Binomial). Binomial currently holds all the equity interests in Xuelingxian and Tongdetang, and Wisdom Fortune currently holds all the equity interest in Yaoyuan.
7
After Top Flight entered into the Share Exchange Agreement with Global Pharma BVI on August 12, 2010, pursuant to the Earn-In Agreement, as thereafter amended as described below, the shareholders, including the beneficial owners of Xuelingxian, Tongdetang and Yaoyuan, and the key management of Global Pharma BVI were given the right to purchase 20,894,000 shares at four different occurrence dates, contingent on various targets for total consideration of $300,000. The $300,000 was expensed and was charged to additional paid-in capital. Targets include binding three-year employment contracts with various members of management within six months of this agreements and target after tax net income (the non-cash expenses need to be excluded from the calculation of net income) of $3.6 million, $3.8 million, and $15.2 million for the three months ended June 30, 2010 and September 30, 2010, and for the 12 months ending December 31, 2010, respectively. Pursuant to the Amendment to the Earn-In Agreement, the key management and former shareholders, including beneficial owners of Xuelingxian, Tongdetang and Yaoyuan, acquired call rights to own 80.36% of Top Flight. On September 20, 2010, Top Flight changed its name to Global Pharm Holdings Group, Inc.
On March 29, 2011, we entered into an Agreement to Amend the Earn-In Agreement, or the Amendment, with the former shareholders and the beneficial owners of Xuelingxian, Tongdetang and Yaoyuan and 20 individuals of its management who were parties to the original agreement. As of March 29, 2011, pursuant to the Amendment, all of the four earn-in targets have been achieved and the key management and former shareholders and the beneficial owners of Xuelingxian, Tongdetang and Yaoyuan hold, in the aggregate, 20,894,000 shares, or 80.36%, of our common stock. We accounted for the shares earned by management as share-based compensation and recognized $5,968,400 of compensation expense at the grant date.
On the date of Reverse Merger, we changed our business plan to focus on pharmaceutical-related product wholesales and distribution in China. We have four reportable segments, consisting of (i) pharmaceutical products distribution, (ii) Traditional Chinese Medicine, or TCM, processing and distribution, (iii) herb cultivation and sales and (iv) flower tea bags. Currently, we do not have intersegment sales.
Pharmaceutical Product Distribution Segment
Our products include prescription drugs, over-the-counter drugs and nutritional supplements. In 2009, we sold totally 8,472 types of products and had 2,689 clients that spanned from hospital, wholesaler, healthcare clinic and chain to individual drug stores.
For the period ended September 30, 2010, the sales of the distribution segment accounted for 76% of the total sales. Our Yaoyuan and Tongdetang subsidiaries mainly focus on the distribution business. Yaoyuan is a provincial level distributor and Tongdetang is a city level distributor. They purchase pharmaceutical-related products from manufactures and wholesalers and sell them to hospitals, other distributors, health clinic, chain and individual drug stores, among others.
In January 2010, we entered into an exclusive distribution agreement with Xiuzheng Pharmaceutical and obtained the exclusive distribution right to sell over 500 different types of its OTC drugs in Shandong province (referred to as the Xiuzheng Agreement). The term of the Xiuzheng Agreement is one year, commencing January 1, 2010. Xiuzheng Pharmaceutical is a well-known pharmaceutical manufacture and its products are popular in China. The exclusive distribution right of Xiuzheng’s products has generated significant revenue in the first three quarters in 2010 of approximately 5%. We have expanded our effort to sell Xiuzheng’s products and we anticipate that we can renew the agreement with Xiuzheng in 2011 and will obtain more products from Xiuzheng.
In addition, in January 2010, we entered into another provincial exclusive distribution agreement with Hainan Lingkang Pharmaceutical Co., Ltd., or Lingkang (referred to as the Lingkang Agreement), pursuant to which we obtained a one-year exclusive distribution right to sell 40 types of its prescription drugs in Shandong province. We also obtained the right to price the drug according to the market. The term of the Lingkang Agreement is one year, commencing January 1, 2010.
8
TCM Processing and Distribution Segment
For the period ended September 30, 2010, the sales from TCM processing and distribution segments accounted for 19% of the total sales. Xuelingxian focused on the TCM processing and distribution.
Herb Cultivation and Sales Segment
For the nine months ended September 30, 2010, the sales from our herb cultivation and sales segment accounted for 2% of the total sales. On each of January 1, 2010 and July 2, 2010, we leased a parcel of land from Mengwang Village Committee of Dayang County, Qiocheng District, Boxhou City in Anhui province to expand our herbal cultivation business. Both parcels of land began to generate revenue in the third quarter of 2010.
According to statistics of China Association of Traditional Chinese Medicine, as quoted by Ministry of Commerce of the People’s Republic of China (http://www.mofcom.gov.cn/aarticle/o/di/201011/20101107245413.html), the price of 84% of the 537 herbs most commonly used products increased in amounts ranging from 5% to 180%. Of these herbal products, 28% increased more than 50% in price. Our management believes this trend will continue until the spring of 2011 because the demand for herbal products in winter is traditionally higher than other seasons. The profit of our herbal cultivation segment has increased 531.5% in the third quarter of 2010 compared to the comparable period in 2009. Our management believes that the financial performance of our herb cultivation segment will continue to improve.
Flower Tea Bags Segment
For the nine months ended September 30, 2010, the sales from our flower tea bags segment accounted for 4% of the total sales. The current production of flower tea bags includes rough processing, screening, and bagging. In order to satisfy the increasingly sophisticated market trends and to accommodate customers’ needs, the management plans to restructure the flower tea segment and refine the current tea products to grinding tea drinks to meet the market demand.
Results of Operations
The three months ended September 30, 2010 as compared to three months ended September 30, 2009
|
For the three months ended September 30,
|
||||||||||||||||||||||||
|
in USD except %
|
2010
|
2009
|
Change
|
|||||||||||||||||||||
|
% of revenue
|
% of revenue
|
Amount
|
Percentage
|
|||||||||||||||||||||
|
Revenues, net
|
$ | 30,617,820 | 100.0 | $ | 18,362,383 | 100 | $ | 12,255,437 | 66.7 | |||||||||||||||
|
Cost of goods sold
|
24,711,477 | 80.7 | 14,895,327 | 81.5 | 9,816,150 | 65.9 | ||||||||||||||||||
|
Gross profit
|
5,906,343 | 19.3 | 3,467,056 | 18.5 | 2,439,287 | 70.4 | ||||||||||||||||||
|
Operating expenses
|
360,572 | 1.2 | 149,663 | 0.9 | 210,909 | 140.9 | ||||||||||||||||||
|
General and administrative
|
4,436,082 | 14.5 | 307,600 | 1.3 | 4,128,482 | 1342.2 | ||||||||||||||||||
|
Income from operations
|
1,109,689 | 3.6 | 3,009,793 | 16.3 | (1,900,104 | ) | (63.1 | ) | ||||||||||||||||
|
Interest income
|
2,842 | 0.0 | 7,312 | - | (4,470 | ) | (61.1 | ) | ||||||||||||||||
|
Miscellaneous Expense
|
- | 0.0 | - | - | - | - | ||||||||||||||||||
|
Income before income taxes
|
1,112,531 | 3.6 | 3,017,105 | 16.3 | (1,904,574 | ) | (63.1 | ) | ||||||||||||||||
|
Provision for income taxes
|
1,184,907 | 3.9 | 745,852 | 3.7 | 439,055 | 58.9 | ||||||||||||||||||
|
Net (loss) income
|
$ | (72,376 | ) | (0.2 | ) | $ | 2,271,253 | 12.6 | $ | (2,343,628 | ) | (103.2 | ) | |||||||||||
9
|
For the three months ended September 30 - Revenue
|
||||||||||||||||||||||||
|
in USD except %
|
2010
|
2009
|
Change
|
|||||||||||||||||||||
|
% of revenue
|
% of revenue
|
%
|
||||||||||||||||||||||
|
Pharmaceutical products distribution
|
$ | 24,810,775 | 81.0 | $ | 13,825,605 | 75.3 | $ | 10,985,170 | 79.5 | |||||||||||||||
|
TCM processing and distribution
|
3,710,548 | 12.1 | 2,104,156 | 11.5 | 1,606,392 | 76.3 | ||||||||||||||||||
|
Herb cultivation and sales
|
1,341,110 | 4.4 | 563,826 | 3.1 | 777,284 | 137.9 | ||||||||||||||||||
|
Flower tea bags
|
755,387 | 2.5 | 1,868,796 | 10.2 | (1,113,409 | ) | (59.6 | ) | ||||||||||||||||
|
Total
|
$ | 30,617,820 | 100.0 | $ | 18,362,383 | 100.0 | $ | 12,255,437 | 66.7 | |||||||||||||||
|
For the three months ended September 30 - Net Income (Loss)
|
||||||||||||||||||||||||
|
in USD except %
|
2010
|
2009
|
Change
|
|||||||||||||||||||||
|
% of income
|
% of income
|
%
|
||||||||||||||||||||||
|
Pharmaceutical products distribution
|
$ | 3,034,340 | 77.1 | $ | 1,593,275 | 70.1 | $ | 1,441,065 | 90.4 | |||||||||||||||
|
TCM processing and distribution
|
278,413 | 7.1 | 209,230 | 9.2 | 69,183 | 33.1 | ||||||||||||||||||
|
Herb cultivation and sales
|
419,097 | 10.6 | 67,217 | 3.0 | 351,880 | 523.5 | ||||||||||||||||||
|
Flower tea bags
|
204,073 | 5.2 | 401,531 | 17.7 | (197,458 | ) | (49.2 | ) | ||||||||||||||||
|
Corporate
|
(4,008,299 | ) | - | - | - | (4,008,299 | ) | - | ||||||||||||||||
|
Total
|
$ | (72,376 | ) | 100.0 | $ | 2,271,253 | 100.0 | $ | (2,343,629 | ) | (103.2 | ) | ||||||||||||
Revenue. Revenue increased by $12,255,437 or 66.7% to $30,617,820 for the three months ended September 30, 2010 from $18,362,383 for the three months ended September 30, 2009. The contribution from the distribution segment was $10,985,170, or 89.6% of the increase of total sales.
Revenue from the pharmaceutical products distribution segment was $24,810,755 for the three months ended September 30, 2010, compared to $13,825,605 for the comparable period last year, an increase of $10,985,170 or approximately 79.5%. The increase is primarily due to the exclusive distribution right we obtained from two pharmaceutical manufacturers at the beginning of 2010 to sell in the aggregate over 500 different types of their products in Shandong province.
Revenue from the TCM processing and distribution segment was $3,710,548 for the three months ended September 30, 2010, compared to $2,104,156 for the comparable period last year, an increase of $1,606,392 or approximately 76.3%. The increase in revenue was primarily due to the increase of product variety and price volatility of TCM products.
Revenue from the herb cultivation and sales segment was $1,341,110 for the three months ended September 30, 2010, compared to $563,826 for the comparable period last year, an increase of $777,284 or approximately 137.9%. The increase is primarily due to the two additional leased parcels of land, totaling 2,960 acres in 2010 to expand our herbal cultivation business, with both parcels of land generating revenue in the third quarter of 2010.
10
Revenue from the flower tea segment was $755,388 for the three months ended September 30, 2010 compared to $1,868,797 for the comparable period last year, a decrease of $1,113,409 or approximately 59.6%. The decrease is due to a variety of factors, including the competitive market, geographical limitation, general design and packaging, and insufficient marketing.
Cost of Goods Sold. The cost of goods sold increased by $9,816,150 or 65.9% to $24,711,477 for the three months ended September 30, 2010 from $14,895,327 for the comparable period in 2009 consistent with an increase of revenue.
Gross Profit. The gross profit increased by $2,439,287 or 70.4 % to $5,906,343 for the three months ended September 30, 2010 from $3,467,056 for the comparable period last year. Our gross margin increased slightly from 18.5% for the three months ended September 30, 2009 to 19.3% for the three months ended September 30, 2010 due to a variety of factors, including the revenue generated by the herb cultivation segment in the third quarter of 2010 and the increase of sales of exclusive distribution products.
Operating Expenses. Operating expenses increased by $210,909 to $360,572 for the three months ended September 30, 2010 from $149,663 for the three months ended September 30, 2009. The increase in sales and marketing expense is primarily due to the increase of advertising and freight costs.
General and Administrative. The general and administrative expenses increased by $4,128,482 to $4,436,082 for the three months ended September 30, 2010 from $307,600 for the three months ended September 30, 2009. The increase was primarily attributable to the increase of stock-based compensation expenses in 2010. On June 29, 2010, in connection with the Earn-In Agreement, as thereafter amended, 20 management team members obtained the call rights to purchase 2,279,930 shares of our common stock and the fair value of these shares of stock was appropriately $5,968,400 at the grant date, with appropriately $2,984,200 attributable to the three months ended September 30, 2010. These employee stock-based expenses had been fully amortized in 2010. We also incurred $750,000 merger cost in the third quarter that includes $450,000 shell purchase cost and $300,000 earn-in consideration. The increase of the general and administrative expenses is also a result of payments of various professional service fees, such as legal and accounting, as a result of our becoming a public company.
Income from Operations. As a result of the foregoing, the income from operations decreased to $1,109,689 for the three months ended September 30, 2010 from $3,009,793 for the three months ended September 30, 2009, a decrease of 63.1%, due to the increase of stock-based compensation expenses and merger costs. Except for the stock-based compensation expenses and merger cost, the income from operations increased by $1,834,096, or 60.9% to $4,843,889 from $3,009,793 for the three months ended September 30, 2009.
Income Taxes. The income tax expense increased to $1,184,907 in the three months ended September 30, 2010 from $745,852 in the comparable period in 2009. The effective tax rate for our operating subsidiaries was 50.0% and 24.7% for the three months ended September 30, 2010 and 2009, respectively. The increase in the effective tax rate is primarily due to the increase of stock-based compensation expenses. The statutory rate under the laws of the PRC is 25% and the herb cultivation business is subject to zero income tax in China.
Net Income. Net income decreased by $2,343,628 to $(72,376) for the three months ended September 30, 2010 from $2,271,253 for the three months ended September 30, 2009. The profit margin decreased from 12.6% for the three months ended September 30, 2009 to (0.2) % for the three months ended September 30, 2010. The decrease of profit margin was primarily due to the stock-based compensation expenses and merger cost incurred in the third quarter in 2010, and the corporate costs incurred after the Reversed Merger. Except for the $2,984,200 stock-based compensation expenses and $750,000 merger cost, net income was $3,661,824 for the three months ended September 30, 2010, an increase of $1,390,552, or 61.2%, from the comparable period in 2009, which is consistent with the increase of sales. Net income of the herbs cultivation segment increased by $351,880, or 523.5%, to $419,097 for the three months ended September 30, 2010 from $67,217 for the comparable period last year. The significant increase is primarily attributable to the increased price of our herbs product. We anticipate that net income will continue to increase consistent with sales increase.
11
Result of Operations – For the nine months ended September 30, 2010 as compared to the nine months ended September 30, 2009
|
in USD except %
|
2010
|
2009
|
Change
|
|||||||||||||||||||||
|
% of revenue
|
% of revenue
|
Amount
|
Percentage
|
|||||||||||||||||||||
|
Revenues, net
|
$ | 90,176,505 | 100.0 | $ | 57,415,438 | 100 | $ | 32,761,067 | 57.1 | |||||||||||||||
|
Cost of goods sold
|
73,622,656 | 81.6 | 46,682,503 | 81.5 | 26,940,153 | 57.7 | ||||||||||||||||||
|
Gross profit
|
16,553,849 | 18.4 | 10,732,935 | 18.5 | 5,820,914 | 54.2 | ||||||||||||||||||
|
Operating expenses
|
725,424 | 0.8 | 448,308 | 0.9 | 277,116 | 61.8 | ||||||||||||||||||
|
General and administrative
|
6,531,617 | 7.2 | 823,457 | 1.3 | 5,708,160 | 693.2 | ||||||||||||||||||
|
Income from operations
|
9,296,808 | 10.3 | 9,461,170 | 16.3 | (164,362 | ) | (1.7 | ) | ||||||||||||||||
|
Interest income
|
21,048 | 0.0 | 21,343 | - | (295 | ) | (1.4 | ) | ||||||||||||||||
|
Miscellaneous Expense
|
- | 0.0 | (1,023 | ) | - | 1,023 | (100.0 | ) | ||||||||||||||||
|
Income before income taxes
|
9,317,856 | 10.3 | 9,481,490 | 16.3 | (163,634 | ) | (1.7 | ) | ||||||||||||||||
|
Provision for income taxes
|
3,609,764 | 4.0 | 2,365,726 | 3.7 | 1,244,038 | 52.6 | ||||||||||||||||||
|
Net income
|
$ | 5,708,092 | 6.3 | $ | 7,115,764 | 12.6 | $ | (1,407,672 | ) | (19.8 | ) | |||||||||||||
|
For the nine months ended September 30 - Revenue
|
||||||||||||||||||||||||
|
in USD except %
|
2010
|
2009
|
Change
|
|||||||||||||||||||||
|
% of revenue
|
% of revenue
|
%
|
||||||||||||||||||||||
|
Pharmaceutical products distribution
|
$ | 68,183,762 | 75.6 | $ | 43,639,470 | 76.0 | $ | 24,544,292 | 56.2 | |||||||||||||||
|
TCM processing and distribution
|
16,988,311 | 18.8 | 9,690,222 | 16.9 | 7,298,089 | 75.3 | ||||||||||||||||||
|
Herb cultivation and sales
|
1,345,969 | 1.5 | 558,701 | 1.0 | 787,268 | 140.9 | ||||||||||||||||||
|
Flower tea bags
|
3,658,463 | 4.1 | 3,527,045 | 6.1 | 131,418 | 3.7 | ||||||||||||||||||
|
Total
|
$ | 90,176,505 | 100.0 | $ | 57,415,438 | 100.0 | $ | 32,761,067 | 57.1 | |||||||||||||||
|
For the nine months ended September 30 - Net Income (Loss)
|
||||||||||||||||||||||||
|
in USD except %
|
2010
|
2009
|
Change
|
|||||||||||||||||||||
|
% of income
|
% of income
|
%
|
||||||||||||||||||||||
|
Pharmaceutical products distribution
|
$ | 8,131,687 | 72.1 | $ | 5,087,663 | 71.5 | $ | 3,044,024 | 59.8 | |||||||||||||||
|
TCM processing and distribution
|
1,988,998 | 17.6 | 1,318,787 | 18.5 | 670,211 | 50.8 | ||||||||||||||||||
|
Herb cultivation and sales
|
420,615 | 3.7 | 66,607 | 0.9 | 354,008 | 531.5 | ||||||||||||||||||
|
Flower tea bags
|
737,306 | 6.5 | 642,707 | 9.0 | 94,599 | 14.7 | ||||||||||||||||||
|
Corporate
|
(5,570,514 | ) | - | - | - | (5,570,514 | ) | - | ||||||||||||||||
|
Total
|
$ | 5,708,092 | 100.0 | $ | 7,115,764 | 100.0 | $ | (1,407,672 | ) | (19.8 | ) | |||||||||||||
Revenue. Revenue increased by $32,761,067 or 57.1% to $90,176,505 for the nine months ended September 30, 2010 from $57,415,438 for the nine months ended September 30, 2009. The contribution from the distribution segment was $24,544,292, or 74.9% of the increased total sales.
Revenue from the pharmaceutical products distribution segment was $68,183,762 for the nine months ended September 30, 2010, compared to $43,639,470 for the comparable period last year, an increase of $24,544,292 or approximately 56.2%. The increase is primarily due to the exclusive distribution right we obtained from two pharmaceutical manufacturers at the beginning of 2010 to sell over 500 different types of their products in Shandong province.
Revenue from the TCM processing and distribution segment was $16,988,311 for the nine months ended September 30, 2010, compared to $9,690,222 for the comparable period last year, an increase of $7,298,089 or approximately 75.3%. The increase is primarily due to the increase of product variety and price volatility of TCM products.
Revenue from the herb cultivation and sales segment was $1,345,969 for the nine months ended September 30, 2010, compared to $558,701 for the comparable period last year, an increase of $787,268 or approximately 140.9%. The increase is primarily attributable to two additional parcels of land that we leased, totaling 2,960 acres in 2010 to expand our herbal cultivation business, generating revenue in the third quarter of 2010.
Revenue from the flower tea segment was $3,658,462 for the nine months ended September 30, 2010 compared to $3,527,045 for the same period last year, an increase of $131,417 or approximately 3.7%. This slight increase was primarily due to the significant decline in the sale of flower tea in the third quarter in 2010 because of the competitiveness in similar types of product, the geographical limitation, general design and packaging, and insufficient marketing. We are planning to redesign the flower tea products and to restructure the flower tea segment in 2011.
Cost of Goods Sold. The cost of goods sold increased by $26,940,153 or 57.7% to $73,622,656 for the nine months ended September 30, 2010 from $46,682,503 for the comparable period in 2009 consistent with the increase of revenue.
Gross Profit. Gross profit increased by $5,820,914 or 54.2% to $16,553,849 for the nine months ended September 30, 2010 from $10,732,935 for the comparable period last year. The gross margin slightly decreased from 18.5% for the nine months ended September 30, 2009 to 18.4% for the nine months ended September 30, 2010 primarily due to price volatility of the herbal raw material .
Operating Expenses. Operating expenses increased by $277,116 to $725,424 for the nine months ended September 30, 2010 from $448,308 for the nine months ended September 30, 2009. The increase in operating expense is primarily due to the increase of advertising and freight costs.
General and Administrative. General and administrative expenses increased by $5,708,160 to $6,531,617 for the nine months ended September 30, 2010 from $823,457 for the nine months ended September 30, 2009. The increase was primarily attributable to the increase of stock-based compensation expenses and merger cost in the first three quarter in 2010. On June 29, 2010, in connection with the Earn-In Agreement, as thereafter amended, 20 management team members obtained the call right to purchase 2,279,930 shares of common stock of our company and the fair value of these stocks was appropriately $5,968,400 at the grant date, with appropriately $4,476,300 attributable to nine months ended September 30, 2010. These employee stock-based expenses had been fully amortized in 2010. We also incurred $750,000 merger cost in the third quarter that includes $450,000 shell purchase cost and $300,000 earn-in consideration. The increase of the general and administrative expenses is also a result of payments of various professional service fees, such as legal, accounting, as a result of our becoming a public company.
13
Income from Operations. As a result of the foregoing, the income from operations decreased to $9,296,808 for the nine months ended September 30, 2010 from $9,461,170 for the nine months ended September 30, 2009, a decrease of 1.7% due to the increase of revenue and offset by an increase of stock-based compensation expenses and merger costs. Except for $4,476,300 stock-based compensation expenses and $750,000 merger costs, the income from operations increased by $5,061,938, or 53.5% from $9,461,170 for the nine months ended September 30, 2009 to $14,523,108 in the comparable period in 2009.
Income Taxes. The income tax expense increased to $3,609,764 in the nine months ended September 30, 2010 from $2,365,726 in the same period in 2009 as a result of the increased revenue.
Net Income. The net income decreased by $1,407,672 to $5,708,092 for the nine months ended September 30, 2010 from $7,115,764 for the nine months ended September 30, 2009. The profit margin decreased from 12.6% for the nine months ended September 30, 2009 to 6.3% for the nine months ended September 30, 2010. The decrease of profit margin was primarily due to the stock-based compensation expenses and merger costs incurred in 2010, and the corporate costs incurred after the Reversed Merger. Except for the $$4,476,300 stock-based compensation expenses and $750,000 merger costs, the net income was $10,934,392 for the nine months ended September 30, 2010, an increase of $3,818,628, or 53.7%, from the comparable period in 2009, which is consistent with the increase of sales. The net income of the herbs cultivation segment increased by $354,008, or 531.5%, to $420,615 for the nine months ended September 30, 2010 from $66,607 for the comparable period last year. The significant increase is primarily attributable to the increased prices of our herbs products. We anticipate that our net income will continue to increase as the sales increase.
The following table sets forth a summary of the net cash flow information for the periods indicated:
| For the nine months ended September 30, | ||||||||||||||||
|
Change
|
||||||||||||||||
|
in USD except percentage
|
2010
|
2009
|
%
|
|||||||||||||
|
Net cash provided by operating activities
|
$
|
3,200,226
|
$
|
3,967,314
|
$
|
(767,088
|
)
|
(19.3
|
)
|
|||||||
|
Net cash used in investing activities
|
(22,044
|
)
|
(135,030
|
)
|
112,986
|
(83.7
|
)
|
|||||||||
|
Net cash used in provided by financing activities
|
(2,948,570
|
)
|
(1,389,437
|
)
|
(1,559,133
|
)
|
112.2
|
|||||||||
|
Net (decrease) increase in cash
|
229,612
|
2,442,847
|
(2,213,235
|
)
|
(90.6
|
)
|
||||||||||
|
Cash at the end of the period
|
$
|
7,830,291
|
$
|
7,621,727
|
$
|
208,564
|
2.7
|
|||||||||
We had net working capital of $10,035,594 at September 30, 2010, an increase of $5,357 over $10,030,237 at December 31, 2009. Cash for operations and liquidity needs are funded primarily through cash flows from operations. We believe that the funds available to us from operations are adequate to meet the operating needs in 2010. For the nine months ended September 30, 2010, cash and cash equivalent increased by $375,144 compared to December 31, 2009, which was primarily attributable to a number of factors, including the following:
14
For the nine months ended September 30, 2010, we generated $3,200,226 from operating activities, as compared to $3,967,314 for the nine months ended September 30, 2009. The decrease of $767,088 is primarily a result of increases in accounts receivable, inventory and accounts payable at the end of the nine-month period for $4,683,793, $14,211,786 and $11,135,187, respectively.
Net cash used in investing activities
We used $22,044 in investing activities during the nine months ended September 30, 2010 as compared to $135,030 during the nine months ended September 30, 2009. The decrease of $112,986 in investing activities was primarily a result of purchasing less equipment.
Net cash used in financing activities
Cash used in financing activities was $2,948,570 for the nine months ended September 30, 2010 as compared to cash used in financing activities of $1,389,437 for the nine months ended September 30, 2009. The cash used in financing activities in both periods were primarily the result of dividends paid to the former stockholders of the operating subsidiaries, consisting of $4,309,377 and $3,435,470 for the nine months ended September 30, 2010, and 2009, respectively.
Capital Resources
We entered into a note payable on December 23, 2009 with Shandong Qilu Bank. The loan amount was $223,944 and $219,751 at September 30, 2010 and December 31, 2009, respectively, and is due on December 21, 2010. The loan is bearing an interest at 7.434% annually and the interest is payable monthly.
We entered into an entrustment guarantee contract with Kexin Fengda Investment Guarantee Co, Ltd (“Kexin Fengda”) whereby Kexin Fengda guarantees the payment of the note payable in the amount of RMB 1,500,000 to Shandong Qilu bank from December 9, 2009 to December 9, 2010. Kexin Fengda received payment of approximately $6,000 in consideration for this guarantee.
Yanliang Song, the general manager of Yaoyuan, provided counter-guarantee to Kexin Fengda using all his personal/family assets. Pursuant to the counter-guarantee, the chairman will guarantee the payment of the principal, interests, penalty interests, damages and all the costs incurred by Kexin Fengda to pay back the loan in the event that the Company defaults on the loan. The counter-guarantee is valid for two years from December 9, 2010.
We entered into a note payable on March 22, 2010 with Shandong Qilu Bank. The loan amount is $223,944 at September 30, 2010 and is due on March 22, 2011. The loan is bearing an interest at 6.372% annually and the interest is payable monthly.
We entered a pledge agreement with Shandong Qilu Bank, which requested at least 6 million RMB of inventories to secure the loan. The pledge is valid from March 22, 2010 to March 22, 2011. Shandong Qilu Bank has authorized Shandong Woerde Guarantee Company to supervise the pledged inventories.
On May 7, 2010, we entered into a credit agreement with Construction Bank of China in the amount of $142,296. As part of the loan agreement, RMB 4,000,000 or $597,184 of property and land of two shareholders and Bozhou City Herb Research Institute guarantee the outstanding principal balance to the bank over the term of the loan.
15
Working Capital Requirements
Historically, operations have been sufficient to meet our cash needs. We believe that we will be able to generate revenue from operations to provide the necessary cash flow to meet anticipated working capital requirements. However, our actual working capital needs for the long and short term will depend upon numerous factors, including operating results, competition, the opportunity to acquire or start up new businesses, and the availability of credit facilities, none of which can be predicted with certainty. Due to our rapid growth and expansion, our need for additional capital may arise, and management will seek to raise capital for the maintenance and expansion of our operations through the issuance of debt or equity if necessary.
Contractual Obligations
We lease various facilities under lease agreements ranging from month-to-month to 15-year terms. The following tables set forth detailed information of the lease obligations:
16
|
No.
|
Lessor
|
Term
|
Rent (RMB)
|
Rent (US$)
|
Description
|
|||||
|
1
|
General Tobacco Group Co., Ltd.
|
July 1, 2009 – June 30, 2010
|
1,417,295 per year
|
211,597 per year
|
Used as distribution center, totaling 15,533 square meters
|
|||||
|
2
|
General Tobacco Group Co., Ltd.
|
March 1, 2010 -February 28, 2011
|
180,000 for the first year and increase at a rate of 5% per year thereafter
|
26,873 per year and increase at a rate of 5% per year thereafter
|
Used for parking, totaling 156,020 square meters
|
|||||
|
3
|
General Trading Co., Ltd.
|
March 1, 2010-March 28, 2011
|
30,000 for the first year and increase at a rate of 5% per year thereafter
|
4,479 for the first year and increase at a rate of 5% per year thereafter
|
Used as offices, totaling 1,160.46 square meters
|
|||||
|
4
|
General Tobacco Group Co., Ltd.
|
July 1, 2010 -June 30, 2011
|
1,335,334 per year
|
199,360 per year
|
Used as distribution center, totaling 13,937 square meters
|
|||||
|
5
|
General Tobacco Group Co., Ltd.
|
July 1, 2010 -June 30, 2011
|
390,898 per year
|
58,360 per year
|
Used as warehouse, totaling 2,677 square meters
|
|||||
|
6
|
Shujun Xu
|
November 1, 2006-October 31, 2011,
|
360,000 for the first year;
420,000 for the second year;
480,000 for the third year;
540,000 for the fourth year;
600,000 for the fifth year.
|
53,747 for the first year;
62,704 for the second year;
71,662for the third year;
80,620 for the fourth year;
89,578 for the fifth year.
|
Used as distribution center, totaling 2,449 square meters
|
|||||
|
7
|
Xiuying Hou
|
December 1, 2010-December 1, 2013
|
64,800 every year
|
9,674 every year
|
Used as distribution center, totaling 300 square meters
|
|||||
|
8
|
Anhui Province Bozhou City Fengyi Institute of Traditional Chinese Medicine
|
August 1 2008 –July 31, 2023 renewable annually
|
1,200,000 per year
|
179,155 per year
|
Used as warehouse, totaling 3,000 square meters
|
|||||
|
9
|
Mengwang Village Committee of Dayang County, Qiaocheng District, Bozhou City, Anhui Province, PRC
|
January 1, 2010-December 31, 2014 renewable annually
|
14,970,000 for 2010, 8,800,000 per year thereafter.
|
2,234,962 for 2010, 1,313,805 per year thereafter.
|
Used for herbal cultivation, totaling 1,318 acres
|
|||||
|
10
|
Mengwang Village Committee of Dayang County, Qiaocheng District, Bozhou City, Anhui Province, PRC
|
July 1, 2010 - December 31, 2015 renewable annually
|
31,450,367 for 2010, 16,939,939 for 2011, 10,468,500 per year thereafter.
|
4,695,416 for 2010, 2,529,066 for 2011, 1,562,906 per year thereafter
|
Used for herbal cultivation, totaling 1,642 acres.
|
|||||
|
11
|
25/F New World Center, 6009 Yitian Road, Futian District, Shenzhen, PRC
|
Dec 1, 2009 - Nov 30, 2012
|
606,000 per year
|
90,473 per year
|
Used as office
|
17
Off-Balance Sheet Arrangements
We do not have any off balance sheet arrangements that have or are reasonably likely to have a current or future effect on our financial condition, changes in financial condition, revenues or expenses, results of operations, liquidity or capital expenditures or capital resources that is material to an investor in our securities.
Item 3. Quantitative and Qualitative Disclosures About Market Risk.
Item 4. Controls and Procedures.
Disclosure Controls and Procedures
During and subsequent to the reporting period covered by this report, and under the supervision and with the participation of our management, including our principal executive officer and our principal financial officer, we conducted an evaluation of our disclosure controls and procedures that were in effect at the end of the period covered by this report. Disclosure controls and procedures is defined under Rule 13a-15(e) and Rule 15d-15(e) of the Securities Exchange Act of 1934, as amended (the “Exchange Act”), as those controls and other procedures of an issuer that are designed to ensure that information required to be disclosed by an issuer in the reports that it files or submits under the Exchange Act is recorded, processed, summarized and reported within the time periods specified in the rules and forms of the Securities and Exchange Commission. Disclosure controls and procedures include, without limitation, controls and procedures designed to ensure that information required to be disclosed by an issuer in the reports that it files or submits under the Exchange Act is accumulated and communicated to the issuer's management, including its principal executive officer and principal financial officer, as appropriate, to allow timely decisions regarding required disclosure. Based on their evaluation and as discussed below, our principal executive officer and principal financial officer have concluded that our disclosure controls and procedures that were in effect on September 30, 2010 were not effective.
As of September 30, 2010, the following material weakness in our internal control over financial reporting has been identified:
|
l
|
The Company did not have appropriate policies and procedures in place to identify and give disclosures relating to the basis for applying the reverse acquisition accounting to the Company’s acquisitions of three PRC operating subsidiaries pursuant to an Earn-In Agreement, as thereafter amended, and to properly accrue for dividends declared by the PRC operating company prior to the Earn-In Agreement. Therefore, the Company was not able to effectively identify all necessary and appropriate disclosures and to effectively capture all financial data for the purposes of preparing its financial statements in accordance with U.S. GAAP.
|
Management’s Remediation Initiatives
In response to the above-identified material weakness and to strengthen our internal control over financial reporting, we have taken the following remediation initiatives:
18
We formed an Audit Committee in February 2011, chaired by an accounting expert with adequate knowledge and experience in U.S. GAAP and SEC reporting requirements, to advise the management on matters relating to our internal control over financial reporting. Going forward, in order to address any material weaknesses in our internal controls over financial reporting, we plan to make the following necessary changes and improvements:
|
l
|
restructure our relationships with related parties to address our controls over related party transactions;
|
|
l
|
recruit accounting resources to fulfill U.S. GAAP reporting requirements;
|
|
l
|
provide training to our finance team and other relevant personnel of the Company on the U.S. GAAP accounting guidance applicable to the Company’s financial statements; and
|
|
l
|
engage a third-party financial consulting firm to assist management in evaluating complex accounting issues on an as-needed basis, to ensure proper disclosure and reporting in a timely manner.
|
In addition, the Company continues to reassess its internal controls and procedures on an ongoing basis.
Changes in internal control over financial reporting
Other than the remediation measures described above, there was no change in our internal control over financial reporting during the period ended September 30, 2010 that has materially affected, or is reasonably likely to materially affect, our internal control over financial reporting
PART II - OTHER INFORMATION
Item 1. Legal Proceedings.
Item 1A. Risk Factors
There have not been any material changes to the Company’s risk factors from Amendment No. 2 to our Current Report on Form 8-K/A filed with the SEC on April 13, 2011.
Item 2. Unregistered Sales of Equity Securities and Use of Proceeds
None.
Item 3. Defaults Upon Senior Securities
None.
Item 4. (Removed and Reserved).
Item 5. Other Information
Not applicable.
19
Item 6. Exhibits
Copies of the following documents are included as exhibits to this report pursuant to Item 601 of Regulation S-K.
|
Exhibit No.
|
SEC Ref. No.
|
Title of Document
|
||
|
1
|
31.1
|
Certification of the Principal Executive Officer pursuant to Section 302 of the Sarbanes-Oxley Act of 2002 *
|
||
|
2.
|
31.2
|
Certification of the Principal Financial Officer pursuant to Section 302 of the Sarbanes-Oxley Act of 2002 *
|
||
|
3
|
32.1
|
Certification of the Principal Executive Officer pursuant to U.S.C. Section 1350 as adopted pursuant to Section 906 of the Sarbanes-Oxley Act of 2002*
|
||
|
4
|
32.2
|
Certification of the Principal Financial Officer pursuant to U.S.C. Section 1350 as adopted pursuant to Section 906 of the Sarbanes-Oxley Act of 2002*
|
* The Exhibits attached to this Form 10-Q/A shall not be deemed "filed" for purposes of Section 18 of the Securities Exchange Act of 1934 (the "Exchange Act") or otherwise subject to liability under that section, nor shall it be deemed incorporated by reference in any filing under the Securities Act of 1933, as amended, or the Exchange Act, except as expressly set forth by specific reference in such filing.
20
SIGNATURES
In accordance with the Exchange Act, the registrant caused this report to be signed on its behalf by the undersigned thereunto duly authorized.
|
GLOBAL PHARM HOLDINGS GROUP,
INC.
|
|||
|
Date: April 13, 2011
|
/s/ Yunlu Yin
|
||
|
Yunlu Yin
Chief Executive Officer and President
(Principal Executive Officer)
|
|||
|
Date: April 13, 2011
|
/s/ An Fu
|
||
|
An Fu
Chief Financial Officer
(Principal Financial Officer)
|
|||
21